Embed Size (px)
Citation preview
School Facilities Construction CommissionProject Overview
Facilities Inventory and Classification System (KFICS)
Student Achievement through High Performance SchoolsOctober 2011
KFICS Classification Tools – By Cost or Investment
2
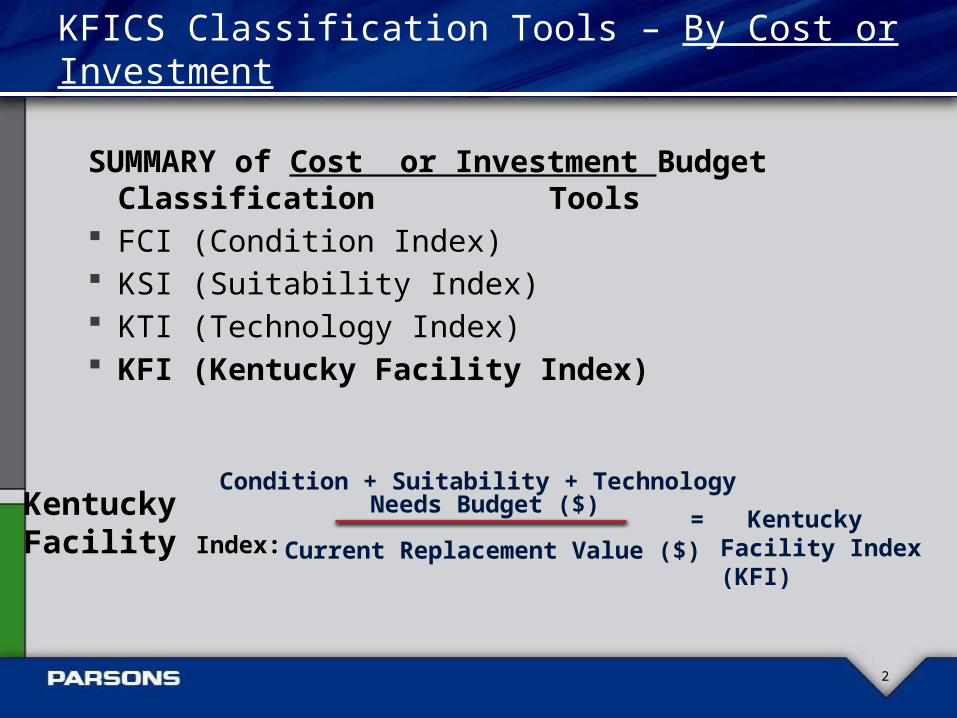
Condition + Suitability + Technology Needs Budget ($)
= Kentucky Facility Index (KFI)
Kentucky Facility Index: Current Replacement Value ($)
SUMMARY of Cost or Investment Budget Classification Tools
FCI (Condition Index) KSI (Suitability Index) KTI (Technology Index) KFI (Kentucky Facility Index)
KFICS Benchmark Metrics – Condition FCI
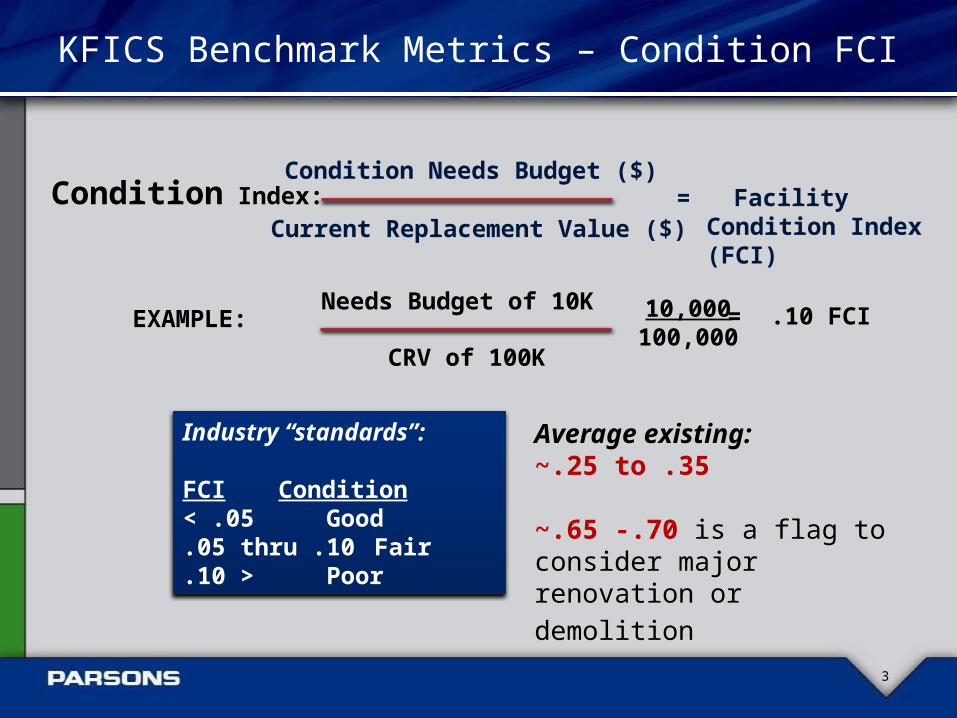
Industry “standards”:
FCI Condition< .05 Good.05 thru .10 Fair.10 > Poor
Needs Budget of 10K
CRV of 100K
10,000100,000
= .10 FCIEXAMPLE:
Condition Needs Budget ($)= Facility Condition
Index (FCI)Condition Index:
Current Replacement Value ($)
Average existing:~.25 to .35
~.65 -.70 is a flag to consider
major renovation or demolition
3
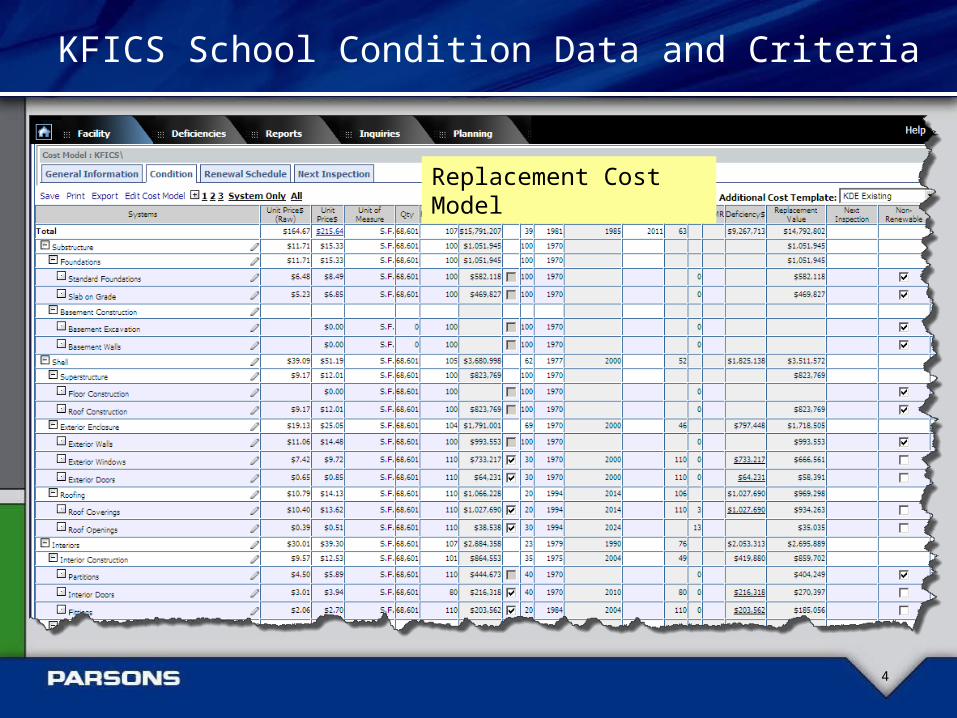
KFICS School Condition Data and Criteria
4
Replacement Cost Model
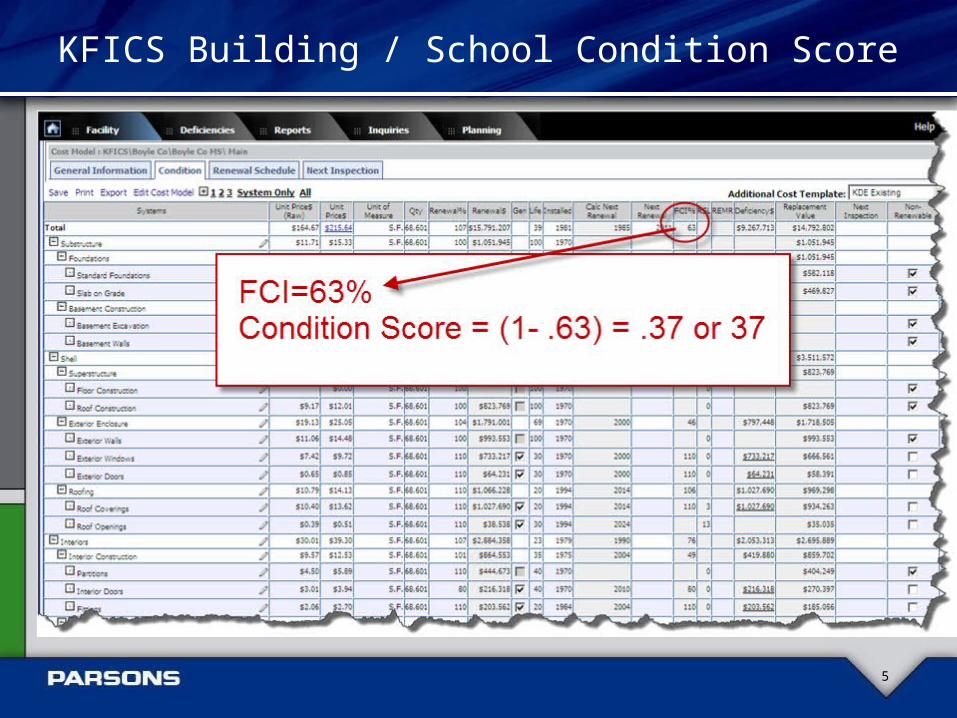
KFICS Building / School Condition Score
5
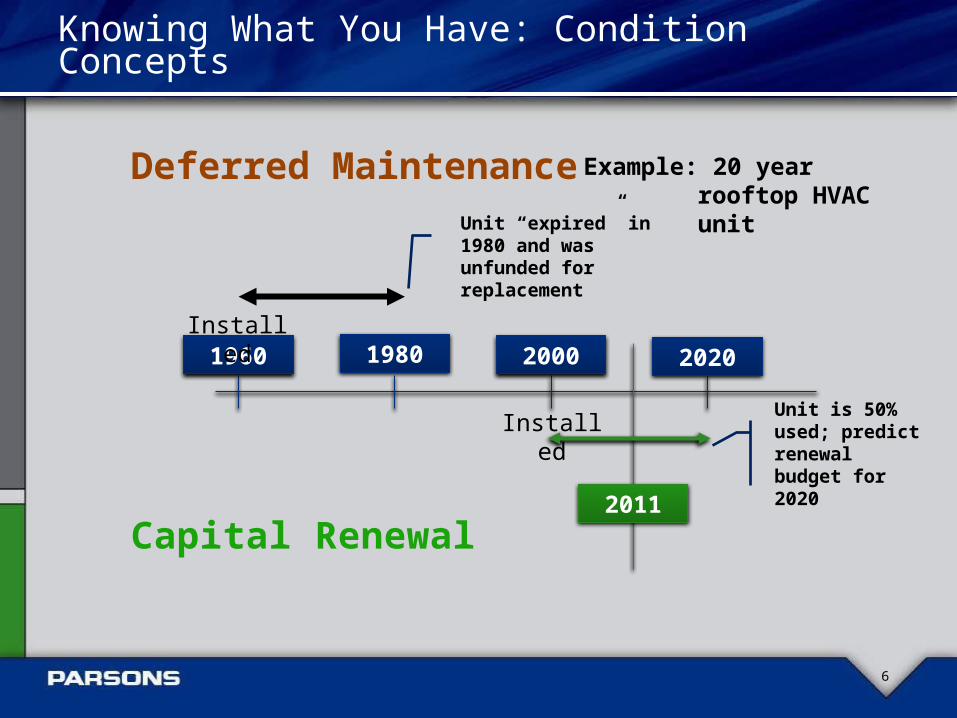
Knowing What You Have: Condition Concepts
6
1960 1980 2000 2020
Deferred Maintenance Example: 20 year rooftop HVAC unit
2011
Capital Renewal
Installed
Installed
Unit “expired” in 1980 and was unfunded for replacement
Unit is 50% used; predict renewal budget for 2020
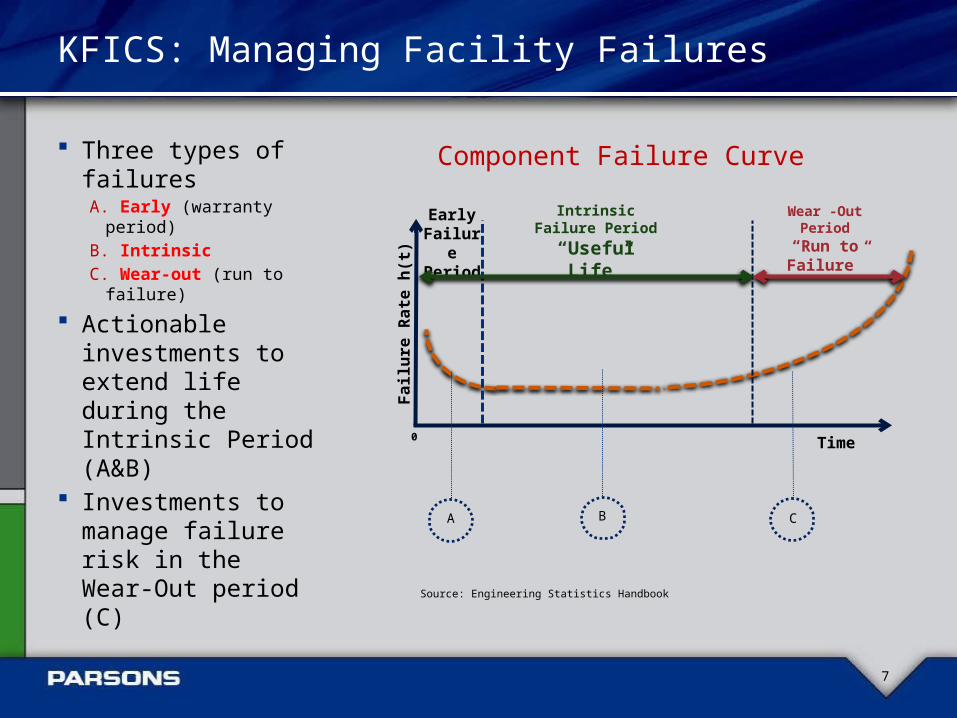
KFICS: Managing Facility Failures
Three types of failuresA. Early (warranty
period)
B. Intrinsic
C. Wear-out (run to failure)
Actionable investments to extend life during the Intrinsic Period (A&B)
Investments to manage failure risk in the Wear-Out period (C)
7
Early Failure Period
Intrinsic Failure Period
“Useful Life”
Wear -Out Period
“Run to Failure”
0 Time
Fa
ilu
re R
ate
h(t
)
Component Failure Curve
A B C
Source: Engineering Statistics Handbook
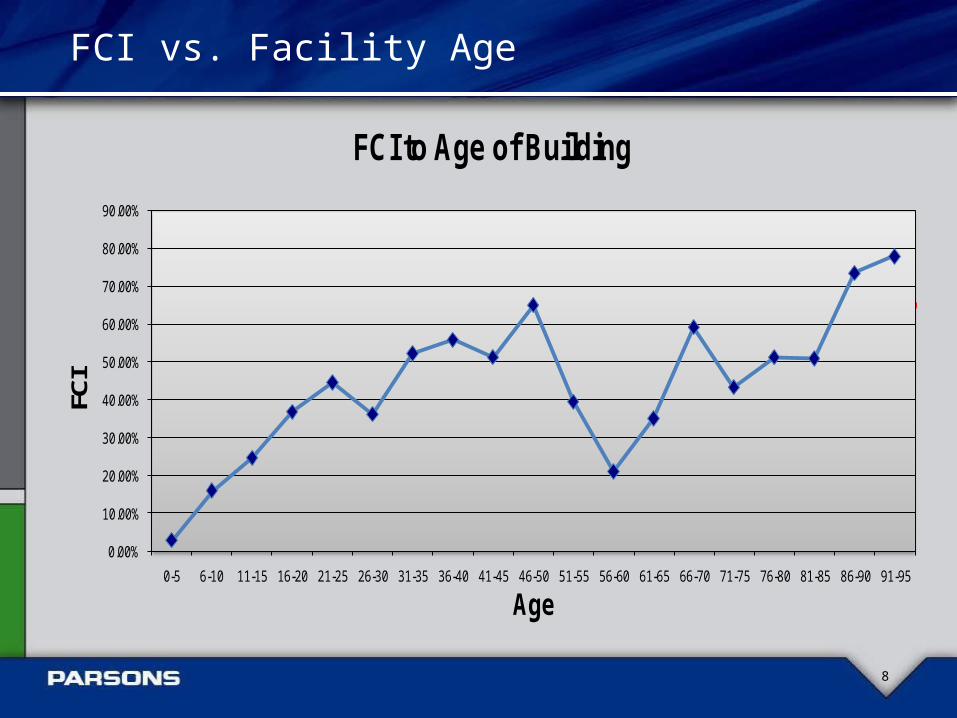
FCI vs. Facility Age
8
0.00%
10.00%
20.00%
30.00%
40.00%
50.00%
60.00%
70.00%
80.00%
90.00%
0-5 6-10 11-15 16-20 21-25 26-30 31-35 36-40 41-45 46-50 51-55 56-60 61-65 66-70 71-75 76-80 81-85 86-90 91-95
FCI
Age
FCI to Age of Building
65%
60% (Total Renovation)
30% (roof, HVAC)
KDE Renovation Points
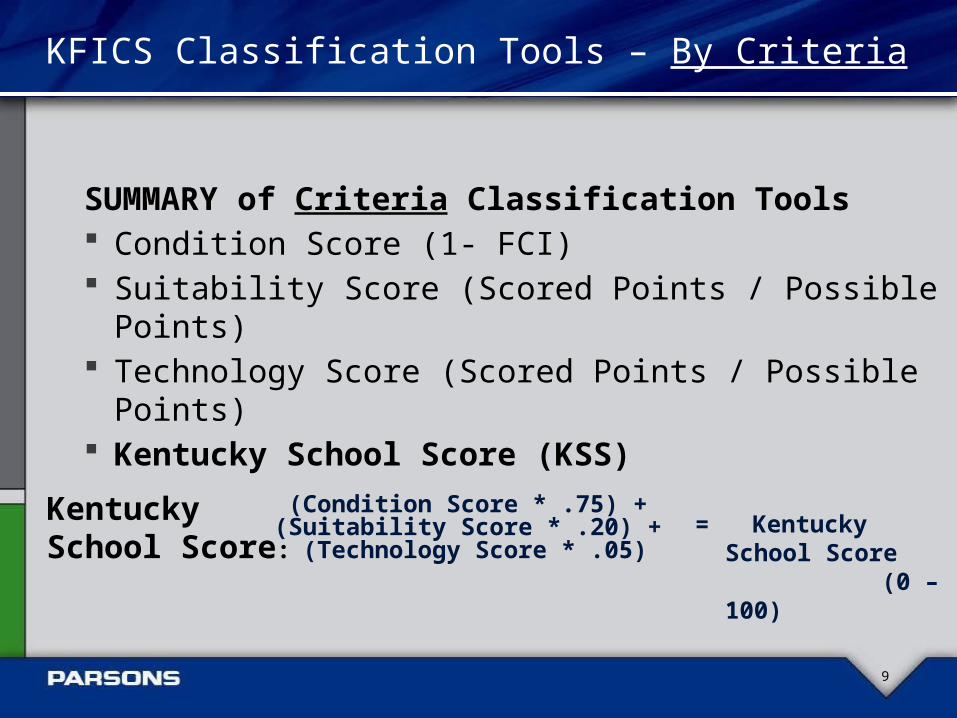
SUMMARY of Criteria Classification Tools Condition Score (1- FCI) Suitability Score (Scored Points / Possible Points) Technology Score (Scored Points / Possible Points) Kentucky School Score (KSS)
9
KFICS Classification Tools – By Criteria
(Condition Score * .75) + (Suitability Score * .20) + (Technology Score * .05)
= Kentucky School Score
(0 – 100)
Kentucky School Score:
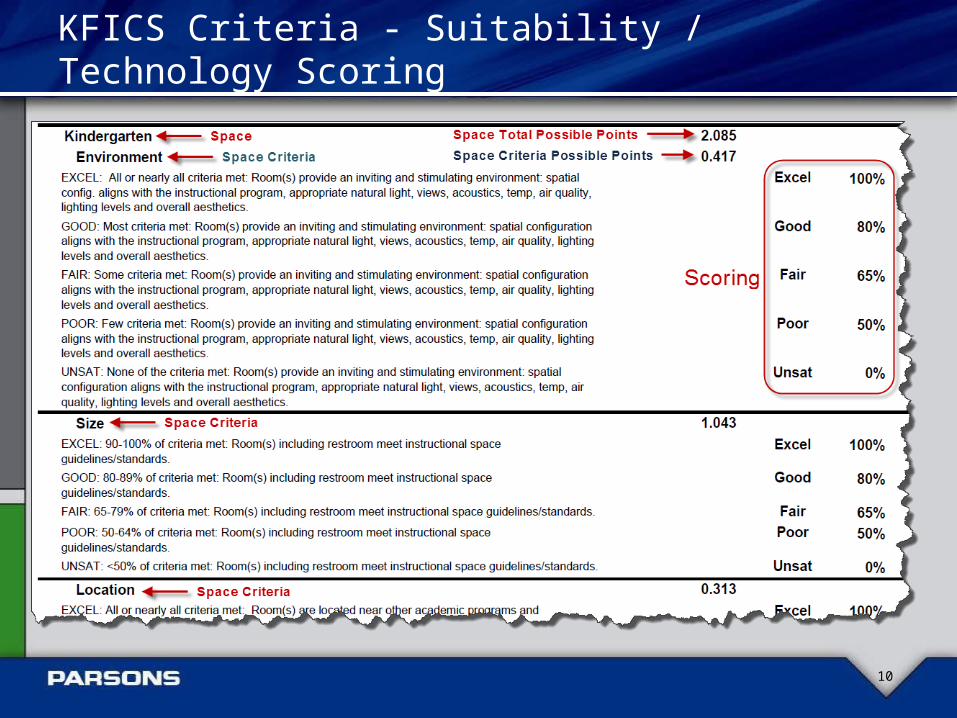
KFICS Criteria - Suitability / Technology Scoring
10
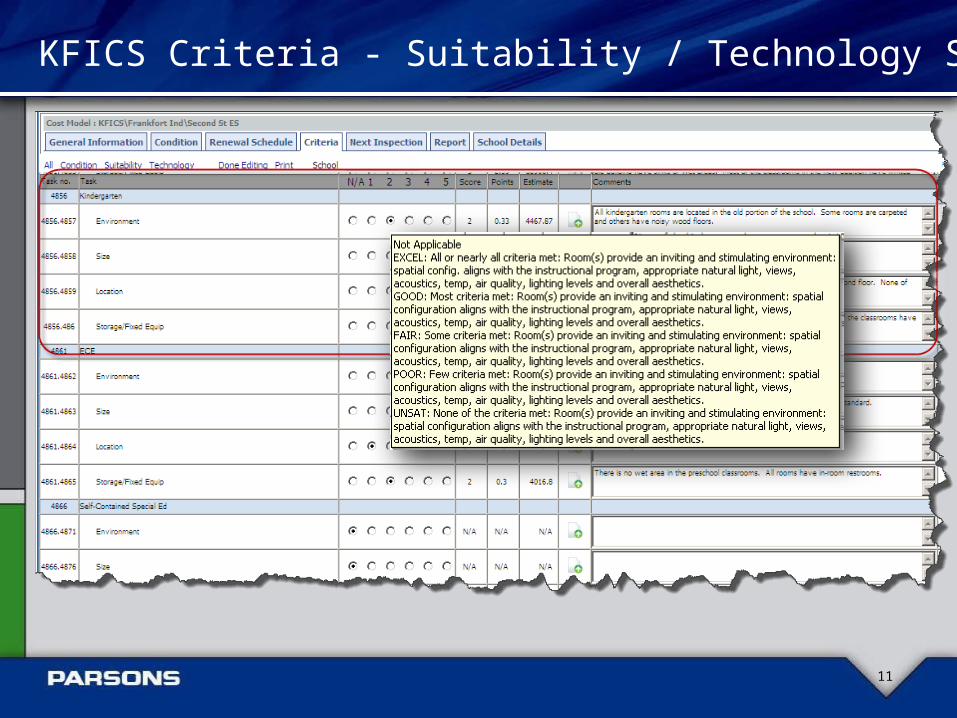
11
KFICS Criteria - Suitability / Technology Scoring
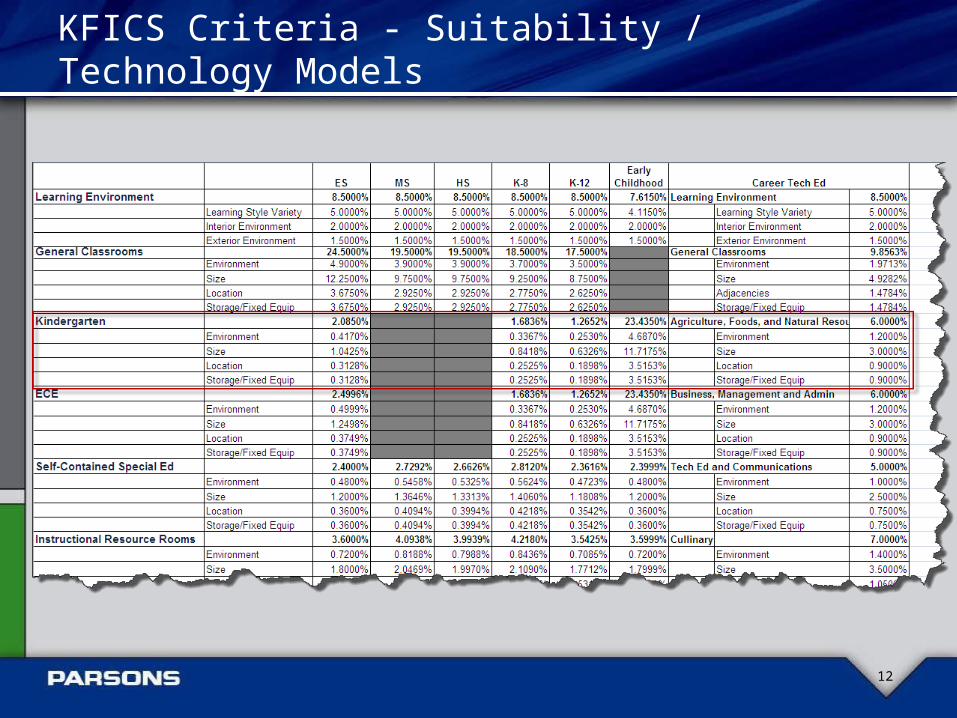
KFICS Criteria - Suitability / Technology Models
12
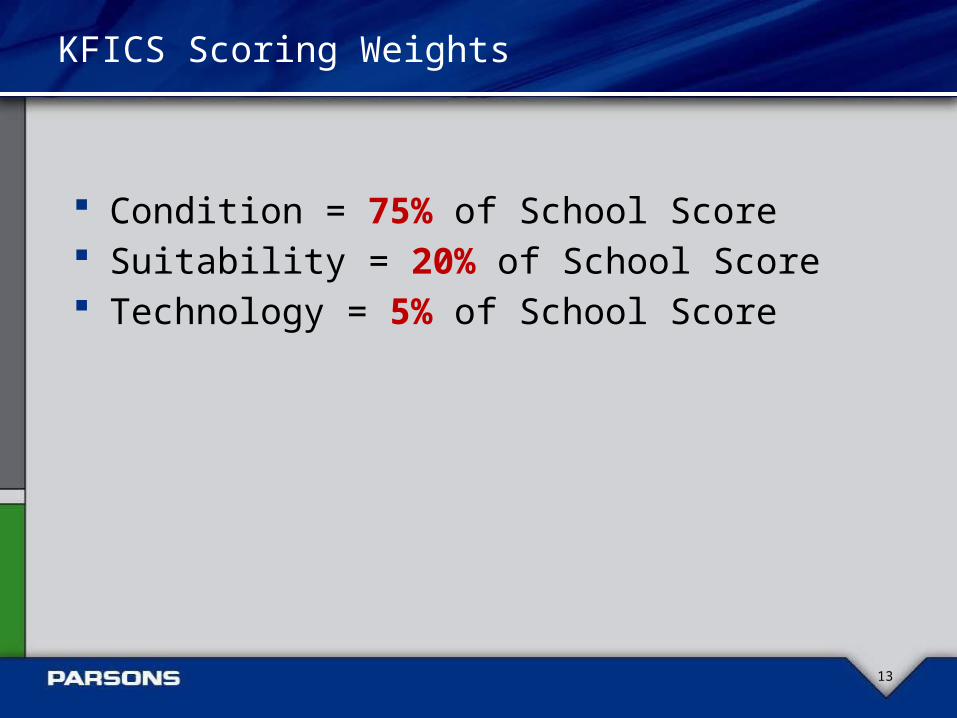
KFICS Scoring Weights
Condition = 75% of School Score Suitability = 20% of School Score Technology = 5% of School Score
13
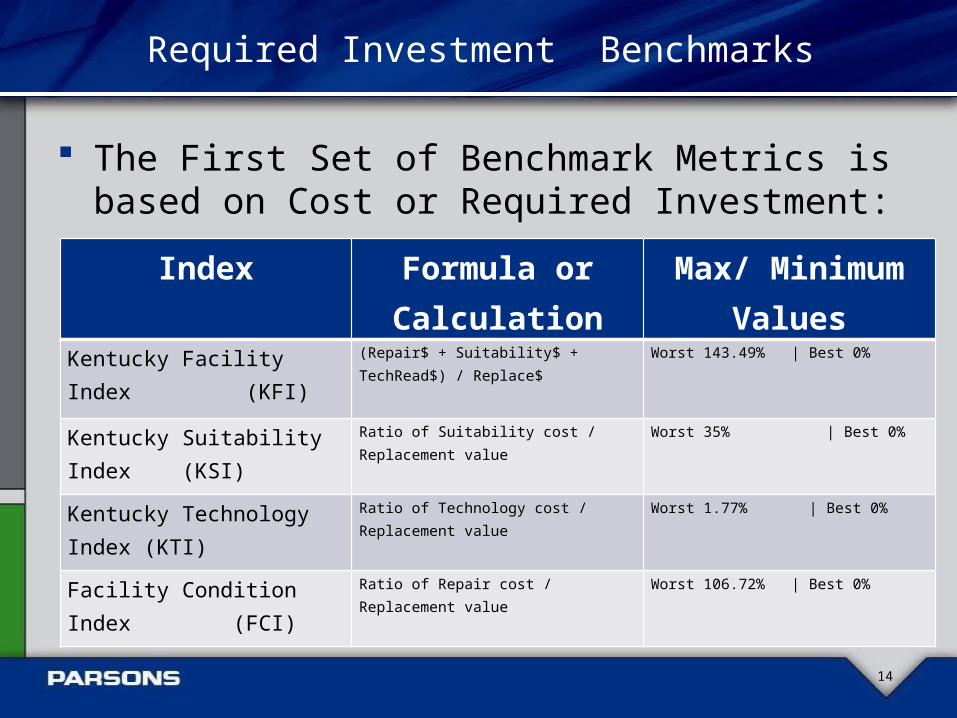
Required Investment Benchmarks
The First Set of Benchmark Metrics is based on Cost or Required Investment:
14
Index Formula or Calculation
Max/ Minimum Values
Kentucky Facility Index (KFI)
(Repair$ + Suitability$ + TechRead$) / Replace$
Worst 143.49% | Best 0%
Kentucky Suitability Index (KSI)
Ratio of Suitability cost / Replacement value Worst 35% | Best 0%
Kentucky Technology Index (KTI) Ratio of Technology cost / Replacement value Worst 1.77% | Best 0%
Facility Condition Index (FCI)
Ratio of Repair cost / Replacement value Worst 106.72% | Best 0%
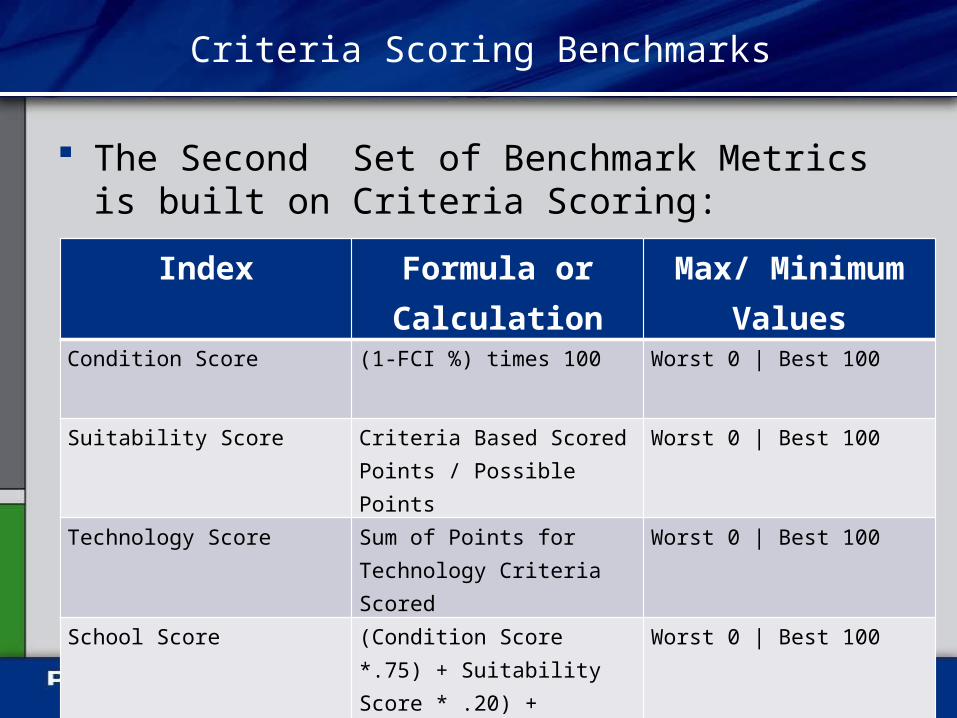
Criteria Scoring Benchmarks
The Second Set of Benchmark Metrics is built on Criteria Scoring:
15
Index Formula or Calculation
Max/ Minimum Values
Condition Score (1-FCI %) times 100 Worst 0 | Best 100
Suitability Score Criteria Based Scored Points / Possible Points
Worst 0 | Best 100
Technology Score Sum of Points for Technology Criteria Scored
Worst 0 | Best 100
School Score (Condition Score *.75) + Suitability Score * .20) + (Technology Score * .05)
Worst 0 | Best 100
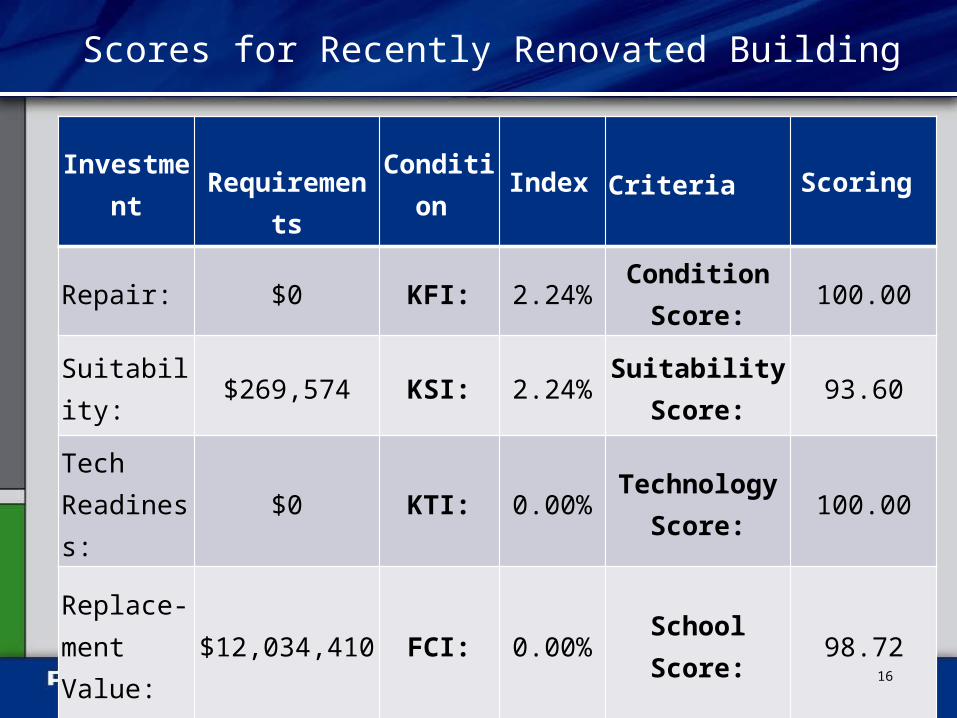
Scores for Recently Renovated Building
Investment Requirements Condition Index Criteria Scoring
Repair: $0 KFI: 2.24% Condition Score: 100.00
Suitability: $269,574 KSI: 2.24% Suitability Score: 93.60
Tech Readiness: $0 KTI: 0.00% Technology
Score: 100.00
Replace-ment Value: $12,034,410 FCI: 0.00% School Score: 98.72
16
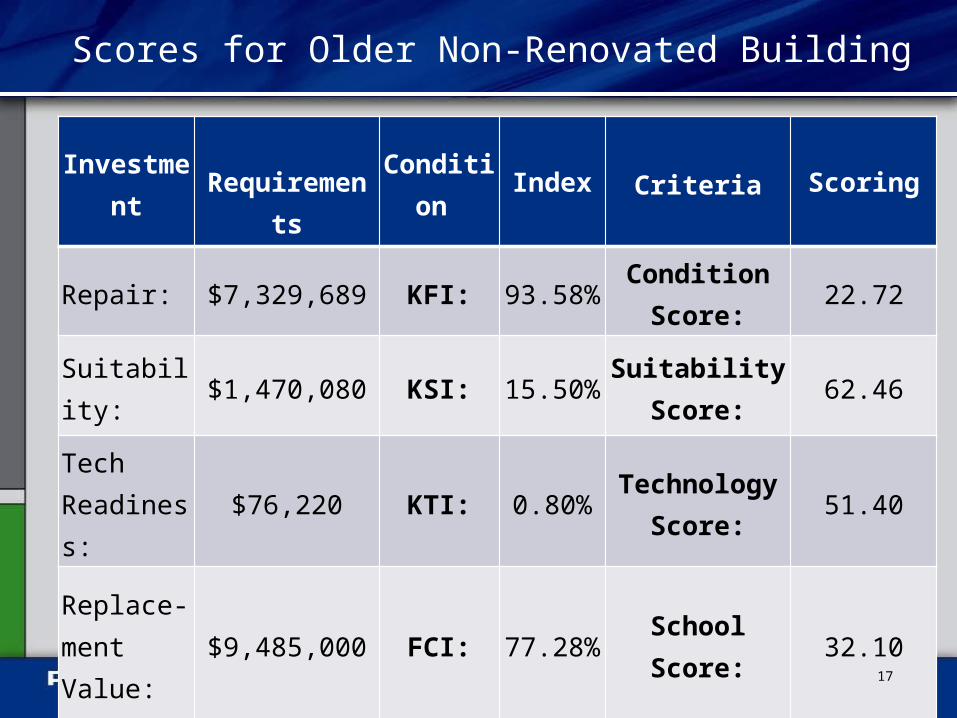
Scores for Older Non-Renovated Building
Investment Requirements Condition Index Criteria Scoring
Repair: $7,329,689 KFI: 93.58% Condition Score: 22.72
Suitability: $1,470,080 KSI: 15.50% Suitability Score: 62.46
Tech Readiness: $76,220 KTI: 0.80% Technology
Score: 51.40
Replace-ment Value: $9,485,000 FCI: 77.28% School Score: 32.10
17
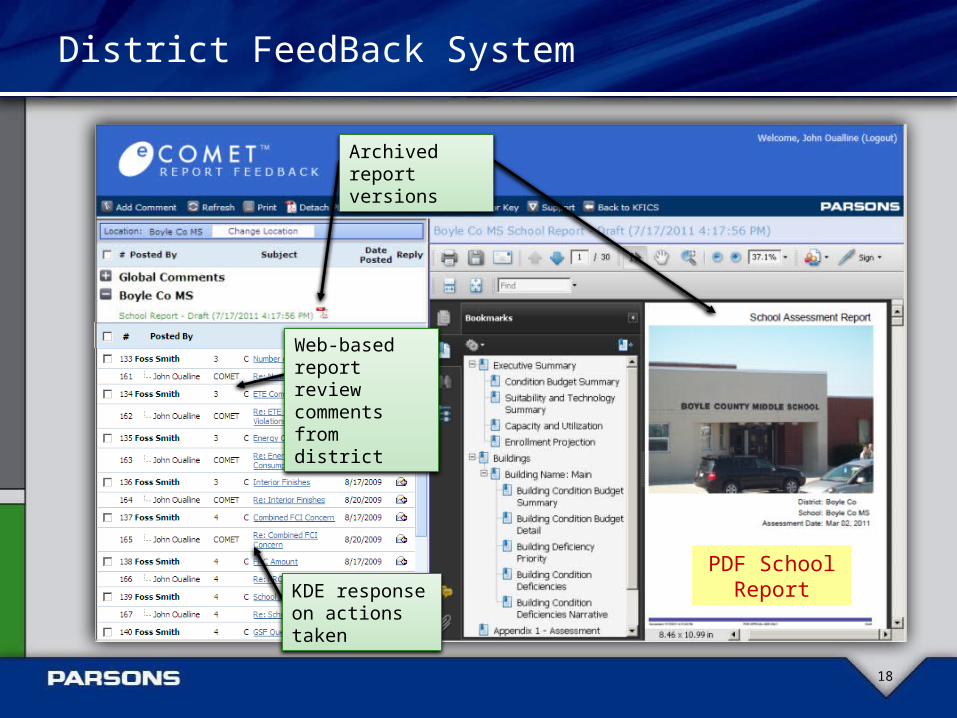
District FeedBack System
18
Archived report versions
Web-based report review comments from district
KDE response on actions taken
PDF School Report