Embed Size (px)
Citation preview

School District of Philadelphia Office of Evaluation, Research and Accountability
Tonya E. Wolford, Chief
Keren Zuniga McDowellDirector, District Performance Office
Joy LesnickDirector, Office of Research and Evaluation
Summary Prepared for the School Reform Commission
April 17, 2017
Updates on Major Projects Summary of Data Requests External Research Projects Recent Study Summaries
April 2017

Contents
Updates on Major Projects……………………………………………………………………………….....…………...2 1. Early Literacy2. School Climate3. College and Career Readiness4. Nutrition5. Other Academic6. School Improvement7. Surveys8. Accountability Frameworks9. External Research10. Data Dissemination and Data Requests
Data Requests Submitted July 2015-March 2017 ………………………..……………….………….....….18
External Research Proposals Approved July 2016- March 2017……………………….…….………..33
Recent Study Summaries…..………………………………………………………………………….……..…….…...39
Ongoing External Research Projects as of March 2017..............……………………….…….………..36

2
Updates on Major Projects 1. EARLY LITERACY
1.1. Early Literacy Specialist (ELS) Coaches The literacy coaching initiative is part of a district-wide plan to provide high-quality literacy instruction to all students. ELS coaches support students by promoting and supporting the implementation of research-based teaching practices for literacy; improving teacher content knowledge, instructional practices, classroom environments and classroom structure; and providing content- focused coaching and resources.
During the 2014-2015 school year, 43 elementary schools received support from literacy coaches. In fall 2015, 15 additional schools received coaches for a total of 58 schools, serving 14,000 students during the 2015-2016 SY (40 of the 58 ELS coaches were supported by a William Penn Foundation grant). During the 2016-2017 SY, a total of 93 schools, serving 23,000 students, are receiving support from an ELS coach.
ORE examined 2015-2016 student performance at schools with ELS coaches using AIMSweb assessments: Letter Name Fluency (LNF), Nonsense Word Fluency (NWF), and Reading Curriculum Based Measurement (R-CBM). Findings include:
● On average, students attending schools with an ELS showed improvement fromfall-winter to winter-spring AIMSweb testing in the number of words, letters, orsounds correctly identified.
● Kindergarten and third grade students at schools with ELS coaches showed thegreatest improvement during the 2015-2016 school year (as compared to firstand second grade students)
● The percent of first and second grade students requiring Tier 2 and Tier 3intervention increased during each benchmarking period. This trend was alsopresent in non-ELS schools.
In addition, ORE conducted a teacher survey in winter of 2016 and focus groups with 24 teachers at five schools in Spring of 2016. Selected findings include:
● Teachers and ELS coaches reported feeling satisfied with the early literacyinitiative as a whole.
● Teachers and ELS coaches indicated they felt well-trained to provide literacysupport in the way of classroom preparation, instructional modeling,observations and feedback, and formal professional development opportunities.
● Teachers consistently reported that the modeling of guided reading and one-on- one conferencing was the most useful supported provided by the ELS.
● As a result of ELS support, teachers described an increase in their confidencewith literacy instruction and a more positive view of their own abilities. Somealso reported increased job satisfaction and an increased interest in staying attheir current school, which may have implications for teacher retention.

3
● Teachers reported that ELSs provided helpful support for: implementing newcurricula, bridging the many programmatic requirements, and modifyingimplementation and instructional practices based on specific classroomchallenges.
1.2. Summer Literacy Institute The Summer Literacy Institute is a five-day quality professional development (PD) on early literacy-related topics aimed at improving early literacy teaching practices and student outcomes. In the summer of 2015, 695 principals and teachers from 45 schools serving over 10,000 students participated. In the summer of 2016, literacy training was provided to 580 principals and teachers of 53 elementary schools, serving over 13,000 students. Overall, Early Literacy Knowledge Survey results suggest that the Institute was effective in increasing participants’ knowledge around fundamental early literacy concepts and instructional practices. On a scale asking participants to rate their feelings on the usefulness and effectiveness of sessions, materials, and facilitators, all 14 sessions were rated above 3.76 out of 5.00. For 24 of the 25 items, the percentages of participants answering correctly increased between pre- and post- assessment. Further, the items that scored high at pre-assessment remained high at post- assessment. Additionally, survey ratings support that participants felt generally satisfied with and appreciative of this professional learning opportunity.
1.3. Innovative Approaches to Literacy (IAL) Building Bridges with Books Using a three-pronged approach, the IAL program seeks to: (1) improve curriculum and instruction for students; (2) re-envision student learning environments; and (3) train and meaningfully engage parents and caregivers in the improvement of their children’s literacy skills. Approximately 1,650 second and third grade students (Grant #1) and 1,746 Kindergarten and first grade students (Grant #2) across 10 SDP elementary schools participated in the IAL Building Bridges with Books Program (funded by the U.S. Department of Education). Last year, first and second grade IAL students (Grant #1) borrowed nearly 10,000 books from the IAL libraries and students logged over 350,000 book views using the online TumbleBook software. This year, between October 2016 and January 2017, IAL students completed nearly 500,000 book views through the Tumblebooks software. All Kindergarten students received new library cards in January 2017 as part of a city-wide initiative, including the IAL participating students. The 2017 circulation data from these library cards will be forthcoming. Quantitative findings are forthcoming.
1.4. Reading Specialists Reading Specialists are teachers who provide additional support to K-3 students who are significantly below their expected reading level. Reading Specialists work with their students at least weekly in small groups using specially designed lesson plans that use best practices to scaffold student learning in order to address deficiencies in reading,

4
writing, phonics, and word study. During the 2015-16 SY, Reading Specialists served 864 students at 16 schools. Nearly all of the 534 students with pre and post DRA2 scores demonstrated positive growth from the beginning to the end of the year. Fifty-four percent of students made approximately one year’s growth on the DRA2 and positive results were most evident for third grade students. The positive results in student performance were also apparent in AIMSweb across most grade levels. Across all AIMSweb assessments, excluding the first grade R-CBM, there was a decrease in the percentage of students requiring Tier 3 intervention.
1.5. Integrated Literacy Model (ILM) The AIM Integrated Literacy Model program provides services to 448 students in grades K-2 at Jackson and Ziegler elementary schools. Findings were most promising amongKindergarten students. The national percentile rank improved among Kindergartenstudents who were assessed on AIMSweb subtests LNF (from 49% to 56%) and LSF(from 49% to 59%). For first grade students who were assessed on NWF, the nationalpercentile rank also improved by 22 percentage points (from 40% to 62%).
1.6. Station Installation The School District of Philadelphia received a grant from the William Penn Foundation to redesign 32 pre-Kindergarten to second grade classrooms into interactive, station- based, learning environments by the end of summer 2017. Teachers will receive training on the new equipment and will have access to sample units and lesson plans for using stations in the 2017-2018 school year. ORE is evaluating the initiative, focusing on assessing changes in the classroom experiences for students in the treatment schools versus students in comparison schools.
2. SCHOOL CLIMATE
2.1. Positive Behavioral Interventions and Supports (PBIS) and Restorative Practices PBIS is a school-level framework that promotes a culture of proactive discipline, rather than reactive and punitive. Thirty schools were engaged in school-wide implementation of PBIS through 2015-2016, with 20 more schools to be added through the 2017-2018 school year. On key performance indicators, 23 of the 30 schools experienced increases in attendance in 2015-2016, and 14 showed declines in suspensions.
Restorative Practices (RP) is another progressive disciplinary framework. Through 2015- 2016, 14 schools (primarily high schools) had received grant-funded coaching support to implement RP. From the baseline year of 2013-2014, 13 of the 14 schools showed gains in the number of students attending at least 95% of instructional days. Suspension outcomes were less encouraging, with 9 of 14 schools showing increases in suspension rates.

5
2.2. Second Step In the 2015-2016 SY, nine schools with a total of 5,283 students participated in Cohort 1 of the Second Step program. ORE conducted a baseline process evaluation to determine the fidelity of implementation throughout schools. Out of the nine schools in Cohort 1, Clara Barton has the highest level of implementation fidelity, the highest percentage of teachers that were verified as having delivered Second Step (95%), and the highest percentage of students verified as having received programming (95%). At Peirce, results consistently show that lessons were taught in order and over 75% of lesson sections were completed. Responses to the Implementation Surveys for Farrell and Houston indicate that teachers understood the roles and goals of the program, were committed to helping students achieve the goals of the program, and understood the tasks for which they were responsible. ORE continues to monitor implementation for the 2016-17 School Year, and a final report is expected in June 2017.
2.3. Education for Children and Youth Experiencing Homelessness In the 2015-2016 school year, the ECYEH program that works to identify and assist homeless children and youth in the District identified 107 “unaccompanied” youth in Philadelphia, which is 32 more than were identified in the 2014-2015 school year. (Unaccompanied youth are defined as youth “not in the physical custody of a parent/guardian”). New efforts have been made to identify homeless students at charter schools. A total of 686 charter school students were identified as homeless in the 2015-2016 school year, an increase of 100 charter school students identified from the 2014-2015 school year. Survey respondents generally rated the services provided by the ECYEH office very highly. All respondents to the satisfaction survey stated that they were satisfied or very satisfied with the services they received from the ECYEH office, and of these, 94% said they were very satisfied.
2.4. Project ARREST In spring 2016, 23 principals and 21 lead health education teachers from ARREST priority schools containing at least one of grades 6 through 12 completed the School Health Profiles questionnaires, which are administered every two years and assess school health policies and practices. The eight key performance measures are categorized by Exemplary Sexual Health Education, Sexual Health Services, and Safe and Supportive Environments. Results for these measures showed that:
● 83.9% of schools taught 11 key HIV, STD, and pregnancy prevention topics in arequired course during grades 6, 7, or 8 and during grades 9, 10, 11, or 12.
● 67.6% of schools assessed the ability of students to do 7 skills in a requiredcourse taught during grades 6, 7, or 8 and during grades 9, 10, 11, or 12.
● 84.5% of schools provided key materials for teaching sexual health education tothose who teach it.
● 45.8% of schools provided students with on-site services or referrals tohealthcare providers for 7 key sexual health services.

6
● 30.6% of schools implemented parent engagement strategies for all students.● 72.9% of schools implemented school connectedness strategies.● 23.8% of schools implemented strategies to prevent bullying and sexual
harassment, including electronic aggression, among all students.● 42.4% of schools implemented HIV, other STD, and pregnancy prevention
strategies that meet the needs of LGBTQ youth.
2.5. Code of student conduct In 2012, changes were made to the code of conduct that were intended, in part, to reduce the number of suspensions issued in the District. All suspensions from SY 2013- 2014 through SY 2015-2016 were analyzed for overall trends, and for disproportionality based on demographic factors.
During the last 3 years, the total number of student suspensions has decreased from 33,072 total suspensions in 2013-2014 to 29,787 in 2015-2016. During that same period, the number of suspensions that were out-of-school has declined slowly, while in-school suspensions have decreased very rapidly, comprising only 3% of all suspensions by 2015-2016.
Consistent with findings in other districts, African American students were at least two- and-a-half times as likely to be suspended than students of other races in all three years. Males and students with disabilities also show elevated risk of suspension. However, unlike findings from other districts, SDP students with LEP status are not suspended more frequently than their non-LEP peers.
3. COLLEGE AND CAREER READINESS
3.1. Career and Technical Education (CTE) A total of 2,285 students in the graduating class of 2014-2015, representing about 22% of the graduating cohort, participated in 120 CTE programs in 29 schools and 37 occupational areas. CTE students graduated at a rate of 72.2%, compared with 66.6% for the rest of the cohort. In addition, CTE students with credit deficits after 10th grade were more likely to graduate on time if they continued their CTE program (50.5%) rather than discontinuing (41.0%).
These findings were essentially replicated with the next cohort of students, who were first time 9th graders in 2012-2013, and had a four-year graduation date of 2016. In this cohort, 2,333 students, representing about 26% of the cohort, participated in a CTE program. These students had a graduation rate of 74.7%, compared with 69.9% for non-CTE students.

7
3.2. Open to Opportunities in Career and Technical Education As part of a three-year U.S. Department of Education grant, beginning in October of 2016, over 100 justice-involved youth enrolled in the District have received technical training, college and career counseling, and other re-entry supports while being held at either the Philadelphia Juvenile Justice Services Center or Pennypack House. As of January 2017, 8% of participants have earned industry-recognized certification in Telecommunications and/or Network Cabling/Copper-Based Systems. Observations and exit surveys spanning October-December of 2016 indicate that students are highly engaged with the programming.
3.3. CTE Graduate Follow Up In collaboration with the Office of Career and Technical Education (CTE), and in fulfillment of Perkins compliance requirements, ORE conducted a brief, online follow- up survey with 2015 CTE graduates. Of 843 graduates who provided email addresses on the Senior Exit survey, 146 (17%) completed the follow-up survey, which was administered one year after graduation. Of the graduates that responded (not necessarily a representative sample), 73% were enrolled in postsecondary education, with or without working, and 16% were working exclusively. Of those who were working, one-half were employed in a field related to their CTE course of study.
3.4. MBK Success Mentoring As part of the My Brother’s Keeper Initiative, 26 schools were selected to participate in a student mentoring program. Within those schools, students were selected to receive mentoring based on low attendance rates in the previous school year. School staff serve as mentors and meet with students in order to boost student engagement and ultimately increase attendance. SDP partnered with City Year for the initiative, and 17 schools used City Year corps members as mentors. The remaining nine schools used school staff as mentors. ORE is conducting an evaluation of the implementation of the program during the 2016-17 school year.
3.5. Diversion The Diversion program is a collaborative effort among schools, law-enforcement, the Department of Human Services and other City agencies. Local law enforcement is empowered to make informed judgments when a student commits a first-time, low- level arrestable offense. Under some circumstances, these students are diverted from the juvenile justice system and placed in individualized community-based prevention programs that seek to address the infraction and its underlying causes. In this way, these students are given the opportunity to improve their behavior, without the permanent disruption that often comes with a criminal history.
2013-2014 was the last year before the program began, so it serves as the baseline comparison year. After two full years of the program, arrests have declined, and over

8
900 students have been diverted. Compared with students that were arrested, students in the Diversion program were more likely to complete their school year, more likely to return the following year, and much less likely to reoffend.
3.6. High Priority High School Students As part of District efforts to improve graduation rates, a new process was created to help schools identify and serve students who are at risk of not completing the necessary credits to progress on time. Staff at each District high school were given access to spreadsheets that identified at-risk students, and specified each student’s area(s) of concern. Schools record the intervention selected for each student, which allows Assistant Superintendents to monitor the responses of schools in their network, and allows principals (and others) to evaluate the effectiveness of different interventions for individual students. In spring 2017, two populations were the focus of this process:
● 12th graders unlikely to satisfy all graduation requirements by Spring 2017: Thesestudents (n=2,720) included those in danger of failing a necessary course, and/orthose who were not rostered into one or more courses still needed forgraduation. High schools were also provided with additional District support inidentifying and delivering appropriate interventions.
● 9th graders unlikely to be promoted to 10th grade: These students (n=5,490)were prioritized, because research consistently shows that 9th grade outcomeshave an especially large impact on graduation rates. Students were identifiedafter the release of second quarter grades if they were either not rostered, orhad posted a failing course average, in a core course.
4. NUTRITION
4.1. EAT.RIGHT.NOW: Direct EducationStudents and parents/caregivers from approximately 260 District and charter schools encompassing grades preK-12 receive EAT.RIGHT.NOW. education related to nutrition and physical activity.
● From October to June 2015-2016, a total of 133,173 events were delivered, withtypes including one-on-one (2.3%); single classes (9.5%); series classes, whichinvolve 2-10+ sessions (70.5%); after-school classes (0.4%); assemblyperformances (5.1%); and assembly follow-up classes (12.2%). Of the 133,173total events, 26% incorporated a food tasting. The most common eventobjectives included MyPlate/MyPyramid (30.8%), vegetables (17.8%), fruits(17.4%), and physical activity (8.1%).
● From October to January in the 2016-2017 school year, a total of 33,937 eventswere delivered, with types including one-on-one (2.3%); single classes (9.7%);series classes, which involve 2-10+ sessions (84.8%); assembly performances

9
(1.1%); and assembly follow-up classes (2.1%). Of the 33,937 total events, 32.6% incorporated a food tasting. The most common event objectives included MyPlate/MyPyramid (26.0%), vegetables (14.6%), breakfast (12.4%), fruits (11.9%), and snacks (10.6%).
4.2. EAT.RIGHT.NOW: Assemblies Fifteen observations were conducted in the 2015-2016 school year of five different nutrition and physical activity assembly programs (three observations of each). The goal of these observations was to determine the age-appropriateness of each assembly, the results of which guided grade cut-offs for the 2016-2017 school year. Grade bands for assemblies in the 2015-2016 school year were K-3 (Healthier Ever After), K-5 (Jump with Jill and Nick Nutrition), and K-12 (The Magic of Nutrition and Rapping about Prevention). These changed in the 2016-2017 school year to K-2 (Healthier Ever After), K-5 (Jump with Jill), 2-5 (Nick Nutrition), and 5-12 (The Magic of Nutrition and Rapping about Prevention). The cut-offs were established in order to help increase equity across schools and grade levels with regards to the number of assembly performances received.
4.3. EAT.RIGHT.NOW: Supporting Healthy School Environments Initiative The purpose of this Initiative is to assess the current state of health practices and policy implementation within eight SDP schools and to expand programming at multiple levels within schools that support students, parents/caregivers, and staff in maintaining healthy school environments. During the first year of the initiative (2015-2016), observations were conducted in the eight schools over a four month period, and the following were identified as major weaknesses: unhealthy foods used as a reward in the classroom, unhealthy foods for special events/celebrations, unhealthy food fundraisers, limited movement breaks, limited recess facilities/supplies, and recess withheld or shortened as punishment. In the second year of the initiative (2016-2017), 172 staff members at four of the participating schools completed surveys and indicated areas in which they would like more support. Results showed that 59% said they would like more support for healthy classroom rewards, 56% for movement breaks, 44% for water/healthy beverages, 40% for staff wellness, 30% for healthy fundraisers, 28% for healthy holiday parties/special events, 26% for family and community engagement, 25% for healthy birthday celebrations, 22% for recess, and 17% for healthy school policies. EAT.RIGHT.NOW. used these results to help guide the development of strategies for the eight schools, as well as other schools serviced by the program.

10
5. OTHER ACADEMIC
5.1. Math and Science Partnership36 participants enrolled in the 2016 Summer Institute, which exceeded the target of 30 participants. Pre/post analyses for 32 participants revealed significant gains in participants’ math content knowledge. Results from a Summer Institute feedback form completed by 32 participants indicated that participants were satisfied with the content, quality, and delivery of the summer training.
5.2. Blended Learning Many schools in the District are implementing some form of blended learning during the 2016-2017 school year. Thirty-nine schools are participating in the Blended Learning Initiative (these schools applied to receive Chromebooks to use as part of either a rotation or a la carte model). A total of 255 teachers are using 16 different blended learning vendors as part of the Blended Learning Initiative. ORE is monitoring implementation in 2016-2017 through surveys, focus groups, and usage data received from vendors.
6. SCHOOL IMPROVEMENT
6.1. Transformation schools In 2013, the Philadelphia School Partnership (PSP) offered funding to District schools interested in implementing a turnaround plan to dramatically increase student achievement. From the ten schools that applied, PSP awarded James G. Blaine (Blaine) and William D. Kelley (Kelley) funding to support the development and implementation of their “transformation plans,” which aim to increase academic outcomes by enhancing school climate, updating curriculum and instruction, and implementing a professional development plan that focuses on the recruitment and training of mission- aligned teachers. ORE has been conducting an evaluation of progress toward these goals. After 2 years of implementation:
● Neither school saw improvements in ADA across time or relative to the otherNN4 schools. However, a higher percentage of Blaine and Kelley studentsattended 95% or more of enrolled days in 2015-2016 compared to those at theother NN4 schools (38%, 37% and 35%, respectively). At Kelley, there was animprovement in this metric from the baseline year (26%) to the 2015-2016 SY(37%).
● In 2015-2016, both Blaine and Kelley had more suspensions and more studentswith at least one suspension compared to the other NN4 schools.
● At both schools, there were decreases in the percentage of students scoringproficient or advanced on the reading/ELA and math PSSAs from baseline to2015-2016. At Kelley, but not Blaine, there was an increase for the science PSSA.
● With the exception of Blaine science PSSA scores, the percentage of studentsscoring proficient or advanced on the ELA, math, and science PSSAs in2015-2016

11
was the same or better compared to the average across the NN4 schools. ● Compared to the other NN4 schools, there is a smaller percentage of K-2 grade
students requiring strategic or intensive reading interventions (Tier 2 and 3). Thepercentage of third graders is similar across the Transformation schools and theNN4 schools.
● A larger percentage of K-2 students at Blaine and at Kelley made at least oneyear of reading growth compared to the NN4 schools.
6.2. New schools In September 2014, three new high schools of choice opened in SDP. All three schools served only 9th grade students the first year and are designed to add a grade each year. None of the schools has admissions criteria; while they are open to students citywide, each reserves a certain percentage of seats for students living in the surrounding neighborhoods. The Carnegie Corporation of New York’s Opportunity by Design Challenge Initiative (OBD) funded two schools (The LINC and U School) and one (Building 21) was funded by Building 21, a non-profit organization. ORE has been conducting an evaluation of progress toward these goals. After two years of implementation:
● New Schools enrolled higher proportions of Black (65%) and Latino (30%)students compared to the District overall (55% Black and 17% Hispanic/Latino).
● Based on a zip-code analysis, 44.1% of New School students are living in areas ofPhiladelphia where the poverty rates are above 40% (compared to 31.5% inPhiladelphia and 14.5% across the United States).
● Across the three New Schools, Building 21 had the highest retention rate (75%),followed by the LINC (73%) and the U School (72%).
● Of the three New Schools, only students at the LINC had significantly betterattendance than the comparison group. At Building 21, the percentage ofstudents attending 95% or more of enrolled days was significantly below that ofthe comparison group.
● Students at both Building 21 and the U School were less likely to pass their corecourses relative to the comparison group, and this difference was statisticallysignificant.
6.3. Turnaround Network ORE has collaborated with the Turnaround Network to create a quarterly school progress tracker that includes metrics aligned to the follow five areas: Teaching and Learning, Learning Environment, Leadership, Professional Growth, and Community Engagement. Data from Quarters 1 and 2 was summarized in two-page reports for each school. Once available, Quarter 3 data will be added.

12
6.4. School Redesign Initiative ORE examined District-wide survey data for the Cohort 1 SRI schools. Selected findings included:
● All four SRI schools saw increases in their student response rates in 2015-2016and had student response rates above the overall District and Charter average.Approximately 90% of students at both Carnell and Jenks A&S completed thesurvey in 2015-2016.
● Similar to the overall District and Charter trend, teacher response rates at two ofthe four SRI schools decreased from 2014-2015 to 2015-2016 (Arthur andTilden). The two schools that had an increased teacher response rate (Carnelland Jenks A&S) were also above the 2015-2016 District and Charter responserate average.
● Students at two of the four SRI schools (Tilden and Carnell) indicated lowpercentages of positive responses on the Safety/Building Conditions sub- construct. These results suggest this should be an area of focus for theseschools, if possible.
● At all four SRI schools, teachers were the least likely to select the most positiveresponse to Climate questions across both school years. However, both Carnelland Tilden saw a seven percentage point increase in teachers responding mostpositively to Climate items.
● There were only two instances where a group felt more positive with regards toInstruction in 2015-2016 compared to 2014-2015: students at Arthur andteachers at Tilden. In all other cases, the percentage of respondents selecting themost positive response to Instruction questions either stayed the same ordecreased over the two years.
7. SURVEYS7.1. District-wide surveys (DWS)
Surveys were launched April 3, 2017. In partnership with the FACE Office, ORE has led DWS workshops, with a focus on the Parent & Guardian surveys, for SAC members, Parent Liaisons, Bilingual Counselors, and Americorps VISTAs. The collaboration with FACE has allowed ORE to produce a “Tips & Strategies” for increasing Parents & Guardian response rates sheet that has been shared widely with stakeholders.
Last year, 73,187 students, 25,911 parents, 5,688 teachers and 198 principals participated in the District-wide survey program in 2015-2016. This was up from 46,695 students, 13,360 parents, 5,423 teachers and 156 principals in 2014-2015.
7.2. Senior Exit Surveys The Senior Exit Survey is intended to understand the post-secondary plans of graduating, high school seniors, as well as to get their feedback on the support they received in preparing for college and career. During the 2015-2016 school year, 5,748

13
12th graders participated in the District-wide senior exit survey. The response rate of 82% was an increase from 77% in 2014-2015. The 2016-2017 survey will launch on May 1, 2017.
7.3. Pre-K Parent Survey The Pre-K parent survey was launched on May 18, 2016. It was developed to gain parent/guardian feedback on their experiences with their child’s pre-k program. This school year’s Pre-K parent survey also includes questions about parents’/guardians’ plans for sending their child to Kindergarten and the Kindergarten choice process. The response rate from the first year of the pre-k survey (SY 2015-16) was 5%, with 150 respondents from School District of Philadelphia (SDP) sites and 320 respondents from partner provider sites, for a total of 470 respondents. This year’s survey will open on April 20, 2017, and ORE has met with staff from the Office of Early Childhood Education and presented at a parent Policy Council meeting to improve outreach and response rates.
7.4. School Support Census A total of 213 District K-12 schools (98%) participated in the 2015-2016 School Support Census, which was designed to establish a comprehensive listing of all external support relationships in place at District schools. Schools reported an average of 18.2 supports across a variety of impact areas, with variation by school type. The Office of Strategic Partnerships is using the completed database to help match schools with partners that meet their students’ needs. The 2016-2017 School Support Census has a planned launch date of April 25, 2017, and is utilizing Google Drive to make participation more convenient for participating principals and staff.
8. ACCOUNTABILITY FRAMEWORKS
8.1. School Progress Reports (SPR)The 2015-2016 School Progress Reports (SPR) were released on January 31, 2017. These reports represent the fourth year for which the SPR has been produced. Two-hundred and twenty-one reports were released for SDP District schools, as well as 103 reports for charter schools (98% of all eligible charter schools). Twenty-one percent of district schools, serving roughly 29,000 students, were in the top two tiers for their Overall score. More than half of district schools (115) saw an increase in their Overall SPR score, with the biggest improvements in the Climate domain: nearly three-quarters (160) of district schools saw an increase in their Climate domain score.

14
Prior to the public release of the SPR, the District Performance Office met with all Assistant Superintendents and attended 11 network meetings to review reports with principals. Subsequently, DPO has also presented to SAC members and met with leaders of roughly half a dozen schools in order to increase understanding of the SPR across the district.
DPO also conducted supplemental analyses aimed at understanding the relationship between school instructional and climate supports and SPR scores. New analyses demonstrated that schools with ELS showed larger gains in their K-2 reading performance and Achievement domain scores than schools that did not have ELS. These gains increased with the length of time for which ELS had been in place: schools that had ELS beginning in 2014-2015 showed a 3.1 percentage point gain in K-2 reading, compared to a gain of 0.1 percentage points for schools that did not have ELS. Similarly, with the exception of schools that began PBIS training in 2013-2014, schools that have had PBIS for a longer period of time tend to have larger improvements in their attendance scores and smaller or no declines in their suspension scores.
8.2. Alternative Education Progress Reports (AEPR) In spring 2016, DPO partnered with the Opportunity Network to pilot the Alternative Education Progress Reports (AEPR). Modeled after the SPR, the AEPR evaluates alternative programs serving District students against rigorous measures of academic achievement and progress, climate, and college & career readiness. In this first year, reports reflecting performance in the 2014-2015 school year were produced for 19 alternative programs.
Revision of the AEPR is underway, with the release of the 2015-2016 AEPR anticipated in June 2017. To facilitate this revision, DPO has conducted “deep dive” meetings with Opportunity Network staff and key program partners to review -- and, where necessary, modify -- the metrics against which programs will be evaluated moving forward. The AEPR will be incorporated into the Opportunity Network’s new contracts with providers, scheduled to take effect on July 1, 2017.
9. EXTERNAL RESEARCH (see pp.33-38 for lists of new proposals and ongoing projects)Fifty-five applications were received by the Research Review Committee (RRC) during thefirst three quarters of the 2016-2017 fiscal year, an average of about eight proposals permonth (the RRC does not meet in August or December). Approximately 45 existing researchprojects, with approval preceding July 2016, are also still active.
9.1. Applications through Q3Between July 2016 and March 2017, the RRC received 55 proposals from 35 organizations or universities. Entities that have submitted the most proposals during this time are: Drexel University (n=4), Temple University (n=4), the University of

15
Pennsylvania (n=4), and American Institutes for Research (AIR, n=4), Research for Action (n=3), the Philadelphia Department of Health Division of Chronic Disease Prevention (n=3), and the Children’s Hospital of Philadelphia (n=3). Approximately 69% of proposals were approved for the 2016-2017 school year-to-date.
9.2. Applications, Previous Years Forty-five currently active research proposals from 25 organizations pre-date July 2016, with the highest percentage of proposals coming from the University of Pennsylvania (24%, n=11) and Drexel University (11%, n=5). Other prominent organizations include Temple University, the Children’s Hospital of Philadelphia, Mathematica Policy Research, Inc., and Walden University.
9.3. Application Type The RRC accepts five types of proposals - national surveys, dissertations, academic studies, program evaluations, and grant-mandated evaluations. The most common submission type were program evaluations (36%, n=20), followed by academic studies (20%, n=11) and dissertations (20%, n=11), grant-mandated evaluations (13%, n=7), and national surveys (11%, n=6).
9.4. Schools Approximately 162 schools have been involved in 2016-2017 approved studies during the year thus far, with some schools hosting multiple projects. The largest approved study involves 61 schools in total, and is being conducted by the Philadelphia Department of Health Division of Chronic Disease Prevention. This number does not reflect the amount of schools involved in previously approved RRC studies.
9.5. Research Forums In November 2016, ORE began offering a monthly Research Partnerships and Tiered Evidence Forum. The goal of this forum is to provide external researchers with information about District standards and procedures for conducting research and applying for access to District data. Since November 2016, more than 100 program staff, researchers, students, and other stakeholders from a variety of organizations and universities have attended. Organizations with the highest staff attendance are: the University of Pennsylvania (n=18), the Public Health Management Corporation (n=6), and Drexel University (n=6).

16
10. DATA DISSEMINATION AND DATA REQUESTS
10.1. School Profiles SDP's online School Profiles are an important resource for families, members of the Philadelphia community, and staff alike. Utilizing the newly acquired Business Intelligence tool (Qlik) for data visualization, DPO is redesigning School Profiles to be more interactive, informative and user-friendly. Version 1.0 of the re-designed School Profiles will be released on August 1 as part of the launch of SDP’s new website.
10.2. Dashboards Dashboards provide timely, relevant, and actionable information to District leaders, administrators, and principals on the state of the city’s students, the city’s schools, and a wide spectrum of central office services. Utilizing the newly acquisitioned Business Intelligence tool (Qlik) for data visualization and reporting, DPO is redesigning the Performance Management Dashboard (PMD). The PMD provides monthly climate data and quarterly academic performance data. DPO is also working in partnership with Educational Technology to redesign the SchoolNet KPI Dashboard to align with the Superintendent’s Action Plan 3.0 with a focus on attendance, literacy, and math performance. Version 1.0 of the redesigned PMD and SchoolNet KPI dashboards will launch in July and be rolled-out to Assistant Superintendents and Principals prior to the start of the school year.
10.3. Data (see pp. 18-32 for a list of data requests) On the School District of Philadelphia website, DPO publishes longitudinal datasets spanning various operational, school, and student performance areas. The public release of this data supports our goals to promote greater transparency and community engagement. Published longitudinal datasets include:
SDP Employee Information: Employee Data—Quarterly SDP School Information: Enrollment/Demographics—Annual Master School List—Annual Serious Incidents—Annual Suspensions—Annual Teacher Attendance—Annual Average Daily Attendance (students)—Annual PreK School Information—Annual Graduation Rates (first-time 9th grade cohort)—Annual School Catchment Areas: ES Catchment—Annual MS Catchment—Annual HS Catchment—Annual

17
SDP Budget: Expenditure Information—Annual
PSSA & Keystone Data: Keystone Actual—Annual Keystone AYP—Annual PSSA Actual—Annual PSSA AYP—Annual
School SPR Data: School Progress Report—Annual Districtwide Scorecard—Annual
Data Requests ORE and DPE jointly utilize an online Data Request Form to collect and process internal and external data requests, for both research and non-research related inquiries. Included below are requests received through the online Data Request Form in 2015-16 and 2016-17 (YTD).
EOY SY2015-2016 YTD SY2015-2016 YTD SY2016-2017 112 74 131
2015-2016 2016-2017
Requ
est C
ount

Data Requests Submitted July 2015-March 2017
18

Request Organization Data Request Reporting Level Sub-Group Time Period
1 Student
Attendance Rate, Dropout Rate, Graduation Rate, In-School Suspensions, Out-of-School Suspensions, Retention Rate,
Serious Incidents
District, Learning Network, School
Gender, Grade Level, Economic Disadvantage, Race/Ethnicity
2013-14, 2014-15, 2015-16
2 School District of
Philadelphia (Central Office)
Attendance Rate, College Matriculation Rate, Graduation Rate, Keystone Growth
(AGI), Keystone Proficiency, Out-of-School Suspensions
District, School 2015-16
3 Thomas B. Fordham Institute Due process policies for tenured teachers District
2013-14, 2014-15, 2015-16
4 Drexel University
ACCESS Growth, ACCESS Proficiency, AP/IB Participation & Performance, College
Matriculation Rate, Credit Accumulation, Dropout Rate, Early Literacy, Graduation Rate, In-School Suspensions, Keystone
Growth (AGI), Keystone Proficiency, Out-of-School Suspensions, PSSA Growth (AGI),
PSSA Proficiency, Retention Rate, SAT/ACT Participation & Performance, Serious Incidents, Teacher Attendance
District, Learning Network, School
Gender, Grade Level, Economic Disadvantage,
English Language Learners,
Race/Ethnicity, Special Education
2013-14, 2014-15, 2015-16
5 School District of
Philadelphia (School-Based)
College Matriculation Rate Small Learning
Community (student IDs provided)
Grads from 2010-2015
6 School District of
Philadelphia (Central Office)
Attendance Rate, Credit Accumulation, In-School Suspensions, Keystone Proficiency,
Out-of-School Suspensions, PSSA Proficiency
District, School 2015-16
7 School District of
Philadelphia (Central Office)
Enrollment/Demographics School
Grade Level, Economic
Disadvantage, English Language
Learners, Race/Ethnicity,
Special Education
2015-16
8 School District of
Philadelphia (Central Office)
Teacher Vacancies District 2014-15, 2015-16
19

9 School District of
Philadelphia (Central Office)
College Matriculation Rate District, School 2015-16
10 Philadelphia School Partnership
Dropout Rate, Graduation Rate, Keystone Growth (AGI), Keystone Proficiency, PSSA
Growth (AGI), PSSA Proficiency District, School
Gender, Grade Level, English
Language Learners, Race/Ethnicity,
Special Education
2013-14, 2014-15, 2015-16
11 School District of
Philadelphia (Central Office)
Attendance Rate, Credit Accumulation, Early Literacy, In-School Suspensions,
Keystone Growth (AGI), Keystone Proficiency, Out-of-School Suspensions
School Grade Level 2013-14, 2014-15, 2015-16
12 School District of
Philadelphia (Central Office)
PSSA Proficiency Student* 2015-16
13 School District of
Philadelphia (Central Office)
Early Literacy, Graduation Rate, Keystone Proficiency, PSSA Proficiency, Retention
Rate School 2014-15,
2015-16
14 School District of
Philadelphia (Central Office)
Keystone Proficiency, PSSA Proficiency School 2014-15, 2015-16
15 School District of
Philadelphia (Central Office)
Early Literacy District, Learning Network, School 2015-16
16 School District of
Philadelphia (Central Office)
PSSA Growth (AGI), Reading and Math Growth School, Student* Kindergarten marker 2014-15,
2015-16
17 School District of
Philadelphia (Central Office)
Attendance Rate, Early Literacy, In-School Suspensions, Keystone Proficiency, Out-of-
School Suspensions District, School Grade Level 2015-16
18 School District of
Philadelphia (Central Office)
Attendance Rate, Early Literacy, In-School Suspensions, Keystone Proficiency, Out-of-
School Suspensions, PSSA Proficiency
District, Learning Network, School Grade Level 2015-16
19 School District of
Philadelphia (Central Office)
Keystone Growth (AGI), Keystone Proficiency, PSSA Growth (AGI), PSSA
Proficiency School 2014-15,
2015-16
20

20 Yale University Attendance Rate, Graduation Rate,
SAT/ACT Participation & Performance, School Demographics
District, School 1910-present
21 School District of
Philadelphia (Central Office)
PSSA Proficiency District 2014-15, 2015-16
22 School District of
Philadelphia (Central Office)
PSSA Proficiency District 2015-16
23 School District of
Philadelphia (Central Office)
ACCESS Growth, ACCESS Proficiency District, School, Student*
2014-15, 2015-16
24 School District of
Philadelphia (Central Office)
Keystone Proficiency, PSSA Proficiency District Grade Level 2014-15, 2015-16
25 School District of
Philadelphia (Central Office)
Grade Distribution District, Learning Network, School,
Subject area Grade Level 2015-16
26 School District of
Philadelphia (Central Office)
Attendance Rate, In-School Suspensions, Out-of-School Suspensions, Absences District, School Grade Level 2015-16
27 School District of
Philadelphia (Central Office)
Keystone Proficiency, PSSA Proficiency District, Learning Network, School
2014-15, 2015-16
28 Steppingstone Scholars
AP/IB Participation & Performance, Attendance Rate, College Matriculation
Rate, Credit Accumulation, Dropout Rate, Graduation Rate, Keystone Growth (AGI), Keystone Proficiency, PSSA Growth (AGI),
PSSA Proficiency, Retention Rate, SAT/ACT Participation & Performance
District, Learning Network, School,
Teacher*, Student*
Grade Level, Economic
Disadvantage, Race/Ethnicity,
Special Education
2015-16, SY 16-17
29 Gear UP SAT/ACT Participation & Performance School 2015-16
30 School District of
Philadelphia (Central Office)
Keystone Proficiency District 2015-16
21

31 School District of
Philadelphia (Central Office)
Enrollment numbers School Grade Level 2015-16
32 School District of
Philadelphia (Central Office)
Attendance Rate District, School, High Schools ONLY
Grade Level, 9th Grade
2014-15, 2015-16
33 Chester County Intermediate Unit Math & Science data Teacher*, Student*
Math & Science students of MSP
grant participating teachers
2015-16
34 School District of
Philadelphia (Central Office)
PSSA Proficiency Student* 2015-16
35 School District of
Philadelphia (Central Office)
Early Literacy Learning Network Grade Level 2015-16
36 School District of
Philadelphia (Central Office)
Teacher Attendance, PSSA Proficiency District, School 2015-16
37 School District of
Philadelphia (Central Office)
College Matriculation Rate Student* most recent available
38 School District of
Philadelphia (Central Office)
Attendance Rate, College Matriculation Rate, Credit Accumulation, Dropout Rate, Graduation Rate, Keystone Growth (AGI),
Keystone Proficiency, Retention Rate, Serious Incidents
Philadelphia Neighborhood High
Schools 2015-16
39 Philadelphia Education Fund
College Matriculation Rate, Enrollment STATA code N/A
2014-15, Any period for the cut-off ranges, and whether
they have changed.
40 Springboard Collaborative
Attendance Rate, Early Literacy, Teacher Attendance
Learning Network, School, Teacher*,
Student*
Gender, Grade Level, Economic Disadvantage,
English Language
2013-14, 2014-15, 2015-16
22
Learners, Race/Ethnicity,
Special Education
41 School District of
Philadelphia (Central Office)
Early Literacy Student* 2015-16
42 American Institutes for Research
Attendance Rate, Graduation Rate, In-School Suspensions, Out-of-School Suspensions, Retention Rate, See
description below
Student*
Gender, Grade Level, Economic Disadvantage,
English Language Learners,
Race/Ethnicity, Special Education
2015-16, 2016-17
43 Pennsylvania Department of
Education
AP/IB Participation & Performance, SAT/ACT Participation & Performance,
NOCTI, PSAT School Grade Level 2015-16
44 Student Graduation Rate, Out-of-School Suspensions District Race/Ethnicity 2014-15,
2015-16
45 School District of
Philadelphia (Central Office)
Early Literacy District Grade Level 2015-16
46 School District of
Philadelphia (Central Office)
Enrollment, School Counts District 2015-16, 2016-17
47 U.S. Department of Education School List District 2015-16
48 School District of
Philadelphia (School-Based)
Teacher Attendance Teacher* Race/Ethnicity 2013-14, 2014-15, 2015-16
49 School District of
Philadelphia (Central Office)
Climate Data School 2014-15, 2015-16
50 School District of
Philadelphia (School-Based)
Attendance Rate, PSSA Growth (AGI), PSSA Proficiency, Reading Level and Math
levels Student* 2015-16
23

51 School District of
Philadelphia (Central Office)
Early Literacy District, Learning Network, School Grade Level 2015-16,
2016-17
52 Univ of Delaware: School of Public
Policy and Administration
School Shutters from 2000-2015 District, School, Teacher*, Student* 2000-2015
53 School District of
Philadelphia (Central Office)
Attendance Rate, College Matriculation Rate, Dropout Rate, Graduation Rate,
Keystone Proficiency, SAT/ACT Participation & Performance
School
2013-14, 2014-15, 2015-16, 2012-13
54 School District of
Philadelphia (Central Office)
Graduation Rate Learning Network 2013-14, 2014-15, 2015-16
55 School District of
Philadelphia (Central Office)
PSSA/Keystone attribution District 2014-15, 2015-16
56 Children's Literacy Initiative
Attendance Rate, Early Literacy, PSSA Growth (AGI), PSSA Proficiency, Teacher
Attendance, DRA, AIMSweb, teacher survey data
School
Grade Level, Economic
Disadvantage, English Language
Learners, Race/Ethnicity
2014-15, 2015-16
57 Navy Recruiting military request Student* Grade Level 2016-2017 58 Brown University 20 Lowest Performing Schools District 2014-15
59 School District of
Philadelphia (Central Office)
Attendance Rate, Graduation Rate, In-School Suspensions, Keystone Proficiency,
Out-of-School Suspensions, PSSA Proficiency
District
2013-14, 2014-15,
2015-16, Last 5 years
60 School District of
Philadelphia (Central Office)
Attendance Rate, In-School Suspensions, Out-of-School Suspensions
School, Neighborhood High Schools Grade Level 2015-16
61 School District of
Philadelphia (Central Office)
Graduation Rate Learning Network, School 2015-16
24

62 School District of
Philadelphia (Central Office)
SPR District 2014-15
63 School District of
Philadelphia (School-Based)
Grades Student*
Gender, Grade Level, Economic Disadvantage,
English Language Learners,
Race/Ethnicity, Special Education
2015-16
64 School District of
Philadelphia (Central Office)
Student Count for Graduation on certain dates District 2015-16
65 School District of
Philadelphia (Central Office)
Keystone Proficiency, PSSA Proficiency, CEP Economically Disadvantaged Rate District, School 2015-16,
2016-17
66 School District of
Philadelphia (Central Office)
Attendance Rate, Out-of-School Suspensions School Grade Level
2016-17 (through October)
67 School District of
Philadelphia (Central Office)
Keystone Proficiency, PSSA Proficiency School 2016-17
68 School District of
Philadelphia (School-Based)
Retention Rate School Special Education 2015-16
69 School District of
Philadelphia (Central Office)
Graduation Rate Student* 2015-16
70 School District of
Philadelphia (Central Office)
Early Literacy District, Learning Network Grade Level 2015-16
71 School District of
Philadelphia (Central Office)
Learning Network Map Learning Network, School 2016-17
25

72 Council of the Great City Schools
PSSA Mean Scale Scores for grade 4 and 8 in 2009, 2011, 2013, 2015 District
2014-15, 08-09, 10-11, 12-
13
73 Internet Essentials, Comcast
2016 District-wide Survey, Parent and Student Versions Student*, Parent
Gender, Grade Level, Economic Disadvantage,
English Language Learners,
Race/Ethnicity, Special Education
2015-16
74 School District of
Philadelphia (School-Based)
Attendance Rate, Out-of-School Suspensions
School, Teacher*, Student*, Please see note provided in the
data request...
2016-2017
75 School District of
Philadelphia (Central Office)
9th Grade Repeaters School Grade Level 2016-17
76 School District of
Philadelphia (Central Office)
Attendance Rate, Graduation Rate, PSSA Proficiency, Enrollment District 2014-15,
2015-16
77 Philadelphia School Partnership Free From Tape Data File School 2016-2017
78 School District of
Philadelphia (Central Office)
Early Literacy District, Learning Network, School Grade Level 2016-17
79 RAND Corporation Attendance Rate, Keystone Proficiency, PSSA Proficiency Student*
2013-14, 2014-15, 2015-16,
Earlier years as needed to get 8th grade PSSA scores
for older students.
80 School District of
Philadelphia (Central Office)
Attendance Rate, Out-of-School Suspensions School, Student*
2010-11 through 2015-
2016
26

81 School District of
Philadelphia (Central Office)
Attendance Rate, Graduation Rate, Keystone Growth (AGI), Keystone
Proficiency, PSSA Growth (AGI), PSSA Proficiency, Retention Rate
School 2015-16
82 School District of
Philadelphia (Central Office)
Attendance Rate District Grade Level 2015-16
83 University of Texas at Austin Youth Risk Behavior Survey Student* 2015
84 Drexel University, Action for Early
Learning Initiative
Attendance Rate, Early Literacy, In-School Suspensions, Out-of-School Suspensions,
PSSA Growth (AGI), PSSA Proficiency, KEI, Kindergarten registration, DRAs (first and final marking period), number of days
enrolled, total number of absences, number of in- and out-of-school suspension days
District, School, Teacher*, Student*
Gender, Grade Level, Economic Disadvantage,
English Language Learners,
Race/Ethnicity, Special Education
2013-14, 2014-15, 2015-16,
2015-17 when available
85 Drexel University, Action for Early
Learning Initiative
Attendance Rate, Early Literacy, KEI, Kindergarten enrollment,
District, School, Student*
Gender, Grade Level, Economic Disadvantage,
English Language Learners,
Race/Ethnicity
2014-15, 2015-16,
2016-17 when available
86 School District of
Philadelphia (Central Office)
Counts of students Point Breeze Count 2016-17
87 School District of
Philadelphia (Central Office)
Graduation Rate Student* 9-10 and 10-11 cohorts
88 School District of
Philadelphia (Central Office)
College Matriculation Rate, Graduation Rate, SAT/ACT Participation &
Performance, FAFSA District
2013-14, 2014-15, 2015-16
89 School District of
Philadelphia (Central Office)
Catchment School 2015-16
90 School District of
Philadelphia (Central Office)
In-School Suspensions, Out-of-School Suspensions District, School Grade Level 2015-16,
2016-17
27

91 Northwestern University Teacher Demographic information School, Teacher* Race/Ethnicity
2013-14, 2014-15,
2015-16, as far back as
possible up to 10 years
92 School District of
Philadelphia (Central Office)
Graduation Rate Student* 11-12 cohort
93 School District of
Philadelphia (Central Office)
College Matriculation Rate Student* 2015-16
94 Statewide
Epidemiological Outcomes Workgroup
Youth Risk Behavior Surveillance System District 2015-16
95 Council of Great City Schools Provide updates to old data District
Gender, Grade Level, Economic Disadvantage,
English Language Learners,
Race/Ethnicity, Special Education
2013-14, 2014-15, 2015-16
96 School District of
Philadelphia (Central Office)
College Persistence District, School 2014-15
97 School District of
Philadelphia (Central Office)
Keystone Proficiency, PSSA Proficiency Student* 2015-16
98 School District of
Philadelphia (Central Office)
FAFSA School 2015-16, 2016-17
99 Philadelphia Education Fund College Matriculation Rate School type None
2013-14, 2014-15,
2015-16, Most recent & any available you can manage
28

100 School District of
Philadelphia (School-Based)
Out-of-School Suspensions School
Gender, Grade Level, Economic Disadvantage,
English Language Learners,
Race/Ethnicity, Special Education
year before PBIS and year after, please
refer to proposal #
#2016-09-469
101 Boys Latin College Matriculation Rate, Graduation Rate
District, School, Charter schools
Gender, Race/Ethnicity
2014-15, 2015-16
102 School District of
Philadelphia (Central Office)
Out-of-School Suspensions, PSSA Proficiency, Teacher Attendance School
2014-15, 2015-16,
Change from 2014-15
103 Metis Associates Attendance Rate, College Matriculation Rate, Credit Accumulation, Graduation Rate Student*
2015-16, 16-17 (college
matriculation)
104 School District of
Philadelphia (Central Office)
Attendance Rate, Keystone Proficiency, PSSA Proficiency Student* 2015-16
105 School District of
Philadelphia (Central Office)
In-School Suspensions, Keystone Proficiency, Out-of-School Suspensions,
PSSA Proficiency Student* 2015-16
106 Philadelphia School Partnership Enrollment by school and home address Student*
Gender, Grade Level, Economic Disadvantage,
English Language Learners,
Race/Ethnicity, Special Education
2015-16
107 School District of
Philadelphia (Central Office)
ACCESS Proficiency, AP/IB Participation & Performance, Attendance Rate, College
Matriculation Rate, Graduation Rate, Keystone Proficiency, Out-of-School
Suspensions, PSSA Proficiency, Retention Rate, SAT/ACT Participation &
Performance, Enrollment
District, School, Student*
Gender, Grade Level, Economic Disadvantage,
English Language Learners,
Race/Ethnicity, Special Education
2015-16, Past five years
(graduation data)
108 Springboard Collaborative Early Literacy Teacher* Grade Level 2015-16
29

109 School District of
Philadelphia (School-Based)
Attendance Rate, Credit Accumulation, Dropout Rate, Graduation Rate, Out-of-
School Suspensions District, School
Gender, Grade Level, English
Language Learners, Race/Ethnicity,
Special Education
2014-15, 2015-16, 2016-17
110 Cornell University School rosters One row per individual 2016-2017
(current rosters)
111 School District of
Philadelphia (Central Office)
Feeder Pattern Data District, Learning Network, Student* Grade Level 2015-16,
2016-17
112 School District of
Philadelphia (School-Based)
College Matriculation Rate School Race/Ethnicity 2013-14, 2014-15, 2015-16
113 School District of
Philadelphia (Central Office)
Demand Data School By Catchment 2016-2017
114 Guttmacher Institute YRBS Student* 2009-2015
115 School District of
Philadelphia (Central Office)
Credit Accumulation District, School 2014-15, 2015-16
116 Arkansas State University
# of students with severe and profund disabilities District, Student* Special Education 2015-16
117 School District of
Philadelphia (Central Office)
FAFSA District, School 2016-17
118 University of
Pennsylvania, Graduate School of
Education
Math Benchmark Data Learning Network,
School, NN2 elementary school only
Grade Level, de-identified - without
any student identification
2015-16, 2016-17
119 School District of
Philadelphia (Central Office)
Dropout Rate, Graduation Rate School, Student* 2014-15
120 School District of
Philadelphia (Central Office)
Enrollment School 2015-16, 2016-2017
30

121 Andrew Jackson Elementary
past enrollment projections and inputs to current/recent enrollment projections
School, class, grade, catchment as specified
in the request.
Grade Level, Economic
Disadvantage, English Language
Learners, Race/Ethnicity,
Special Education
2013-14, 2014-15, 2015-16, 2016-17, 2017-18
(projected)
122 School District of
Philadelphia (Central Office)
Matriculation by college from Boys Latin School 2013-14,2014-15,2015-16
123 School District of
Philadelphia (Central Office)
Teacher Attendance
District, Learning Network, School, Teacher*, Graphs showing the trends
across the district for all years would be
ideal, and then individual per school
for 15/16 only.
2013-14, 2014-15, 2015-16,
12/13 as well if available, if not then just back to 13/14
is fine.
124 School District of
Philadelphia (Central Office)
Student to Teacher ratio
school group (middel, HS, elem), school type
(neigborhhood, automoby, special
admit, etc.)
Grade Level
2013-14, 2014-15, 2015-16,
2011-2012, 2012-2013
125 School District of
Philadelphia (Central Office)
Out-of-School Suspensions District Grade Level, Race/Ethnicity See above
126 Drexel University, Action for Early
Learning Initiative
Attendance Rate, Early Literacy, KEI, Kindergarten enrollment,
District, School, Student*
Gender, Grade Level, Economic Disadvantage,
English Language Learners,
Race/Ethnicity
2014-15, 2015-16,
2016-17 when available
31

127 Drexel University, Action for Early
Learning Initiative
Attendance Rate, Early Literacy, In-School Suspensions, Out-of-School Suspensions,
PSSA Growth (AGI), PSSA Proficiency, KEI, Kindergarten registration, DRAs (first and final marking period), number of days
enrolled, total number of absences, number of in- and out-of-school suspension days
District, School, Teacher*, Student*
Gender, Grade Level, Economic Disadvantage,
English Language Learners,
Race/Ethnicity, Special Education
2013-14, 2014-15, 2015-16,
2015-17 when available
128 School District of
Philadelphia (Central Office)
Learning Network Map Learning Network, School 2016-17
129 Metis Associates Attendance Rate, College Matriculation Rate, Credit Accumulation, Graduation Rate Student*
2015-16, 16-17 (college
matriculation)
130 School District of
Philadelphia (School-Based)
Attendance Rate, Credit Accumulation, Dropout Rate, Graduation Rate, Out-of-
School Suspensions District, School
Gender, Grade Level, English
Language Learners, Race/Ethnicity,
Special Education
2014-15, 2015-16, 2016-17
131 School District of
Philadelphia (Central Office)
Feeder Pattern Data District, Learning Network, Student* Grade Level 2015-16,
2016-17
32

External Research Proposals Approved July 2016- March 2017
33

New Proposal Title
1 2016-07-451 ED School Climate Surveys (EDSCLS) 2017 Benchmark
2 2016-07-452 The Pennsylvania Kindergarten Entry Inventory Validation Study
3 2016-07-453 Study of Title I Schoolwide and Targeted Assistance Programs
4 2016-07-454 Evaluating the Healthy Kindergarten Initiative - a Nutrition, Physical Activity and Local Food Education Program
5 2016-07-455 Urban Teachers' Experiences with Service-Learning
6 2016-07-456 Preventing Physical, Relational, and Cyber-Bullying within Urban Schools: A Multi-Component Intervention (The PRAISE Program)
7 2016-07-457 Planting Science: Digging Deeper Together - A Model for Collaborative Teacher/Scientist Professional Development
8 2016-07-458 Evaluation of a Population-Based Mental Health Assessment to Intervention Model
9 2016-09-459 Role of Alcoholic Disparities in HIV Risk among Sexual Minority Youth
10 2016-09-460 Grant Mandated Evaluation - Math/STEM/Science Partnership
11 2016-09-461 The Impact of the "New Faces" Program at Roxborough High School on Participant Persistence, Completion, and Post-Secondary Enrollment
12 2016-09-462 Exploring General Education Teachers' Understanding of Evidence-Based Practice; A Collective Case Study
13 2016-09-463 The Leadership Qualities of Successful Urban Elementary School Principals and Their Roots
14 2016-09-464 Everyday Mindfulness in Schools: An Evaluation of Mindfulness-Based Training for Teachers
15 2016-09-465 Families and Schools Together
16 2016-09-466 Community Innovation Zone: Autism Placement and Progress in Philadelphia
17 2016-09-467 Evaluating the AFSP More than Sad School-Based Suicide Prevention Program
18 2016-09-468 District-Wide Assessment of Elementary Schools' Physical Activity Practices
19 2016-09-469 The Effects of Positive Behavior and Intervention Supports (PBIS) in Reducing Suspensions of Latino Students
20 2016-09-470 NSF Robotics Research Experience for Middle School Teachers Site Research
21 2016-09-471 Developing Formative Assessment Tools and Routines for Additive Reasoning
22 2016-09-472 Career Vitality in a Challenging Context: Experiences of Urban Principals
23 2016-09-473 P3 Communities of Practice: How do STEM PD and Coaching Impact Teachers' Confidence and Comfort with STEM Topics?
24 2016-09-474 Playworks Evaluation to Ensure Program Quality
25 2016-10-475 School-Resuscitation Training: Advancing the Student Program for Olympic Resuscitation in Schools (SPORTS 2.0)
26 2016-10-476 Re-Imagining the High School Experience: Supporting the 9th Grade Transition
27 2016-10-477 PA Youth Risk Behavior Survey (YRBS) - Healthy PA Youth Survey
34

28 2016-11-478 Engineering Expansive Learning for Boys of Color: A Focus on Practice & Identity
29 2016-11-479 Strengthening Community Partnerships in the Arts: Evaluation Study
30 2016-11-480 AT&T Aspire Connect to Success Program Evaluation
31 2016-11-481 Evaluation of Congreso's Exito Program Replication at Kensington CAPA High School
32 2016-11-482 UACS Evaluation and Survey Partnership at Benjamin B. Comegys and Henry C. Lea Community Schools
33 2016-11-483 ED School Climate Surveys (EDSCLS) 2017 Benchmark
34 2016-11-484 A Quantitative Study Designed to Define the Expectations of Parental Involvement in Order to Effectively Support Student Achievement
35 2016-12-485 Teach for America Corps' Members Perceptions of Classroom Self-Efficacy
36 2017-01-486 The Barnes' Foundations Look! Reflect! Connect! Program Evaluation
37 2017-01-487 Student Evaluation of Philadelphia-based Museum Experience Called Unpacking the Past
38 2017-01-488 Measures of Progress Related to the Read by 4th Campaign
39 2017-01-489 Enhancing Discussion Based Learning in an Elite Magnet School
40 2017-01-490 Multi-Method Evaluation Plan: Bringing Libraries and Schools Together (BLAST)
41 2017-01-491 Evaluation of a Professional Development Program to Increase Trauma Awareness among Head Start Staff: Phase I, Administrators
42 2017-01-492 Investigating "Safe Space" within Creative and Performing Arts High School Vocal Programs
43 2017-02-493 Evaluation of Children's Literacy Initiative's Blueprint for Early Literacy Pre-K Curriculum Supplement with Professional Development
44 2017-02-494 Implementation of PBIS: An Investigative Study of Middle School Students in an Urban District
45 2017-02-495 SentenceWeaver Pilot Study
46 2017-02-496 Validating the School Outcomes Measure (SOM): An Outcomes Measure for Students Who Receive School-based Occupational Therapy and Physical Therapy
47 2017-02-497 2017 National Youth Tobacco Survey (NYTS)
48 2017-02-498 A Study of African American Males' College Readiness Through the Public School District
49 2017-02-499 Youth Risk Behavior Survey (YRBS) Analysis and Report
50 2017-02-500 Evaluating After-School All Stars (ASAS) Philadelphia
51 2017-02-501 SHARP and SIHLE
52 2017-03-502 Exploring African American High School Age Males' Perceptions of Agricultural Related Youth Programs in Urban Settings
53 2017-03-503 Healthy Schools Evaluation 54 2017-03-504 National Longitudinal Transition Study of 2012 (NLTS 2012) Phase II Transcript Collection 55 2017-03-505 Evaluation of Mural Arts Program's Arts Integration Program Year 2
35

Ongoing External Research
36

Ongoing Proposal Title
1 201511356 Evaluation of Philadelphia Education Fund's Early Warning System Program
2 201601404 Students' Experiences and Perceptions Related to the College Culture at their Urban High School
3 201505360 Comparison of Behavior/Academic Performance in Big Brothers Big Sisters Site-Based Participants and Non-Participants in Philadelphia Public Schools
4 201207096 21 st CCLC Cohort 6 Data of Five Philadelphia Schools for PPI CS, PA Grantee Report System and Yearly Evaluation by Bucks County Intermediate Unit #22
5 201605433 Social-motor Functioning in Autism Spectrum Disorder
6 201207099 Targeting School Climate & Children’s Behavioral Health in Urban Schools
7 201509381 A Hybrid Effectiveness-Implementation Trial of Group CBT in Urban Schools
8 201606447 Evaluation of The Claymobile Outreach Programing in Philadelphia Public Schools (K-12)
9 201401264 McMichael's School Improvement Process and Sustainability: What Can a University-Assisted School Strategy Provide?
10 201409308 Creating an Early Childhood Education System in West Philadelphia
11 201507378 School Justice Collaboration Program: Keeping Kids in School and Out of Court
12 201511399 Action for Early-Learning Early Childhood Initiative: Community Innovation Zone Grant
13 201605436 A Comparison of the Effectiveness of Drexel University’s EAT.RIGHT.NOW. High School and Cooking Club Curricula
14 201411318 AT&T Aspire High School Success Initiative Program Evaluation, College Possible - Philadelphia
15 201510390 Closing the Achievement Gap for Low-Income Students through Non-Cognitive Skill Development
16 201310246 National College Ready Survey
17 201412328 Head Start Family and Child Experiences Survey (FACES) 2014-2018
18 201309239 Growing Together: University-Assisted Community Schools Partnerships Using Community Food Systems as a Context for Youth Empowerment
19 201401263 Life Skills Training Program: Pre/Post Test Evaluation Tool
20 201203074 LEGACY Together: Strengthening Afterschool Programs
21 201602413 BE PROUD! BE RESPONSIBLE! BE PROTECTED! and HYPE in Philadelphia (BE-HIP)
22 201008055 Ongoing Analysis of Student Academic Performance in grades 6-12, progress towards high school graduation, and College Matriculation of Project Forward Leap participants in the
School District of Philadelphia 23 201406294 Efficacy of ALEKS for Improving Student Algebra Achievement
24 201407296 Evaluation of the Carnegie Corporation's Opportunity by Design Initiative
25 201605441 Evaluation of Philadelphia Academies, Inc.'s All-Academy High School Model
26 201606448 Drexel University's 21st Century Community Learning Center Evaluation
27 201504353 Youth risk and the youth risk behavior survey: Homelessness in Philadelphia
28 201511394 Philadelphia Postsecondary Pathways
29 201410314 CAREER: Algebraic Knowledge for Teaching in Elementary School: A Cross-cultural Perspective
37

30 201606445 The Situated Cognitions and Practices of Teachers and Teacher Candidates Who Participated in a Foundational Course on Teaching English Learners
31 201605439 Families and Schools Together: An Innovative, Targeted Strategy for Removing Key Barriers to School Turnaround
32 201402274 Study of TWI program at Southwark Elementary
33 201408304 Multimodal Composing in High School Makerspaces: Understanding Relationships between 21st Century Standards, Writing, and Media Production
34 201412331 The Use of Teach Town Technology in Autism Support Classrooms
35 201507366 Comprehensive Examination of the Kindergarten Classroom Engagement scale
36 201507377 Civic Opportunities for Philadelphia High School Students
37 201604427 Autism Intervention Research - Behavioral 3
38 201605432 The Effect of School-Based Behavioral Health Programs on Children's Behavioral Health Functioning and School Outcomes
39 201502340 Team Functioning in School Mental Health Teams
40 201606450 ZOO/ Efficacy Evaluation of Zoology One: Kindergarten Research Labs
41 201501337 Elementary School Excellence Study
42 201605435 Influence of Intercultural Experiences Abroad on Urban High School Students
43 201606449 Perceptions of General and Special Education Teacher's Self-efficacy in Inclusive Settings
44 201503346 Supporting and Exploring Urban Teachers' Incorporation of iPads for Teaching and Learning
45 201605440 Developing and Implementing an Integrated STEM Curriculum
38

Recent Study Summaries
39

Early Literacy Specialists (ELS) in SDP
Program Implementation and Student Literacy Gains, 2015-2016 SY
This brief summarizes the findings of a mixed-methods study conducted by the Office of Research & Evaluation (ORE), which focused on Year 1 implementation of the literacy coaching initiative. Specifically, the study examined the impact of Early Literacy Specialist (ELS) coaches on K-3 teachers’ experiences and students’ literacy outcomes.
Study Overview The literacy coaching initiative is part of a three-year district-wide plan to provide high-quality literacy instruction to all students. Starting with the lowest performing elementary schools in Year 1 (2015-16SY), SDP is adding ELS coaches to schools each year until all schools serving K-3 students have a coach. In fall 2015, funded in part by a grant from the William Penn Foundation, 58 SDP schools had an ELS coach. The Year 1 implementation study sought to understand the role of ELS coaches on students’ reading levels and the experiences of teachers, coaches, and principals at ELS schools.
Why is this study important to SDP?
Literacy coaching is an effective professional development model,especially for teachers working in urban districts (Blackowicz et al.,2005; Cantrell & Hughes, 2008; Marsh et al., 2008; Sailors & Price, 2010).In particular, literacy coaching has been found to be an effective way tomitigate some of the harmful effects of high teacher and student turnoverendemic to large, urban school districts (Allensworth, et al., 2009;Reichardt, 2008)
Literacy coaching is linked to increases in early literacy outcomes.Results from a four-year longitudinal study of a literacy coachingprogram found students in Kindergarten to 2nd grade experiencedliteracy gains that were 16% higher in Year 1 and 32% higher in Year 3than literacy growth in the baseline year (Biancarosa et al., 2010).
Anchor Goal 2 (in Action Plan 3.0) is that 100% of 8-year olds willread on grade level. We wanted to explore the impact of ELS as astrategy for encouraging early literacy growth since this is the first timethat ELS was implemented in SDP schools.
What do ELS coaches do?
ELS coaches support students by… Promoting and
supporting theimplementation ofresearch-based teachingpractices for literacy
Improving teachercontent knowledge,instructional practices,classroomenvironments andclassroom structure
Providing content- focused coaching andresources
Sample Snapshot
Schools: 58 K-3 Students: 14,337
Students in the sample were: %
Asian 4% Black 53% Latino 29% Other 8% White 6% Female 48% Male 52% Special Education
9%
ELL 12%
STUDY SUMMARY Anchor Goal 2
40
Year 1 Findings
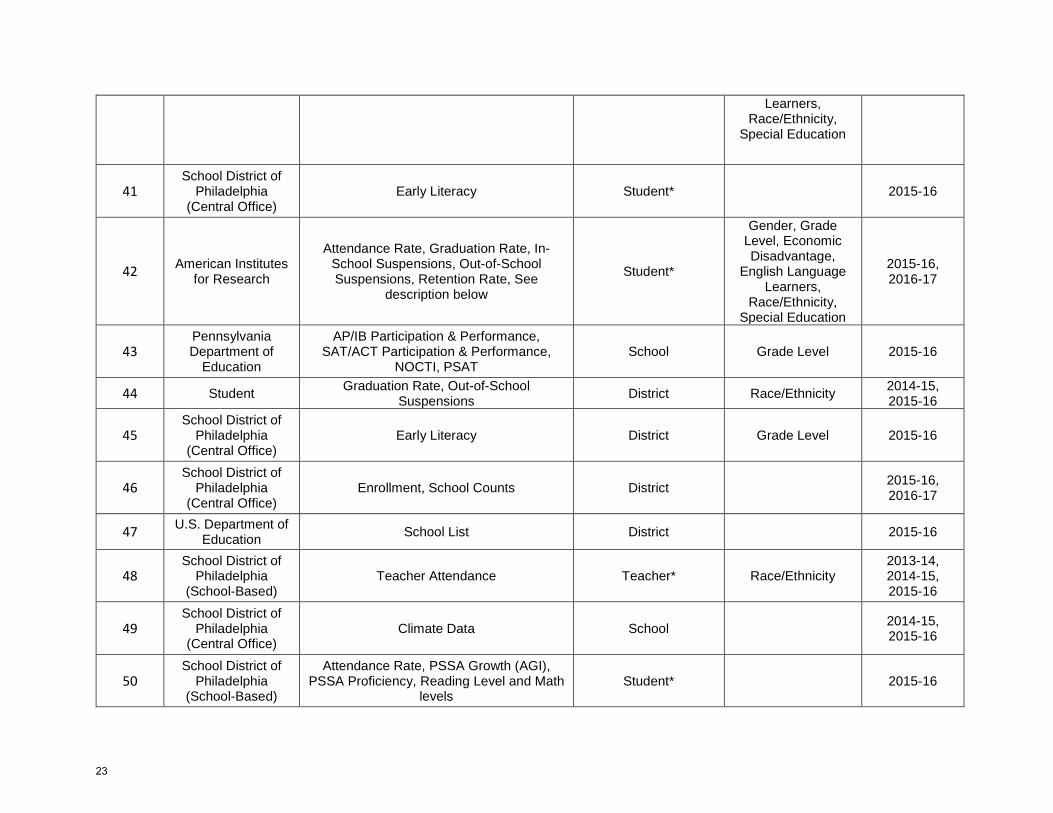
The percent of kindergarteners in ELS Schools identified as needing Tier 2 support decreased from 56% to 46% from Fall 2015 to Spring 2016 (blue bars). Because student performance is expected from Fall to Spring, we also find that fewer kindergarteners in non-ELS schools were identified for Tier 2 support (red bars). However, the change in non-ELS schools was not as large as the change in ELS schools.
Similarly, the percent of third-grade students in ELS schools identified as needing Tier 3 support (as measured by the Reading Curriculum-Based Measurement (R-CBM)) decreased from 45% in Fall 2015 to 42% in Spring 2016. During the same time period there was a slight increase in the percent of students in non-ELS schools identified for Tier 3 support. A slightly higher percentage of students in both ELS and non-ELS schools were identified for Tier 3 support on the Winter R-CBM assessment as compared to the Fall R-CBM assessment.
Conversely, the percent of first and second grade students identified as needing Tier 3 support increased across the school year for both ELS and non-ELS schools. More research is needed to understand the factors related to the performance of first and second grade students.
The ELS teacher focus groups revealed that the ELS teachers felt that their coach was knowledgeable and able to provide a wide-range of supports. One teacher summarized her feelings this way:
“I feel like whatever we knew that we needed help with we were able to express that to them, and then they were able to come through with that type of support.”
56% 53% 46%46% 45% 41%
0%
50%
100%
Fall-LNF Winter-LNF Spring-LNF
ELS Schools (Kindergartners) Non-ELS Schools (Kindergartners)
45% 46% 42%31% 34% 33%
0%
50%
100%
Fall-RCBM Winter-RCBM Spring-RCBM
ELS Schools (3rd Graders) Non-ELS Schools (3rd Graders)
32%45% 47%
24% 35% 36%
0%
50%
100%
Fall-RCBM Winter-RCBM Spring-RCBM
ELS Schools (1st Graders) Non-ELS Schools (1st Graders)
41

K-3 Reading Specialists
Program Implementation and Student Literacy Gains, 2015-2016 SY
Program Features
During the 2015-2016 School Year (SY), the School District of Philadelphia (SDP) introduced Reading Specialists to 18 elementary schools.
The Reading Specialist program aims to provide an additional level of early literacy support to Kindergarten to third grade students who are significantly behind their expected reading level.
Reading Specialists worked with their targeted students at least weekly in small groups using specially designed lesson plans that use best practices to scaffold student learning in order to address deficiencies in reading, writing, phonics, and word study.
Sample Snapshot
Schools: 18
Total Students Seen: 870
69 Kindergarteners
311 First Graders
285 Second Graders
205 Third Graders
STUDY SUMMARY Anchor Goal 2
This brief summarizes the findings of a quantitative study conducted by the Office of Research & Evaluation (ORE) that focused on the relationship between receiving Reading Specialist support and students’ early literacy outcomes.
Guiding Research Questions Two main research questions were the focus of the study: 1. Is there a relationship between working with a Reading Specialist and
student literacy outcomes as measured by DRA scores?2. Are students who are receiving Reading Specialist support demonstrating
improvement in their tiered intervention level as measured by AIMSwebtiers?
Why is this study important to SDP?
With a particular expertise in teaching literacy, Reading Specialists arewell-positioned to select the research-based instructional approachthat works best for specific literacy issues such as decoding orcomprehension. This should increase the likelihood of positive outcomes andideally begin closing the gap between low-level and on-target readers.
The differentiation of instruction provided by the Reading Specialistsremoves the burden of intensive intervention from the teacher and thus,all students in the class should be more likely to reach their full readingpotential (Connor & Morrison, 2016).
Reading Specialists provide individualized student instruction (ISI),which has proven to be highly effective in improving literacy levels ofstudents in grades Pre-K to third (Conner & Morrison, 2016). The resultsof Connor et. al.’s 2013, cluster-randomized controlled, longitudinal efficacystudy provides evidence that individualized reading instruction is moreeffective in improving students’ reading skills than instruction of similarquality that is not individualized and that the benefits accumulate over timein early elementary students.
Anchor Goal 2 from the District’s Action Plan 3.0 is that 100% of 8-yearolds will read on grade level. This study examines the Reading Specialistsprogram as a strategy for expediting the early literacy growth of strugglingreaders.
42

Findings
61% of K-3 students who worked with a Reading Specialist demonstrated at least one academic year of growth according to Fall 2015 and Spring 2016 DRA2 scores, regardless of their baseline reading level. As grade level increased, the percent of students making at least one academic year of growth increased.
Grade N Percent of Total
Kindergarten (n=27) 1 4%
First (n=181) 74 41%
Second (n=172) 118 69%
Third (n=131) 105 78%
Grand Total (n=515)* 298 61%
*In total, 515 students had both baseline and summative DRA2 data.
According to DRA2 scores, the percent of third-grade students identified as needing Intensive Intervention decreased 16% from Fall 2015 to Spring 2016 and 5% of students moved to At Target during the same time period. A small percentage of second graders also saw some positive movement between tiers from Fall 2015 to Spring 2016.
Kindergarten First Grade Second Grade Third Grade
Fall Spring Fall Spring Fall Spring Fall Spring
At Target 81%* 8% 0% 0% 0% 1% 0% 5%
Strategic
Intervention 19% 67% 42% 6% 1% 3% 2% 13%
Intensive
Intervention NA* 25% 58% 94% 99% 96% 98% 82% *Kindergarten students can only be identified as At Target or Strategic intervention for the first marking period
According to student performance on the AIMSweb Letter Naming Fluency assessment (LNF), the percentage of Kindergarten students requiring a Tier 2 or 3 intervention decreased from Fall 2015 to Spring 2016. According to student performance on the AIMSweb Reading Curriculum-Based Measure (R-CBM), the percentage of second and third grade students requiring Tier 3 intervention also decreased from Fall 2015 to Spring 2016.
90%79%
96%85%
100%83%
100%88%
99%84%
66%53%
94%
67%
99%87%
100%86%
94%78%
At LeastTier 2
Tier 3 At LeastTier 2
Tier 3 At LeastTier 2
Tier 3 At LeastTier 2
Tier 3 At LeastTier 2
Tier 3
Kindergarten LNF First Grade NWF First Grade R-CBM Second Grade R-CBM Third Grade R-CBM
Fall Spring
43

Factors Associated With 9th Grade Success:
Analysis of First Time 2011-2012 9th Graders in SDP
This brief summarizes preliminary findings of a study that is currently being conducted by the Office of Research & Evaluation (ORE) which: (1) examines factors related to higher and lower graduation rates; and(2) gives focused attention to factors related to the successful completion of 9th grade. The full analysis is in progress.
Study Overview For a previous cohort (9th grade students in the 2010-2011 school year), ORE used administrative data to explore connections between CTE participation and graduation rates. The results of that study revealed that 9th grade represented a critical crossroads for all students (regardless of CTE participation), and that on-time promotion to 10th grade is a powerful predictor of eventual high school graduation. This follow-up study examines a new cohort (9th grade students in 2011-2012), and expands the analysis to identify factors that may help to identify students at risk of not successfully completing 9th grade or graduating high school in four years.
Why is this study important to SDP? Research has found that the 9th grade year is “high leverage,”
having a greater impact on graduation rates than other years(Neild et al, 2008; Neild, 2009; Career and Technical Education(CTE) Program Evaluation, Office of Research and Evaluation,2015).
Anchor Goal 1 from the District’s Action Plan 3.0 is that 100%of students will graduate ready for college and career. Studentsfall “off track” for different reasons, and therefore require differentsupports. Identifying the best support for each situation requires adeeper understanding of the factors that influence 9th gradesuccess, and how those factors interact with each other. It may bepossible in some cases to identify potential problems earlier, and torespond while obstacles are more manageable.*All references available in the full report.
What is on-time promotion to 10th grade?
To satisfy all requirements for promotion to 10th grade, SDP 9th graders must pass eligible courses in English, math, science, and social studies, and accumulate 5 total credits.
What is on-time high school graduation?
Students are expected to graduate from high school in four years. As first-time 9th graders in 2011-2012, students in this cohort were expected to graduate in 2015-2016.
Sample Snapshot
Time Period: 2011-2012 to 2015-2016 School Years Schools : 55 (SY 2011-2012) Students: 9,144
Students in the sample were: %
Asian 9 Black 56 Latino 18 Other 2 White 15
Female 49 Male 51
Special Education
17
ELL 9
STUDY SUMMARY Anchor Goal 1
44

Findings
9th Grade Success Predicts
Continued Success:
5,578 of 7,335 (76%) 9th
graders that earned at least 5
credits were still enrolled in
the district three years later,
compared with 48% of those
that earned 3-4.9 credits, and
only 37% of those that earned
3 credits or less.
Students that earned more
credits in 9th grade also
earned more credits in
subsequent years.
9th Grade Success is, in Turn,
Predicted by: Being female, or not
having LEP or Free from Tape status.
Also, success in 9th grade is related to
higher 8th Grade attendance, and
higher PSSA math and reading scores.
8th Grade Warning Indicators Predict Success in 9th Grade – But Not Entirely:
8th grade warning indicators include: Male, LEP, Free from Tape, Low average daily attendance
(ADA), and poor PSSA scores.
Many 9th grade students with 8th grade warning indicators struggle, but many others are promoted to
10th grade. Thus, 8th grade administrative data do not reliably distinguish which students will
overcome the 8th grade risk factors from those who will not.
However, this uncertainty drops quickly once 9th grade begins. Low first quarter 9th grade course
marks are reliable identifiers of students that are likely to fall off track.
Conclusions/Recommendations
Combined with previous research, the early findings from this study reinforce the conclusion that 9th
grade success is key to smooth progress through high school, and timely graduation.
Prior to beginning high school, 8th grade data can be used to identify an initial list of students that are
more likely to struggle in 9th grade. Providing supports to these students early in their high school
career may support successful school completion.
Early academic struggle strongly predicts continuing struggle, so the initial list of students should be
refined and revised as early as possible once 9th grade begins.
n=7335
n=6545 n=5994 n=5578
n=721n=543
n=451 n=343
n=776
n=494
n=383
n=285
0.00
1.00
2.00
3.00
4.00
5.00
6.00
7.00
8.00
2012-2013 2013-2014(Expected
10th grade)
2014-2015(Expected
11th grade)
2015-2016(Expected
12th grade)
Ave
rage
Nu
mb
er o
f C
red
its
Earn
ed
Students That Succeed In 9th Grade Continue to Earn More Credits Each Year
9th Grade On Track (5+ credits)
9th Grade Off Track (3-4.9 credits)
9th Grade Severely Off Track (< 3 credits)
45

Climate Initiatives in SDP: School-wide Positive Behavioral
Interventions and Supports (SWPBIS) and Restorative Practices (RP)
This brief summarizes the findings of a study conducted by the Office of Research & Evaluation (ORE) that reported on two initiatives in the District designed to enhance school climate: School-wide Positive Behavior Interventions and Supports (SWPBIS) and Restorative Practices (RP).
Study Overview ORE conducted an evaluation of SWPBIS in 31 District schools and RP in 14 District schools that focused on fidelity of implementation as well as student outcomes.
Fidelity of implementation was assessed using the School-Wide Evaluation Tool (SET). The SET assesses the following seven areas: (a) expectations defined, (b) behavioral expectations taught, (c) acknowledgement procedures, (d) correction procedures, (e) monitoring and evaluation, (f) management, and (g) district-level support. Fidelity of implementation is met when a school scores at least 80% on the future behavioral expectations taught, as well as an overall mean score of 80%. Student outcomes reported included attendance, suspensions, office disciplinary referrals, district-wide survey results, and PSSA achievement levels.
Why is this study important to SDP? The District has undertaken a variety of school-level and District-wide initiatives to develop and maintain positive school climate. Collectively, these are characterized by a move away from punitive, one-size-fits-all disciplinary practices (e.g., zero-tolerance suspension policies), and towards practices designed to address behavioral problems on an individualized basis.
Important student outcomes that are conceptually related to strong implementation of SWPBIS and RP include:
Possible increase in student attendance Decrease in suspension rate Decrease in the number of expulsions Decrease in the number of office disciplinary referrals Improved perception of school climate Possible gains in achievement
What are SWPBIS and RP?
School-wide PositiveBehavioral Interventionsand Supports (SWPBIS) is aframework designed toenhance students’understanding ofexpectations of studentbehavior in all aspects ofschool.
Restorative Practices (RP) isa framework that focuses onrepairing relationships andmaking people accountablefor their actions, rather thanassigning blame andpunishment. It allows thevoices of students andteachers to be heard, and forthose harmed to expressthemselves.
The goals of both initiativesinclude a decrease inproblem behaviors, adecrease in officedisciplinary referrals andsuspensions, increasedstudent engagement(including increased studentattendance), and increasedstudent perception of schoolsafety.
STUDY SUMMARY Climate
46

Selected Findings
Increases in Fidelity of Implementation and Positive Outcomes By the end of 2015-2016, more SWBPIS schools met the fidelity of implementation
requirements as compared to the 2014-2015 school year. Data indicate that most schools
implemented with fidelity after one year of full implementation.
Most schools across both SWPBIS and RP programs had an increase in student attendance.
For schools implementing SWPBIS, more schools in the 2015-2016 school year experienced a
decrease in their suspension rates compared to the previous year
District-wide survey results indicated that teachers in SWPBIS schools reported improvements
in bullying from 2014-2015 to 2015-2016, compared with non-SWPBIS schools, indicating that
SWPBIS may influence perception of school climate.
Factors Supporting Fidelity of Implementation
As part of the study, District Staff have identified factors that may support robust
implementation of SWPBIS. These include strong implementation teams, principal support, and
data-driven decision making.
Fidelity of implementation data suggest a difference in the types of coaching (District vs.
external coaches). District coaches who spend more time in the schools may be better able to
establish relationships that are more suitable for strong, sustained program implementation.
Continued Challenges from 2014-2015 to 2015-2016 School Year
Qualitative study data revealed inconsistent principal buy-in across SWPBIS and RP schools. In
addition, several changes of leadership, particularly in the schools implementing RP, have
contributed to lack of consistency with program implementation.
Inconsistency with fidelity measures also continues to be a challenge. There is not an
established fidelity measure for RP.
47
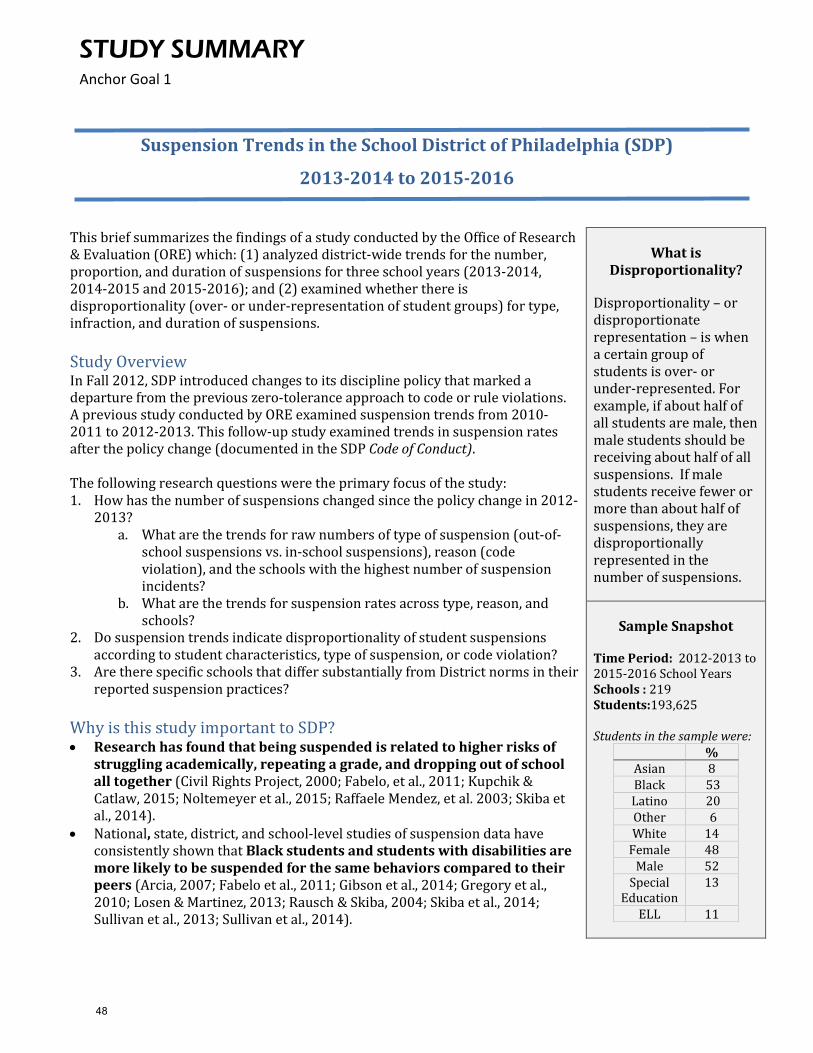
Suspension Trends in the School District of Philadelphia (SDP)
2013-2014 to 2015-2016
This brief summarizes the findings of a study conducted by the Office of Research & Evaluation (ORE) which: (1) analyzed district-wide trends for the number, proportion, and duration of suspensions for three school years (2013-2014, 2014-2015 and 2015-2016); and (2) examined whether there is disproportionality (over- or under-representation of student groups) for type, infraction, and duration of suspensions.
Study Overview In Fall 2012, SDP introduced changes to its discipline policy that marked a departure from the previous zero-tolerance approach to code or rule violations. A previous study conducted by ORE examined suspension trends from 2010-2011 to 2012-2013. This follow-up study examined trends in suspension rates after the policy change (documented in the SDP Code of Conduct).
The following research questions were the primary focus of the study: 1. How has the number of suspensions changed since the policy change in 2012-
2013?a. What are the trends for raw numbers of type of suspension (out-of-
school suspensions vs. in-school suspensions), reason (codeviolation), and the schools with the highest number of suspensionincidents?
b. What are the trends for suspension rates across type, reason, andschools?
2. Do suspension trends indicate disproportionality of student suspensionsaccording to student characteristics, type of suspension, or code violation?
3. Are there specific schools that differ substantially from District norms in theirreported suspension practices?
Why is this study important to SDP? • Research has found that being suspended is related to higher risks of
struggling academically, repeating a grade, and dropping out of school all together (Civil Rights Project, 2000; Fabelo, et al., 2011; Kupchik & Catlaw, 2015; Noltemeyer et al., 2015; Raffaele Mendez, et al. 2003; Skiba et al., 2014).
• National, state, district, and school-level studies of suspension data haveconsistently shown that Black students and students with disabilities are more likely to be suspended for the same behaviors compared to their peers (Arcia, 2007; Fabelo et al., 2011; Gibson et al., 2014; Gregory et al., 2010; Losen & Martinez, 2013; Rausch & Skiba, 2004; Skiba et al., 2014; Sullivan et al., 2013; Sullivan et al., 2014).
What is Disproportionality?
Disproportionality – or disproportionate representation – is when a certain group of students is over- or under-represented. For example, if about half of all students are male, then male students should be receiving about half of all suspensions. If male students receive fewer or more than about half of suspensions, they are disproportionally represented in the number of suspensions.
Sample Snapshot
Time Period: 2012-2013 to 2015-2016 School Years Schools : 219 Students:193,625
Students in the sample were: %
Asian 8 Black 53 Latino 20 Other 6 White 14
Female 48 Male 52
Special Education
13
ELL 11
STUDY SUMMARY Anchor Goal 1
48

• Anchor Goal 1 from the District’s Action Plan 3.0 is that 100% ofstudents will graduate ready for college and career. To support allstudents, it is important to determine whether the negative impacts ofsuspension policies are disproportionately impacting historicallymarginalized and underserved student populations.*All references available in the full report.
Types of Disporportionality
Disproportionality can manifest as more frequent suspensions, but also as harsher (OSS vs ISS), or longer suspensions.
Findings – Three-Year Trends Overall Suspensions • The total number and the rate of suspensions
(per students enrolled) decreased from 2013-2014 to 2015-2016.
• The proportion of out-of-school suspensions(OSS) versus in-school suspensions (ISS)increased. This appears to reflect a pervasiveelimination of ISS across the District.
• Most schools that issued suspensions did notreport using ISS at all, despite the stipulations inthe Code of Conduct that in-school interventionsbe used for certain violations. It is not known ifthis means that schools are not using ISS, if theyare under-reporting them, or if there is somecombination of both.
Disproportionality of Suspensions A risk ratio of 2.00 (double the risk), is a common marker of disproportionality. Risk ratios show consistent disproportionality for SDP students that were male, African American, or had a disability. These groups were more likely to be suspended compared to their peers (i.e., females, non-African Americans, students without disabilities). Moreover, the risk for African Americans increased each year.
Disproportionality of Duration of Suspensions • Per the Code of Conduct, some infractions should only result in ISS (minor), some in OSS (major), and some
in either ISS or OSS (moderate).• Length of OSS for moderate infractions remained unchanged, but there was a decrease in the length of OSS
for both minor and major infractions.• Compared to male students, female students received longer suspensions for aggressive behaviors such as
fighting and assault during 2013-2014 through 2015-2016.• African American and Hispanic/Latino students were suspended longer for the same infractions compared
to their White and Asian peers. However, the number of infractions where this disproportionality wasapparent declined slightly during the three-year period.
00.020.040.060.08
0.10.120.14
2013-2014 2014-2015 2015-2016
Suspension Rates Have Declined
OSS Per 100 Enrolled Days ISS Per 100 Enrolled Days
2.91
2.06
1.99
2.79
2.34
2.09
2.53
2.1
1.91
African American Students
Students with Disabilities
Male Students
Groups With High Risk Ratios for Being Suspended
2013-2014
2014-2015
2015-2016
49
The School District of Philadelphia (SDP) Year 2 Report On Transformation Schools
This brief summarizes selected findings from a study conducted by the Office of Research & Evaluation (ORE), which examined student outcomes for students enrolled in the two Transformation Schools after two years of operation.
Why this Study Blaine and Kelley are District neighborhood schools located in North Philadelphia that primarily serve high poverty students in grades K-8. Historically, both schools have performed below District average for all subjects measured in the PSSA (math, reading, science, and writing), and in the 2012-2013 school year (SY), they each experienced an increase in student enrollment due to nearby school closures. In order to address these challenges through the Transformation School Funding opportunity, the principal and a team of staff and teachers at each school developed a School Transformation Plan, which outline several core strategies for increasing academic performance over a five-year period, with an emphasis on building capacity in the first three years to allow for sustained changes. This study investigates the progress made towards meeting the goals outlined by each school’s Transformation plan.
What We Studied This study examined Transformation School student outcomes after their second year of operation. When possible, researchers used school level data for other K-8 schools in the same Learning Network as Blaine and Kelley, Neighborhood Network 4 (NN4), as a point of comparison. Three primary research questions were the focus of this evaluation:
1.) From baseline (2013-2014) to the end of Year 2 (2015-2016), how does school-level climate data (attendance and suspensions) for Blaine and Kelley compare to that of other K-8 elementary schools in Neighborhood Network 4?
2.) From baseline to the end of Year 2, how does school-level academic achievement data for Blaine and Kelley compare to that of other K-8 elementary schools in Neighborhood Network 4?
3.) How does student and teacher District-wide survey feedback from the Transformation schools compare to other schools in Neighborhood Network 4? What are the year-to-year trends?
Findings
Transformation Schools
In 2013, the Philadelphia School Partnership (PSP) offered funding to District schools
interested in implementing a turnaround plan to dramatically increase student achievement.
From the ten schools that applied, PSP awarded James G. Blaine (Blaine) and William D.
Kelley (Kelley) funding to support the development and
implementation of their “transformation plans,” which
aim to increase academic outcomes by enhancing school climate, updating curriculum
and instruction, and implementing a professional
development plan that focuses on the recruitment and training
of mission-aligned teachers.
Transformation Schools Student Demographics
In the 2015-16 SY, Transformation School students
were (n=892*):
Black 92% Hispanic/Latino 2%
Other 5% White 1%
Female 48% Male 52%
Special Education 19% ELL <1%
*Only students enrolled for at least 10 days, based on last school of
record.
• After two years, neither school saw improvements in average daily attendance (ADA). However, ahigher percentage of Blaine and Kelley students attended 95% or more of enrolled days in 2015-2016 compared to those at the other NN4 schools (38%, 37% and 35%, respectively). At Kelley,there was an improvement in this metric from the baseline year (26%) to the 2015-2016 SY(37%).
STUDY SUMMARY
50

• In 2015-2016, both Blaine and Kelley had more suspensions compared to the other NN4 schools(171, 241 and 162, respectively) and a greater percentage of students with at least onesuspension compared to the other NN4 schools (17%, 23% and 13%, respectively).
• At both schools, there were decreases in the percentage of students scoring proficient oradvanced on the reading/ELA (from 25% to 14% at Blaine and 23% to 16% at Kelley) and math(from 28% to 5% at Blaine and 31% to 5% at Kelley) PSSAs after two years. At Kelley, there wasan increase in the number of students scoring proficient on the science PSSA (16% to 29%).
• With the exception of Blaine science PSSA scores, the percentage of students scoring proficient oradvanced on the ELA, math, and science PSSAs in 2015-2016 was the about the same or bettercompared to the average across the NN4 schools. The percent proficient or advanced on ELAranged from 13% (NN4 average) to 16% (Kelley average). For math, the percentage at bothTransformation schools was 5%, compared to 6% at the NN4 schools.
• Compared to the other NN4 schools, there was a smaller percentage of K-2 students at Blaine andKelley requiring strategic (Tier 2) or intensive (Tier 3) reading interventions.
Blaine Kelley Other NN4 Schools Grade K 44% in Tiers 2 & 3 50% in Tiers 2 & 3 53% in Tiers 2 & 3 Grade 1 55% in Tiers 2 & 3 73% in Tiers 2 & 3 76% in Tiers 2 & 3 Grade 2 68% in Tiers 2 & 3 55% in Tiers 2 & 3 74% in Tiers 2 & 3 Grade 3 75% in Tiers 2 & 3 78% in Tiers 2 & 3 76% in Tiers 2 & 3
• A larger percentage of K-2 students at Blaine and at Kelley made at least one year of readinggrowth compared to the NN4 schools (77%, 72% and 56%, respectively).
Student and teacher survey responses about climate, instruction, and leadership varied Blaine Kelley
Survey Construct Scores&
Did the Metric Change From 2014-2015 to 2015-2016
How Does Blaine 2015-2016 Data
Compare to Other NN4 K-8 Schools*
Did the Metric Change From 2014-2015 to 2015-2016
How Does Kelley 2015-2016 Data
Compare to Other NN4 K-8 Schools*
Student Survey Climate Score
Yes, decreased Worse than NN4 K-8 schools
N/A^ N/A
Teacher Survey Climate Score
No change Better than NN4 K-8 schools
No change The same as NN4 K-8 schools
Student Survey Instruction Score
Yes, decreased Worse than NN4 K-8 schools
N/A N/A
Teacher Survey Instruction Score
Yes, increased The same as NN4 K-8 schools
No change Worse than NN4 K-8 schools
Teacher Survey Leadership Score
Yes, decreased Better than NN4 K-8 schools
Yes, decreased Worse than NN4 K-8 schools
&Scores are based on the percentage of respondents selecting the most positive response. Selecting the most positive response refers to respondents who chose the most positive answer to that question. *Differences must be greater than 1 percentage point.^N/A means that the response rate was not high enough for answers to be reported.
Conclusion After two years, there are some improvements and some declines at each of the two Transformation schools. The largest success appears to be in the movement of students out of Tier 2 and 3 reading levels, but the trend is not consistent across grades. An additional year of data will be useful in identifying trends across years, as well as any relationship between survey data and student outcomes.
51

The School District of Philadelphia (SDP)
Report on Survey Data from Cohort 1 Redesign Schools
This brief summarizes selected findings from a study conducted by the Office of Research & Evaluation (ORE), which focused on two-year trends in District-wide survey data for four schools. These four schools are part of the School Redesign Initiative (SRI), an initiative that supports schools in the development and implementation of strategies aimed at school-wide improvement. The Cohort 1 SRI schools include one middle school (Tilden) and three elementary schools (Arthur, Carnell, and Jenks Arts & Sciences).
Study Overview As part of the SDP’s District-wide survey program, ORE administers surveys to students, parents/guardians, and teachers at District and Charter schools in the spring of each school year. The surveys are designed to measure five key topics (or “constructs”) related to school improvement: Climate, Instruction, Leadership, Professional Capacity, and Parent/Guardian Community Ties. In this brief, two constructs (Climate and Instruction) and their corresponding sub-constructs are examined. Due to low parent/guardian response rates, the study focuses on student and teacher survey feedback.
Two primary research questions were: 1. What are the trends in survey response rates over the past two
years at SRI schools? How do these rates compare to overallresponse rates across the District?
2. What are the two-year trends for student and teacher responsesat SRI schools to survey items relating to Climate? What are thetwo-year trends for student and teacher responses at SRI schoolsto survey items relating to Instruction?
Why is this study important to SDP? The redesign plans for all four SRI schools included strategies that align to the five constructs measured on the District-wide surveys. Therefore, the trends in the data over the past two years are a useful tool for tracking changes and progress toward goals for the SRI schools that cannot be measured by other administrative data (e.g. student attendance, suspensions, and academic performance). In addition, the District-wide surveys provide information from multiple perspectives, which can help inform improvement efforts.
School Redesign Initiative (SRI)
In the summer of 2014, SDP launched the School Redesign Initiative, an opportunity for
teams of teachers, administrators, parents, and
community members to develop and submit
comprehensive proposals for redesigning their schools. After
a multi-step application process, four schools each
received $30,000 to put their plan into action.
Cohort 1 SRI Schools
• Four schools, diverse insize and location: Tilden,Arthur, Carnell, and JenksArts & Sciences (A&S).
• Student populations ateach of the four schoolsare predominantly Blackand Hispanic/Latino andthree of the schools haveover 60% of studentsreceiving free lunch.
• Two of the schools havesubstantial English learnerpopulations (18% atCarnell and 14% atTilden).
• While over 10% ofstudents at all schools inthe District havedisabilities, Arthur has thelargest population amongthe SRI schools, withalmost a quarter ofstudents having adisability.
STUDY SUMMARY School Redesign Initiative
52

Findings Overall trends in response rates over the past two years:
• All four SRI schools saw increases in their student response rates in 2015-2016 and had studentresponse rates above the overall District and Charter average (50%). Approximately 90% ofstudents at both Carnell and Jenks A&S completed the survey in 2015-2016.
• While all four SRI schools also increased their parent/guardian response rates in 2015-2016,they remained low at three of the four schools. Arthur had the highest parent/guardian responserate at 29%, which was more than double the District and Charter average of 13%, (still a lowsurvey response rate).
• Similar to the overall District and Charter trend, teacher response rates at two of the four SRIschools decreased in 2015-2016 (Arthur and Tilden). The two schools with increased teacherresponse rates (Carnell and Jenks A&S) were also above the 2015-2016 District and Charteraverage (51%).
Two-year trends in student and teacher responses to Climate and Instruction questions: • Students at two of the four SRI schools (Tilden and Carnell) indicated low percentages of positive
responses on the Safety/Building Conditions sub-construct (32% and 43%, respectively).• Teachers at three of the four SRI schools reported fewer challenges at all levels (External, School-
level, and Classroom level) in 2015-2016 compared to 2014-2015. The one exception was at JenksA&S, where there was a six-percentage point decrease in teachers selecting the most positiveresponses regarding External challenges, meaning a perceived increase in External challenges.
• Overall, Tilden teachers’ responses show the most positive change across years for all threelevels of Challenges. However, Jenks A&S had the largest percentage of teachers responding mostpositively for all Challenge sub-constructs in both school years.
• Two of the four schools saw a change in the percentage of students responding most positively toInstruction related questions. There was an eight-percentage point increase at Arthur and a two-percentage point decrease at Jenks A&S.
• For both school years, students at Tilden were the least likely (47%) to answer most positively toInstruction related questions (versus 58% at Jenks A&S, 65% at Carnell, and 66% at Arthur).
• Responses from SRI teachers indicated a clear difference in the percentage of most positiveresponses between the two Instructional sub-constructs. While the percentage of teachers at allfour schools selecting the most positive response to questions relating to the Teaching andLearning sub-construct ranged from 76-83% in 2015-2016, the range of most positive responsesfor questions in the Student Engagement construct was much lower, ranging from 37-48%.
Conclusion After one year of implementation, the available survey data provides no indication of any strong performance trends across the SRI schools or across stakeholders. This is not unexpected during the early phases of implementation. That said, higher survey response rates are needed to best use survey data to monitor and inform the implementation of the school redesign plans. With higher response rates in the future, trends in Climate and Instruction data can be compared across stakeholder groups as well as across years.
53

The School District of Philadelphia (SDP)
Year 2 Report On Three New High Schools
This brief summarizes selected findings from a study conducted by the Office of Research & Evaluation (ORE), which examined student outcomes for students enrolled in the three New Schools after two years of operation. All three schools opened in September 2014.
Why this Study The mission and vision of all three New Schools are informed by evidence-based design principles for high performing high schools that support rigor and mastery of standards, youth development, personalization, and community-connected school environments. The goal of opening these schools in Philadelphia was to design new high schools that would engage and support the city’s most underserved students. This study is designed to identify if and to what degree the New Schools are making progress towards meeting this goal.
What We Studied This study examined New School student outcomes after their second year of operation. Three primary research questions were the focus of this evaluation:
Across and within the first two years, what enrollment and/or retentionpatterns emerge (including student characteristics)?
How do the New School student outcomes (attendance, suspensions,course marks, and standardized test scores) compare to the studentoutcomes of similar students in other District high schools?
Based on student feedback from the District-wide survey, how dostudents and teachers at the New Schools feel about instruction andschool climate? Are there trends in Year 1 versus Year 2?
Findings Student Enrollment and Retention New Schools enrolled higher proportions of Black (65%) and Latino
(30%) students compared to the District overall (55% Black and 17%Hispanic/Latino).
Based on a zip-code analysis, 44.1% of New School students are living inareas of Philadelphia where the poverty rates are above 40% (comparedto 31.5% in Philadelphia and 14.5% across the United States).
Across the three New Schools, Building 21 had the highest retentionrate (75%), followed by the LINC (73%) and the U School (72%).
During the 2015-2016 SY, the most common Exit Reason was “StudentTransfer within SDP” (N=40). Of the 32 students with the Exit Reason“Withdrawn to Charter,” 50% (N=16) exited in September or October.
Three New High Schools
In September 2014, three new high schools of choice opened in SDP. All three schools served only 9th grade students the first year and are designed so that each year, an additional grade is added. None of the schools has admissions criteria; while they are open to students citywide, each reserves a certain percentage of seats for students living in the surrounding neighborhoods.
The Carnegie Corporation of New York’s Opportunity by Design Challenge Initiative (OBD) funded two schools (The LINC and U School) and one (Building 21) was funded by Building 21, a non-profit organization.
New School Student Demographics
In the 2015-16 SY, New School students were
(n=658*):
Asian 1% Black 65%
Hispanic/Latino 30% Other 2% White 3%
Female 50% Male 50%
Special Education
20%
ELL 9% *Only students enrolled for at
least 30 days.
STUDY SUMMARY
54

Students’ Outcomes Compared to a Matched Group Students who attended New Schools did not perform uniformly better or worse than the comparison group. In Table 1, a green-shaded cell indicates that New School Students performed better, while the red cells indicate worse performance. “Better” or “worse” depends on the nature of the metric. For example, having a higher average daily attendance is positive (green), while having a greater number of suspensions is negative (red).
Table 1: Statistically Significant Differences between New School Students and Comparison Group Students
Building 21 U School LINC
Attendance Average Daily Attendance No Yes ↓ No
% with 95% Attendance* Yes ↓ Yes ↓ Yes ↑
Suspensions Average OSS Absence Days No Yes ↓ No
Number of Suspensions Yes ↓ Yes ↓ No
Core Course Marks Pass Rate Yes ↓ Yes ↓ No
Average Keystone
Scaled Score^
Literature No NA No
Biology No NA Yes ↓
Algebra 1 Yes ↓ NA Yes ↓
*Differences are relative to the grand mean
^Students at the U School did not take the Keystone exams.
Student and Teacher Survey Responses about Climate and Instruction With one exception (U School Student surveys), District-wide survey response rates for New
Schools decreased in 2015-16 as compared to 2014-15.
Students at the U School responded more positively to questions about school climate in 2015-16
compared to 2014-15. Students at Building 21 responded less positively about school climate
during the same time. LINC did not have a large enough student response rate for analysis.
At all three New Schools, parent/guardian response rates were too low for analysis.
There were decreases in the percentage of Building 21 and U School students selecting the most
positive response to questions aligned with the Instruction construct. The LINC did not have a
large enough student response rate for analysis.
Teacher survey data are consistent with the trends seen in the student data in that there were
decreases in both the U School and Building 21 for both of the Instruction sub-constructs.
Conclusion After two years, the findings from the three New Schools are mixed when compared to similar students in
the District. That said, it’s important to keep in mind some key contextual features that make
comparisons to other students in the District challenging to interpret. First, the environments of the New
Schools were designed to be distinct from other schools across the District. The data presented in this
report do not consider school-level factors at comparison schools that may influence students, such as
changes in leadership, staff, or policy changes. Second, new schools have only existed for two years and
serve a relatively small student body. Finally, moving forward it is critical that the New Schools work to
increase their survey response rates, so the data from all schools is representative of a range of
perspectives.
55

Education of Children and Youth Experiencing Homelessness (ECYEH) in SDP
Program Implementation and Outcomes, 2015-2016 SY
This brief summarizes the findings of an evaluation conducted by the Office of Research & Evaluation (ORE) that looked at the services provided as part of the Education of Children and Youth Experiencing Homelessness (ECYEH) program and outcomes for students identified as homeless during the 2015-2016 SY.
Study Overview ORE conducts an annual study of the ECYEH program as part of receiving funding for the initiative from the Pennsylvania Department of Education. In 2015-2016, research questions focused on both program implementation (e.g., amount and kind of services provided) and outcomes for students identified as homeless (e.g., attendance rates compared to housed peers).
The following research questions are highlighted in this brief:
Are ECYEH approaches resulting in the identification of homeless students? To what extent did the ECYEH office provide the following services?
a. Enrollment assistance, vouchers for uniforms, transportation passes,additional funding for schools supplies, and tutoring
b. Disseminate information on educational rights of students identifiedas homeless through professional development opportunities andworkshops
c. The TEEN program Are there differences between homeless students and their housed peers in
the following areas?a. Absences/truancyb. Positive climate responses on the District-wide surveyc. PSSA and Keystone exam performanced. The percentage of students who are promoted to the next grade
Why is this study important to SDP? The ECYEH office conducts outreach to schools via counselors, secretaries,
and principals in an effort to raise awareness about homelessness andworking with homeless students and families.
There is a high risk of students moving from school to school for those whoare experiencing homelessness. Even after accounting for this, homelessstudents have significantly lower reading and math achievement scores ascompared to housed peers (Fantuzzo et al, 2012). As such, it is critical thathomeless students be allowed to remain in their school of origin. The ECYEHoffice educates families about these rights and assists with the paperworkrequired for students to stay enrolled at their original school.
What is the ECYEH program?
The ECYEH office in SDP has three priorities: 1. Utilize information-
sharing to track andassist homelessstudents incollaboration withother agencies.
2. Provide support tohomeless studentsupon enteringemergency housing.
3. Increase awareness ofeducationalrights/issues withhomelessness amongschool/agency staffand families.
Sample Snapshot
Time Period: 2015-2016 SY Total Identified Homeless Youth: 4,532
SDP students: 2,643 Charter students: 686 Not yet school-aged (0-5
year olds): 1,079 Other students: 138
Living Arrangements of K-12 Students
Shelter: 57% Doubled Up: 41% Transitional: 1% Other/Hotel: 1%
STUDY SUMMARY Climate
56

Findings ECYEH approaches are resulting in greater identification of
homeless students. ECYEH was able to identify 100 more charter schoolstudents in 2015-2016 than in the 2014-2015 SY by having a liaison fromthe ECYEH office working with the charter schools to assist in theidentification of these students. ECYEH continues to identify a similarpercentage of students in the 2015-16 SY as in the 2014-15 SY.
ECYEH continues to provide services to families and disseminateinformation on the educational rights of homeless students throughprofessional development opportunities and workshops. ECYEHcontinues to service students by providing enrollment assistance,uniform vouchers, transportation passes, additional funding for schoolsupplies, as well as tutoring and the TEEN program. Thirty-six workshopswere offered for providers (such as those who work at shelters), schoolstaff, parents, and students during the 2015-2016 school year with nearly300 attendees.
While there are gaps between students identified as homeless andother District students with truancy, engagement, and achievement,less of a gap exists when examining school climate. Studentsidentified as homeless experienced higher truancy rates and lower scoreson standardized tests such as the PSSAs and Keystones, as well as lowerrates of promotion to the next grade in high school. However, climatescores from the District-wide survey indicated a smaller gap betweenthese students and other District students in terms of their self-reportedsafety and sense of belonging. This may indicate that although studentsidentified as homeless experience more struggles in certain areas thantheir housed peers, school may provide a certain stabilizing environmentfor these students.
What are the education rights of homeless
students?
The McKinney-Vento Homeless Assistance Act defines homelessness as a lack of a fixed, regular, and adequate nighttime residence.
The Act requires schools to enroll homeless children and youth immediately, even if they lack normally required documents, such as immunization records or proof of residence.
The Act also requires schools to provide transportation to and from the child’s school of origin if it is in the child’s or youth’s best interest.
Conclusion/Recommendations Based on the 2015-2016 evaluation, ORE provides the following recommendations for future implementation
of the ECYEH program:
Membership for the TEEN program has been declining over the last three years. For the 2015-2016 SY,
fewer activities and events took place than in the prior school year. Finding ways to bolster membership in
addition to the development of more activities such as college visits may be a focus for the 2016-2017 SY.
Services that are provided could benefit from better documentation. For example, providing sign-in sheets
to ORE for workshops and PDs, tracking coat donations for students that come into the office, and tracking
tutoring (which students receive services on which days and in which subjects).
57