Embed Size (px)
Citation preview
School bus safety
September 2010
PH Baas, TERNZ Ltd, Auckland SG Charlton, University of Waikato, Hamilton N Taramoeroa, TERNZ Ltd, Auckland JP Edgar, John Edgar Consulting, Waikanae
NZ Transport Agency research report 408
ISBN 978-0-478-36447-7 (print)
ISBN 978-0-478-36446-0 (electronic)
ISSN 1173 3756 (print)
ISSN 1173-3764 (electronic)
NZ Transport Agency
Private Bag 6995, Wellington 6141, New Zealand
Telephone 64 4 894 5400; facsimile 64 4 894 6100
www.nzta.govt.nz
Baas, PH,1 SG Charlton,2 N Taramoeroa1 and JP Edgar3 (2010) School bus safety. NZ Transport Agency
research report no.408. 100pp.
1 TERNZ Ltd, PO Box 106573, Auckland, 1143, ph +64 9 3370 542, [email protected] 2 University of Waikato, Department of Psychology, Hamilton: [email protected] 3 John Edgar, John Edgar Consulting, Waikanae: [email protected]
This publication is copyright © NZ Transport Agency 2010. Material in it may be reproduced for personal
or in-house use without formal permission or charge, provided suitable acknowledgement is made to this
publication and the NZ Transport Agency as the source. Requests and enquiries about the reproduction of
material in this publication for any other purpose should be made to the Research Programme Manager,
Programmes, Funding and Assessment, National Office, NZ Transport Agency, Private Bag 6995,
Wellington 6141.
Keywords: bus stops, children, road safety, school bus, speed signs.
An important note for the reader
The NZ Transport Agency is a Crown entity established under the Land Transport Management Act 2003.
The objective of the Agency is to undertake its functions in a way that contributes to an affordable,
integrated, safe, responsive and sustainable land transport system. Each year, the NZ Transport Agency
funds innovative and relevant research that contributes to this objective.
The views expressed in research reports are the outcomes of the independent research, and should not be
regarded as being the opinion or responsibility of the NZ Transport Agency. The material contained in the
reports should not be construed in any way as policy adopted by the NZ Transport Agency or indeed any
agency of the NZ Government. The reports may, however, be used by NZ Government agencies as a
reference in the development of policy.
While research reports are believed to be correct at the time of their preparation, the NZ Transport Agency
and agents involved in their preparation and publication do not accept any liability for use of the research.
People using the research, whether directly or indirectly, should apply and rely on their own skill and
judgement. They should not rely on the contents of the research reports in isolation from other sources of
advice and information. If necessary, they should seek appropriate legal or other expert advice.
Acknowledgements
This research was initiated by the Bus Safety Technical Advisory Committee (BUSSTAC), a government and
industry initiative led by the Ministry of Education. BUSSTAC also includes representatives from the
Ministry of Transport, NZ Transport Agency (NZTA), NZ Police, Bus and Coach Association (NZ), and bus
operators and coach builders. Funding was provided by NZTA with BUSSTAC acting as the steering group.
The assistance provided by all of the individuals and organisations that assisted with this project is
acknowledged and appreciated. At the risk of leaving someone out, we would especially like to thank the
following:
• The members of BUSSTAC
• Kieran Forde, Bernadette Scannell, Margaret Gascoigne, Kirsten Sharman, Joanne Moyer and colleagues
at the Ministry of Education
• Go-bus Ltd (for providing a bus, driver, workshop time and other assistance)
• Harding Traffic (for the manufacture and loan of the signs that were evaluated)
• NZ Police (for assistance at the intercept stop and advice)
• ACC (for assistance at the intercept stop and advice)
• Department of Infrastructure, Public Transport Division, Victoria, Australia and ARUP, Melbourne (for
approval to use the information in their report as the basis of a New Zealand guide (ARUP 2006)
• Murphy Buses Ltd. (for their advice and access to their buses and drivers)
• Dr Brenda Lobb, University of Auckland as a peer reviewer
• Mr Michael Cummins, NZTA, as a peer reviewer
5
Contents
Executive summary ................................................................................................................................................... 7
Abstract ........................................................................................................................................................................10
1 Introduction...................................................................................................................................................11
2 The safety of children crossing the road to or from a school bus.......................................14
2.1 Current situation ................................................................................................... 14
2.2 Options for improving safety................................................................................. 16
2.2.1 Eliminate the need for students to cross the road .................................. 16
2.2.2 Prevent students from heedlessly crossing the road............................... 17
2.2.3 Minimise the consequences by slowing down traffic .............................. 18
2.3 Bus stop and turning point safety.......................................................................... 20
2.3.1 Introduction ........................................................................................... 20
2.4 Evaluation of school bus signs .............................................................................. 21
2.4.1 Method................................................................................................... 21
2.4.2 Results ................................................................................................... 22
2.4.3 Discussion ............................................................................................. 31
3 Safety of children while on school buses ........................................................................................33
3.1 Bus occupant restraints ......................................................................................... 33
3.1.1 Safety belts ............................................................................................ 33
3.1.2 Compartmentalisation............................................................................ 35
3.1.3 Cost-benefit analysis of safety belts on school buses ............................. 35
3.1.4 Discussion ............................................................................................. 37
3.2 School bus management standards ....................................................................... 37
3.2.1 Closing the loop..................................................................................... 38
3.2.2 Performance standards .......................................................................... 38
3.2.3 Ministry of Education school bus operator contract................................ 41
4 Recommendations ......................................................................................................................................42
4.1 Improving the safety of children who have to cross the road to and from school buses ......................................................................................................... 42
4.1.1 Minimising the need for students to cross the road ............................... 42
4.1.2 Preventing children from running heedlessly across the road:................ 42
4.1.3 Minimising the consequences by slowing down the traffic when children are crossing:............................................................................. 43
4.2 Reducing the risk of injury while travelling on school buses.................................. 44
5 References......................................................................................................................................................45
Appendix A: Draft school bus stop and turning point safety guide.................................................48
Appendix B: Crashes during 1987 to 2007 involving students crossing the road to or from a school bus..........................................................................................................................89
Appendix C: Safety belt and occupant impact protection requirements ........................................94
Appendix D: Maintenance management ........................................................................................................96
6
Abbreviations and acronyms
ACC Accident Compensation Corporation
BCA Bus and Coach Association
BUSSTAC Bus Safety Technical Advisory Committee
CAS crash analysis system
CoF certificate of fitness
H&S health and safety
LTSA Land Transport Safety Authority (now NZ Transport Agency)
NHVA National Heavy Vehicle Accreditation
OECD Organisation for Economic Co-operation and Development
NZTA NZ Transport Agency
PSV passenger service vehicle
SESTA Special Education School Transport Assistance
7
Executive summary
This research project was initiated by the Bus Safety Technical Advisory Committee (BUSSTAC), which
comprises representatives from the Ministry of Education (as lead organisation), NZ Transport Agency
(NZTA), Ministry of Transport, NZ Police, Bus and Coach Association (BCA), bus builders and bus
operators. BUSSTAC has taken a long-term (20 to 30 years) holistic approach that includes identifying the
risks and risk management issues arising from travelling to school by bus (LTSA 2002). The purpose of
this research was to advance the measures that were seen as having the most promise.
There is considerable concern in the community, especially the rural community, about the number of
children being killed or seriously injured when crossing the road to or from school buses. In the 21 years
from 1987 to 2007 inclusive, 22 children were killed, 45 were seriously injured and 91 received minor
injuries when crossing the road to or from a school bus. This equates to, on average, one fatal, 2.1 serious
and 4.3 minor injuries reported to the Police each year. In addition six children were killed, 35 seriously
injured and 112 received minor injuries as passengers in school buses during that time. Approximately
20% of school pupils (106,000 pupils) are transported to school by Ministry of Education funded bus
services.
School bus safety can be divided into two parts:
1 The safety of children crossing the road to or from a school bus
2 The safety of children while travelling on a school bus.
The safety of children crossing the road to or from a school bus
When considering the options to reduce the number of children killed or injured when crossing the road to
or from school buses, it must be remembered that children, especially children of primary school age, are
poor judges of traffic speed and are often impulsive.
It is standard health and safety practice to address hazards by eliminating them where possible; or if they
can’t be eliminated, isolating them; or if they can’t be isolated, minimising them. In the context of the
safety of children crossing the road to or from school buses, this translates to:
• eliminating the need for students to cross the road
• preventing children from running heedlessly across the road
• minimising the consequences by slowing down the traffic when children are crossing.
Eliminate the need for students to cross the road
Encourage caregivers to meet their children at the bus stop. The NZ Police, NZTA, Ministry of
Education, schools and community groups have been raising awareness of the need for caregivers to meet
their children at the bus stop, including parking on the same side of the road as the bus. Reminding
caregivers of their responsibilities is not sufficient on its own because, as many studies have found,
convenience plays an important role with perceived risks weighed up against the time and effort required
(Lobb 2006). Overcoming this barrier may be difficult and may require engineering measures such as
improved parking facilities near bus stops.
School bus safety
8
Rearrange bus routes to reduce the number of children who have to cross the road. The Ministry of
Education and their service agents try to configure bus routes to minimise the number of children who
have to cross the road. School bus routes are reviewed every two years. The limiting factors are extra
running costs if the routes need to be extended and require students to stay on the bus longer, especially
if the bus drives past their house on the way out but they are not allowed off until the bus returns on their
side of the road.
Improve bus stops. Some road authorities have been improving school bus stops as the opportunity
arises. A draft bus stop guide has been developed (see appendix A) to assist road authorities with
upgrading bus stops, especially on major roads in rural areas. An important feature of rural bus stops is
the provision of parking for caregivers who are waiting for a bus to arrive. Providing parking at bus stops
will reduce the number of children who have to cross the road. It is recommended that the draft guide be
adopted by the NZTA and that priority be given to upgrading bus stops on state highways and major local
roads.
Preventing children from running heedlessly across the road
Caregivers, bus drivers, schools and other stakeholders have a shared responsibility to do what they can
to make sure children cross the road safely. While there have been some questions about the effectiveness
of educational and awareness-raising interventions, there are things that can be done that are not difficult
or expensive. For example caregivers can be reminded regularly what safe road crossing is and that they
need to model it to the children they are looking after. School community-based initiatives, such as bus
wardens and neighbours taking turns to meet the bus should be encouraged. Children should be
reminded of the need to take care. The Ministry of Education has produced a fact sheet that explains the
responsibilities of all parties, including caregivers, bus drivers and schools.
Road safety education. Improving attitudes to and knowledge of how to cross safely is taught by the NZ
Police as part of its road safety education programme. The Ministry of Transport is currently reviewing
young person road safety education and the effectiveness of what is currently delivered by schools, driving
instructors and other road safety education providers.
Minimising the consequences by slowing down traffic when children are crossing
The greatest gains will come from changes to bus routes, better bus stops and other measures that
remove the need for children to cross the road. However, funding for engineering solutions and longer
bus routes is limited and these will take time to implement. In the absence of these measures, the next
most effective approach is to slow down the traffic when children need to cross. This is because children
of primary school age, in particular, are poor judges of vehicle speed, are impulsive and caregivers cannot
always be present when children need to cross the road. In order to be able to slow down the traffic, it is
recommended that:
• The legal requirements should be changed to enable effective enforcement. It is currently difficult for
the NZ Police to enforce the 20km/h speed limit on motorists passing school buses that are picking
up or dropping off students. This has meant that there have been virtually no prosecutions of
motorists speeding past school buses despite the very high level of non-compliance. It is
recommended that the Land Transport (Road User) Rule 2004 (SR2004/427) section 5.6 be amended
to enable effective enforcement of the speed limit. A number of studies have found that punishment
can be more effective than awareness-raising campaigns and education in changing behaviour (Lobb
2006). When considering amendments to the Rule it is recommended that:
Executive summary
9
– the speed limit be reviewed. The research suggests that the speed limit around school buses
should be the same as that in other high-risk areas such as outside the school gate, in shared
main street spaces and near road works. This uniformity is likely to increase driver awareness and
the level of compliance
– the speed limit should apply whenever approved warning lights are activated, including when the
bus is moving to or away from a bus stop
– the sign should only be activated when students are very likely to cross the road
• Active speed signs should be installed on school buses. A new active sign should be developed based
on the findings of the trial undertaken for this project. Cost, ease of installation and effectiveness
need to be considered. Ideally the new sign should be implemented in conjunction with a law change
as proposed above, but if that is not possible, a ‘20’ sign would help to slow motorists on its own.
Some community groups have indicated that they may be able to fund the installation of a limited
number of signs until their use can be included as a requirement in the Ministry of Education school
bus services contracts.
• Driver awareness campaigns should be continued. A number of organisations, such as Rural Women
New Zealand, SafeKids New Zealand, NZ School Trustees Association, the NZTA, Accident
Compensation Corporation and local authority road safety coordinators have put a lot of effort and
thought into trying to slow down traffic with billboards and other awareness-raising measures that
remind drivers of the legal speed limit when passing a school bus.
If funds are limited, priority should be given to improving bus stops, installing the new active signs on
school buses, and enforcement of the speed limit rather than driver awareness campaigns. Active speed
signs are of direct relevance to motorists in that if they ignore them, there is a risk they will be prosecuted
or, worse could kill a child. Billboards and other passive measures rely on remembering the message the
next time they come across a school bus.
The safety of children while travelling on a school bus
A 1987 rollover crash resulted in five of the six deaths of school bus passengers that occurred in the 21
years between 1987 and 2007. During that crash the bus structure failed, resulting in the occupants being
ejected from the bus and crushed by the bus rolling on top of them. That incident resulted in bus and
coach structural strength requirements being introduced.
The following options were investigated to further improve the safety of school bus passengers.
• School bus management standards. Since this research project started, the Ministry of Education has
written into their school bus contracts more stringent requirements for the construction and
maintenance of school buses. This appears to have been effective as a recent NZ Police sting
operation in the Coromandel Peninsula found that none of the 39 school buses inspected had vehicle
safety faults (BCANZ 2010). It is recommended that the Ministry of Education and the NZTA continue
to encourage bus fleet operators to adopt best practice.
• Occupant protection. The bus structural strength requirements appear to have been effective in
reducing the risk to injury during bus crashes. Further improvements in occupant protection could
include having higher seat backs. However, retrofitting older buses with these seats may not be
justified because of the cost.
School bus safety
10
Abstract
In the 21 years from 1987 to 2007 inclusive, 22 children were killed, 45 seriously injured and 91 received
minor injuries when crossing the road to or from a school bus. In addition, six children were killed while
passengers on a school bus. As a result, there is widespread concern about school bus safety. This
research project aimed to identify and advance those measures seen as having the most promise in terms
of improving school bus safety in New Zealand. The scope of the research included both safety on school
buses and safety when crossing the road to or from a school bus. The research team and project steering
group (the Bus Safety Technical Advisory Committee (BUSSTAC) led by the Ministry of Education, identified
and evaluated a wide range of safety improvement options. Detailed recommendations for improving
school bus safety, including road engineering improvements around bus stops, bus signage, enforcement
and educational/information campaigns were developed.
1 Introduction
11
1 Introduction
This project was initiated by the Bus Safety Technical Advisory Committee (BUSSTAC), which comprises
representatives from the Ministry of Education (as lead organisation), NZ Transport Agency (NZTA),
Ministry of Transport, NZ Police, Bus and Coach Association (BCA), bus builders and bus operators. Before
being known as BUSSTAC the ‘Overview Group on School Bus Safety’ reviewed all aspects of safety in order
to determine the types of measures that would be effective in minimising the risk to children travelling by
school bus. It took a long-term (20 to 30 years) holistic approach that included identifying the risks and
risk management issues arising from catching the bus, the journey, disembarking and the immediate
vicinity of the bus post-journey, and vehicle and driver standards (LTSA 2002). The purpose of this
research was to advance the measures that were seen as having the most promise in terms of improving
safety.
There is considerable concern in the community, especially the rural community, about the number of
school bus users being killed or seriously injured:
School bus crashes receive a high level of media attention.
Several recent coroners’ reports have raised serious concerns about school bus safety and
recommended that immediate action should be taken.
The National Council of Women New Zealand recently passed a resolution calling for ‘all school
buses, while conveying children to and from school display distinctive and active signage, including
the maximum speed at which a vehicle may pass a stationary school bus’.
The New Zealand Society of Paediatric Surgeons, in a recent submission to government, expressed
‘unprecedented concern at the increasing rates of admission for primary preventable conditions of a
surgical nature in New Zealand children’. New Zealand has one of the highest death and injury rates
in the OECD for accidents among children under 19.
Approximately 106,000, or 20% of all students who attend primary and secondary schools, travel to school
by bus. This estimate is based on the results of the NZ Household Travel Survey and includes students
aged between 5 and 17 who attended school between 2005 and 2009. The NZ Household Travel Survey is
an on-going survey of 4600 households throughout New Zealand (MoT 2009). This estimate is similar to
that obtained by Schofield et al (2008) who found that 23 ±0.45% of 5 to 17 year olds travelled to school
by bus. That survey (‘Census at Schools’) was internet-administered in 2005 and was completed by 32,973
randomly selected students from 721 schools across New Zealand. The survey was nationally
representative of school-related travel.
It should be noted that the Ministry of Education does not fund/provide transport for all students who
travel to school on a bus. Most of the urban school bus services are provided by regional councils and
most of the rural bus services are provided and/or funded by the Ministry of Education.
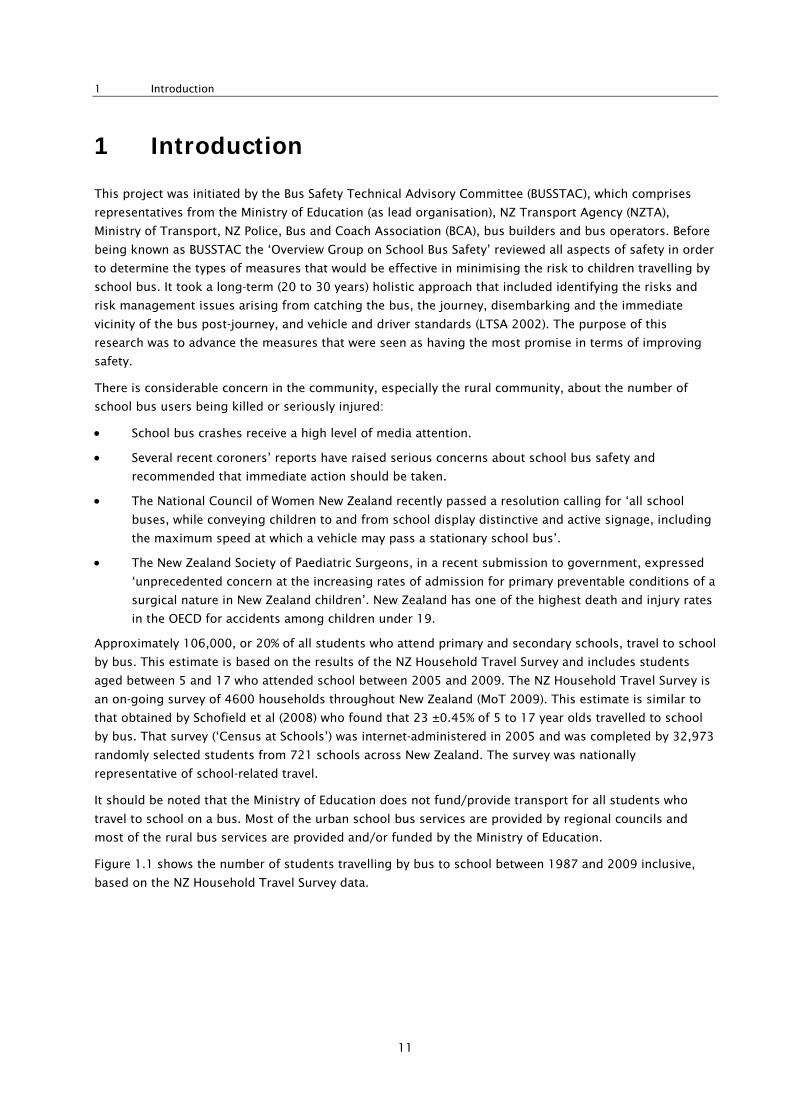
Figure 1.1 shows the number of students travelling by bus to school between 1987 and 2009 inclusive,
based on the NZ Household Travel Survey data.
School bus safety
12
Figure 1.1 Number of students travelling to school by bus between 1989 and 2009
The Ministry of Education spent approximately $150 million on school transport services in the financial
year to 30 June 2009 (Ministry of Education 2009c). This includes:
• Ministry-contracted school bus services. Ninety-five school bus operators provide services on 1470
Ministry-contracted daily bus routes and 701 technology routes (daily bus routes bring children to or
from school while technology routes transfer primary school children from one school to another for
technology lessons).
• Direct resourcing of schools to provide their own transport services. There are 576 directly resourced
school transport routes.
• Special Education School Transport Assistance (SESTA). Approximately 4295 students were
transported by taxis and minibuses to school in 2007 for an annual cost of approximately $24 million
(Larcombe Consulting Ltd 2008).
• An allowance for children who qualify for school transport but no service is available.
Research both in New Zealand and internationally shows that school buses are one of the safest ways for
students to travel to and from school. Schofield et al (2008) used Accident Compensation Corporation
(ACC) claim data to estimate the risk of injury during the trip to school for the different transport modes
(walking, private motor vehicle, bus, cycling etc). They found there were 2.59 (±0.01) injuries per million
bus trips compared with 6.08 (±0.03) injuries per million private motor vehicle trips and 10.3 (±0.05)
injuries per million walking trips to school. Similarly Granville et al (2002) found that in Scotland children
travelling by car to school had a higher incident rate (incidents per trip) than children travelling by bus by
a factor of seven. For their analysis, a bus- or car-related incident was for the time they were in the vehicle,
not walking to or from the vehicle. While school buses are relatively safe, children continue to be injured
or killed while travelling by bus to school. Given that over 100,000 students travel to school by bus, any
improvement in school bus safety has the potential to reduce injury for a substantial proportion of
New Zealand students.
It is not possible to offer students door-to-door services. However, in providing school transport assistance
the Ministry of Education, in conjunction with other government agencies, has a number of school-related
1 Introduction
13
safety initiatives. For example, the Ministry of Education and other agencies provide guidance for caregivers
and school children on the correct way to cross the road after exiting a school bus. The children are told to
find a safe place to wait until the bus has moved away and then check the road both ways before crossing.
The NZ Police and the NZTA deliver education programmes and other resources designed to enable children
and young people to act safely on roads and amongst traffic. The NZTA has guidelines for the establishment
of school bus stops to ensure students are clearly visible to motorists.
A number of other organisations and individuals are also assisting with school bus safety. They include:
• Rural Women New Zealand
• Local authority road safety coordinators
• New Zealand School Trustees Association
• NZ Parent Teachers Association
• NZ National Council for Women
• SafeKids New Zealand
• New Zealand Principals’ Federation
• Round Table New Zealand.
They have:
• produced posters, brochures and other material aimed at making motorists more aware of the
20km/h speed limit when passing a school bus that has stopped to pick up or drop off children
• trialled new signs on buses and supported child road safety awareness campaigns
• spoken to schools and community groups and lobbied for change
• provided training for children and parents
These efforts have been largely at a local level.
School bus safety can be divided into two separate parts:
1 The safety of children crossing the road to or from a school bus. This includes:
a rearranging bus runs to reduce the number of children who have to cross the road
b improving the visibility and condition of bus stops
c encouraging caregivers to meet their children at the bus stop
d assisting younger children with crossing the road
e improving road safety awareness and skills
f slowing down the traffic when passing a school bus that is picking up or dropping off children.
2 The safety of children while travelling on a school bus. This includes:
a improving the safety of school buses, including how they are managed and maintained and how
they are driven
b improving passive safety systems, such as ensuring passengers are contained in the bus during a
rollover incident to protect bus occupants should a crash occur.
The report addresses these issues in turn.
School bus safety
14
2 The safety of children crossing the road to or from a school bus
2.1 Current situation
A detailed analysis has been undertaken of all NZ Police reported crashes on the crash analysis system
(CAS) database managed by the NZTA. The database was searched for incidents that involved:
• children who were pedestrians at the time of the incident
• children were aged between 0 and 17 years old
• a school bus that was in the vicinity of the crash scene
• crashes that occurred between 6am and 9am, and 2pm and 5pm on school days (not holidays or
weekends)
• crashes during the period 1987 to 2007 inclusive.
Where available, the reporting officer's hand-written notes were extracted from the CAS database and
included in the analysis.
In the 21 years from 1987 to 2007 inclusive, 22 children were killed, 45 were seriously injured and 91
received minor injuries when crossing the road to or from a school bus. This equates to, on average, one
fatal, 2.1 serious and 4.3 minor injuries that are reported to the Police each year. Although it is required
by law, not all injury accidents are reported. Further details are provided in appendix B
Of the reported crashes:
• 85% occurred in the afternoon on the way home from school
• 86% of the fatal incidents but only 39% of all incidents (fatal and injury) occurred in speed zones
greater than 50km/h
• a similar number of children appeared from the front as from the rear of the bus
• there were no reported crashes on unsealed roads. As the number of children who travel by bus on
unsealed roads is not known, it is not possible to say whether travelling on sealed roads is any more
dangerous than unsealed roads and vice versa.
Figure 2.1 shows the annual fluctuation in the number of students killed and injured. It cannot be
concluded from this graph that there has been any significant improvement or reduction in safety.
2 The safety of children crossing the road to or from a school bus
15
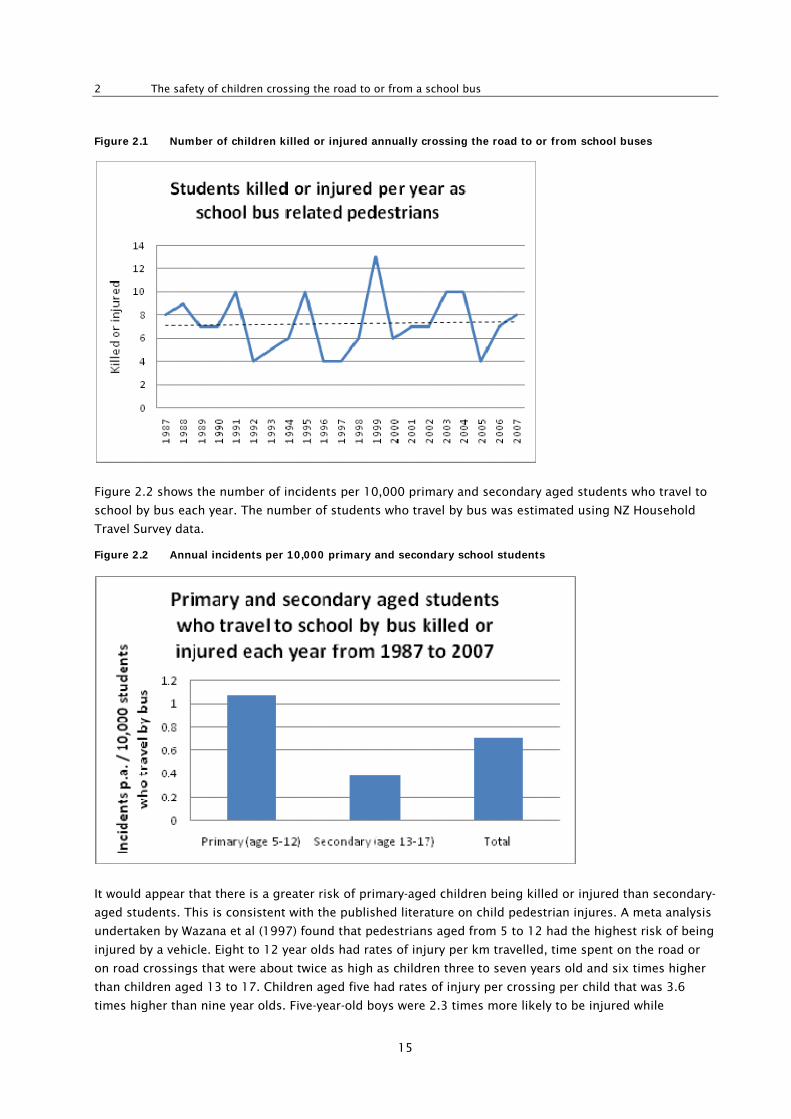
Figure 2.1 Number of children killed or injured annually crossing the road to or from school buses
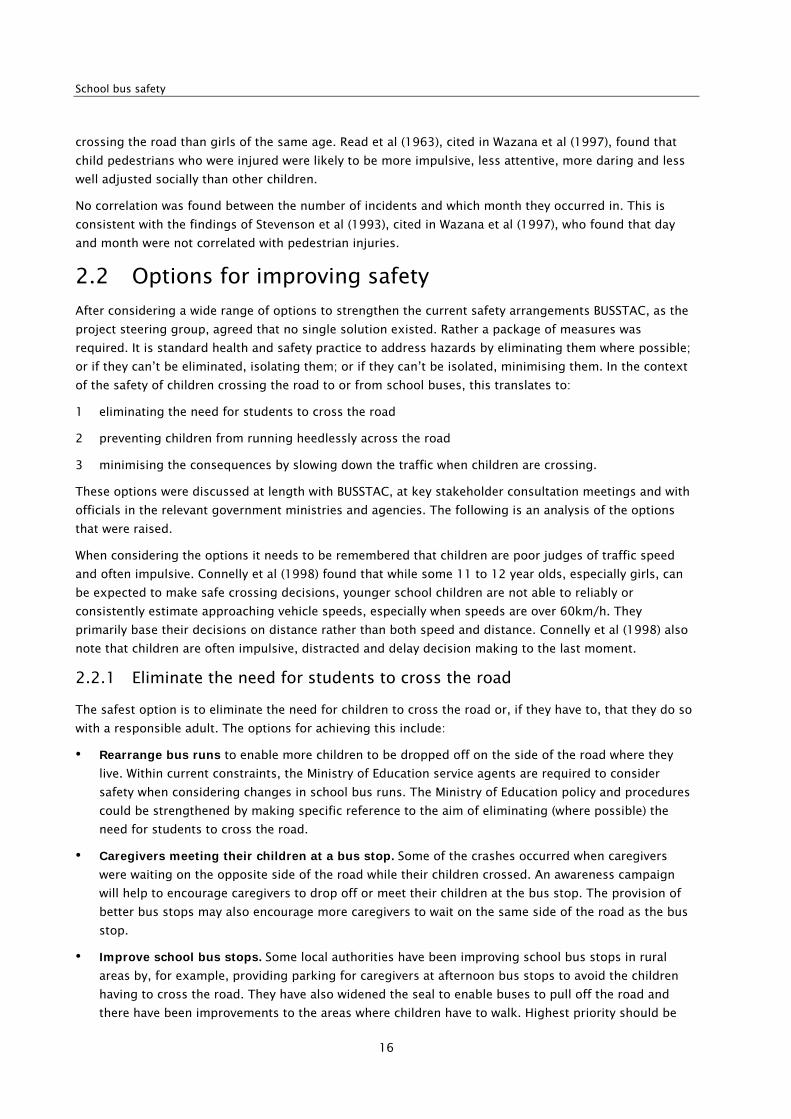
Figure 2.2 shows the number of incidents per 10,000 primary and secondary aged students who travel to
school by bus each year. The number of students who travel by bus was estimated using NZ Household
Travel Survey data.
Figure 2.2 Annual incidents per 10,000 primary and secondary school students
It would appear that there is a greater risk of primary-aged children being killed or injured than secondary-
aged students. This is consistent with the published literature on child pedestrian injures. A meta analysis
undertaken by Wazana et al (1997) found that pedestrians aged from 5 to 12 had the highest risk of being
injured by a vehicle. Eight to 12 year olds had rates of injury per km travelled, time spent on the road or
on road crossings that were about twice as high as children three to seven years old and six times higher
than children aged 13 to 17. Children aged five had rates of injury per crossing per child that was 3.6
times higher than nine year olds. Five-year-old boys were 2.3 times more likely to be injured while
School bus safety
16
crossing the road than girls of the same age. Read et al (1963), cited in Wazana et al (1997), found that
child pedestrians who were injured were likely to be more impulsive, less attentive, more daring and less
well adjusted socially than other children.
No correlation was found between the number of incidents and which month they occurred in. This is
consistent with the findings of Stevenson et al (1993), cited in Wazana et al (1997), who found that day
and month were not correlated with pedestrian injuries.
2.2 Options for improving safety
After considering a wide range of options to strengthen the current safety arrangements BUSSTAC, as the
project steering group, agreed that no single solution existed. Rather a package of measures was
required. It is standard health and safety practice to address hazards by eliminating them where possible;
or if they can’t be eliminated, isolating them; or if they can’t be isolated, minimising them. In the context
of the safety of children crossing the road to or from school buses, this translates to:
1 eliminating the need for students to cross the road
2 preventing children from running heedlessly across the road
3 minimising the consequences by slowing down the traffic when children are crossing.
These options were discussed at length with BUSSTAC, at key stakeholder consultation meetings and with
officials in the relevant government ministries and agencies. The following is an analysis of the options
that were raised.
When considering the options it needs to be remembered that children are poor judges of traffic speed
and often impulsive. Connelly et al (1998) found that while some 11 to 12 year olds, especially girls, can
be expected to make safe crossing decisions, younger school children are not able to reliably or
consistently estimate approaching vehicle speeds, especially when speeds are over 60km/h. They
primarily base their decisions on distance rather than both speed and distance. Connelly et al (1998) also
note that children are often impulsive, distracted and delay decision making to the last moment.
2.2.1 Eliminate the need for students to cross the road
The safest option is to eliminate the need for children to cross the road or, if they have to, that they do so
with a responsible adult. The options for achieving this include:
• Rearrange bus runs to enable more children to be dropped off on the side of the road where they
live. Within current constraints, the Ministry of Education service agents are required to consider
safety when considering changes in school bus runs. The Ministry of Education policy and procedures
could be strengthened by making specific reference to the aim of eliminating (where possible) the
need for students to cross the road.
• Caregivers meeting their children at a bus stop. Some of the crashes occurred when caregivers
were waiting on the opposite side of the road while their children crossed. An awareness campaign
will help to encourage caregivers to drop off or meet their children at the bus stop. The provision of
better bus stops may also encourage more caregivers to wait on the same side of the road as the bus
stop.
• Improve school bus stops. Some local authorities have been improving school bus stops in rural
areas by, for example, providing parking for caregivers at afternoon bus stops to avoid the children
having to cross the road. They have also widened the seal to enable buses to pull off the road and
there have been improvements to the areas where children have to walk. Highest priority should be
2 The safety of children crossing the road to or from a school bus
17
directed to stops on high-speed, high-volume roads (eg state highways), used in the afternoon by a
number of children (eg greater than four to start with) and that are likely to be used on a permanent
basis. However, while ensuring that the bus stops will be used on a permanent basis is important from
a funding perspective, this may reduce flexibility in routing buses. A draft bus stop and turning bay
guide has been developed as part of this project and is described in section 2.3 and appendix A.
2.2.2 Prevent students from heedlessly crossing the road
The next broad category of interventions is to provide children with help and supervision to prevent them
from crossing in the face of on-coming traffic. This includes: adults helping younger children to cross the
road, teaching children how to cross the road safely and making children very aware of the dangers
involved.
Supervision of children crossing the road. School transport assistance policy operates on the basis of a
shared responsibility between the Crown and caregivers. More clearly defining who is responsible for the
safety of children at various stages of their trip to and from school could strengthen the current safety
regime. As caregivers have the responsibility for ensuring the safety of their children once they leave a
school bus, more emphasis should be put on ensuring parents do not place their children at risk by, for
example, waiting for them on the opposite side of the road. School community-based initiatives, such as
bus wardens and neighbours taking turns to meet the bus should be encouraged.
Education. Road safety education is included in the overall programme for student wellbeing and is taught
within the normal school curriculum. A review of what is provided may identify areas where further
improvements can be made. For example, road safety education programmes currently target students. In
future, caregivers could also be targeted. Morrongiello and Barton (2009) found that, in Canada, few
parents actually provided their children with any instruction on how to cross the road safely and were not
able to assess their child's ability to cross the road independently. There is no reason to believe the
situation is any different in New Zealand as there is currently very little training for caregivers.
An OECD report on keeping children safe in traffic noted that:
although parents wish to keep their children safe and often accompany them in the traffic
environment, they may not exhibit appropriate road safety behaviour themselves. Children
learn by imitation and careful observation of adults and begin developing road safety skills
well before they reach school age. As children mature, their parents may have less influence
over their actions than their peers. It is therefore important to instil sound safety habits in
children early in their development. For pre-teens and adolescents, safety skills need to be
reinforced and positive attitudes towards safe behaviour, such as strategies for handling peer
pressure and risks, need to be developed. The emerging responsibility of youngsters for road
safety of other road users, like young children, the elderly and handicapped, also offers a
subject for discussion (OECD 2004).
There may also be a case for a focus on training pre-schoolers given that automaticity may be more easily
established in the young. Congiu et al (2008) found that appropriate traffic exposure was beneficial in
acquiring road skills.
While there is some evidence that attitudes towards safe behaviour may be improved, research has not yet
demonstrated convincingly that raising awareness is sufficient on its own to reduce incidence of unsafe
behaviour (Lobb et al 2003). The Ministry of Transport is currently reviewing young person safety
education and the effectiveness of what is delivered by schools, driving instructors and other road safety
education providers.
School bus safety
18
2.2.3 Minimise the consequences by slowing down traffic
The third option is to minimise the likelihood of children being killed or injured if they do happen to cross
the road in the face of on-coming traffic. In many instances, children have suddenly appeared from behind
the bus, giving speeding motorists no time to respond. The only practical option available is to slow down
the traffic. However, very few motorists observe, or are aware of, the current 20km/h speed limit when
travelling past a school bus and this speed limit has proved to be difficult to enforce. The penalty for
travelling 50km/h over the speed limit (ie at 70km/h) is automatic loss of licence. Despite that, average
speeds of over 84km/h were recorded on a 100km/h road during the BUSSTAC school bus signs trial (see
section 2.4 below). In considering options for slowing down the traffic, it is important to consider two
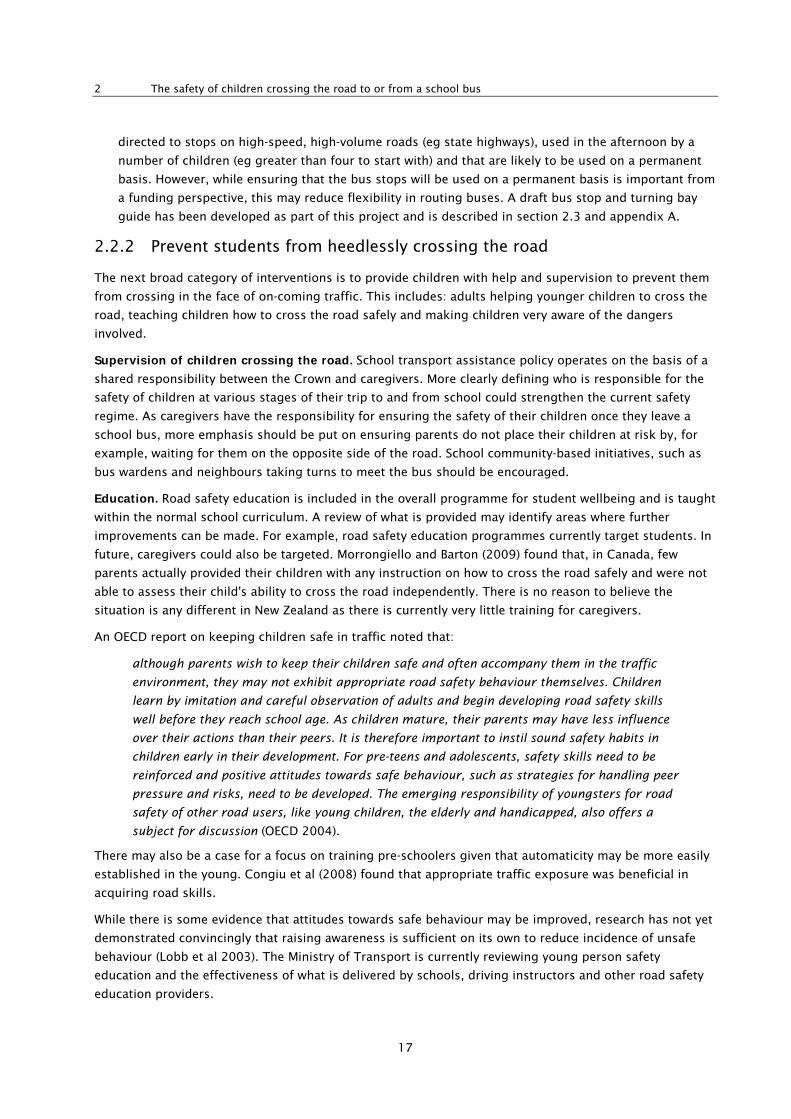
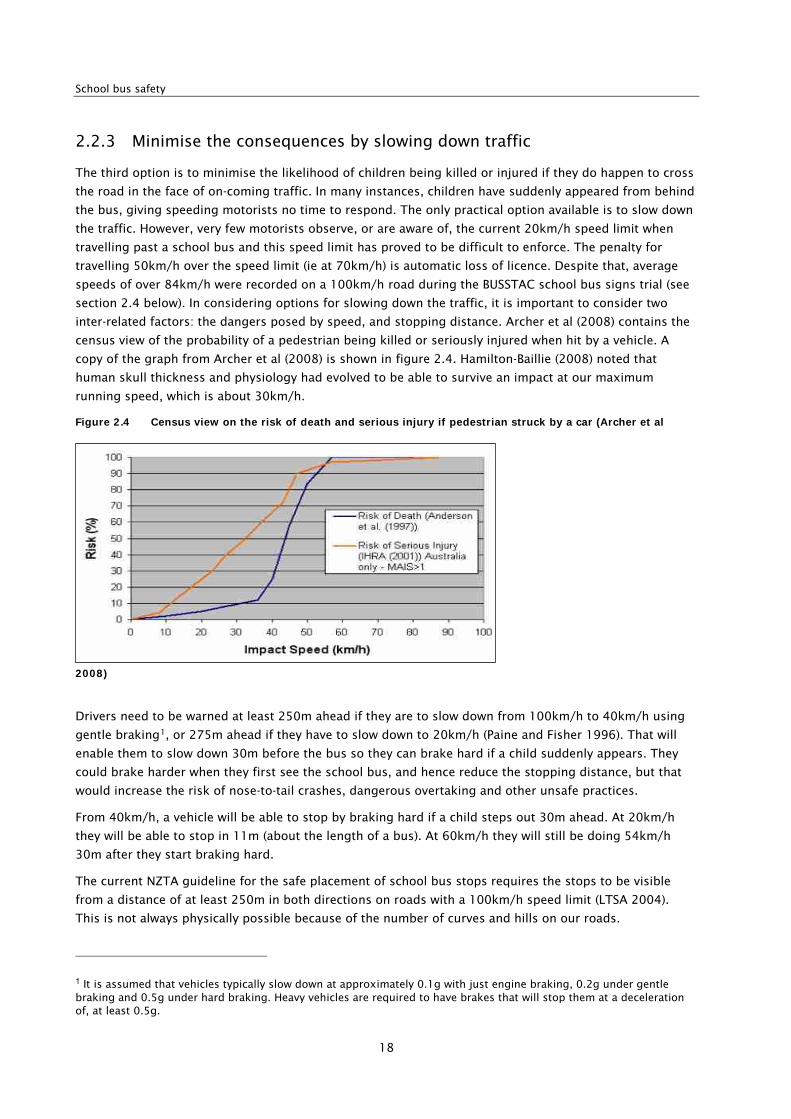
inter-related factors: the dangers posed by speed, and stopping distance. Archer et al (2008) contains the
census view of the probability of a pedestrian being killed or seriously injured when hit by a vehicle. A
copy of the graph from Archer et al (2008) is shown in figure 2.4. Hamilton-Baillie (2008) noted that
human skull thickness and physiology had evolved to be able to survive an impact at our maximum
running speed, which is about 30km/h.
Figure 2.4 Census view on the risk of death and serious injury if pedestrian struck by a car (Archer et al
2008)
Drivers need to be warned at least 250m ahead if they are to slow down from 100km/h to 40km/h using
gentle braking1, or 275m ahead if they have to slow down to 20km/h (Paine and Fisher 1996). That will
enable them to slow down 30m before the bus so they can brake hard if a child suddenly appears. They
could brake harder when they first see the school bus, and hence reduce the stopping distance, but that
would increase the risk of nose-to-tail crashes, dangerous overtaking and other unsafe practices.
From 40km/h, a vehicle will be able to stop by braking hard if a child steps out 30m ahead. At 20km/h
they will be able to stop in 11m (about the length of a bus). At 60km/h they will still be doing 54km/h
30m after they start braking hard.
The current NZTA guideline for the safe placement of school bus stops requires the stops to be visible
from a distance of at least 250m in both directions on roads with a 100km/h speed limit (LTSA 2004).
This is not always physically possible because of the number of curves and hills on our roads.
1 It is assumed that vehicles typically slow down at approximately 0.1g with just engine braking, 0.2g under gentle braking and 0.5g under hard braking. Heavy vehicles are required to have brakes that will stop them at a deceleration of, at least 0.5g.
2 The safety of children crossing the road to or from a school bus
19
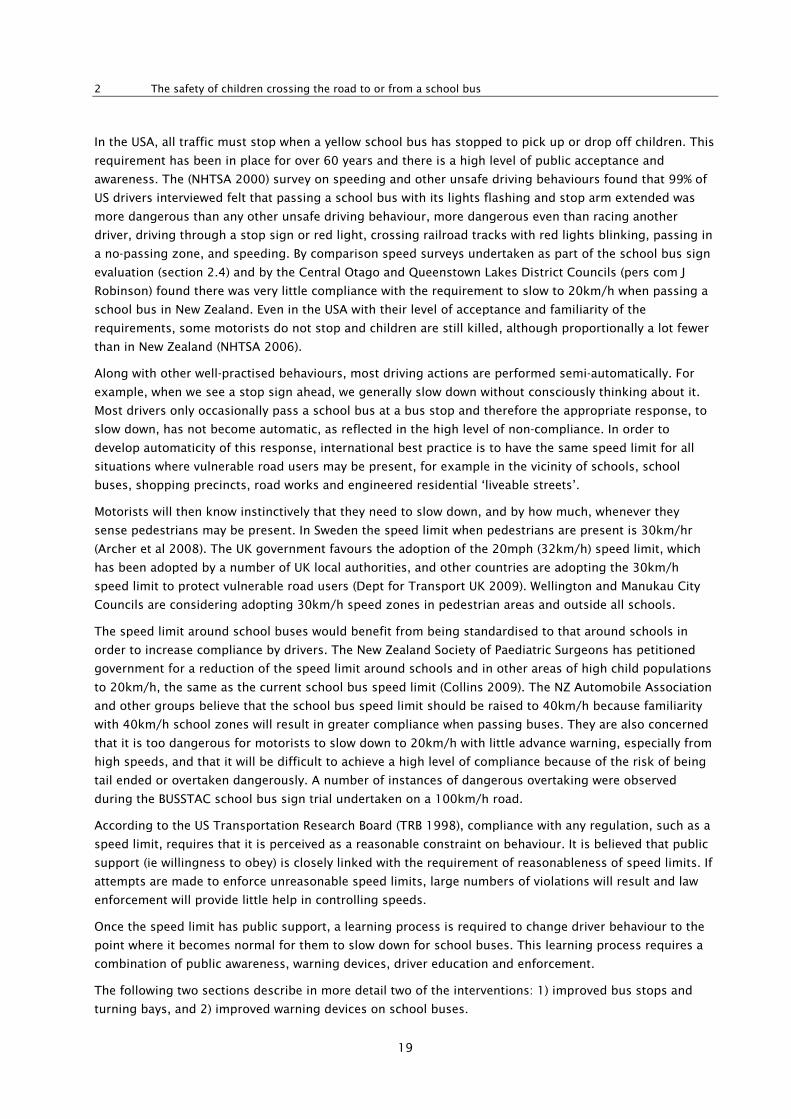
In the USA, all traffic must stop when a yellow school bus has stopped to pick up or drop off children. This
requirement has been in place for over 60 years and there is a high level of public acceptance and
awareness. The (NHTSA 2000) survey on speeding and other unsafe driving behaviours found that 99% of
US drivers interviewed felt that passing a school bus with its lights flashing and stop arm extended was
more dangerous than any other unsafe driving behaviour, more dangerous even than racing another
driver, driving through a stop sign or red light, crossing railroad tracks with red lights blinking, passing in
a no-passing zone, and speeding. By comparison speed surveys undertaken as part of the school bus sign
evaluation (section 2.4) and by the Central Otago and Queenstown Lakes District Councils (pers com J
Robinson) found there was very little compliance with the requirement to slow to 20km/h when passing a
school bus in New Zealand. Even in the USA with their level of acceptance and familiarity of the
requirements, some motorists do not stop and children are still killed, although proportionally a lot fewer
than in New Zealand (NHTSA 2006).
Along with other well-practised behaviours, most driving actions are performed semi-automatically. For
example, when we see a stop sign ahead, we generally slow down without consciously thinking about it.
Most drivers only occasionally pass a school bus at a bus stop and therefore the appropriate response, to
slow down, has not become automatic, as reflected in the high level of non-compliance. In order to
develop automaticity of this response, international best practice is to have the same speed limit for all
situations where vulnerable road users may be present, for example in the vicinity of schools, school
buses, shopping precincts, road works and engineered residential ‘liveable streets’.
Motorists will then know instinctively that they need to slow down, and by how much, whenever they
sense pedestrians may be present. In Sweden the speed limit when pedestrians are present is 30km/hr
(Archer et al 2008). The UK government favours the adoption of the 20mph (32km/h) speed limit, which
has been adopted by a number of UK local authorities, and other countries are adopting the 30km/h
speed limit to protect vulnerable road users (Dept for Transport UK 2009). Wellington and Manukau City
Councils are considering adopting 30km/h speed zones in pedestrian areas and outside all schools.
The speed limit around school buses would benefit from being standardised to that around schools in
order to increase compliance by drivers. The New Zealand Society of Paediatric Surgeons has petitioned
government for a reduction of the speed limit around schools and in other areas of high child populations
to 20km/h, the same as the current school bus speed limit (Collins 2009). The NZ Automobile Association
and other groups believe that the school bus speed limit should be raised to 40km/h because familiarity
with 40km/h school zones will result in greater compliance when passing buses. They are also concerned
that it is too dangerous for motorists to slow down to 20km/h with little advance warning, especially from
high speeds, and that it will be difficult to achieve a high level of compliance because of the risk of being
tail ended or overtaken dangerously. A number of instances of dangerous overtaking were observed
during the BUSSTAC school bus sign trial undertaken on a 100km/h road.
According to the US Transportation Research Board (TRB 1998), compliance with any regulation, such as a
speed limit, requires that it is perceived as a reasonable constraint on behaviour. It is believed that public
support (ie willingness to obey) is closely linked with the requirement of reasonableness of speed limits. If
attempts are made to enforce unreasonable speed limits, large numbers of violations will result and law
enforcement will provide little help in controlling speeds.
Once the speed limit has public support, a learning process is required to change driver behaviour to the
point where it becomes normal for them to slow down for school buses. This learning process requires a
combination of public awareness, warning devices, driver education and enforcement.
The following two sections describe in more detail two of the interventions: 1) improved bus stops and
turning bays, and 2) improved warning devices on school buses.
School bus safety
20
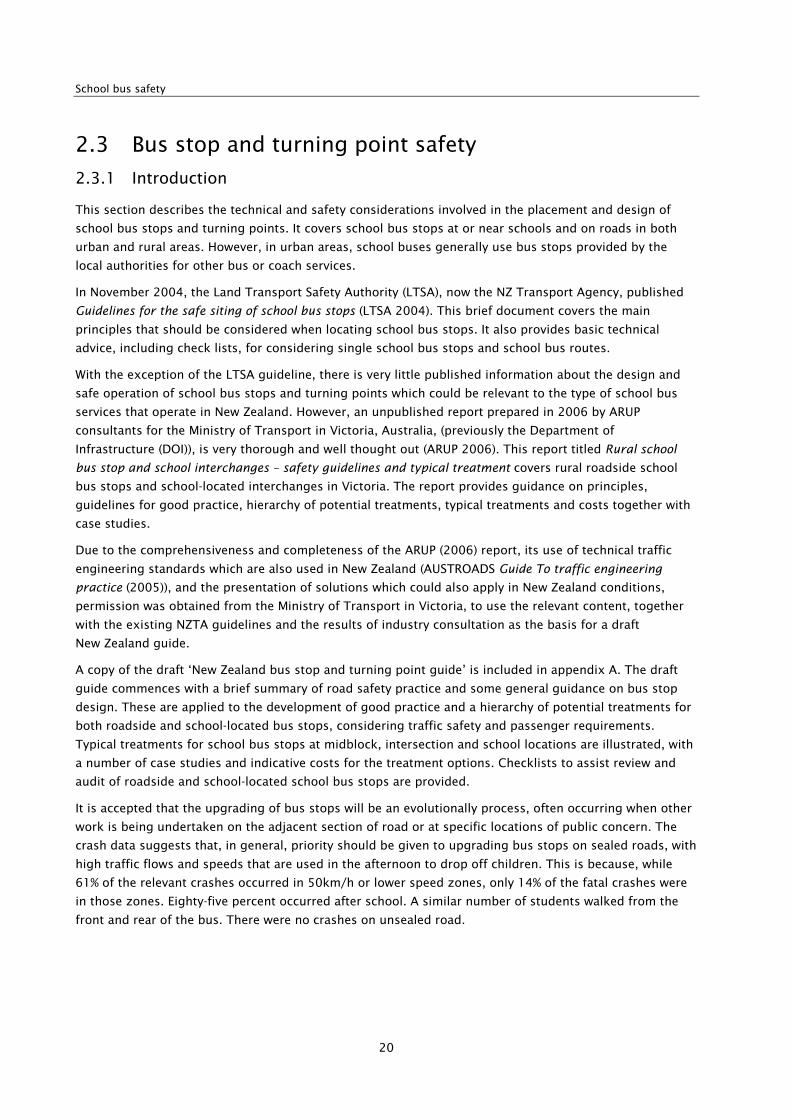
2.3 Bus stop and turning point safety
2.3.1 Introduction
This section describes the technical and safety considerations involved in the placement and design of
school bus stops and turning points. It covers school bus stops at or near schools and on roads in both
urban and rural areas. However, in urban areas, school buses generally use bus stops provided by the
local authorities for other bus or coach services.
In November 2004, the Land Transport Safety Authority (LTSA), now the NZ Transport Agency, published
Guidelines for the safe siting of school bus stops (LTSA 2004). This brief document covers the main
principles that should be considered when locating school bus stops. It also provides basic technical
advice, including check lists, for considering single school bus stops and school bus routes.
With the exception of the LTSA guideline, there is very little published information about the design and
safe operation of school bus stops and turning points which could be relevant to the type of school bus
services that operate in New Zealand. However, an unpublished report prepared in 2006 by ARUP
consultants for the Ministry of Transport in Victoria, Australia, (previously the Department of
Infrastructure (DOI)), is very thorough and well thought out (ARUP 2006). This report titled Rural school
bus stop and school interchanges – safety guidelines and typical treatment covers rural roadside school
bus stops and school-located interchanges in Victoria. The report provides guidance on principles,
guidelines for good practice, hierarchy of potential treatments, typical treatments and costs together with
case studies.
Due to the comprehensiveness and completeness of the ARUP (2006) report, its use of technical traffic
engineering standards which are also used in New Zealand (AUSTROADS Guide To traffic engineering
practice (2005)), and the presentation of solutions which could also apply in New Zealand conditions,
permission was obtained from the Ministry of Transport in Victoria, to use the relevant content, together
with the existing NZTA guidelines and the results of industry consultation as the basis for a draft
New Zealand guide.
A copy of the draft ‘New Zealand bus stop and turning point guide’ is included in appendix A. The draft
guide commences with a brief summary of road safety practice and some general guidance on bus stop
design. These are applied to the development of good practice and a hierarchy of potential treatments for
both roadside and school-located bus stops, considering traffic safety and passenger requirements.
Typical treatments for school bus stops at midblock, intersection and school locations are illustrated, with
a number of case studies and indicative costs for the treatment options. Checklists to assist review and
audit of roadside and school-located school bus stops are provided.
It is accepted that the upgrading of bus stops will be an evolutionally process, often occurring when other
work is being undertaken on the adjacent section of road or at specific locations of public concern. The
crash data suggests that, in general, priority should be given to upgrading bus stops on sealed roads, with
high traffic flows and speeds that are used in the afternoon to drop off children. This is because, while
61% of the relevant crashes occurred in 50km/h or lower speed zones, only 14% of the fatal crashes were
in those zones. Eighty-five percent occurred after school. A similar number of students walked from the
front and rear of the bus. There were no crashes on unsealed road.
2 The safety of children crossing the road to or from a school bus
21
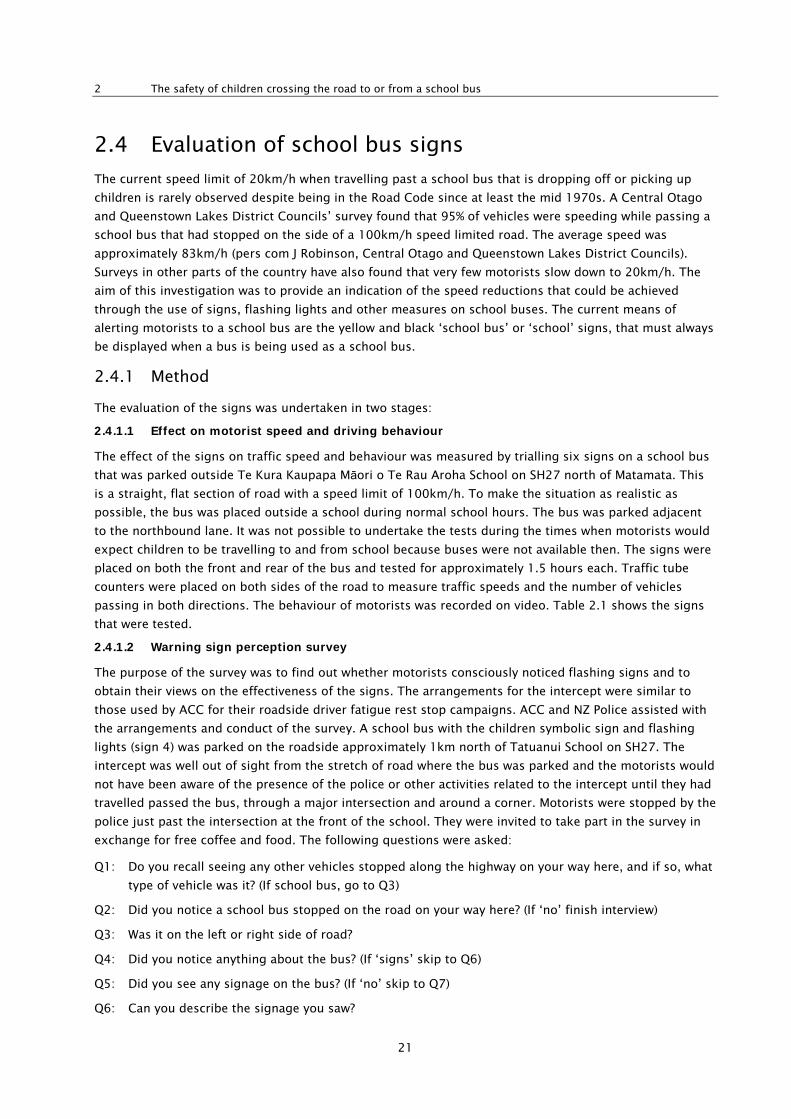
2.4 Evaluation of school bus signs
The current speed limit of 20km/h when travelling past a school bus that is dropping off or picking up
children is rarely observed despite being in the Road Code since at least the mid 1970s. A Central Otago
and Queenstown Lakes District Councils’ survey found that 95% of vehicles were speeding while passing a
school bus that had stopped on the side of a 100km/h speed limited road. The average speed was
approximately 83km/h (pers com J Robinson, Central Otago and Queenstown Lakes District Councils).
Surveys in other parts of the country have also found that very few motorists slow down to 20km/h. The
aim of this investigation was to provide an indication of the speed reductions that could be achieved
through the use of signs, flashing lights and other measures on school buses. The current means of
alerting motorists to a school bus are the yellow and black ‘school bus’ or ‘school’ signs, that must always
be displayed when a bus is being used as a school bus.
2.4.1 Method
The evaluation of the signs was undertaken in two stages:
2.4.1.1 Effect on motorist speed and driving behaviour
The effect of the signs on traffic speed and behaviour was measured by trialling six signs on a school bus
that was parked outside Te Kura Kaupapa Māori o Te Rau Aroha School on SH27 north of Matamata. This
is a straight, flat section of road with a speed limit of 100km/h. To make the situation as realistic as
possible, the bus was placed outside a school during normal school hours. The bus was parked adjacent
to the northbound lane. It was not possible to undertake the tests during the times when motorists would
expect children to be travelling to and from school because buses were not available then. The signs were
placed on both the front and rear of the bus and tested for approximately 1.5 hours each. Traffic tube
counters were placed on both sides of the road to measure traffic speeds and the number of vehicles
passing in both directions. The behaviour of motorists was recorded on video. Table 2.1 shows the signs
that were tested.
2.4.1.2 Warning sign perception survey
The purpose of the survey was to find out whether motorists consciously noticed flashing signs and to
obtain their views on the effectiveness of the signs. The arrangements for the intercept were similar to
those used by ACC for their roadside driver fatigue rest stop campaigns. ACC and NZ Police assisted with
the arrangements and conduct of the survey. A school bus with the children symbolic sign and flashing
lights (sign 4) was parked on the roadside approximately 1km north of Tatuanui School on SH27. The
intercept was well out of sight from the stretch of road where the bus was parked and the motorists would
not have been aware of the presence of the police or other activities related to the intercept until they had
travelled passed the bus, through a major intersection and around a corner. Motorists were stopped by the
police just past the intersection at the front of the school. They were invited to take part in the survey in
exchange for free coffee and food. The following questions were asked:
Q1: Do you recall seeing any other vehicles stopped along the highway on your way here, and if so, what
type of vehicle was it? (If school bus, go to Q3)
Q2: Did you notice a school bus stopped on the road on your way here? (If ‘no’ finish interview)
Q3: Was it on the left or right side of road?
Q4: Did you notice anything about the bus? (If ‘signs’ skip to Q6)
Q5: Did you see any signage on the bus? (If ‘no’ skip to Q7)
Q6: Can you describe the signage you saw?
School bus safety
22
Q7: Did the bus affect your driving and, if so, how?
Q8: Finally, how would you rate the overall safety of the signs and lighting on that school bus on a scale
of 1 to 5 with 1 being very unsafe and 5 being very safe?
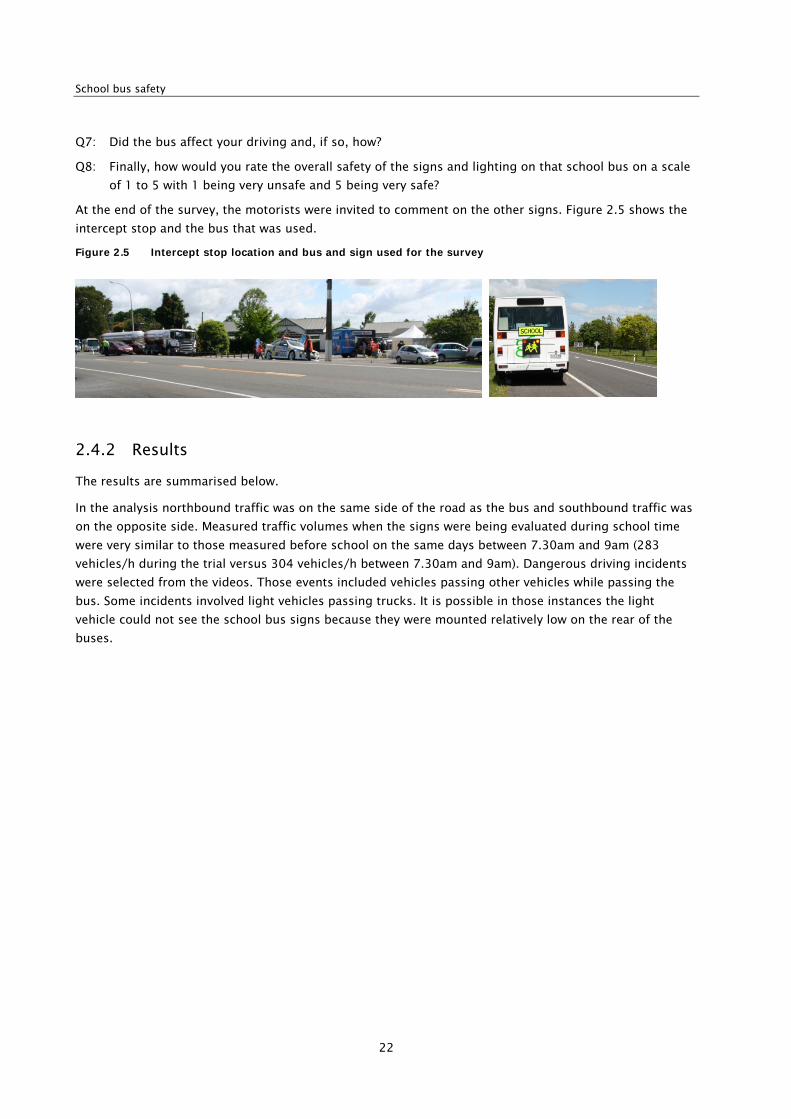
At the end of the survey, the motorists were invited to comment on the other signs. Figure 2.5 shows the
intercept stop and the bus that was used.
Figure 2.5 Intercept stop location and bus and sign used for the survey
2.4.2 Results
The results are summarised below.
In the analysis northbound traffic was on the same side of the road as the bus and southbound traffic was
on the opposite side. Measured traffic volumes when the signs were being evaluated during school time
were very similar to those measured before school on the same days between 7.30am and 9am (283
vehicles/h during the trial versus 304 vehicles/h between 7.30am and 9am). Dangerous driving incidents
were selected from the videos. Those events included vehicles passing other vehicles while passing the
bus. Some incidents involved light vehicles passing trucks. It is possible in those instances the light
vehicle could not see the school bus signs because they were mounted relatively low on the rear of the
buses.
2 The safety of children crossing the road to or from a school bus
23
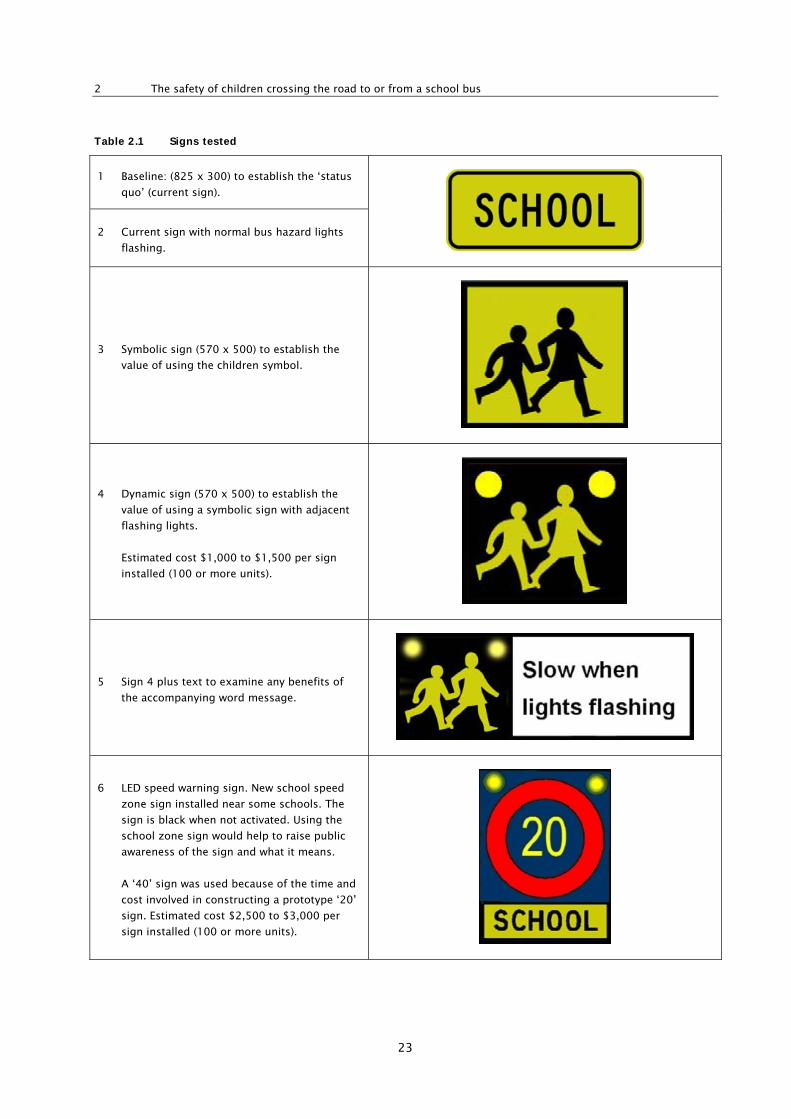
Table 2.1 Signs tested
1 Baseline: (825 x 300) to establish the ‘status
quo’ (current sign).
2 Current sign with normal bus hazard lights
flashing.
3 Symbolic sign (570 x 500) to establish the
value of using the children symbol.
4 Dynamic sign (570 x 500) to establish the
value of using a symbolic sign with adjacent
flashing lights.
Estimated cost $1,000 to $1,500 per sign
installed (100 or more units).
5 Sign 4 plus text to examine any benefits of
the accompanying word message.
6 LED speed warning sign. New school speed
zone sign installed near some schools. The
sign is black when not activated. Using the
school zone sign would help to raise public
awareness of the sign and what it means.
A ‘40’ sign was used because of the time and
cost involved in constructing a prototype ‘20’
sign. Estimated cost $2,500 to $3,000 per
sign installed (100 or more units).
School bus safety
24
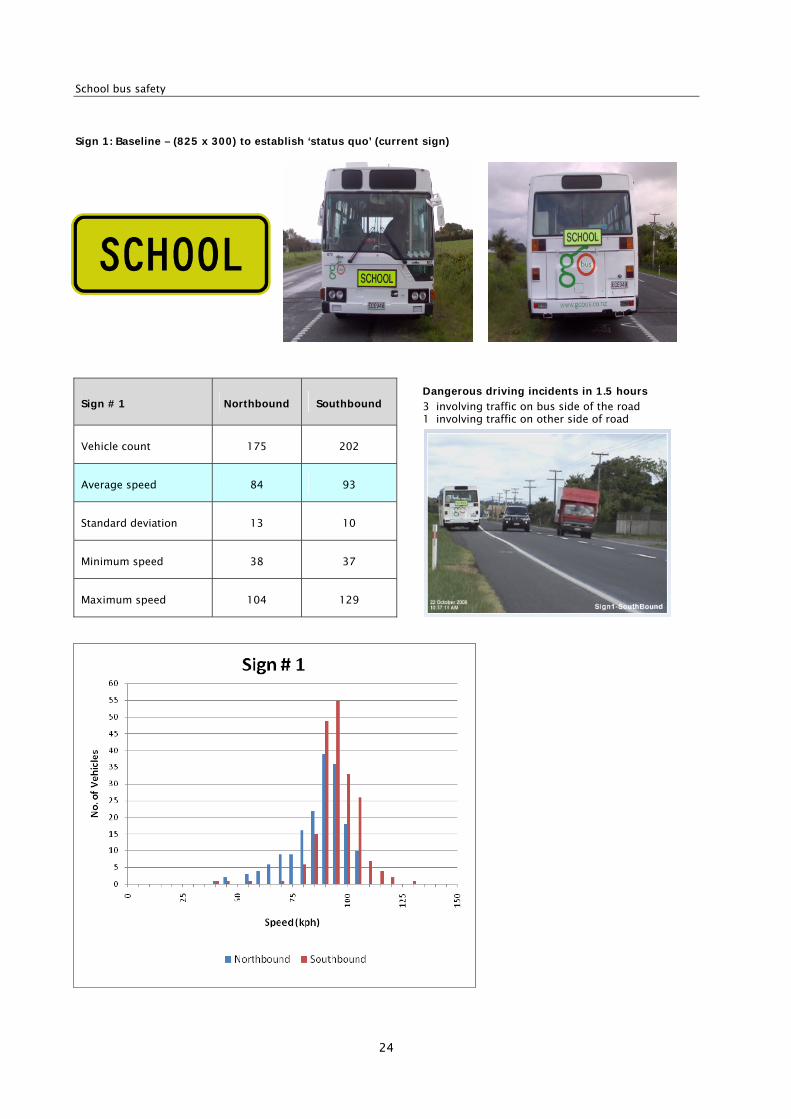
Sign 1: Baseline – (825 x 300) to establish ‘status quo’ (current sign)
Sign # 1 Northbound Southbound Dangerous driving incidents in 1.5 hours
3 involving traffic on bus side of the road 1 involving traffic on other side of road
Vehicle count 175 202
Average speed 84 93
Standard deviation 13 10
Minimum speed 38 37
Maximum speed 104 129
2 The safety of children crossing the road to or from a school bus
25
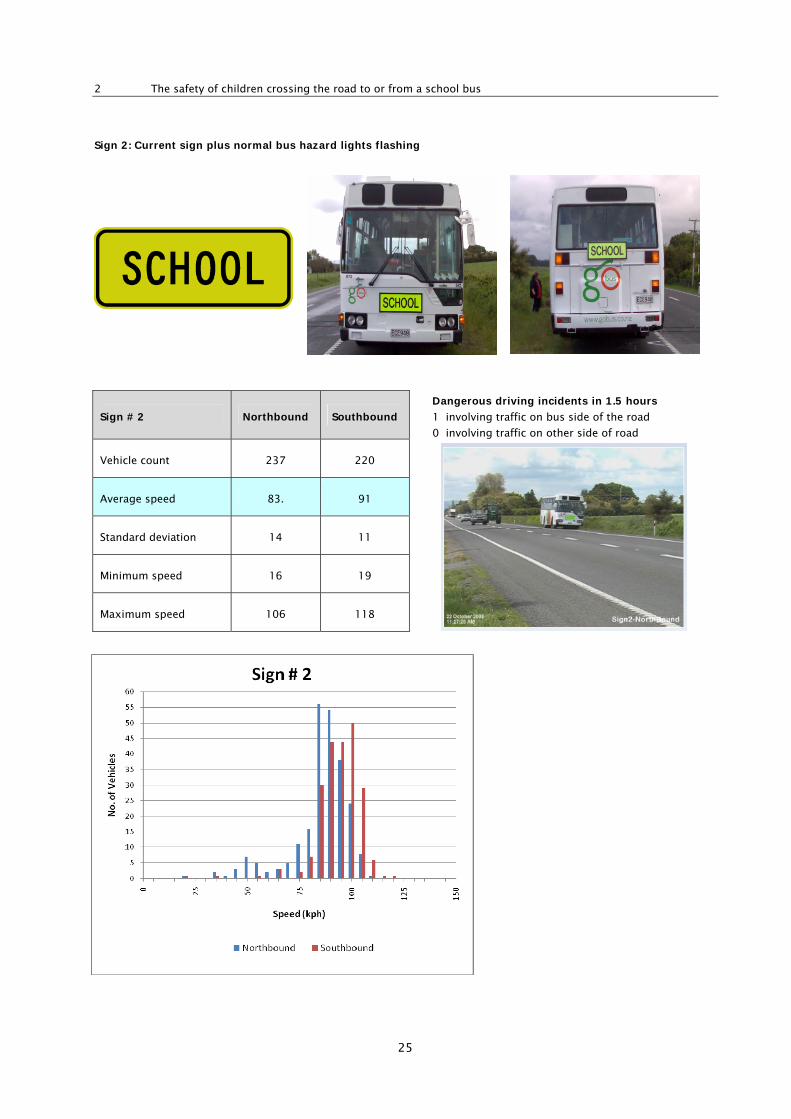
Sign 2: Current sign plus normal bus hazard lights flashing
Sign # 2 Northbound Southbound
Dangerous driving incidents in 1.5 hours
1 involving traffic on bus side of the road
0 involving traffic on other side of road
Vehicle count 237 220
Average speed 83. 91
Standard deviation 14 11
Minimum speed 16 19
Maximum speed 106 118
School bus safety
26
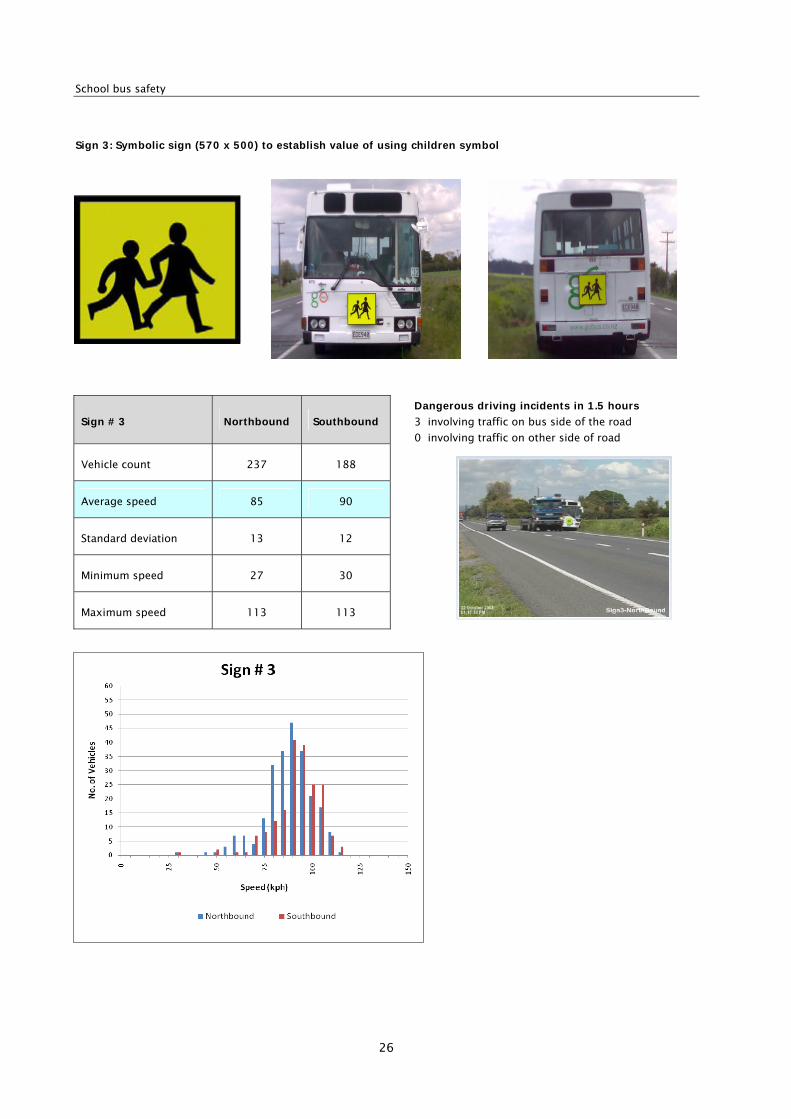
Sign 3: Symbolic sign (570 x 500) to establish value of using children symbol
Sign # 3 Northbound Southbound
Dangerous driving incidents in 1.5 hours
3 involving traffic on bus side of the road
0 involving traffic on other side of road
Vehicle count 237 188
Average speed 85 90
Standard deviation 13 12
Minimum speed 27 30
Maximum speed 113 113
2 The safety of children crossing the road to or from a school bus
27
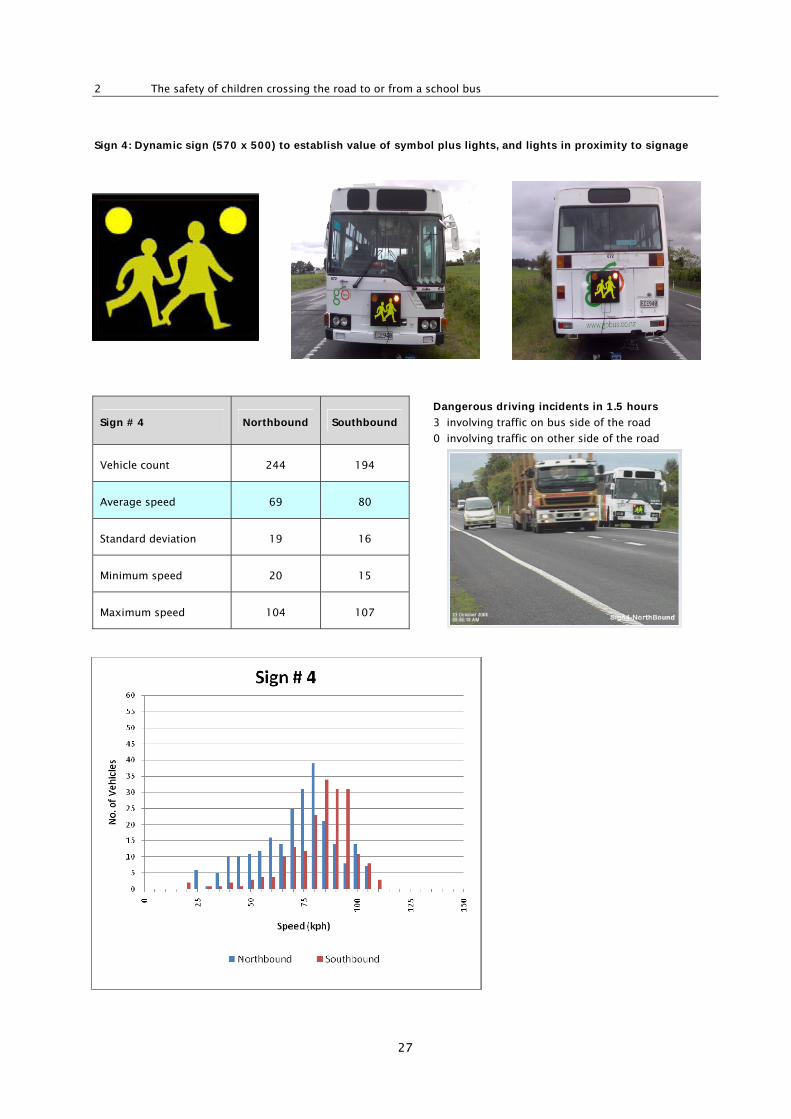
Sign 4: Dynamic sign (570 x 500) to establish value of symbol plus lights, and lights in proximity to signage
Sign # 4 Northbound Southbound
Dangerous driving incidents in 1.5 hours
3 involving traffic on bus side of the road
0 involving traffic on other side of the road
Vehicle count 244 194
Average speed 69 80
Standard deviation 19 16
Minimum speed 20 15
Maximum speed 104 107
School bus safety
28
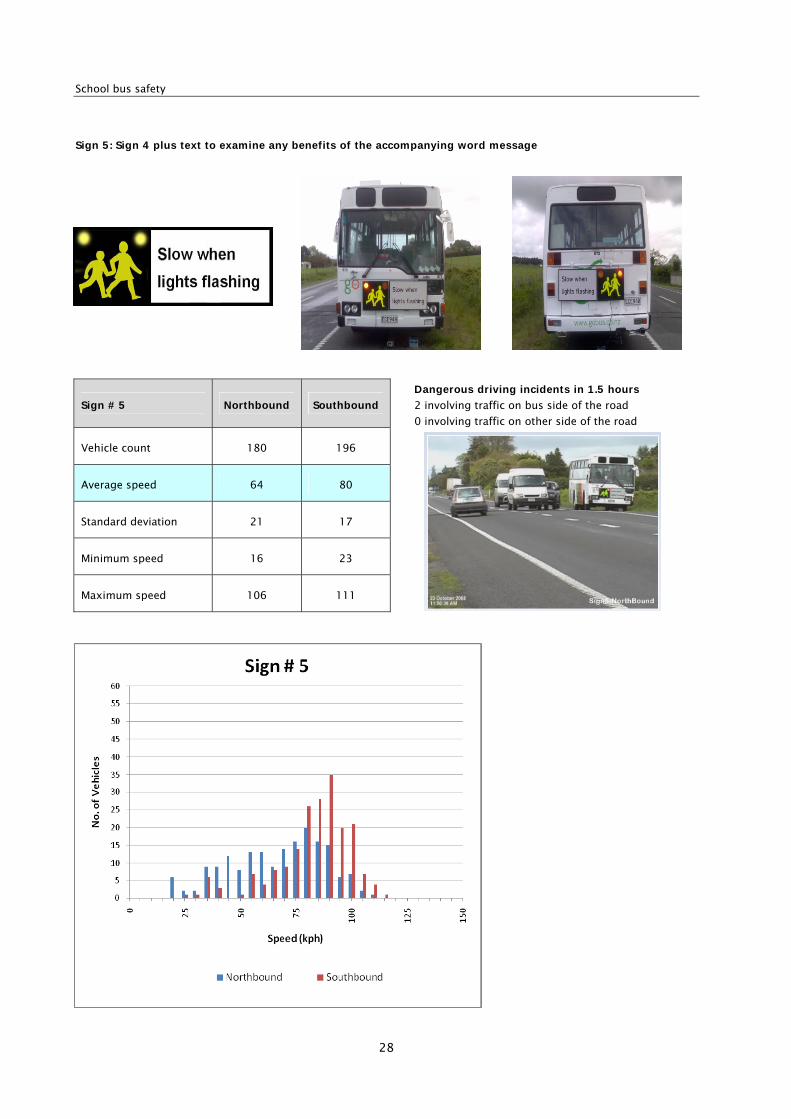
Sign 5: Sign 4 plus text to examine any benefits of the accompanying word message
Sign # 5 Northbound Southbound
Dangerous driving incidents in 1.5 hours
2 involving traffic on bus side of the road
0 involving traffic on other side of the road
Vehicle count 180 196
Average speed 64 80
Standard deviation 21 17
Minimum speed 16 23
Maximum speed 106 111
2 The safety of children crossing the road to or from a school bus
29
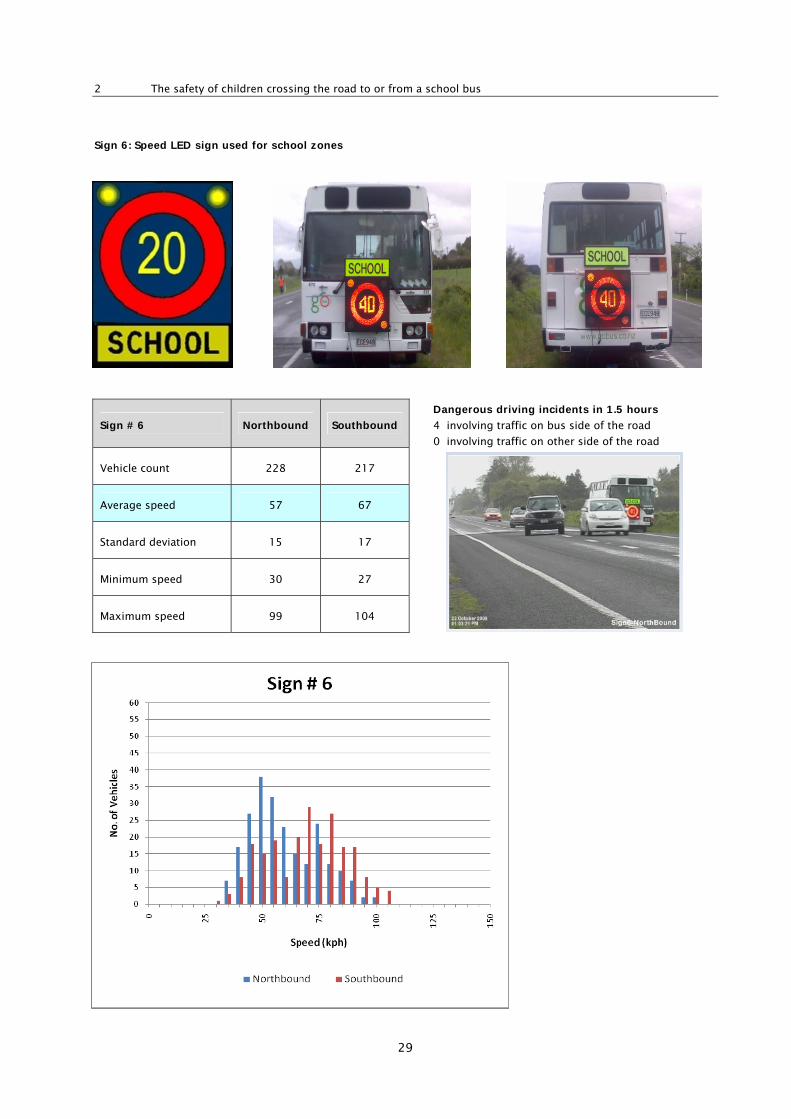
Sign 6: Speed LED sign used for school zones
Sign # 6 Northbound Southbound
Dangerous driving incidents in 1.5 hours
4 involving traffic on bus side of the road
0 involving traffic on other side of the road
Vehicle count 228 217
Average speed 57 67
Standard deviation 15 17
Minimum speed 30 27
Maximum speed 99 104
School bus safety
30
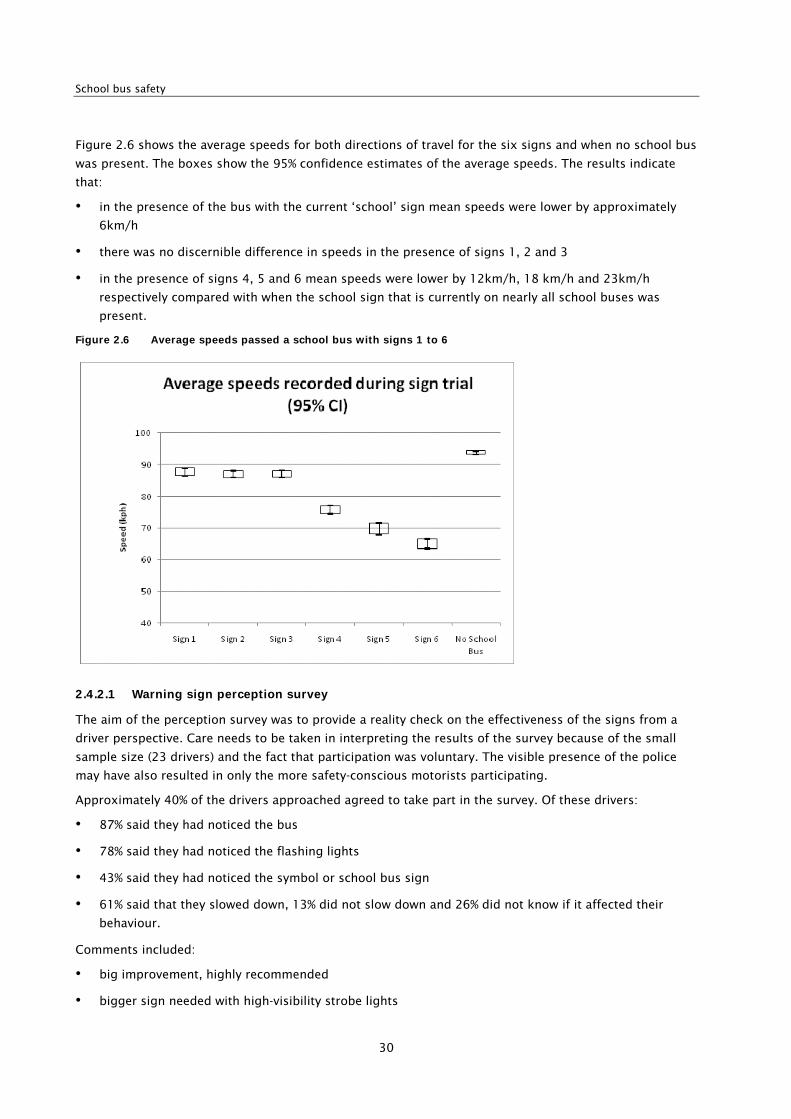
Figure 2.6 shows the average speeds for both directions of travel for the six signs and when no school bus
was present. The boxes show the 95% confidence estimates of the average speeds. The results indicate
that:
• in the presence of the bus with the current ‘school’ sign mean speeds were lower by approximately
6km/h
• there was no discernible difference in speeds in the presence of signs 1, 2 and 3
• in the presence of signs 4, 5 and 6 mean speeds were lower by 12km/h, 18 km/h and 23km/h
respectively compared with when the school sign that is currently on nearly all school buses was
present.
Figure 2.6 Average speeds passed a school bus with signs 1 to 6
2.4.2.1 Warning sign perception survey
The aim of the perception survey was to provide a reality check on the effectiveness of the signs from a
driver perspective. Care needs to be taken in interpreting the results of the survey because of the small
sample size (23 drivers) and the fact that participation was voluntary. The visible presence of the police
may have also resulted in only the more safety-conscious motorists participating.
Approximately 40% of the drivers approached agreed to take part in the survey. Of these drivers:
• 87% said they had noticed the bus
• 78% said they had noticed the flashing lights
• 43% said they had noticed the symbol or school bus sign
• 61% said that they slowed down, 13% did not slow down and 26% did not know if it affected their
behaviour.
Comments included:
• big improvement, highly recommended
• bigger sign needed with high-visibility strobe lights
2 The safety of children crossing the road to or from a school bus
31
• flashing light drew the attention
• having the flashing lights close together grabbed the attention – normal hazard warning lights don’t
• enforce the 20km/h speed limit
• traffic should stop, change the law
• fluorescent vests should be provided to children
• bus stops should be made more visible.
2.4.3 Discussion
The results suggest that:
• The current sign (sign 1) had only a small effect on vehicle speed, reducing speeds by approximately
6km/h. However this reduction may well have been simply because of the presence of the bus.
• The addition of the bus hazard warning lights on (sign 2) made no discernible difference to vehicle
speeds.
• Replacing the current signs with the standard children walking symbolic sign (sign 3) also made no
discernible difference.
• The children symbolic signs that included two closely spaced flashing lights (sign 4) reduced average
traffic speeds by 12km/h compared with sign 1. Drivers surveyed said that they noticed the flashing
lights because they were clustered together.
• The addition of words telling motorists to slow down (sign 5) slowed the traffic by a further 6km/h.
• The flashing LED ‘40’ signs (sign 6) reduced average speeds by 23km/h compared with the current
sign (sign 1).
• There were, on average, 1.5 incidences of ‘dangerous’ driving per hour during the trial. The sample
size was too small to determine if there were any differences between signs.
There are several factors, other than the signs, that may have influenced the speeds and behaviours of
motorists:
• The signs were evaluated during school hours because there were no spare buses or drivers available
when the buses would normally be out on their school bus runs. This would have had some effect on
vehicle speed with drivers more likely to slow down when they are expecting children to be getting on
or off a bus.
• The bus was empty while the measurements were being made. Again it is expected that drivers will
slow down more if they can see students on the bus.
• Average traffic volumes were slightly higher before and after school (329 vehicles per hour) than when
the measurements were taken (276 vehicles per hour). This may have affected the number of passing
opportunities but there was no sign that traffic speeds were affected by congestion before or after
school because of the traffic volume.
• Sign 6, which displayed the ‘40’ sign, would have suggested to motorists that the speed limit was
40km/h rather than 20km/h. It is common at road works and other speed restricted sites for
motorists to slow down to a speed that is close to but higher than that posted.

School bus safety
32
There are advantages in having the speed limit and signage around school zones the same as that around
school buses when children are present. Many motorists only come across a stopped school bus on rare
occasions.
On the other hand 20km/h is the legal speed limit for this situation. The ‘40’ LED sign was larger than the
other signs tested and may be difficult to fit on some buses because of its size. A smaller ‘20’ is to be
evaluated soon as part of a follow up project.
3 Safety of children while on school buses
33
3 Safety of children while on school buses
3.1 Bus occupant restraints
This section discusses the effectiveness of safety belts and other forms of bus occupant restraint and
protection systems.
3.1.1 Safety belts
Safety belts are a direct method of retaining passengers within a seating compartment. Safety belts
provide occupant crash protection when high levels of deceleration are involved such as a head-on crash,
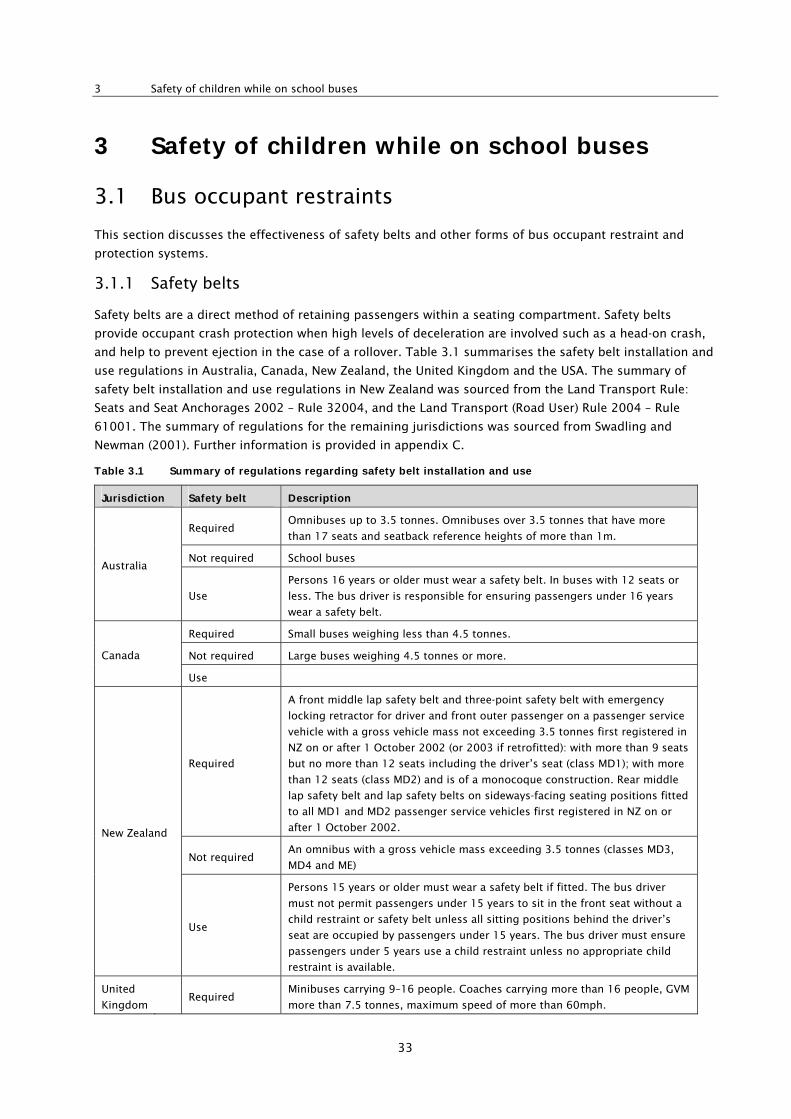
and help to prevent ejection in the case of a rollover. Table 3.1 summarises the safety belt installation and
use regulations in Australia, Canada, New Zealand, the United Kingdom and the USA. The summary of
safety belt installation and use regulations in New Zealand was sourced from the Land Transport Rule:
Seats and Seat Anchorages 2002 – Rule 32004, and the Land Transport (Road User) Rule 2004 – Rule
61001. The summary of regulations for the remaining jurisdictions was sourced from Swadling and
Newman (2001). Further information is provided in appendix C.
Table 3.1 Summary of regulations regarding safety belt installation and use
Jurisdiction Safety belt Description
Required Omnibuses up to 3.5 tonnes. Omnibuses over 3.5 tonnes that have more
than 17 seats and seatback reference heights of more than 1m.
Not required School buses Australia
Use
Persons 16 years or older must wear a safety belt. In buses with 12 seats or
less. The bus driver is responsible for ensuring passengers under 16 years
wear a safety belt.
Required Small buses weighing less than 4.5 tonnes.
Not required Large buses weighing 4.5 tonnes or more. Canada
Use
Required
A front middle lap safety belt and three-point safety belt with emergency
locking retractor for driver and front outer passenger on a passenger service
vehicle with a gross vehicle mass not exceeding 3.5 tonnes first registered in
NZ on or after 1 October 2002 (or 2003 if retrofitted): with more than 9 seats
but no more than 12 seats including the driver’s seat (class MD1); with more
than 12 seats (class MD2) and is of a monocoque construction. Rear middle
lap safety belt and lap safety belts on sideways-facing seating positions fitted
to all MD1 and MD2 passenger service vehicles first registered in NZ on or
after 1 October 2002.
Not required An omnibus with a gross vehicle mass exceeding 3.5 tonnes (classes MD3,
MD4 and ME)
New Zealand
Use
Persons 15 years or older must wear a safety belt if fitted. The bus driver
must not permit passengers under 15 years to sit in the front seat without a
child restraint or safety belt unless all sitting positions behind the driver’s
seat are occupied by passengers under 15 years. The bus driver must ensure
passengers under 5 years use a child restraint unless no appropriate child
restraint is available.
United
Kingdom Required
Minibuses carrying 9–16 people. Coaches carrying more than 16 people, GVM
more than 7.5 tonnes, maximum speed of more than 60mph.
School bus safety
34
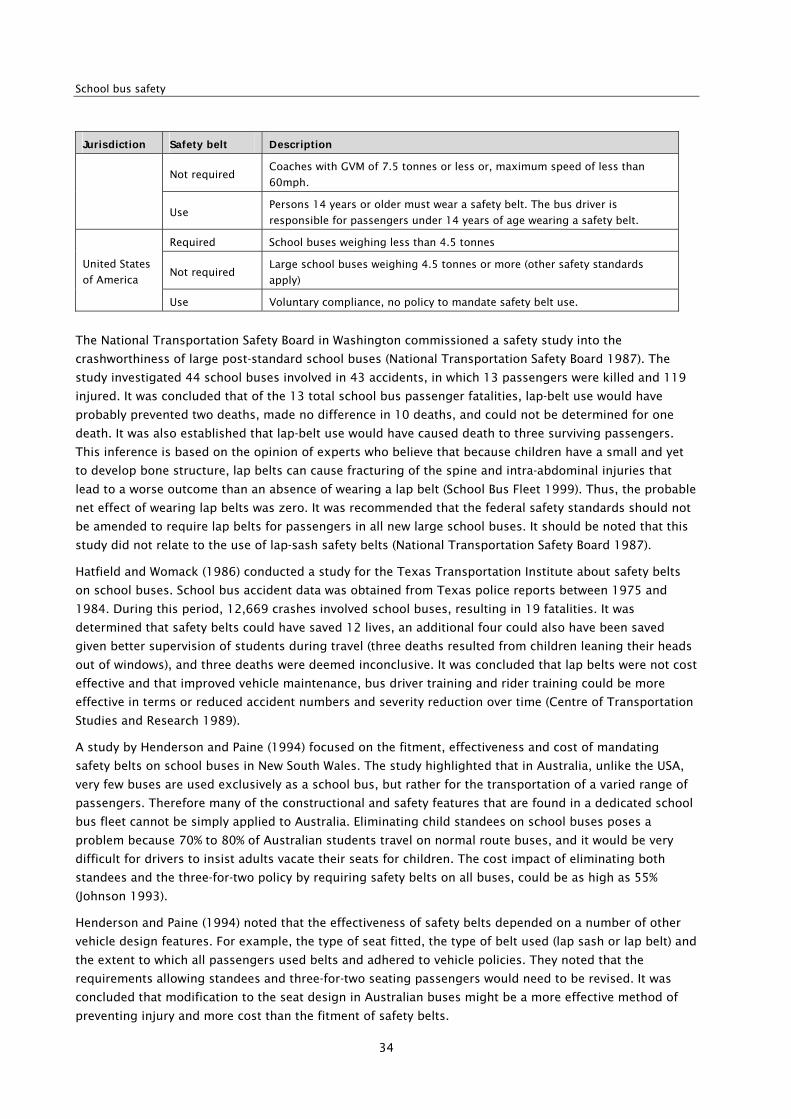
Jurisdiction Safety belt Description
Not required Coaches with GVM of 7.5 tonnes or less or, maximum speed of less than
60mph.
Use Persons 14 years or older must wear a safety belt. The bus driver is
responsible for passengers under 14 years of age wearing a safety belt.
Required School buses weighing less than 4.5 tonnes
Not required Large school buses weighing 4.5 tonnes or more (other safety standards
apply)
United States
of America
Use Voluntary compliance, no policy to mandate safety belt use.
The National Transportation Safety Board in Washington commissioned a safety study into the
crashworthiness of large post-standard school buses (National Transportation Safety Board 1987). The
study investigated 44 school buses involved in 43 accidents, in which 13 passengers were killed and 119
injured. It was concluded that of the 13 total school bus passenger fatalities, lap-belt use would have
probably prevented two deaths, made no difference in 10 deaths, and could not be determined for one
death. It was also established that lap-belt use would have caused death to three surviving passengers.
This inference is based on the opinion of experts who believe that because children have a small and yet
to develop bone structure, lap belts can cause fracturing of the spine and intra-abdominal injuries that
lead to a worse outcome than an absence of wearing a lap belt (School Bus Fleet 1999). Thus, the probable
net effect of wearing lap belts was zero. It was recommended that the federal safety standards should not
be amended to require lap belts for passengers in all new large school buses. It should be noted that this
study did not relate to the use of lap-sash safety belts (National Transportation Safety Board 1987).
Hatfield and Womack (1986) conducted a study for the Texas Transportation Institute about safety belts
on school buses. School bus accident data was obtained from Texas police reports between 1975 and
1984. During this period, 12,669 crashes involved school buses, resulting in 19 fatalities. It was
determined that safety belts could have saved 12 lives, an additional four could also have been saved
given better supervision of students during travel (three deaths resulted from children leaning their heads
out of windows), and three deaths were deemed inconclusive. It was concluded that lap belts were not cost
effective and that improved vehicle maintenance, bus driver training and rider training could be more
effective in terms or reduced accident numbers and severity reduction over time (Centre of Transportation
Studies and Research 1989).
A study by Henderson and Paine (1994) focused on the fitment, effectiveness and cost of mandating
safety belts on school buses in New South Wales. The study highlighted that in Australia, unlike the USA,
very few buses are used exclusively as a school bus, but rather for the transportation of a varied range of
passengers. Therefore many of the constructional and safety features that are found in a dedicated school
bus fleet cannot be simply applied to Australia. Eliminating child standees on school buses poses a
problem because 70% to 80% of Australian students travel on normal route buses, and it would be very
difficult for drivers to insist adults vacate their seats for children. The cost impact of eliminating both
standees and the three-for-two policy by requiring safety belts on all buses, could be as high as 55%
(Johnson 1993).
Henderson and Paine (1994) noted that the effectiveness of safety belts depended on a number of other
vehicle design features. For example, the type of seat fitted, the type of belt used (lap sash or lap belt) and
the extent to which all passengers used belts and adhered to vehicle policies. They noted that the
requirements allowing standees and three-for-two seating passengers would need to be revised. It was
concluded that modification to the seat design in Australian buses might be a more effective method of
preventing injury and more cost than the fitment of safety belts.
3 Safety of children while on school buses
35
3.1.2 Compartmentalisation
The approach used by dedicated school bus fleets in the USA and Canada is called compartmentalisation.
Compartmentalisation is a passive safety measure that absorbs crash energy through the use of high-back
seats, increased seat padding, and restraining barriers in front of seats.
A study undertaken by the Centre of Transportation Studies and Research concluded that
compartmentalisation worked well to protect school bus passengers from injuries in all manner of
accidents (Centre of Transportation Studies and Research 1989). Similarly, an earlier study by Farr (1984)
concluded that compartmentalisation gave ample protection for frontal collisions. The study scrutinised
the effects of safety restraints in school buses by performing full-scale crash testing. The use of lap belts
was cautioned in this study for their potential to result in more serious injuries to the neck and head of
restrained occupants.
Transport Research Board in the USA released its Special Report 222 into ‘Improving school bus safety’
(TRB 1989). The study investigated the cost effectiveness, and injury reduction and life-saving potential of
nine safety measures. It was determined that the measures offering the greatest potential safety
improvement (per dollar invested) were higher seat backs (for reducing fatalities and especially reducing
injuries) and pupil education programmes. The least effective measures for reducing fatalities or injuries
(per dollar invested) were deemed to be safety belts and school bus monitors.
3.1.3 Cost-benefit analysis of safety belts on school buses
This section analyses the benefit and cost of fitting safety belts to New Zealand’s school bus fleet. The
social benefit of having safety belts fitted is based on historical school bus crash and injury data.
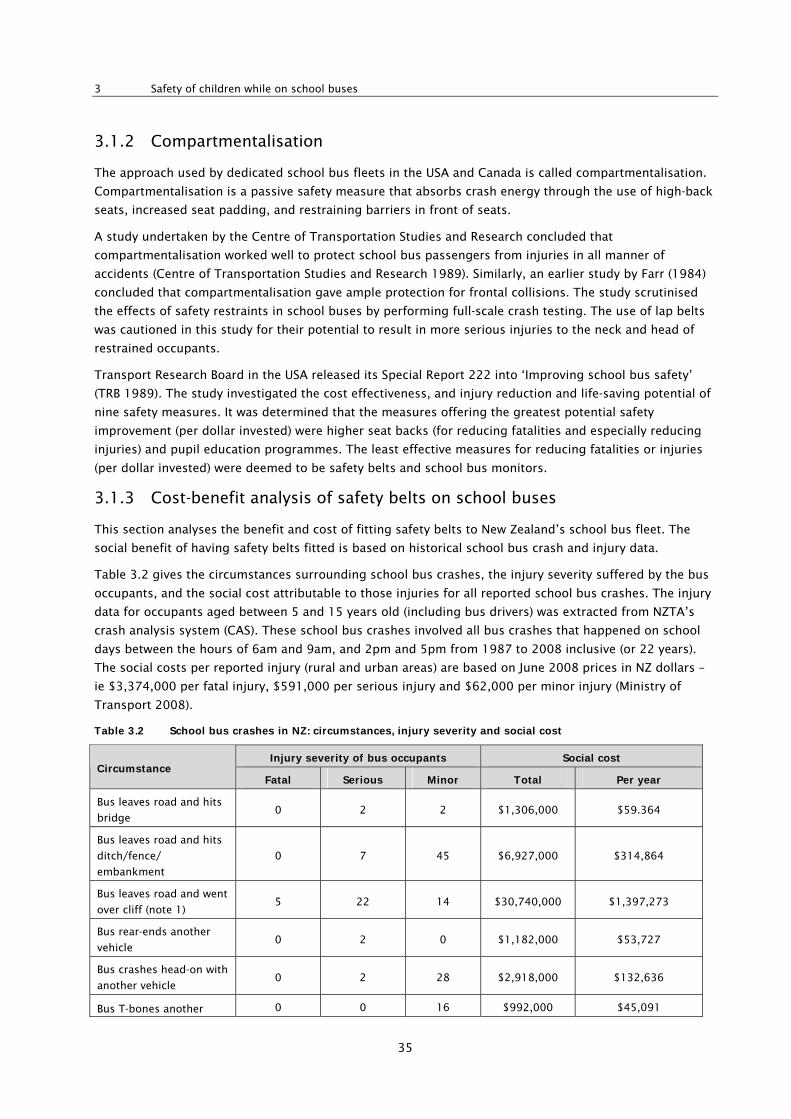
Table 3.2 gives the circumstances surrounding school bus crashes, the injury severity suffered by the bus
occupants, and the social cost attributable to those injuries for all reported school bus crashes. The injury
data for occupants aged between 5 and 15 years old (including bus drivers) was extracted from NZTA’s
crash analysis system (CAS). These school bus crashes involved all bus crashes that happened on school
days between the hours of 6am and 9am, and 2pm and 5pm from 1987 to 2008 inclusive (or 22 years).
The social costs per reported injury (rural and urban areas) are based on June 2008 prices in NZ dollars –
ie $3,374,000 per fatal injury, $591,000 per serious injury and $62,000 per minor injury (Ministry of
Transport 2008).
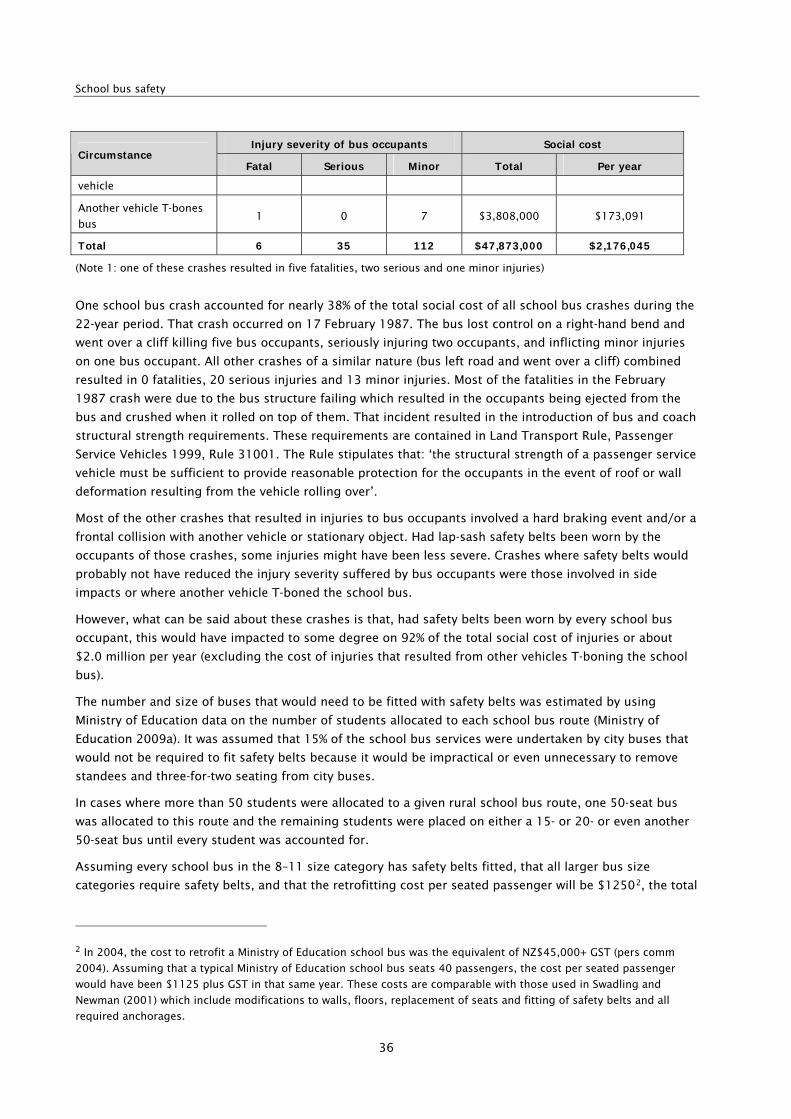
Table 3.2 School bus crashes in NZ: circumstances, injury severity and social cost
Injury severity of bus occupants Social cost Circumstance
Fatal Serious Minor Total Per year
Bus leaves road and hits
bridge 0 2 2 $1,306,000 $59.364
Bus leaves road and hits
ditch/fence/
embankment
0 7 45 $6,927,000 $314,864
Bus leaves road and went
over cliff (note 1) 5 22 14 $30,740,000 $1,397,273
Bus rear-ends another
vehicle 0 2 0 $1,182,000 $53,727
Bus crashes head-on with
another vehicle 0 2 28 $2,918,000 $132,636
Bus T-bones another 0 0 16 $992,000 $45,091
School bus safety
36
Injury severity of bus occupants Social cost Circumstance
Fatal Serious Minor Total Per year
vehicle
Another vehicle T-bones
bus 1 0 7 $3,808,000 $173,091
Total 6 35 112 $47,873,000 $2,176,045
(Note 1: one of these crashes resulted in five fatalities, two serious and one minor injuries)
One school bus crash accounted for nearly 38% of the total social cost of all school bus crashes during the
22-year period. That crash occurred on 17 February 1987. The bus lost control on a right-hand bend and
went over a cliff killing five bus occupants, seriously injuring two occupants, and inflicting minor injuries
on one bus occupant. All other crashes of a similar nature (bus left road and went over a cliff) combined
resulted in 0 fatalities, 20 serious injuries and 13 minor injuries. Most of the fatalities in the February
1987 crash were due to the bus structure failing which resulted in the occupants being ejected from the
bus and crushed when it rolled on top of them. That incident resulted in the introduction of bus and coach
structural strength requirements. These requirements are contained in Land Transport Rule, Passenger
Service Vehicles 1999, Rule 31001. The Rule stipulates that: ‘the structural strength of a passenger service
vehicle must be sufficient to provide reasonable protection for the occupants in the event of roof or wall
deformation resulting from the vehicle rolling over’.
Most of the other crashes that resulted in injuries to bus occupants involved a hard braking event and/or a
frontal collision with another vehicle or stationary object. Had lap-sash safety belts been worn by the
occupants of those crashes, some injuries might have been less severe. Crashes where safety belts would
probably not have reduced the injury severity suffered by bus occupants were those involved in side
impacts or where another vehicle T-boned the school bus.
However, what can be said about these crashes is that, had safety belts been worn by every school bus
occupant, this would have impacted to some degree on 92% of the total social cost of injuries or about
$2.0 million per year (excluding the cost of injuries that resulted from other vehicles T-boning the school
bus).
The number and size of buses that would need to be fitted with safety belts was estimated by using
Ministry of Education data on the number of students allocated to each school bus route (Ministry of
Education 2009a). It was assumed that 15% of the school bus services were undertaken by city buses that
would not be required to fit safety belts because it would be impractical or even unnecessary to remove
standees and three-for-two seating from city buses.
In cases where more than 50 students were allocated to a given rural school bus route, one 50-seat bus
was allocated to this route and the remaining students were placed on either a 15- or 20- or even another
50-seat bus until every student was accounted for.
Assuming every school bus in the 8–11 size category has safety belts fitted, that all larger bus size
categories require safety belts, and that the retrofitting cost per seated passenger will be $12502, the total
2 In 2004, the cost to retrofit a Ministry of Education school bus was the equivalent of NZ$45,000+ GST (pers comm
2004). Assuming that a typical Ministry of Education school bus seats 40 passengers, the cost per seated passenger
would have been $1125 plus GST in that same year. These costs are comparable with those used in Swadling and
Newman (2001) which include modifications to walls, floors, replacement of seats and fitting of safety belts and all
required anchorages.
3 Safety of children while on school buses
37
cost to fit safety belts to the entire fleet of school buses will be $81.3 million. An extension of fitting
safety belts on school buses is the removal of all standees and occupied three-for-two seating positions. In
2009, an estimated 95,000 students (excluding those who were SESTA-funded or used public transport)
travelled to school by bus at an estimated cost of $121 million ($150 million less SESTA funding and travel
allowance costs). Thus the cost per student is approximately $1274 annually. Assuming that there are 10%
standees on 10% of the large school buses (bus sizes 15–20 and larger), the equivalent of 950 additional
seats will be required. Hence the cost to provide additional school bus services to eliminate standees will
be approximately $1.21 million annually. For the school bus industry, this may mean operating more
buses and larger buses.
Applying a discount rate of 8% on the social benefit of $2 million dollars summed over a period of nine years3
results in an estimated benefit of $12.1 million. From above, the cost of fitting safety belts is estimated to be
$81.3 million. Today's cost of providing additional bus services to eliminate standees over a nine-year period is
$7.3 million, giving a total cost of $88.6 million. The resulting benefit-cost ratio is 0.14.
3.1.4 Discussion
It is difficult to justify the mandatory retrofitting of safety belts on school buses given that the estimated
benefit-cost ratio is 0.14. Even targeting the highest-risk bus routes is very unlikely to produce a benefit-
cost ratio approaching one. Bus structural strength requirements, aimed at ensuring bus occupants have
sufficient survival space and are not ejected when a bus rolls over, have been introduced since the rollover
crash that killed five children in 1987. Those requirements reduce the need, and hence the benefits of
safety belts in school buses. The USA Transport Research Board recommended higher seat backs (for
reducing fatalities and especially reducing injuries) and pupil education programmes as the most cost
effective options for reducing school bus occupant fatalities.
3.2 School bus management standards
A number of studies have found that transport operators have a major influence on on-road safety. Baas
and Taramoeroa (2008) evaluated the effectiveness of the Australian industry TruckSafe heavy vehicle
accreditation scheme and the Australian government National Heavy Vehicle Accreditation (NHVA)
schemes. These schemes are voluntary and provide formal recognition of operators who have good
safety and other management systems in place. In order to become accredited operators need to
demonstrate, through independent audits, that they have effective management systems. Baas and
Taramoeroa (2008) determined the safety benefits of accreditation by comparing Police reported crash
rates over a three-year period of accredited and non-accredited vehicles in Victoria, Queensland and NSW.
Approximately half of the 48,000 articulated heavy vehicles registered in these States belonged to
operators who were accredited to TruckSafe or NHVAS. It was found that vehicles belonging to operators
accredited to TruckSafe or NHVAS were, on average, significantly safer than vehicles that were not
accredited. The calculated difference in average crash rates (crashes per vehicle) was substantial with
vehicles accredited to the schemes having between 50% and 75% fewer crashes on average than non-
accredited vehicles. The analysis also found that operators improved through the process of becoming
accredited with reductions on crash rates of approximately 50% in the two years after accreditation
compared with the two years before.
3 Maximum school bus service life of 26 years less the average bus age of 17 years (Ministry of Education 2008).
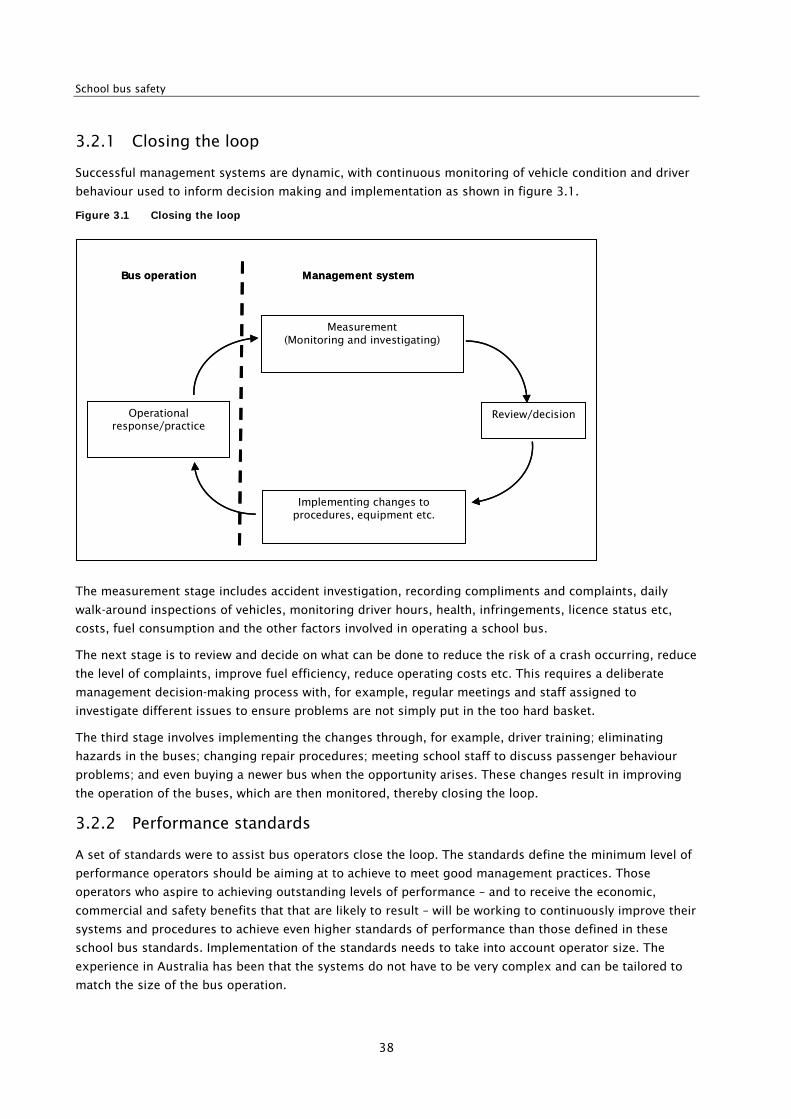
School bus safety
38
3.2.1 Closing the loop
Successful management systems are dynamic, with continuous monitoring of vehicle condition and driver
behaviour used to inform decision making and implementation as shown in figure 3.1.
Figure 3.1 Closing the loop
The measurement stage includes accident investigation, recording compliments and complaints, daily
walk-around inspections of vehicles, monitoring driver hours, health, infringements, licence status etc,
costs, fuel consumption and the other factors involved in operating a school bus.
The next stage is to review and decide on what can be done to reduce the risk of a crash occurring, reduce
the level of complaints, improve fuel efficiency, reduce operating costs etc. This requires a deliberate
management decision-making process with, for example, regular meetings and staff assigned to
investigate different issues to ensure problems are not simply put in the too hard basket.
The third stage involves implementing the changes through, for example, driver training; eliminating
hazards in the buses; changing repair procedures; meeting school staff to discuss passenger behaviour
problems; and even buying a newer bus when the opportunity arises. These changes result in improving
the operation of the buses, which are then monitored, thereby closing the loop.
3.2.2 Performance standards
A set of standards were to assist bus operators close the loop. The standards define the minimum level of
performance operators should be aiming at to achieve to meet good management practices. Those
operators who aspire to achieving outstanding levels of performance – and to receive the economic,
commercial and safety benefits that that are likely to result – will be working to continuously improve their
systems and procedures to achieve even higher standards of performance than those defined in these
school bus standards. Implementation of the standards needs to take into account operator size. The
experience in Australia has been that the systems do not have to be very complex and can be tailored to
match the size of the bus operation.
Measurement (Monitoring and investigating)
Review/decision
Implementing changes to procedures, equipment etc.
Operational response/practice
Management systemBus operation
Measurement (Monitoring and investigating)
Review/decision
Implementing changes to procedures, equipment etc.
Operational response/practice
Management systemBus operation
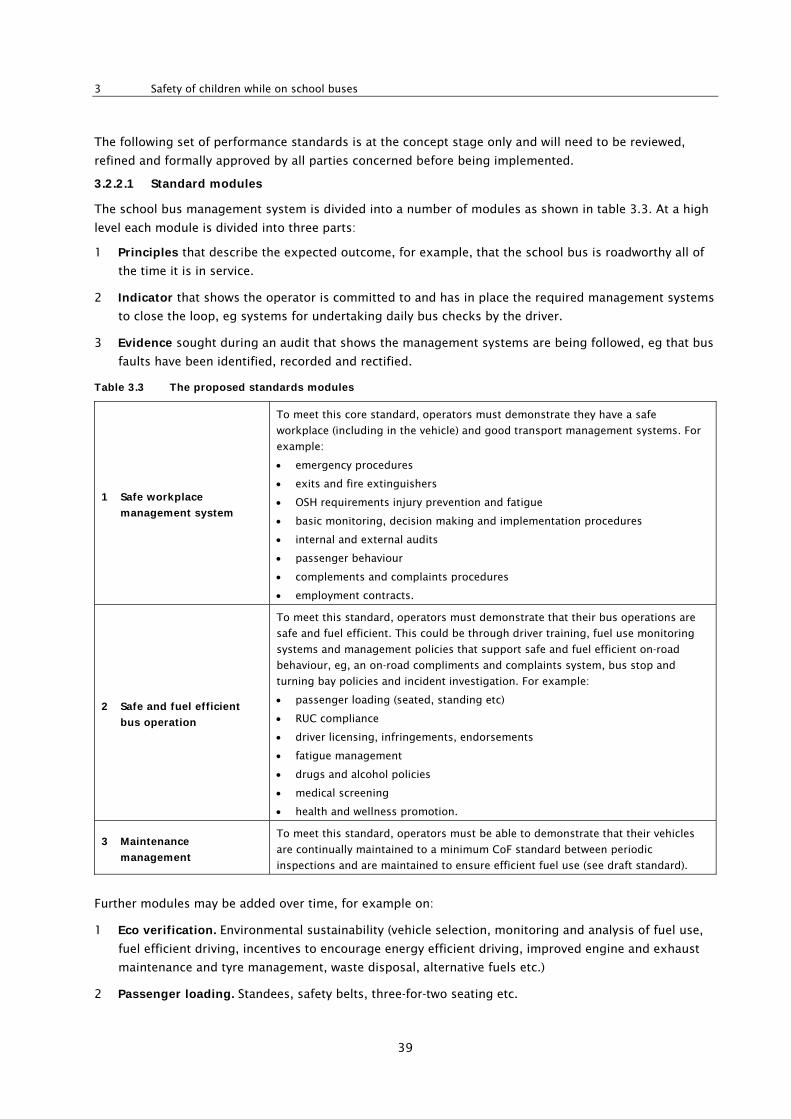
3 Safety of children while on school buses
39
The following set of performance standards is at the concept stage only and will need to be reviewed,
refined and formally approved by all parties concerned before being implemented.
3.2.2.1 Standard modules
The school bus management system is divided into a number of modules as shown in table 3.3. At a high
level each module is divided into three parts:
1 Principles that describe the expected outcome, for example, that the school bus is roadworthy all of
the time it is in service.
2 Indicator that shows the operator is committed to and has in place the required management systems
to close the loop, eg systems for undertaking daily bus checks by the driver.
3 Evidence sought during an audit that shows the management systems are being followed, eg that bus
faults have been identified, recorded and rectified.
Table 3.3 The proposed standards modules
1 Safe workplace
management system
To meet this core standard, operators must demonstrate they have a safe
workplace (including in the vehicle) and good transport management systems. For
example:
emergency procedures
exits and fire extinguishers
OSH requirements injury prevention and fatigue
basic monitoring, decision making and implementation procedures
internal and external audits
passenger behaviour
complements and complaints procedures
employment contracts.
2 Safe and fuel efficient
bus operation
To meet this standard, operators must demonstrate that their bus operations are
safe and fuel efficient. This could be through driver training, fuel use monitoring
systems and management policies that support safe and fuel efficient on-road
behaviour, eg, an on-road compliments and complaints system, bus stop and
turning bay policies and incident investigation. For example:
passenger loading (seated, standing etc)
RUC compliance
driver licensing, infringements, endorsements
fatigue management
drugs and alcohol policies
medical screening
health and wellness promotion.
3 Maintenance
management
To meet this standard, operators must be able to demonstrate that their vehicles
are continually maintained to a minimum CoF standard between periodic
inspections and are maintained to ensure efficient fuel use (see draft standard).
Further modules may be added over time, for example on:
1 Eco verification. Environmental sustainability (vehicle selection, monitoring and analysis of fuel use,
fuel efficient driving, incentives to encourage energy efficient driving, improved engine and exhaust
maintenance and tyre management, waste disposal, alternative fuels etc.)
2 Passenger loading. Standees, safety belts, three-for-two seating etc.
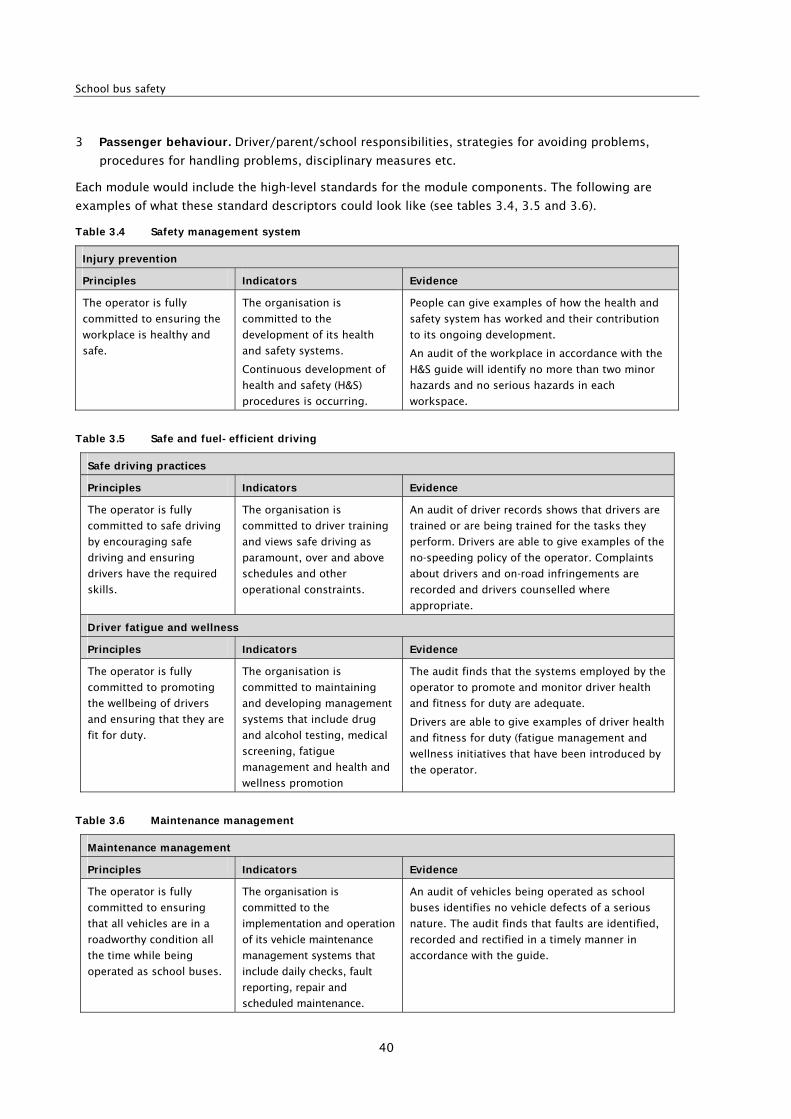
School bus safety
40
3 Passenger behaviour. Driver/parent/school responsibilities, strategies for avoiding problems,
procedures for handling problems, disciplinary measures etc.
Each module would include the high-level standards for the module components. The following are
examples of what these standard descriptors could look like (see tables 3.4, 3.5 and 3.6).
Table 3.4 Safety management system
Injury prevention
Principles Indicators Evidence
The operator is fully
committed to ensuring the
workplace is healthy and
safe.
The organisation is
committed to the
development of its health
and safety systems.
Continuous development of
health and safety (H&S)
procedures is occurring.
People can give examples of how the health and
safety system has worked and their contribution
to its ongoing development.
An audit of the workplace in accordance with the
H&S guide will identify no more than two minor
hazards and no serious hazards in each
workspace.
Table 3.5 Safe and fuel-efficient driving
Safe driving practices
Principles Indicators Evidence
The operator is fully
committed to safe driving
by encouraging safe
driving and ensuring
drivers have the required
skills.
The organisation is
committed to driver training
and views safe driving as
paramount, over and above
schedules and other
operational constraints.
An audit of driver records shows that drivers are
trained or are being trained for the tasks they
perform. Drivers are able to give examples of the
no-speeding policy of the operator. Complaints
about drivers and on-road infringements are
recorded and drivers counselled where
appropriate.
Driver fatigue and wellness
Principles Indicators Evidence
The operator is fully
committed to promoting
the wellbeing of drivers
and ensuring that they are
fit for duty.
The organisation is
committed to maintaining
and developing management
systems that include drug
and alcohol testing, medical
screening, fatigue
management and health and
wellness promotion
The audit finds that the systems employed by the
operator to promote and monitor driver health
and fitness for duty are adequate.
Drivers are able to give examples of driver health
and fitness for duty (fatigue management and
wellness initiatives that have been introduced by
the operator.
Table 3.6 Maintenance management
Maintenance management
Principles Indicators Evidence
The operator is fully
committed to ensuring
that all vehicles are in a
roadworthy condition all
the time while being
operated as school buses.
The organisation is
committed to the
implementation and operation
of its vehicle maintenance
management systems that
include daily checks, fault
reporting, repair and
scheduled maintenance.
An audit of vehicles being operated as school
buses identifies no vehicle defects of a serious
nature. The audit finds that faults are identified,
recorded and rectified in a timely manner in
accordance with the guide.
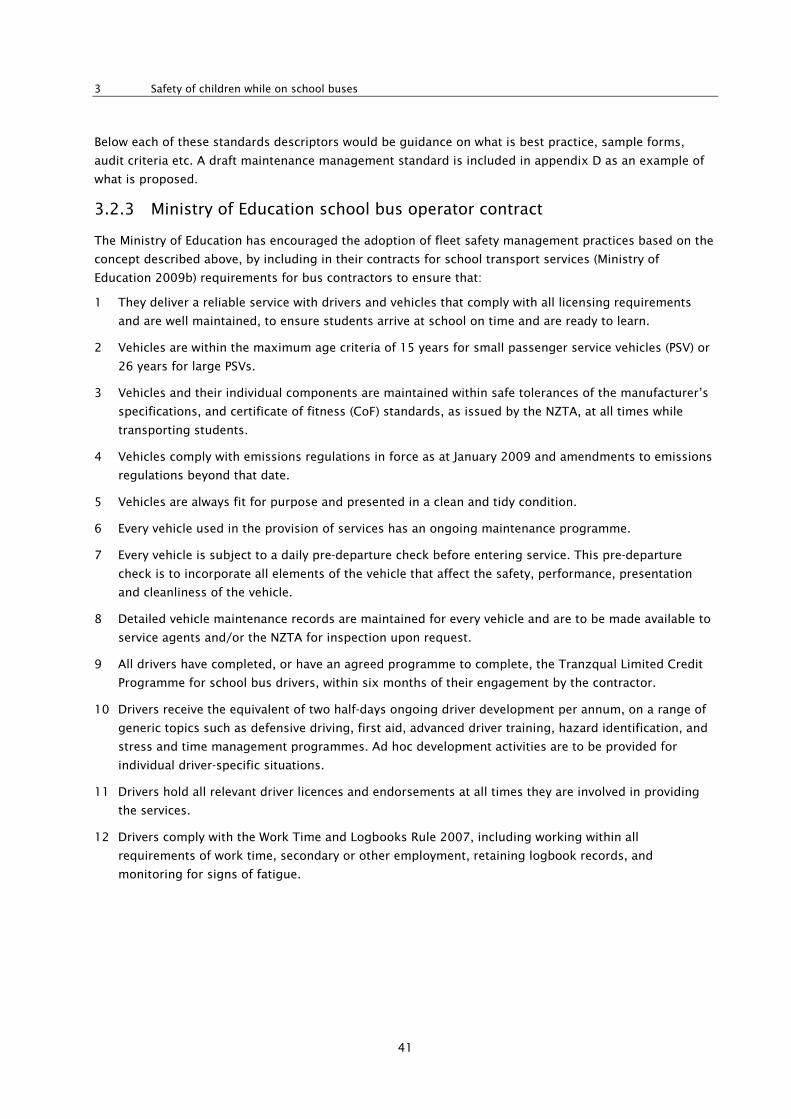
3 Safety of children while on school buses
41
Below each of these standards descriptors would be guidance on what is best practice, sample forms,
audit criteria etc. A draft maintenance management standard is included in appendix D as an example of
what is proposed.
3.2.3 Ministry of Education school bus operator contract
The Ministry of Education has encouraged the adoption of fleet safety management practices based on the
concept described above, by including in their contracts for school transport services (Ministry of
Education 2009b) requirements for bus contractors to ensure that:
1 They deliver a reliable service with drivers and vehicles that comply with all licensing requirements
and are well maintained, to ensure students arrive at school on time and are ready to learn.
2 Vehicles are within the maximum age criteria of 15 years for small passenger service vehicles (PSV) or
26 years for large PSVs.
3 Vehicles and their individual components are maintained within safe tolerances of the manufacturer’s
specifications, and certificate of fitness (CoF) standards, as issued by the NZTA, at all times while
transporting students.
4 Vehicles comply with emissions regulations in force as at January 2009 and amendments to emissions
regulations beyond that date.
5 Vehicles are always fit for purpose and presented in a clean and tidy condition.
6 Every vehicle used in the provision of services has an ongoing maintenance programme.
7 Every vehicle is subject to a daily pre-departure check before entering service. This pre-departure
check is to incorporate all elements of the vehicle that affect the safety, performance, presentation
and cleanliness of the vehicle.
8 Detailed vehicle maintenance records are maintained for every vehicle and are to be made available to
service agents and/or the NZTA for inspection upon request.
9 All drivers have completed, or have an agreed programme to complete, the Tranzqual Limited Credit
Programme for school bus drivers, within six months of their engagement by the contractor.
10 Drivers receive the equivalent of two half-days ongoing driver development per annum, on a range of
generic topics such as defensive driving, first aid, advanced driver training, hazard identification, and
stress and time management programmes. Ad hoc development activities are to be provided for
individual driver-specific situations.
11 Drivers hold all relevant driver licences and endorsements at all times they are involved in providing
the services.
12 Drivers comply with the Work Time and Logbooks Rule 2007, including working within all
requirements of work time, secondary or other employment, retaining logbook records, and
monitoring for signs of fatigue.
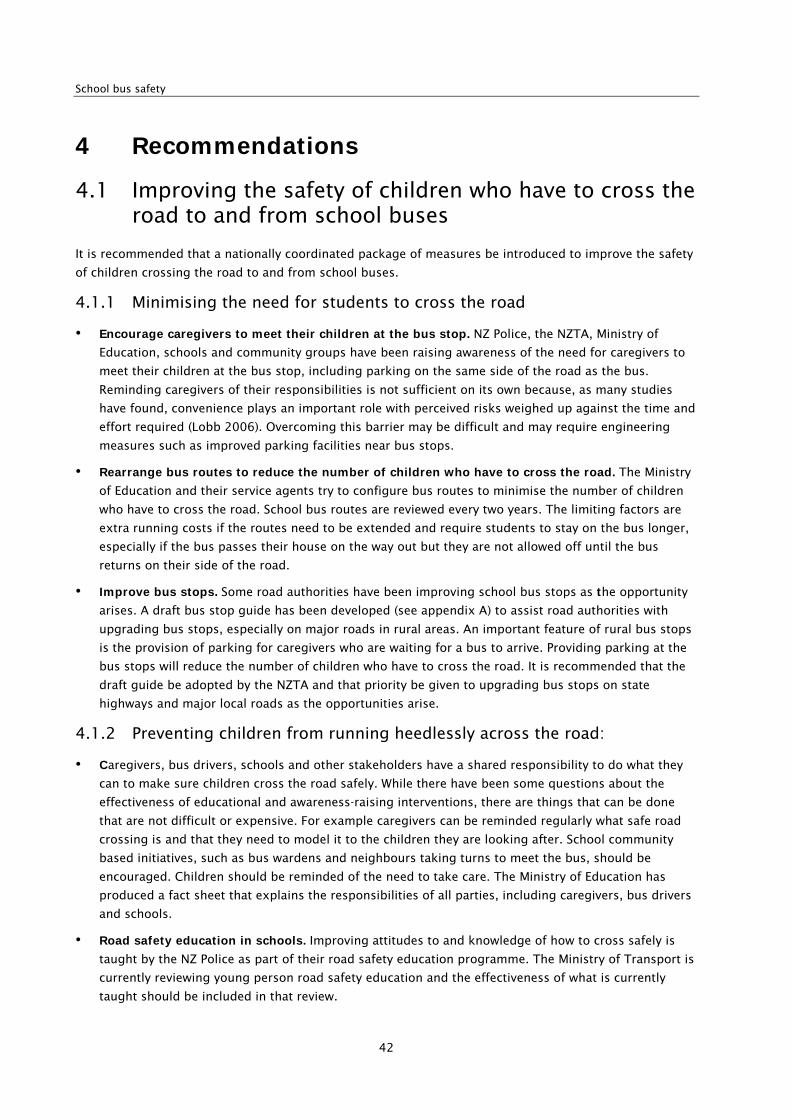
School bus safety
42
4 Recommendations
4.1 Improving the safety of children who have to cross the road to and from school buses
It is recommended that a nationally coordinated package of measures be introduced to improve the safety
of children crossing the road to and from school buses.
4.1.1 Minimising the need for students to cross the road
• Encourage caregivers to meet their children at the bus stop. NZ Police, the NZTA, Ministry of
Education, schools and community groups have been raising awareness of the need for caregivers to
meet their children at the bus stop, including parking on the same side of the road as the bus.
Reminding caregivers of their responsibilities is not sufficient on its own because, as many studies
have found, convenience plays an important role with perceived risks weighed up against the time and
effort required (Lobb 2006). Overcoming this barrier may be difficult and may require engineering
measures such as improved parking facilities near bus stops.
• Rearrange bus routes to reduce the number of children who have to cross the road. The Ministry
of Education and their service agents try to configure bus routes to minimise the number of children
who have to cross the road. School bus routes are reviewed every two years. The limiting factors are
extra running costs if the routes need to be extended and require students to stay on the bus longer,
especially if the bus passes their house on the way out but they are not allowed off until the bus
returns on their side of the road.
• Improve bus stops. Some road authorities have been improving school bus stops as the opportunity
arises. A draft bus stop guide has been developed (see appendix A) to assist road authorities with
upgrading bus stops, especially on major roads in rural areas. An important feature of rural bus stops
is the provision of parking for caregivers who are waiting for a bus to arrive. Providing parking at the
bus stops will reduce the number of children who have to cross the road. It is recommended that the
draft guide be adopted by the NZTA and that priority be given to upgrading bus stops on state
highways and major local roads as the opportunities arise.
4.1.2 Preventing children from running heedlessly across the road:
• Caregivers, bus drivers, schools and other stakeholders have a shared responsibility to do what they
can to make sure children cross the road safely. While there have been some questions about the
effectiveness of educational and awareness-raising interventions, there are things that can be done
that are not difficult or expensive. For example caregivers can be reminded regularly what safe road
crossing is and that they need to model it to the children they are looking after. School community
based initiatives, such as bus wardens and neighbours taking turns to meet the bus, should be
encouraged. Children should be reminded of the need to take care. The Ministry of Education has
produced a fact sheet that explains the responsibilities of all parties, including caregivers, bus drivers
and schools.
• Road safety education in schools. Improving attitudes to and knowledge of how to cross safely is
taught by the NZ Police as part of their road safety education programme. The Ministry of Transport is
currently reviewing young person road safety education and the effectiveness of what is currently
taught should be included in that review.
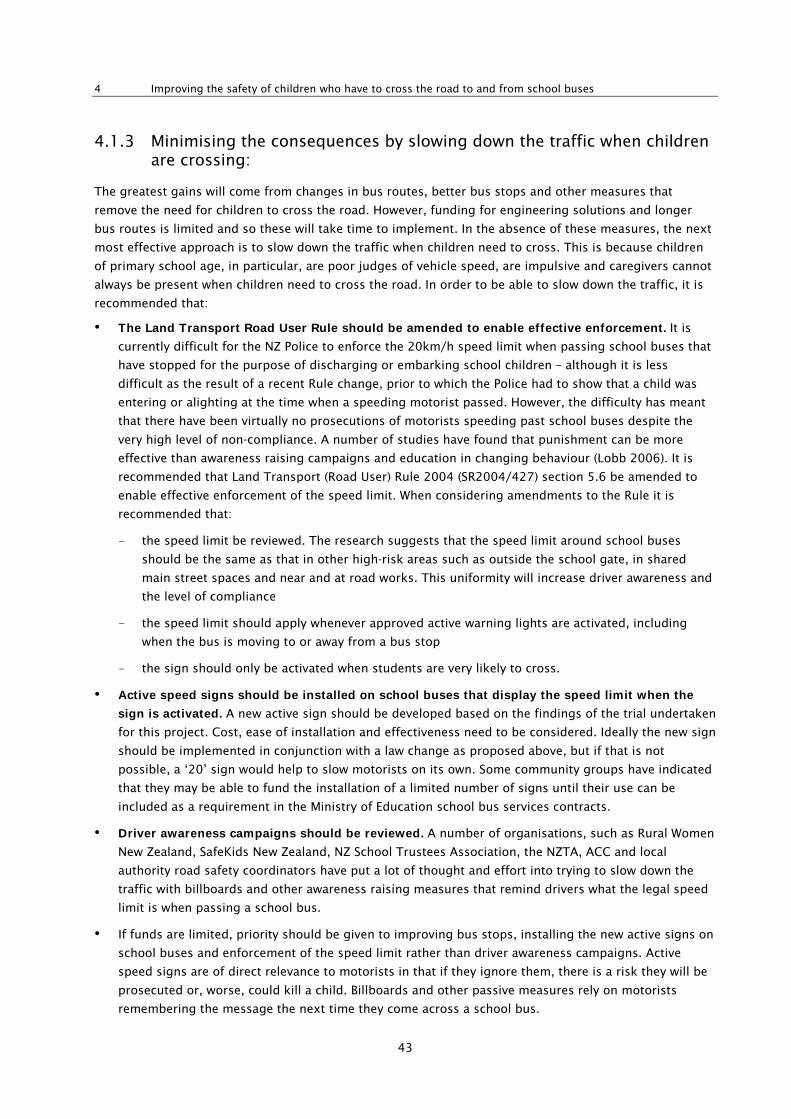
4 Improving the safety of children who have to cross the road to and from school buses
43
4.1.3 Minimising the consequences by slowing down the traffic when children are crossing:
The greatest gains will come from changes in bus routes, better bus stops and other measures that
remove the need for children to cross the road. However, funding for engineering solutions and longer
bus routes is limited and so these will take time to implement. In the absence of these measures, the next
most effective approach is to slow down the traffic when children need to cross. This is because children
of primary school age, in particular, are poor judges of vehicle speed, are impulsive and caregivers cannot
always be present when children need to cross the road. In order to be able to slow down the traffic, it is
recommended that:
• The Land Transport Road User Rule should be amended to enable effective enforcement. It is
currently difficult for the NZ Police to enforce the 20km/h speed limit when passing school buses that
have stopped for the purpose of discharging or embarking school children – although it is less
difficult as the result of a recent Rule change, prior to which the Police had to show that a child was
entering or alighting at the time when a speeding motorist passed. However, the difficulty has meant
that there have been virtually no prosecutions of motorists speeding past school buses despite the
very high level of non-compliance. A number of studies have found that punishment can be more
effective than awareness raising campaigns and education in changing behaviour (Lobb 2006). It is
recommended that Land Transport (Road User) Rule 2004 (SR2004/427) section 5.6 be amended to
enable effective enforcement of the speed limit. When considering amendments to the Rule it is
recommended that:
– the speed limit be reviewed. The research suggests that the speed limit around school buses
should be the same as that in other high-risk areas such as outside the school gate, in shared
main street spaces and near and at road works. This uniformity will increase driver awareness and
the level of compliance
– the speed limit should apply whenever approved active warning lights are activated, including
when the bus is moving to or away from a bus stop
– the sign should only be activated when students are very likely to cross.
• Active speed signs should be installed on school buses that display the speed limit when the
sign is activated. A new active sign should be developed based on the findings of the trial undertaken
for this project. Cost, ease of installation and effectiveness need to be considered. Ideally the new sign
should be implemented in conjunction with a law change as proposed above, but if that is not
possible, a ‘20’ sign would help to slow motorists on its own. Some community groups have indicated
that they may be able to fund the installation of a limited number of signs until their use can be
included as a requirement in the Ministry of Education school bus services contracts.
• Driver awareness campaigns should be reviewed. A number of organisations, such as Rural Women
New Zealand, SafeKids New Zealand, NZ School Trustees Association, the NZTA, ACC and local
authority road safety coordinators have put a lot of thought and effort into trying to slow down the
traffic with billboards and other awareness raising measures that remind drivers what the legal speed
limit is when passing a school bus.
• If funds are limited, priority should be given to improving bus stops, installing the new active signs on
school buses and enforcement of the speed limit rather than driver awareness campaigns. Active
speed signs are of direct relevance to motorists in that if they ignore them, there is a risk they will be
prosecuted or, worse, could kill a child. Billboards and other passive measures rely on motorists
remembering the message the next time they come across a school bus.
School bus safety
44
4.2 Reducing the risk of injury while travelling on school buses
The following options were investigated to improve the safety of school bus passengers.
• School bus management standards. Since this research project started, the Ministry of Education has
written into their school bus contracts more stringent requirements for the construction and
maintenance of school buses. This appears to have been effective as a recent NZ Police sting
operation in the Coromandel Peninsula found that none of the 39 school buses inspected had vehicle
safety faults (BCANZ 2010). It is recommended that the Ministry of Education and NZTA continue to
encourage bus fleet operators to adopt best practice.
Occupant protection. The bus structural strength requirements appear to have been effective in
reducing the risk to injury during bus crashes. Further improvements in occupant protection would
result from having higher seat backs. However, retrofitting older buses with these seats is probably
not justified because of the cost.
Safety belts. While the mandatory use of safety belts would improve safety, reducing the number of
children killed while crossing the road from school buses will produce greater benefits at lower cost,
and hence should be given priority. The estimated safety benefits from retrofitting safety belts on
school buses are estimated to be approximately 14% of the cost of fitting them.
5 References
45
5 References
Archer, J, N Fotheringham, M Symmons and B Corben (2008) The impact of lowered speed limits in urban
and metropolitan areas. Monash University Accident Research Centre, Victoria, Australia. Accessed
27/08/2009. www.monash.edu.au/muarc/reports/muarc276.pdf
ARUP (2006) Rural school bus stop and school interchanges – safety guidelines and typical treatments.
Australia: Ministry of Transport in Victoria. Unpublished.
Australasian College of Road Safety (2004) ACRS policy position. Canberra: Australasian College of Road
Safety. Accessed 27 August 2009. www.acrs.org.au/collegepolicies/people/alcohol.html
Austroads (2001) School bus safety in Australia: technical report – AP-R 186A. Sydney: Austroads.
Baas, PH (2008) Evaluation of school bus signs. TERNZ report, Auckland. 15pp.
Baas, P and N Taramoeroa (2008) Analysis of the safety benefits of heavy vehicle accreditation schemes.
AP–R319/08. Sydney: Austroads.
Bus and Coach Association (BCANZ) (2005) [Key Facts] About Buses 2004. Wellington. Accessed
9 March 2006. www.busandcoach.co.nz
Bus and Coach Association (BCANZ) (2010) Positive results in school bus sting. Bus and Coach Association
circular, June 2010.
Centre of Transportation Studies and Research (1989) School bus accident investigations. New Jersey: New
Jersey Institute of Technology. Accessed 15 May 1999. www.stnonline.com/126.htm
Collins, S (2009) Doctors push for child safety. NZ Herald, Auckland, 5 January 2009.
Congiu, M, M Whelan, J Oxley, J Charlton, A D'Elia and C Muir C (2008) Child pedestrians: factors
assocaited with ability to cross roads safely and development of a training package. Monash University
Accident Research Centre, report no.283.
Connelly ML, HM Conaglen, BS Parsonson and RB Isler (1998) Child pedestrians’ crossing gap thresholds
Accident Analysis & Prevention 30, no.4: 443–453.
Department for Transport (2009). A safer way: consultation on making Britain's roads the safest in the
world. London: Department for Transport. 118pp.
Farr, GN (1984) School bus safety study, vol 1. Ontario: Traffic Safety Standards and Research.
Granville, S, A Laird, M Barber and F Rait (2002) Why do parents drive their children to school? Scottish
Edinburgh: Executive Central Research Unit. 116pp.
Hamilton-Baillie, B (2008) Towards shared space. Urban Design International (13): 130–138.
Hatfield, NJ and KN Womack (1986) Safety belts on school buses: the Texas experience. Texas: Texas
Transportation Institute.
Henderson, M (1996) Standing in school buses: the strategic and practical Issues. Prepared for the Bus
Safety Advisory Committee, New South Wales Department of Transport, Australia.
Henderson, M and Paine, M (1994) School bus seat belts: their fitment, effectiveness and cost. Prepared for
the Bus Safety Advisory Committee, New South Wales Department of Transport, Australia.
Johnson, G (1993) Making school bus travel even safer. Truck and Bus Transportation 57, no.1: 90–92.
School bus safety
46
Land Transport NZ (2007) Safety and the school bus. Wellington, New Zealand. Accessed 27/08/2009.
www.ltsa.govt.nz/road-user-safety/school-buses/docs/safety-and-the-school-bus.pdf
Land Transport Safety Authority (LTSA) (2002) School bus-related safety – a literature review. Wellington:
Land Transport Safety Authority. 32pp.
Land Transport Safety Authority (LTSA) (2004) Guidelines for the safe siting of school bus stops.
Wellington: Land Transport Safety Authority. 6pp.
Larcombe Consulting Ltd (2008) School transport – a review of the 2007 Special Education School
Transport Assistance Tender Round. Wellington.
Lobb, B, N Harré and N Terry (2003) An evaluation of four types of railway pedestrian crossing safety
intervention. Accident Analysis and Prevention 35: 487–494.
Lobb, B (2006) Trespassing on the tracks: A review of railway pedestrian safety research. Journal of Road
Safety Research 37: 359–365.
Matenga (2008) Reserve findings of Coroner Matenga from inquest into the death of Nathaniel Sicely
(Appendix to file ref: CSU-2008-WHG-000020). Accessed 27 August 2009. www.justice.govt.nz/
coroners/recommendations-register/2008/april/Recommendation.Scott-Collins.G.27.Apr.2008.pdf
Ministry of Education (2008) Request for proposals for school bus services (for contracts commencing
January 2009). Accessed 18 June 2009. www.minedu.govt.nz/educationSectors/
Schools/SchoolOperations/SchoolTransport/SchoolTransportHomePage/SchoolBusTransport2008School
BusContractingAndTendering.aspx
Ministry of Education (2009a) Excel files containing school bus route details by geographic region.
Accessed 18 June 2009. www.minedu.govt.nz/educationSectors/Schools/SchoolOperations/
SchoolTransport/SchoolTransportHomePage/SchoolBusRoutes.aspx
Ministry of Education (2009b) 2009 school bus tender process – frequently asked questions. Accessed
01 August 2009: www.minedu.govt.nz/~/media/MinEdu/Files/EducationSectors/PrimarySecondary/
SchoolOpsTransport/SuccessfulTenders2008/FrequentlyAskedQuestionsSep08.doc
Ministry of Education (2009c) Annual report for the year ending 30 June 2009. pp96, 106, 111.
Ministry of Transport (2008) The social cost of road crashes and injuries, June 2008 update. Prepared by
Transport Monitoring, Strategy and Sustainability, Ministry of Transport, Wellington. 26pp.
Ministry of Transport (2009) Comparing travel modes. NZ Household Travel Survey v2, revised Nov 2009.
Morrongiello, BA and BK Barton (2009) Child pedestrian safety: Parental supervision, modeling behaviours
and beliefs about child pedestrian safety. Accident Analysis and Prevention 41, no.5: 1040–1046.
National Highway Traffic Safety Administration (NHTSA) (not reported) TIP #10: School bus stops.
Washington DC: NHTSA. Accessed 27 August 2009.
www.nhtsa.dot.gov/cps/newtips/images/PDFs/CPSafetuTip10.pdf
National Highway Traffic Safety Administration (NHTSA) (2000) Best practice guide: reducing the illegal
passing of school buses. Washington DC: NHTSA. 88pp.
National Highway Safety Administration (NHTSA) (2002) School bus safety. Factsheet. Washington DC:
NHTSA. Accessed 2002. www.nhtsa.gov
National Highway Traffic Safety Administration (NHTSA) (2006) Traffic safety facts. Washington DC:
NHTSA. Accessed 27 August 2009. www-nrd.nhtsa.dot.gov/Pubs/810809.PDF
5 References
47
National Highway Traffic Safety Administration (NHTSA) (2007) NHTSA's approach to motorcoach safety
(memorandum). Washington DC: NHTSA. 21pp. Accessed 06 July 2009.
www.nhtsa.dot.gov/staticfiles/DOT/NHTSA/Vehicle%20Safety/Articles/Associated%20Files/481217.pdf
National Transportation Safety Board (1987) Safety study – crashworthiness of large poststandard school
buses. Washington: Bureau of Safety Programs.
Organisation for Economic Co-operation and Development (OECD) (2004) Keeping children safe in traffic.
Paris: OECD. 130pp.
Paine, MP and AJ Fisher (1996) Flashing warning lights on school buses. Fifteenth International Technical
Conference of the Enhanced Safety of Vehicles. Melbourne, Australia.
Personal Communication 2004 Letter from McConnell Seats Pty Ltd. McConnell Seats Pty Ltd, North
Coburg, Victoria, Australia. April 2004.
Read, JH, EJ Bradley, JD Morrison, D Lewall and DA Clarke (1963) The epidemiology and prevention of
traffic accident involving child pedestrians. Can Med Assoc Journal 89: 687–701.
Robinson, J (2008) Speeds past school buses (presentation). Road Safety Coordinator, Central Otago and
Queenstown Lakes District Councils.
School Bus Fleet (1999) Passenger crash protection in school buses, an update. Washington DC: NHTSA.
Accessed 28 May 1999. www.schoolbusfleet.com/ Resource/jan99.htm
Schofield, GM, S Gianotti, HM Badland and EA Hinckson (2008) The incidence of injuries travelling to and
from school by travel mode. Preventive Medicine 46: 74–76.
Shortland, HB (2009) Reserve findings of Coroner H.B. Shortland from inquest into the death of Grant
Scott-Collins, File Ref: CSU-2008-WHG-000020. Accessed 27 August 2009.
www.justice.govt.nz/coroners/recommendations-register/2008/april/Recommendation.Scott-
Collins.G.27.Apr.2008.pdf
Stevenson, MR, BA Laing and SK Lo (1993) Factors contributing to severity of childhood pedestrian injuries
in Perth, Western Australia. Asia Pac J Public Health 6: 25–31.
Swadling, D and S Newman (2001) Feasibility study of seat belts on contract school buses operating in non
public transport. Road Safety Research, Policing and Education Conference, Monash University, Clayton,
Victoria. 19–20 November 2001. 6pp.
Transport Canada (1999) School bus collision summary, Canada 1989 to 1997. Ottawa: Transport Canada.
Accessed 27 August 2007. www.tc.gc.ca/roadsafety/tp/tp13412/menu.htm
Transportation Research Board (1989) Special report 222: Improving school bus safety. Washington DC:
National Research Council.
Transportation Research Board (1998) Special report 254: Managing speed: review of current practice for
setting and enforcing speed limits. Washington DC, Transportation Research Board.
Vicroads (not reported) Guidelines, bus safety, daily inspections: requirements for buses of accredited
operators. Melbourne: Vicroads.
Wazana, A, P Krueger, P Raina and L Chambers (1997) A review of risk factors for child pedestrian injuries:
are they modifiable? Injury Prevention 3: 295–304.
School bus safety
48
Appendix A: Draft school bus stop and turning point safety guide
Acknowledgements
TERNZ and the authors acknowledge that this document is based on material from a report prepared in
2006 by ARUP Consultants, Melbourne, for the Ministry of Transport (then the Department of
Infrastructure), Victoria, Australia.
The role of the members of BUSSTAC in commenting on this draft is also gratefully acknowledged.
Definitions
School bus stop: A place on or near the roadside or carriageway, or in school grounds or another nearby
place, where school buses stop to pick up or set down school pupils.
Road side school bus stop: A school bus stop located on or near the roadside or carriageway in an urban
or rural area.
School located bus stop: A school bus stop, located within school grounds or near a school, used
primarily to pick up or set down school pupils, including a school bus interchange where pupils may
change from one bus to another.
Appendix A: Draft school bus stop and turning point safety guide
49
Contents
A1 Introduction...................................................................................................................................................50
A1.1 Background........................................................................................................... 50
A1.1.1 Crash data.............................................................................................. 50
A1.1.2 Resource material .................................................................................. 50
A1.2 Guide outline......................................................................................................... 51
A2 Review of traffic engineering and general road safety principles .......................................51
A2.1 General road safety principles ............................................................................... 51
A2.2 General guidance for the provision of school bus stops ........................................ 52
A3 Guidelines for good practice..................................................................................................................53
A3.1 Highway environment............................................................................................ 54
A3.1.1 Speed zone ............................................................................................ 54
A3.1.2 Sight and stopping distances ................................................................. 54
A3.1.3 Proximity to side roads .......................................................................... 55
A3.1.4 Traffic volume and composition ............................................................. 56
A3.1.5 Crash data.............................................................................................. 56
A3.1.6 Lane and shoulder widths ...................................................................... 56
A3.1.7 Type and condition of road surface ........................................................ 57
A3.1.8 Car parking facilities and modal separation ........................................... 57
A3.2 Passenger waiting environment............................................................................. 58
A3.3 Operating conditions............................................................................................. 58
A4 Hierarchy of potential treatments.......................................................................................................59
A4.1 Roadside school bus stops .................................................................................... 59
A4.1.1 Traffic safety considerations for roadside school bus stops ................... 59
A4.1.2 School bus passenger considerations at roadside school bus stops ....... 61
A4.2 School-located bus stops....................................................................................... 62
A4.2.1 Traffic safety considerations for school-located bus stops ..................... 62
A5 Typical treatments......................................................................................................................................63
A5.1 Typical midblock treatment................................................................................... 64
A5.2 Typical midblock treatment with constraints ......................................................... 66
A5.3 Typical intersection treatment............................................................................... 68
A5.4 Typical treatment for school-located bus stops ..................................................... 70
A5.4.1 Island layout .......................................................................................... 70
A5.4.2 Perimeter layout ..................................................................................... 72
A5.4.3 Concourse layout ................................................................................... 74
A6 Costs .................................................................................................................................................................76
A6.1 Costs for roadside school bus stop treatments ..................................................... 76
A6.2 Costs for school-located school bus stop treatments ............................................ 76
A7 Case studies ..................................................................................................................................................77
A8 Bibliography ..................................................................................................................................................77
School bus safety
50
A1 Introduction
This draft guide has been prepared as part of the school bus safety project funded by the NZ Transport
Agency (NZTA). Its purpose is to improve safety at the point where students are picked up and dropped
off.
In November 2004, the Land Transport Safety Authority (LTSA) (now the NZTA) published Guidelines for
the safe siting of school bus stops (LTSA 2004). This brief document covers the main principles that should
be considered when locating school bus stops. It provides basic technical advice including check lists for
considering single school bus stops and school bus routes.
The aim of this school bus stop and turning point safety guide is to provide more comprehensive
information about the principles, technical and safety considerations involved in the location and design
of school bus stops and turning points, on rural and urban roads and at schools. This draft, when
approved, will form the basis of a code of practice or guideline for use by local government and other road
providers, road safety coordinators, school authorities, education agencies, school bus operators, parents
and communities.
The guide is intended to cover school bus stops at or near schools and on roads in both urban and rural
areas. However, in urban areas, school buses generally use bus stops already provided for route and other
bus or coach services. The guide will apply to school bus stops where signage and facilities for other bus
services are not required – these are generally on rural roads and at or near schools.
The guide aims to encourage the use of good traffic engineering and risk management practice.
A1.1 Background
A1.1.1 Crash data
In the 21 years from 1987 to 2007 inclusive, 22 children were killed, 45 were seriously injured and 91
received minor injuries when crossing the road to or from a school bus. This equates to, on average, one
fatal, 2.1 serious and 4.3 minor injuries that are reported to the Police each year.
Of the reported crashes:
85% occurred in the afternoon on the way home from school
86% of the fatal incidents but only 39% of all incidents (fatal and injury) occurred in speed zones
greater than 50km/h
a similar number of children appeared from the front or rear of the bus
there were no reported crashes on unsealed roads. As the number of children who travel by bus on
unsealed roads is not known, it is not possible to say whether travelling on sealed roads is any more
dangerous than unsealed roads and vice versa.
A1.1.2 Resource material
With the exception of the NZTA guideline (LTSA 2004), a search of the internet revealed very little
published information about the design and safe operation of school bus stops and turning points which
could be relevant to the type of school bus services that operate in New Zealand. However, an unpublished
report prepared in 2006 by ARUP consultants for the Ministry of Transport in Victoria, Australia,
(previously the Department of Infrastructure (DOI)), was identified and sourced. This report is entitled
Appendix A: Draft school bus stop and turning point safety guide
51
‘Rural school bus stop and school interchanges – safety guidelines and typical treatments’ (ARUP 2006). It
covers rural roadside school bus stops and school located interchanges in Victoria. The report provides
guidance on principles, guidelines for good practice, hierarchy of potential treatments, typical treatments
and costs together with case studies.
Due to the comprehensiveness and completeness of the Victorian report, its use of technical traffic
engineering standards which are also used in New Zealand (Guide to traffic engineering practice
(Austroads 2005)), and the presentation of solutions which could also apply under New Zealand
conditions, a decision was made to use the relevant content, together with the existing NZTA guidelines
(LTSA 2004), as the basis for the recommendations of this draft guide.
A1.2 Guide outline
This draft guide commences with a brief summary of road safety practice and some general guidance on
bus stop design. These are applied to the development of good practice and a hierarchy of potential
treatments for both roadside and school-located school bus stops, considering traffic safety and
passenger requirements. Typical treatments for school bus stops at midblock, intersection and school
locations are illustrated, with a summary of case studies and indicative information on unit costs for the
treatment options. Checklists to assist review and audit of roadside and school-located school bus stops
are provided.
A2 Review of traffic engineering and general road safety principles
The Victorian report (ARUP 2006) provides a convenient summary of the relevant road safety principles.
These are summarised below and are then applied as guiding principles for the provision of safe school
bus stops.
A2.1 General road safety principles
National guidelines for road safety audits and traffic engineering good practice identify that a safe road
environment should:
• warn the driver of any substandard or unusual features
• inform the driver of conditions ahead
• guide the driver
• control the driver’s passage through conflict points or sections
• be designed to be forgiving of driver errors, errant or inappropriate behaviour.
The guidelines indicate the need for consistency when treating similar situations and state that the
following should be avoided:
• inadequate treatment – not treating a situation to an appropriate level
• inappropriate treatment – using the wrong treatment for the situation
School bus safety
52
• excessive treatment – using more treatment for more safety thereby masking other similar situations,
which have already been treated to the appropriate level.
A safe road environment provides:
no surprises in road design or traffic control (design matches expectations)
a controlled release of relevant information (not too much at once)
repeated information where pertinent to emphasise danger.
Too much information can be counter-productive and result in drivers or riders overlooking or discarding
essential information.
To assist with identifying safety issues, the road safety audit processes use a series of checklists. This
approach was used in this study and is recommended to help identify safety issues. Annex E and Annex F
are provided to prompt a reviewer responsible for identifying safety issues associated with roadside
school bus stops and school-located bus stops respectively. However, final recommendations on the
appropriate level of treatment should also be based on the experience and knowledge of the reviewer. The
checklists are for assistance only.
General information on bus stop and interchange design is summarised in annex A.
Road side and school-located school bus stop issues which should be considered include:
• clear areas that provide enough space for passengers to boarding and alight
• well drained hard areas where passenger can wait
• bus passenger shelters
• bus stop kerbing to provide a clear divide between where passengers wait and the bus stops
• well defined bus stop areas
• kerbside bus stops in urban areas
• the use of the adjacent road space
• bus stop bays to allow the bus to pull off the road
• disability access.
A2.2 General guidance for the provision of school bus stops
When considering the provision of roadside bus stops and turning points, or when making improvements,
the following factors are important:
• traffic volumes
• student numbers
• the availability of alternative sites within a reasonable distance of students’ homes
• the need for appropriate signage when the local topography is constrained
• the minimum spacing of bus stops to maintain efficiency and to reduce conflict with other road users
• the need to consider, where appropriate, allocating space for parents’ car parking and secure student
cycle storage
Appendix A: Draft school bus stop and turning point safety guide
53
• route selection to minimise, where possible, the use of higher-risk manoeuvres and locations, such as
u-turns, turns at locations with restricted vision, and narrow roads.
At school-located bus stops the main principles to consider, in addition to those above, are:
• separation of vehicles, pedestrians and cyclists
• elimination of reversing
• safety fencing
• safe loading
• shelters
• supervision.
Draft guidelines used by VicRoads include:
• sight distances for vehicles travelling at different speeds, based on desirable safe intersection sight
distances, for example, 255m at 100km/h
• a clearance width of 3m is recommended between a parked bus and the centre of the road
• a vehicle is permitted to stop in the entrance to a driveway to drop off or pick up passengers
• a vehicle, including a bus, is not generally permitted to stop within an intersection
• where written approval is given by the road authority, the bus may stop within the intersection
provided traffic volume on the side road is less than 500 vehicles per day and sight distance from the
side road to a stopped bus is at least 120m
• required clearances at bus stops and sight distances should be maintained at all times by preparing
standing areas for buses with a maximum side slope of 6% away from the road, and by removing or
trimming trees (including regular maintenance)
• student waiting areas, parent parking areas and bus shelter locations should be provided where
needed, but their location should take into account the above requirements
• school bus stop warning signs as set out in the Manual of traffic signs and marking (NZTA 2010) may
be used if sight distances and parking requirements cannot be met. Examples of these signs are
shown in annex 1.
A3 Guidelines for good practice
Good practice for the safety management of roadside school bus stops and school-located bus stops
requires thorough consideration of the proposed/ existing location and the appropriate level of facilities
to be provided. In general roadside school bus stops and school-located interchanges should be located
and designed to:
• minimise the need for children to have to cross the road unassisted, especially primary aged children
• provide for the safety of school children and other road users
• minimise the interaction between different road users, where possible
• limit the interference to traffic flow on the road network.
School bus safety
54
Safety issues should be considered in terms of:
• road environment
• passenger waiting environment
• operating conditions.
The following addresses these issues in turn.
A3.1 Highway environment
Bus stops at or near schools should be accommodated within the school grounds if possible. This
significantly reduces potential conflict between buses, students and other road users competing for space.
School-located bus stops vary considerably in terms of the number of students and buses they need to
accommodate. This will have a direct impact on the space required to accommodate vehicle movements
and waiting areas.
If the bus stop must be located outside the school grounds then most of the highway environment aspects
described below will need to be considered. The highway environment in which the school bus route
operates will influence the most suitable bus stop treatment to use. Consideration should also be made
when conducting site visits as to whether there is a more suitable site for locating the stop, if necessary by
changing the school bus route.
A3.1.1 Speed zone
School bus stop and interchange treatments should not create excessive speed disparities between
vehicles as speed disparities increase the possibility of crashes. Roadside school bus stops in higher-speed
environments (over 80km/h) should be located off the carriageway or with sufficient provision for other
vehicles to overtake safely. The number of stops provided along a route in high traffic volume, high-speed
environments should be limited as much as possible.
Generally schools are located within much a lower-speed environment than highway-located school bus
stops, and often reduced speed limits apply at school times. This lowers the potential for excessive speed
disparities to occur at school-located bus stops.
A3.1.2 Sight and stopping distances
School bus stops should be located so all activities are conspicuous and visible to all road users in all
weather conditions. Straight alignments at uniform grades would typically be suitable locations. Stops and
interchanges should not be located in unexpected situations or where the topography of the area limits
visibility. For instance locations near sharp bends, steep gradients, just over the crest of a hill or
obstructed by vegetation or roadside objects should be avoided.
On the approach to the bus stop the appropriate sight distance in relation to the designated speed limits
should be provided. This enables vehicle drivers to observe the school bus stop activities in sufficient time
to react and stop if necessary. Tables A1 and A2 summarise the appropriate stopping sight distances.
Where a school bus stops within the carriageway the approach sight distances detailed in table A1 should
be adopted. Where buses pull off the carriageway to stop, the safe intersection site distances detailed in
table A2 should be adopted.
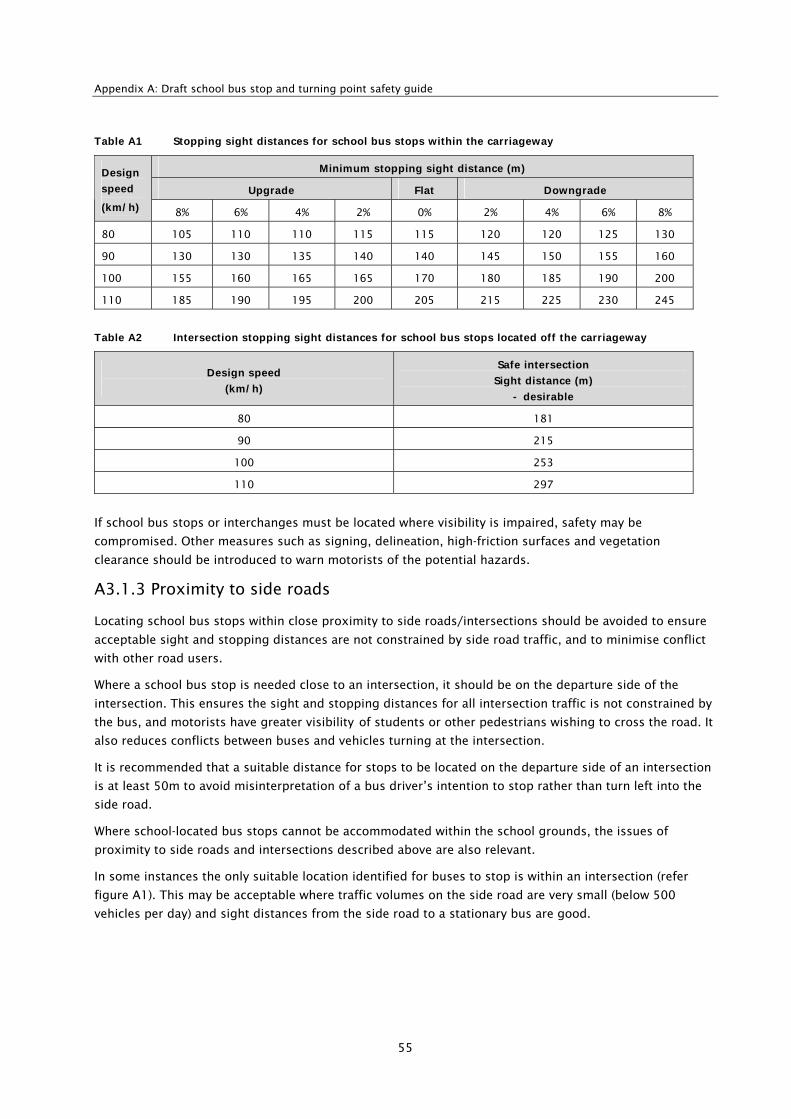
Appendix A: Draft school bus stop and turning point safety guide
55
Table A1 Stopping sight distances for school bus stops within the carriageway
Minimum stopping sight distance (m)
Upgrade Flat Downgrade
Design
speed
(km/h) 8% 6% 4% 2% 0% 2% 4% 6% 8%
80 105 110 110 115 115 120 120 125 130
90 130 130 135 140 140 145 150 155 160
100 155 160 165 165 170 180 185 190 200
110 185 190 195 200 205 215 225 230 245
Table A2 Intersection stopping sight distances for school bus stops located off the carriageway
Design speed
(km/h)
Safe intersection
Sight distance (m)
- desirable
80 181
90 215
100 253
110 297
If school bus stops or interchanges must be located where visibility is impaired, safety may be
compromised. Other measures such as signing, delineation, high-friction surfaces and vegetation
clearance should be introduced to warn motorists of the potential hazards.
A3.1.3 Proximity to side roads
Locating school bus stops within close proximity to side roads/intersections should be avoided to ensure
acceptable sight and stopping distances are not constrained by side road traffic, and to minimise conflict
with other road users.
Where a school bus stop is needed close to an intersection, it should be on the departure side of the
intersection. This ensures the sight and stopping distances for all intersection traffic is not constrained by
the bus, and motorists have greater visibility of students or other pedestrians wishing to cross the road. It
also reduces conflicts between buses and vehicles turning at the intersection.
It is recommended that a suitable distance for stops to be located on the departure side of an intersection
is at least 50m to avoid misinterpretation of a bus driver’s intention to stop rather than turn left into the
side road.
Where school-located bus stops cannot be accommodated within the school grounds, the issues of
proximity to side roads and intersections described above are also relevant.
In some instances the only suitable location identified for buses to stop is within an intersection (refer
figure A1). This may be acceptable where traffic volumes on the side road are very small (below 500
vehicles per day) and sight distances from the side road to a stationary bus are good.
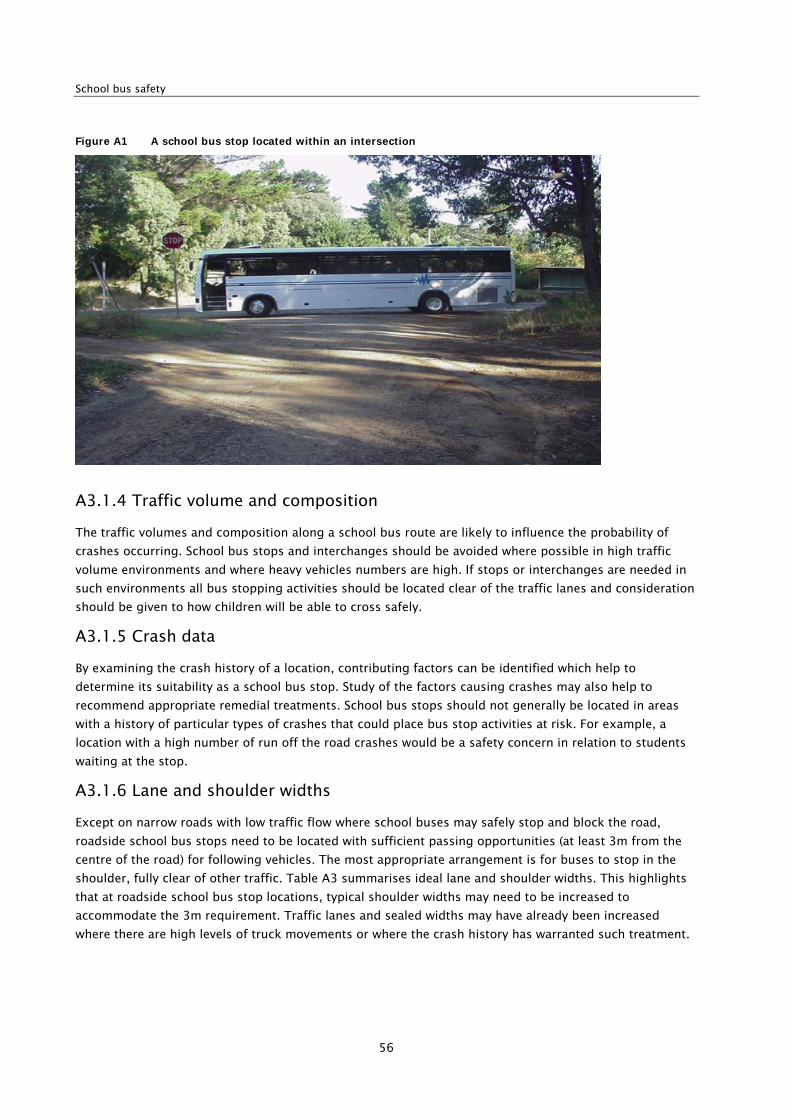
School bus safety
56
Figure A1 A school bus stop located within an intersection
A3.1.4 Traffic volume and composition
The traffic volumes and composition along a school bus route are likely to influence the probability of
crashes occurring. School bus stops and interchanges should be avoided where possible in high traffic
volume environments and where heavy vehicles numbers are high. If stops or interchanges are needed in
such environments all bus stopping activities should be located clear of the traffic lanes and consideration
should be given to how children will be able to cross safely.
A3.1.5 Crash data
By examining the crash history of a location, contributing factors can be identified which help to
determine its suitability as a school bus stop. Study of the factors causing crashes may also help to
recommend appropriate remedial treatments. School bus stops should not generally be located in areas
with a history of particular types of crashes that could place bus stop activities at risk. For example, a
location with a high number of run off the road crashes would be a safety concern in relation to students
waiting at the stop.
A3.1.6 Lane and shoulder widths
Except on narrow roads with low traffic flow where school buses may safely stop and block the road,
roadside school bus stops need to be located with sufficient passing opportunities (at least 3m from the
centre of the road) for following vehicles. The most appropriate arrangement is for buses to stop in the
shoulder, fully clear of other traffic. Table A3 summarises ideal lane and shoulder widths. This highlights
that at roadside school bus stop locations, typical shoulder widths may need to be increased to
accommodate the 3m requirement. Traffic lanes and sealed widths may have already been increased
where there are high levels of truck movements or where the crash history has warranted such treatment.
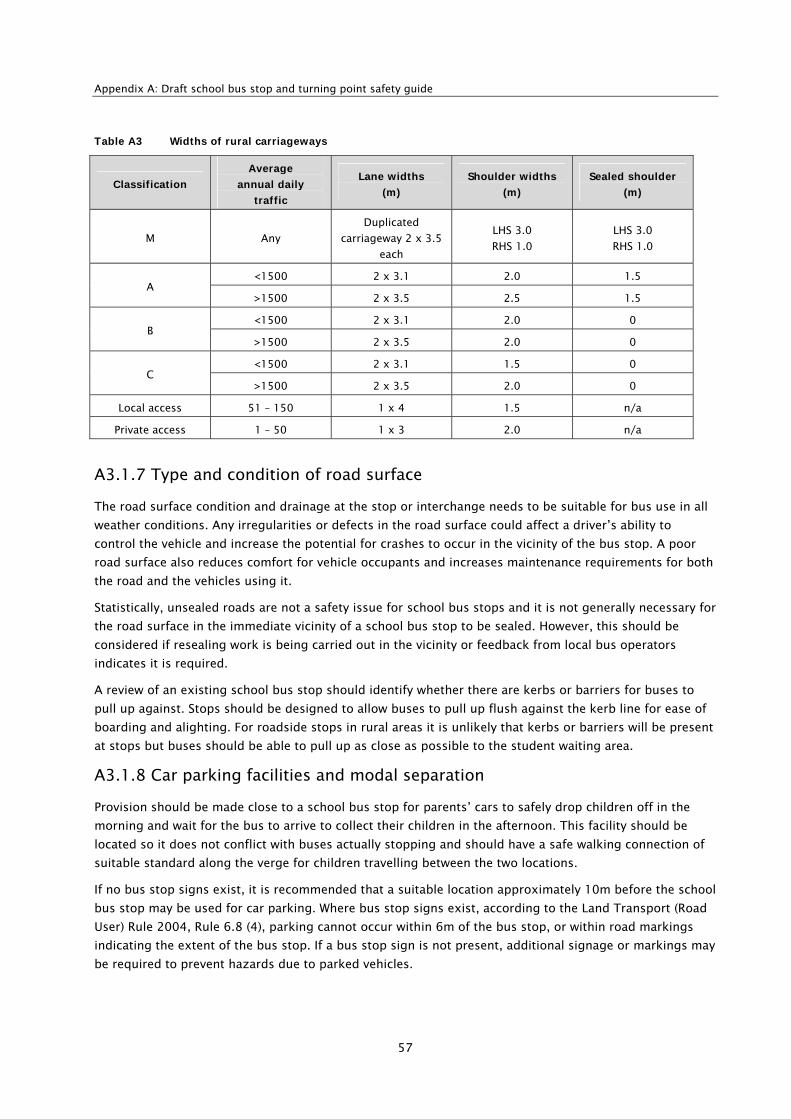
Appendix A: Draft school bus stop and turning point safety guide
57
Table A3 Widths of rural carriageways
Classification Average
annual daily
traffic
Lane widths
(m) Shoulder widths
(m) Sealed shoulder
(m)
M Any
Duplicated
carriageway 2 x 3.5
each
LHS 3.0
RHS 1.0
LHS 3.0
RHS 1.0
<1500 2 x 3.1 2.0 1.5 A
>1500 2 x 3.5 2.5 1.5
<1500 2 x 3.1 2.0 0 B
>1500 2 x 3.5 2.0 0
<1500 2 x 3.1 1.5 0 C
>1500 2 x 3.5 2.0 0
Local access 51 – 150 1 x 4 1.5 n/a
Private access 1 – 50 1 x 3 2.0 n/a
A3.1.7 Type and condition of road surface
The road surface condition and drainage at the stop or interchange needs to be suitable for bus use in all
weather conditions. Any irregularities or defects in the road surface could affect a driver’s ability to
control the vehicle and increase the potential for crashes to occur in the vicinity of the bus stop. A poor
road surface also reduces comfort for vehicle occupants and increases maintenance requirements for both
the road and the vehicles using it.
Statistically, unsealed roads are not a safety issue for school bus stops and it is not generally necessary for
the road surface in the immediate vicinity of a school bus stop to be sealed. However, this should be
considered if resealing work is being carried out in the vicinity or feedback from local bus operators
indicates it is required.
A review of an existing school bus stop should identify whether there are kerbs or barriers for buses to
pull up against. Stops should be designed to allow buses to pull up flush against the kerb line for ease of
boarding and alighting. For roadside stops in rural areas it is unlikely that kerbs or barriers will be present
at stops but buses should be able to pull up as close as possible to the student waiting area.
A3.1.8 Car parking facilities and modal separation
Provision should be made close to a school bus stop for parents’ cars to safely drop children off in the
morning and wait for the bus to arrive to collect their children in the afternoon. This facility should be
located so it does not conflict with buses actually stopping and should have a safe walking connection of
suitable standard along the verge for children travelling between the two locations.
If no bus stop signs exist, it is recommended that a suitable location approximately 10m before the school
bus stop may be used for car parking. Where bus stop signs exist, according to the Land Transport (Road
User) Rule 2004, Rule 6.8 (4), parking cannot occur within 6m of the bus stop, or within road markings
indicating the extent of the bus stop. If a bus stop sign is not present, additional signage or markings may
be required to prevent hazards due to parked vehicles.
School bus safety
58
At school located bus stops every effort should be made to separate bus activity from other road users.
Parents’ cars picking up or dropping off children generally cause the main delay to bus services at
schools. Separating these activities also significantly reduces the risk of a crash occurring.
A3.2 Passenger waiting environment
At roadside school bus stops the appropriate level of facilities should be provided for school children to
safely and comfortably wait for their bus. Ideally this should include:
• shelter
• seating
• hard standing area that is well drained and free from tripping hazards.
The appropriate level of facilities to provide will be determined by the number of children who use
individual stops and the permanency of the route. As a general rule the following criteria may be
considered as a guide in rural areas:
• shelter, with seating and a hard standing area for all stops used by six or more children
• hard standing surface for all other stops.
The waiting facilities at roadside stops should be located as far away from the traffic lanes as possible.
Shelters should be located to avoid restricting sight distances for drivers on the road.
At set down stops there is no requirement for waiting facilities as children are expected to alight the bus
and immediately continue to their destination.
At school-located bus stops, waiting facilities should comprise shelter, seating, lighting and litter bins.
The waiting areas should also act as student marshalling areas. These areas should ensure students are
segregated from bus movements by the use of guard rails/barrier fencing.
Where possible the waiting areas at school-located bus stops should be located close to school buildings
to allow students to directly transfer to or from buses. This avoids the need for students to cross roads
and minimises potential conflict with other road users.
Where it is not possible to locate school bus stops adjacent to school buildings the provision of clearly
marked road crossing points should be considered where student numbers justify a treatment. The
marshalling of students across roads should be appropriately supervised.
A3.3 Operating conditions
The usage of roadside school bus stops in rural areas can vary significantly. Student numbers will
influence the most suitable stop treatment. Stops used by the members of a single family are more likely
to be transient in nature compared with stops catering for the needs of more than one family. The
permanency of the route and the number of students will particularly impact on the appropriate level of
waiting facilities and highway works that should be undertaken.
At school-located bus stops it is important to identify the number of students actually transferring
between buses. Clearly marked pedestrian routes that are designed to save time and effort should be
introduced where appropriate
The vehicle type and frequency of the school bus service using a stop should be considered when
determining the level of treatment to introduce at a roadside stop. Where larger vehicles or more than one
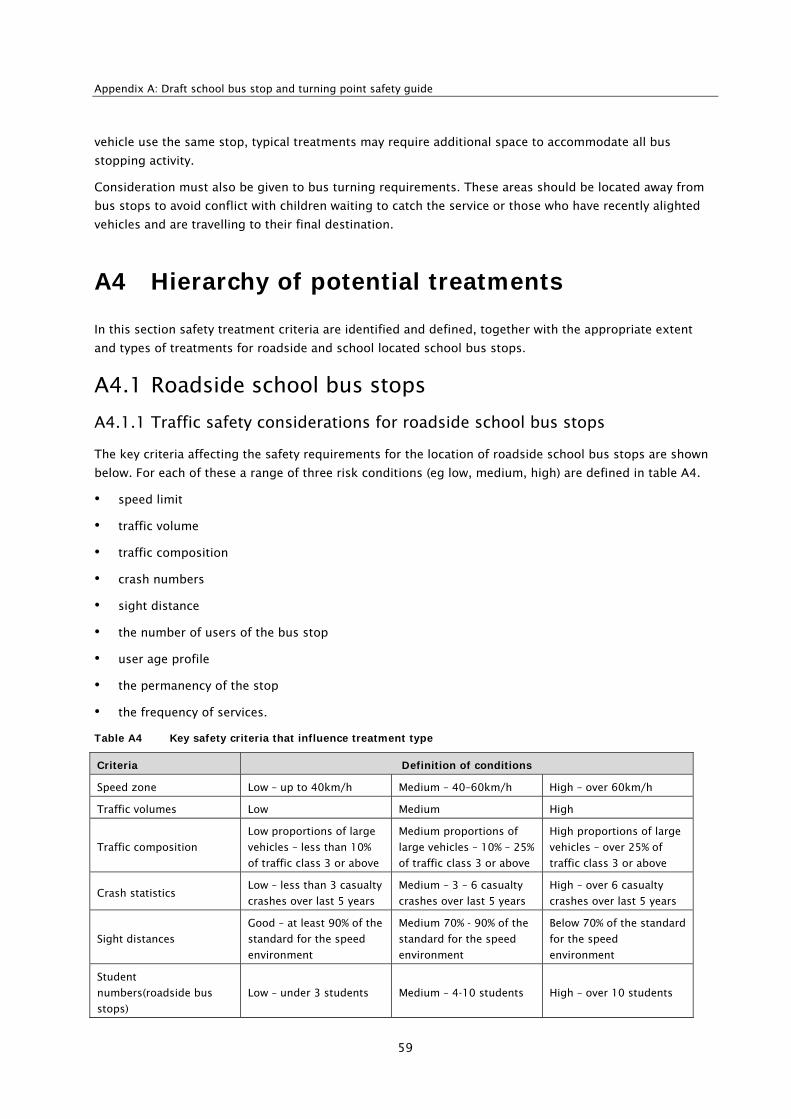
Appendix A: Draft school bus stop and turning point safety guide
59
vehicle use the same stop, typical treatments may require additional space to accommodate all bus
stopping activity.
Consideration must also be given to bus turning requirements. These areas should be located away from
bus stops to avoid conflict with children waiting to catch the service or those who have recently alighted
vehicles and are travelling to their final destination.
A4 Hierarchy of potential treatments
In this section safety treatment criteria are identified and defined, together with the appropriate extent
and types of treatments for roadside and school located school bus stops.
A4.1 Roadside school bus stops
A4.1.1 Traffic safety considerations for roadside school bus stops
The key criteria affecting the safety requirements for the location of roadside school bus stops are shown
below. For each of these a range of three risk conditions (eg low, medium, high) are defined in table A4.
• speed limit
• traffic volume
• traffic composition
• crash numbers
• sight distance
• the number of users of the bus stop
• user age profile
• the permanency of the stop
• the frequency of services.
Table A4 Key safety criteria that influence treatment type
Criteria Definition of conditions
Speed zone Low – up to 40km/h Medium – 40–60km/h High – over 60km/h
Traffic volumes Low Medium High
Traffic composition
Low proportions of large
vehicles – less than 10%
of traffic class 3 or above
Medium proportions of
large vehicles – 10% – 25%
of traffic class 3 or above
High proportions of large
vehicles – over 25% of
traffic class 3 or above
Crash statistics Low – less than 3 casualty
crashes over last 5 years
Medium – 3 – 6 casualty
crashes over last 5 years
High – over 6 casualty
crashes over last 5 years
Sight distances
Good – at least 90% of the
standard for the speed
environment
Medium 70% - 90% of the
standard for the speed
environment
Below 70% of the standard
for the speed
environment
Student
numbers(roadside bus
stops)
Low – under 3 students Medium – 4-10 students High – over 10 students
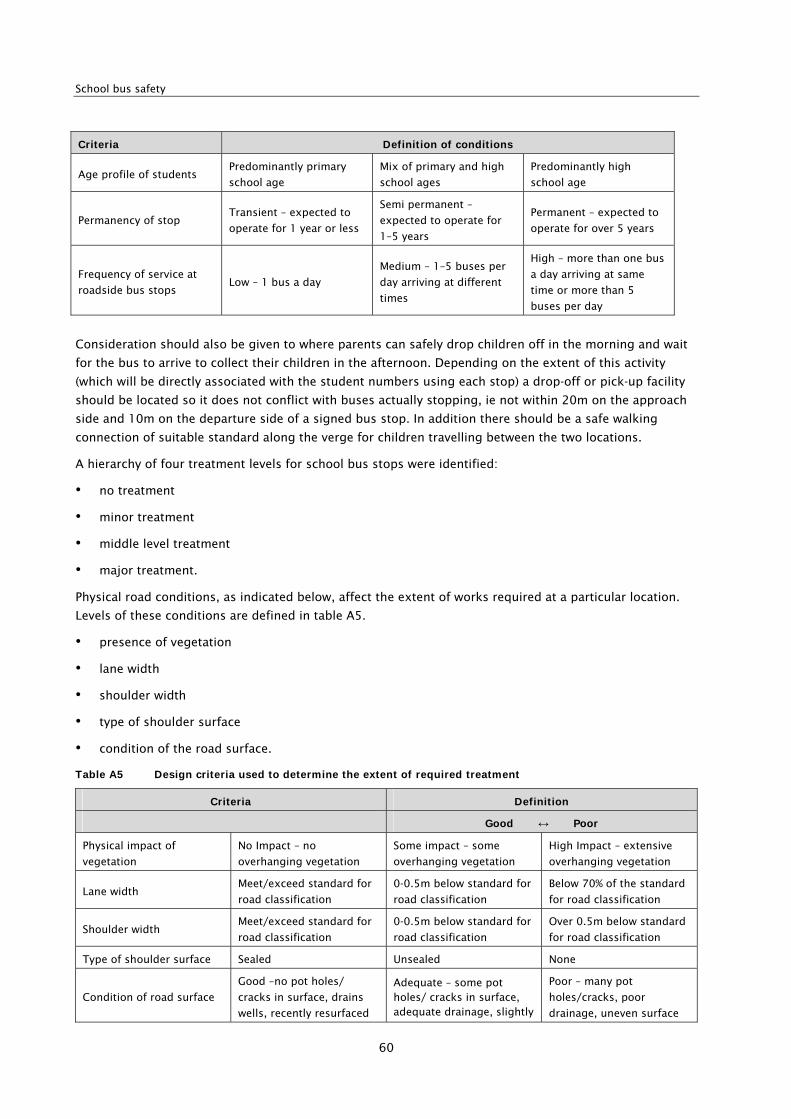
School bus safety
60
Criteria Definition of conditions
Age profile of students Predominantly primary
school age
Mix of primary and high
school ages
Predominantly high
school age
Permanency of stop Transient – expected to
operate for 1 year or less
Semi permanent –
expected to operate for
1–5 years
Permanent – expected to
operate for over 5 years
Frequency of service at
roadside bus stops Low – 1 bus a day
Medium – 1–5 buses per
day arriving at different
times
High – more than one bus
a day arriving at same
time or more than 5
buses per day
Consideration should also be given to where parents can safely drop children off in the morning and wait
for the bus to arrive to collect their children in the afternoon. Depending on the extent of this activity
(which will be directly associated with the student numbers using each stop) a drop-off or pick-up facility
should be located so it does not conflict with buses actually stopping, ie not within 20m on the approach
side and 10m on the departure side of a signed bus stop. In addition there should be a safe walking
connection of suitable standard along the verge for children travelling between the two locations.
A hierarchy of four treatment levels for school bus stops were identified:
• no treatment
• minor treatment
• middle level treatment
• major treatment.
Physical road conditions, as indicated below, affect the extent of works required at a particular location.
Levels of these conditions are defined in table A5.
• presence of vegetation
• lane width
• shoulder width
• type of shoulder surface
• condition of the road surface.
Table A5 Design criteria used to determine the extent of required treatment
Criteria Definition
Good ↔ Poor
Physical impact of
vegetation
No Impact – no
overhanging vegetation
Some impact – some
overhanging vegetation
High Impact – extensive
overhanging vegetation
Lane width Meet/exceed standard for
road classification
0-0.5m below standard for
road classification
Below 70% of the standard
for road classification
Shoulder width Meet/exceed standard for
road classification
0-0.5m below standard for
road classification
Over 0.5m below standard
for road classification
Type of shoulder surface Sealed Unsealed None
Condition of road surface
Good –no pot holes/
cracks in surface, drains
wells, recently resurfaced
Adequate – some pot holes/ cracks in surface, adequate drainage, slightly
Poor – many pot
holes/cracks, poor
drainage, uneven surface
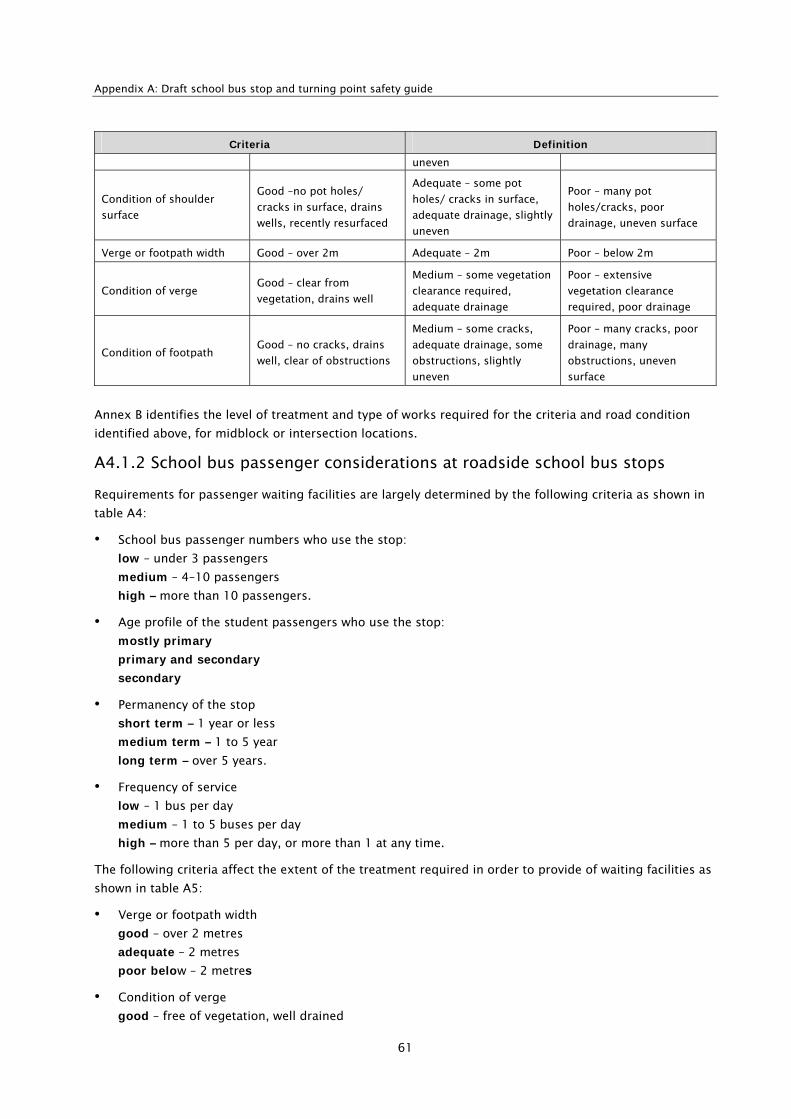
Appendix A: Draft school bus stop and turning point safety guide
61
Criteria Definition
uneven
Condition of shoulder
surface
Good –no pot holes/
cracks in surface, drains
wells, recently resurfaced
Adequate – some pot
holes/ cracks in surface,
adequate drainage, slightly
uneven
Poor – many pot
holes/cracks, poor
drainage, uneven surface
Verge or footpath width Good – over 2m Adequate – 2m Poor – below 2m
Condition of verge Good – clear from
vegetation, drains well
Medium – some vegetation
clearance required,
adequate drainage
Poor – extensive
vegetation clearance
required, poor drainage
Condition of footpath Good – no cracks, drains
well, clear of obstructions
Medium – some cracks,
adequate drainage, some
obstructions, slightly
uneven
Poor – many cracks, poor
drainage, many
obstructions, uneven
surface
Annex B identifies the level of treatment and type of works required for the criteria and road condition
identified above, for midblock or intersection locations.
A4.1.2 School bus passenger considerations at roadside school bus stops
Requirements for passenger waiting facilities are largely determined by the following criteria as shown in
table A4:
• School bus passenger numbers who use the stop:
low – under 3 passengers
medium – 4–10 passengers
high – more than 10 passengers.
• Age profile of the student passengers who use the stop:
mostly primary
primary and secondary
secondary
• Permanency of the stop
short term – 1 year or less
medium term – 1 to 5 year
long term – over 5 years.
• Frequency of service
low – 1 bus per day
medium – 1 to 5 buses per day
high – more than 5 per day, or more than 1 at any time.
The following criteria affect the extent of the treatment required in order to provide of waiting facilities as
shown in table A5:
• Verge or footpath width
good – over 2 metres
adequate – 2 metres
poor below – 2 metres
• Condition of verge
good – free of vegetation, well drained
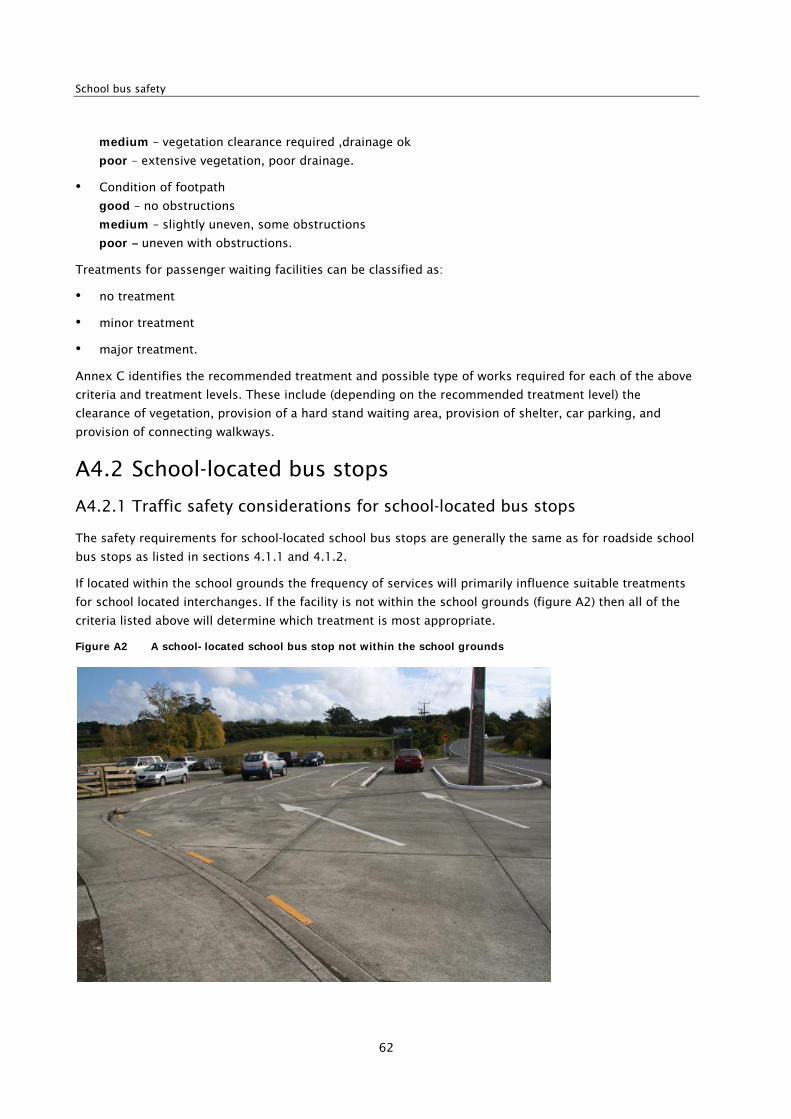
School bus safety
62
medium – vegetation clearance required ,drainage ok
poor – extensive vegetation, poor drainage.
• Condition of footpath
good – no obstructions
medium – slightly uneven, some obstructions
poor – uneven with obstructions.
Treatments for passenger waiting facilities can be classified as:
• no treatment
• minor treatment
• major treatment.
Annex C identifies the recommended treatment and possible type of works required for each of the above
criteria and treatment levels. These include (depending on the recommended treatment level) the
clearance of vegetation, provision of a hard stand waiting area, provision of shelter, car parking, and
provision of connecting walkways.
A4.2 School-located bus stops
A4.2.1 Traffic safety considerations for school-located bus stops
The safety requirements for school-located school bus stops are generally the same as for roadside school
bus stops as listed in sections 4.1.1 and 4.1.2.
If located within the school grounds the frequency of services will primarily influence suitable treatments
for school located interchanges. If the facility is not within the school grounds (figure A2) then all of the
criteria listed above will determine which treatment is most appropriate.
Figure A2 A school-located school bus stop not within the school grounds
Appendix A: Draft school bus stop and turning point safety guide
63
To determine the most appropriate type of treatment for school-located bus stops a further three key criteria need to be assessed:
• modal conflict
• space constraints
• the level of interchange activity between buses.
The space available will predominantly govern the design options. The extent of works will then be
determined by the road surface and footpath condition of the proposed interchange site. If located near,
but outside school grounds then all of the criteria listed above apply.
Within the school grounds the most suitable treatments for school located bus stops will be determined
by:
• the frequency of services
• the presence of modal conflict
• space constraints
• the level of interchange activity between buses.
Where a school-located interchange is outside the school grounds then the assessment to determine the
most suitable treatment should primarily follow the process for reviewing roadside bus stops.
For sites within school grounds a hierarchy of three treatments were identified:
• minor treatment
• middle-level treatment
• major treatment.
Annex D identifies the conditions and design criteria associated with each treatment. The extent of works
for each treatment is determined by a review of the individual site against the design criteria. This should
also serve to verify the right level of treatment is chosen. A distinction is made within the typical
treatments identified as to which layout option is most appropriate.
A5 Typical treatments
A range of constraints exist throughout the rural road network, therefore it may not be possible to
implement the ideal bus stop treatments everywhere. The typical treatments described in this guide
should be used as a starting point and adapted to suit each particular circumstance.
For illustrative purposes three typical layouts for treatments are shown in figures A3, A4 and A5Figure .
These are:
• midblock location – no safety constraints
• midblock location – safety constraints exist
• intersection location.
The typical layouts were developed to represent a high level of safety provision for schoolchildren and
other road users to limit the interference to traffic flow on the road network. Smaller scale treatments
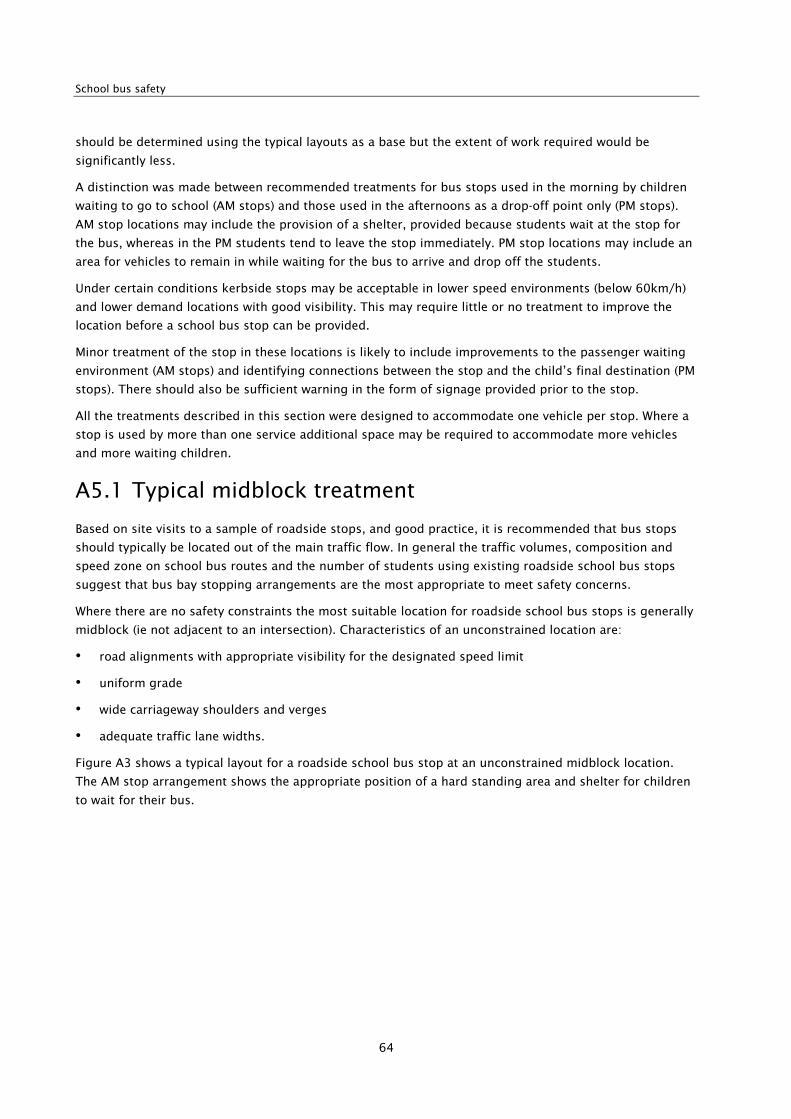
School bus safety
64
should be determined using the typical layouts as a base but the extent of work required would be
significantly less.
A distinction was made between recommended treatments for bus stops used in the morning by children
waiting to go to school (AM stops) and those used in the afternoons as a drop-off point only (PM stops).
AM stop locations may include the provision of a shelter, provided because students wait at the stop for
the bus, whereas in the PM students tend to leave the stop immediately. PM stop locations may include an
area for vehicles to remain in while waiting for the bus to arrive and drop off the students.
Under certain conditions kerbside stops may be acceptable in lower speed environments (below 60km/h)
and lower demand locations with good visibility. This may require little or no treatment to improve the
location before a school bus stop can be provided.
Minor treatment of the stop in these locations is likely to include improvements to the passenger waiting
environment (AM stops) and identifying connections between the stop and the child’s final destination (PM
stops). There should also be sufficient warning in the form of signage provided prior to the stop.
All the treatments described in this section were designed to accommodate one vehicle per stop. Where a
stop is used by more than one service additional space may be required to accommodate more vehicles
and more waiting children.
A5.1 Typical midblock treatment
Based on site visits to a sample of roadside stops, and good practice, it is recommended that bus stops
should typically be located out of the main traffic flow. In general the traffic volumes, composition and
speed zone on school bus routes and the number of students using existing roadside school bus stops
suggest that bus bay stopping arrangements are the most appropriate to meet safety concerns.
Where there are no safety constraints the most suitable location for roadside school bus stops is generally
midblock (ie not adjacent to an intersection). Characteristics of an unconstrained location are:
• road alignments with appropriate visibility for the designated speed limit
• uniform grade
• wide carriageway shoulders and verges
• adequate traffic lane widths.
Figure A3 shows a typical layout for a roadside school bus stop at an unconstrained midblock location.
The AM stop arrangement shows the appropriate position of a hard standing area and shelter for children
to wait for their bus.
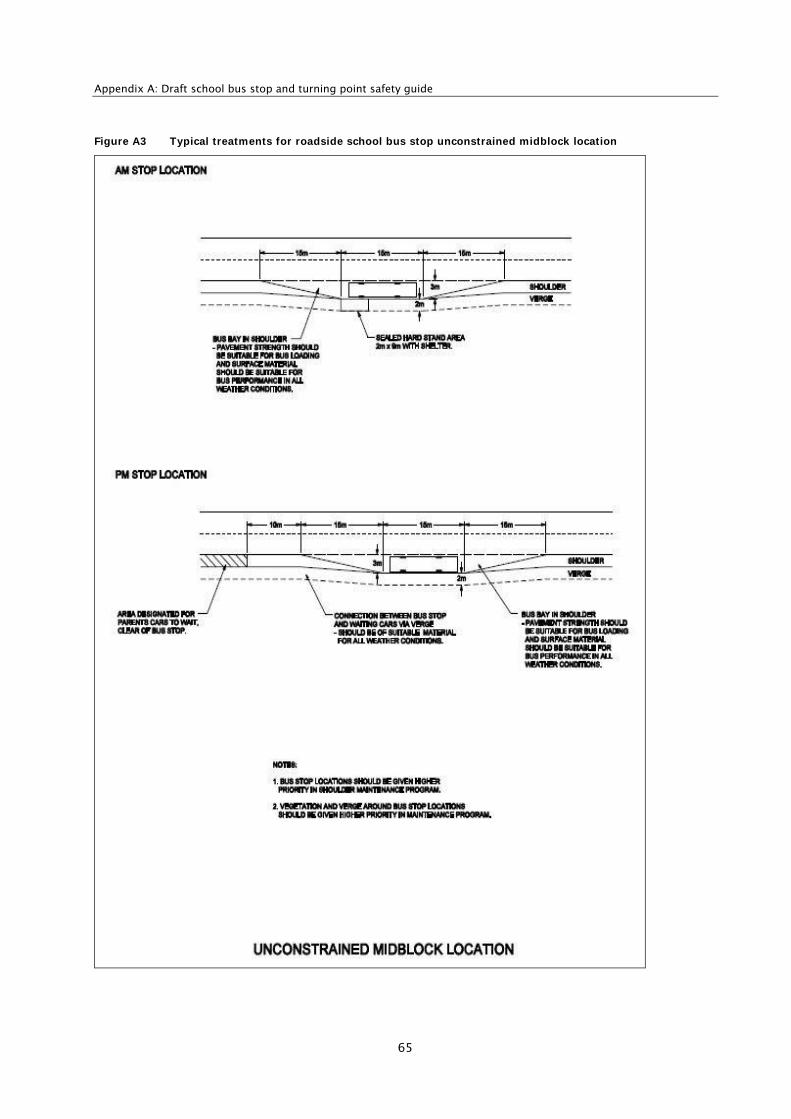
Appendix A: Draft school bus stop and turning point safety guide
65
Figure A3 Typical treatments for roadside school bus stop unconstrained midblock location
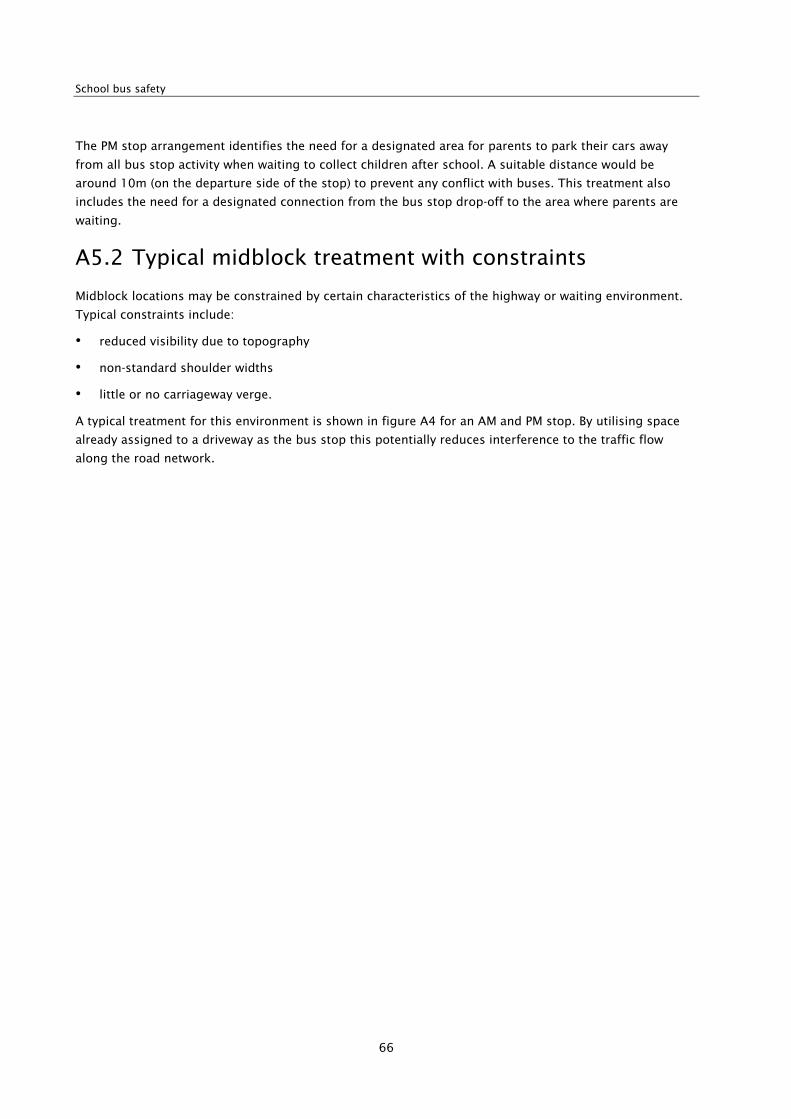
School bus safety
66
The PM stop arrangement identifies the need for a designated area for parents to park their cars away
from all bus stop activity when waiting to collect children after school. A suitable distance would be
around 10m (on the departure side of the stop) to prevent any conflict with buses. This treatment also
includes the need for a designated connection from the bus stop drop-off to the area where parents are
waiting.
A5.2 Typical midblock treatment with constraints
Midblock locations may be constrained by certain characteristics of the highway or waiting environment.
Typical constraints include:
• reduced visibility due to topography
• non-standard shoulder widths
• little or no carriageway verge.
A typical treatment for this environment is shown in figure A4 for an AM and PM stop. By utilising space
already assigned to a driveway as the bus stop this potentially reduces interference to the traffic flow
along the road network.
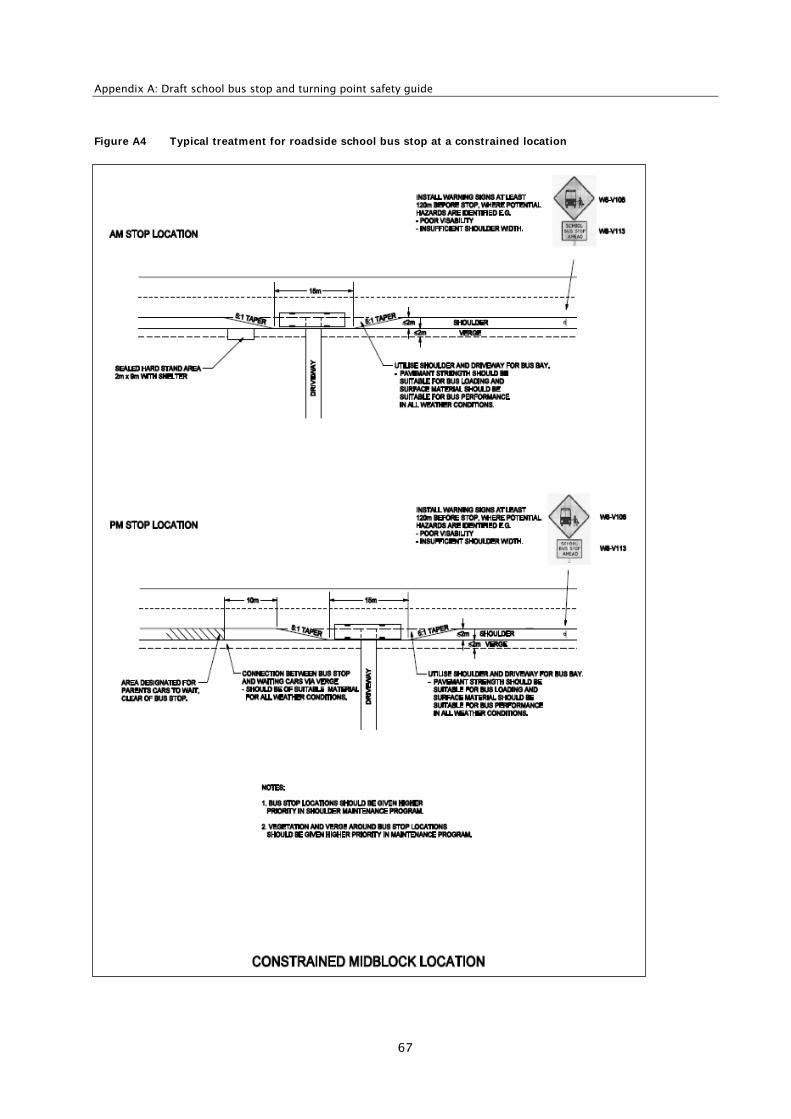
Appendix A: Draft school bus stop and turning point safety guide
67
Figure A4 Typical treatment for roadside school bus stop at a constrained location
School bus safety
68
Additional constraints may exist at driveway locations such as culvert end walls, marker posts and
letterboxes. These constraints need to be addressed within the design process.
This arrangement may still result in buses not being able to stop clear of the traffic lane. In such
circumstances a school bus stop warning sign and school bus stop ahead plate should be erected at least
120m in advance of the stop. This allows motorists sufficient time to reduce speed and react to the hazard
in front of them.
The AM stop arrangement again shows the appropriate position of the waiting area and the PM stop
arrangement identifies appropriate arrangements for parents to park their cars away from all bus stop
activity.
Where sight distances are restricted or the PM stop encroaches into the traffic lane it is also appropriate to
erect a school bus stop warning sign and school bus stop ahead plate at the appropriate distance in front
of the stop, according to the speed zone.
It is important to note that for roads with high traffic volumes (particularly heavy vehicles) high-speed
limits warning signs may not be sufficient to mitigate the risk of buses encroaching on the traffic lane. In
these circumstances, where no alternative location can be identified it may be necessary to undertake a
treatment that removes buses completely from the traffic stream. This would be based on the
unconstrained midblock treatment but involve a higher degree of construction works to widen carriageway
shoulders and verges.
A5.3 Typical intersection treatment
In rural communities, it may be appropriate for a roadside school bus stop to be located in close proximity
to a side road intersection, particularly where this affords children much shorter journeys to and from the
school bus stop. However, care must be taken to ensure that conflict between bus stopping activities and
other road users is minimised.
Roadside school bus stops should be avoided at an intersection experiencing any safety-related
constraints. For example, this includes intersections that have below standard sight and stopping
distances, a history of crashes, below standard lane widths and/or a poor quality road surface.
Figure A5 shows a typical treatment for this location for both an AM and PM stop. In general the safest
location for a bus stop is the departure side of the intersection. This arrangement has the least impact on
sight distances for all intersection traffic. It also reduces conflict between buses and vehicles turning left
at the intersection. Pedestrian safety is better, as a motorist’s view of children or other pedestrians
wanting to cross the intersection is less likely to be blocked by the bus.
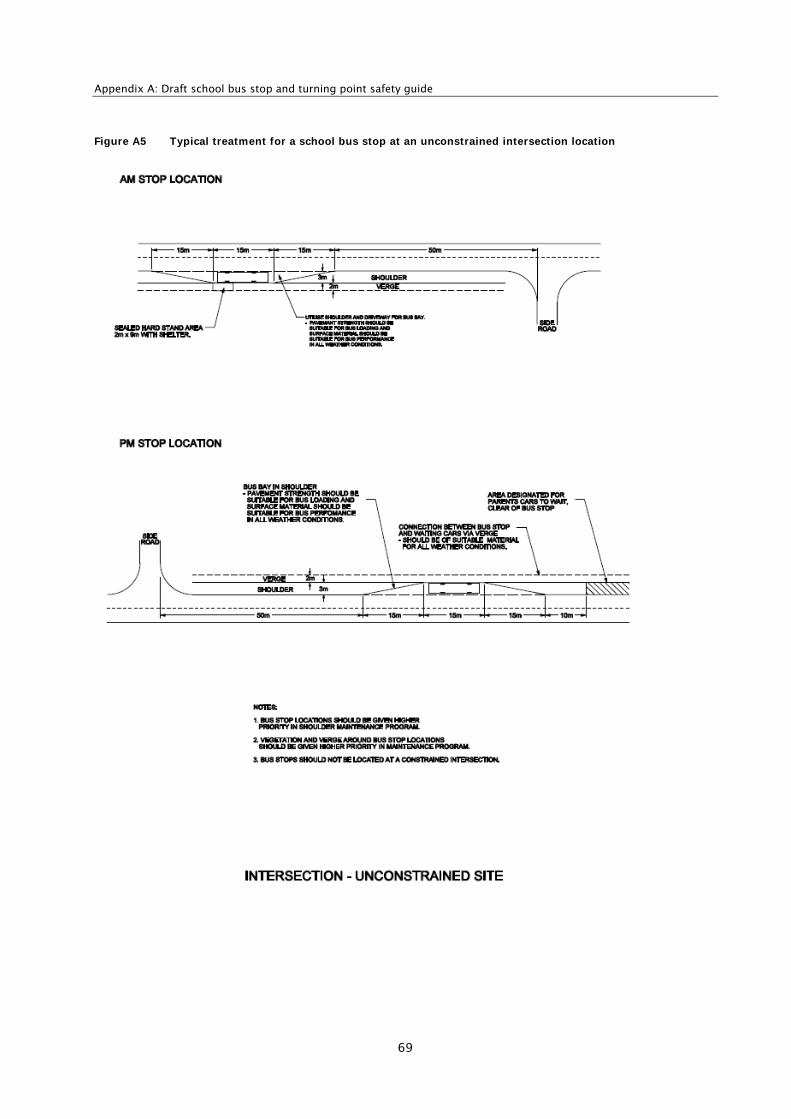
Appendix A: Draft school bus stop and turning point safety guide
69
Figure A5 Typical treatment for a school bus stop at an unconstrained intersection location
School bus safety
70
Where the bus stop is on the same side of the road as the intersecting side road, it is recommended that
school bus stops are located at least 50m from the intersection. This will reduce the likelihood of other
motorists misunderstanding a bus driver’s intention to stop rather than turn left into the intersection.
The location and level of waiting facilities for AM and PM stops at intersections is in line with the
recommendations for midblock sites.
Opportunities may also exist to locate school bus stops within an intersection where traffic volumes on
the side road are very small (below 500 vehicles per day) and sight distances from the side road to a
stationary bus are good (refer figure A1).
If stops are to be sited within an intersection, the passenger waiting facilities need to be located as far
away from the road traffic lanes as possible but with clear visibility of approaching traffic .Children need
to be issued with specific instructions not to move from the waiting area into the carriageway until the bus
is stationary with the doors open.
A5.4 Typical treatment for school-located bus stops
School locations may require minor, medium or major treatments or the provision of bus stops. Minor
treatments are similar to the minor treatments at roadside school bus stops where buses stop on the
carriageway, at the kerb, or on the shoulder. For medium and major treatments there are generally three
typical options:
• island layout
• concourse layout
• perimeter layout.
All three treatments are based on the assumption that sufficient land is available within or immediately
outside the school grounds to develop for the purpose of a bus interchange. Where interchanges are
located outside the school grounds, greater consideration needs to be given to the highway environment
in which the interchange will be located. Consideration should be given to both the criteria for roadside
school bus stops and school-located interchanges when these sites are developed.
The key distinction between whether a treatment is considered medium or major is the extent of works
required at each location
For illustrative purposes each of the three interchange treatments is based on accommodating eight buses
with a dimension of 12.5m x 2.5m. It is assumed that bus interchange activity is segregated from other
vehicular activity to minimise conflict with parents’ and teachers’ cars. Signage should be erected to
prevent other vehicles entering the bus interchange area. It is also recommended that the appropriate
school staff member supervise all bus interchange activity.
Each of the interchange treatments incorporates waiting facilities in the form of shelters with seating and
litterbins. It is also recommended that safety fencing be erected to segregate bus movements from the
student waiting/marshalling areas.
At all times it is essential that student marshalling activities are supervised.
A5.4.1 Island layout
The island layout treatment is shown in figure A6. This shows one boarding/alighting island between
narrow single bus lanes. An additional boarding/alighting area is located directly adjacent to the school
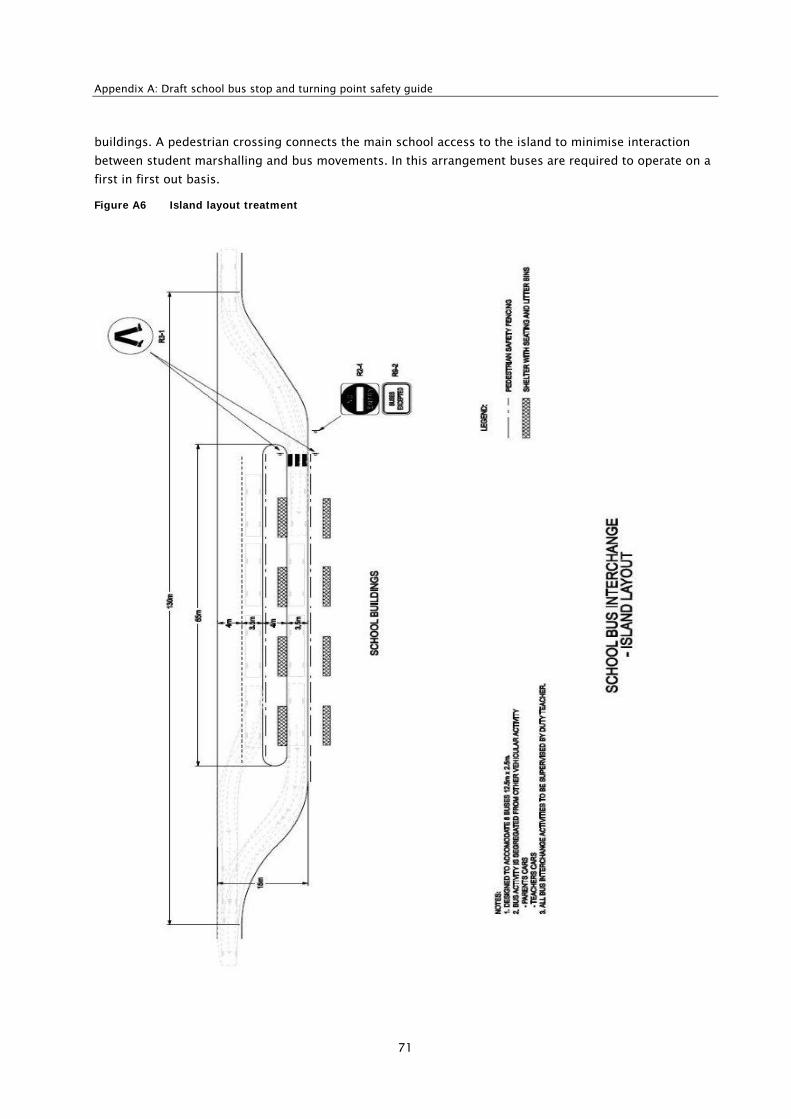
Appendix A: Draft school bus stop and turning point safety guide
71
buildings. A pedestrian crossing connects the main school access to the island to minimise interaction
between student marshalling and bus movements. In this arrangement buses are required to operate on a
first in first out basis.
Figure A6 Island layout treatment
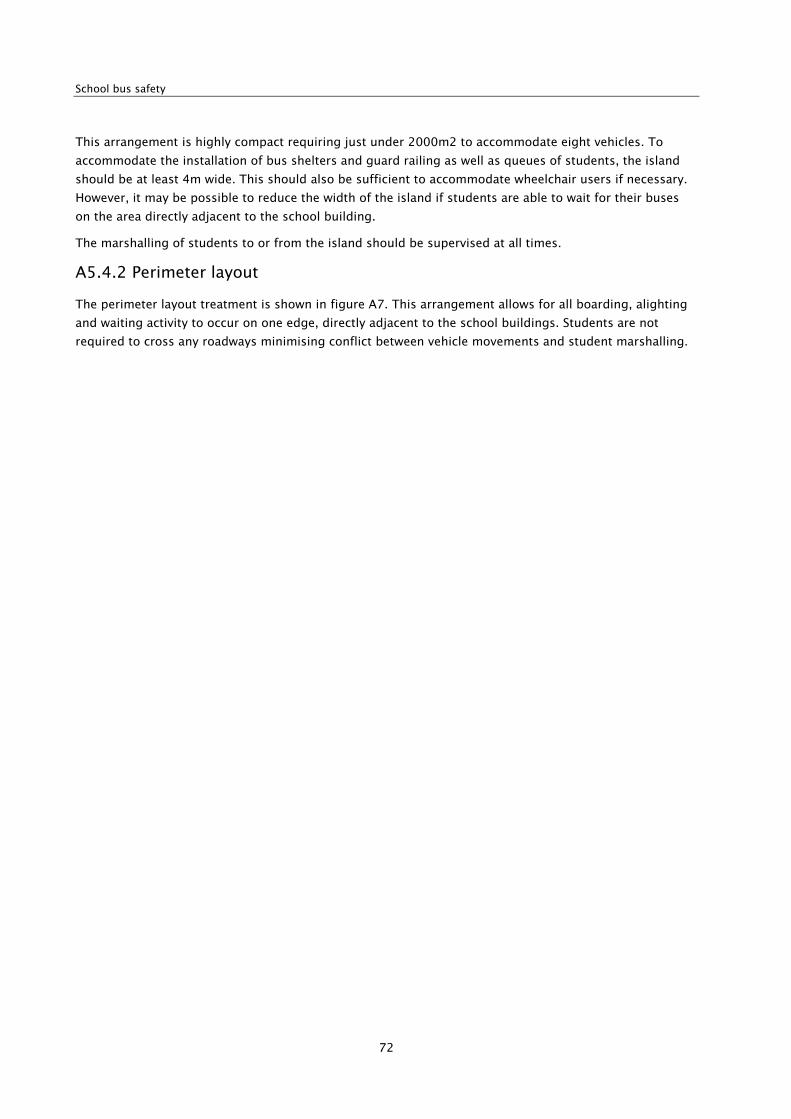
School bus safety
72
This arrangement is highly compact requiring just under 2000m2 to accommodate eight vehicles. To
accommodate the installation of bus shelters and guard railing as well as queues of students, the island
should be at least 4m wide. This should also be sufficient to accommodate wheelchair users if necessary.
However, it may be possible to reduce the width of the island if students are able to wait for their buses
on the area directly adjacent to the school building.
The marshalling of students to or from the island should be supervised at all times.
A5.4.2 Perimeter layout
The perimeter layout treatment is shown in figure A7. This arrangement allows for all boarding, alighting
and waiting activity to occur on one edge, directly adjacent to the school buildings. Students are not
required to cross any roadways minimising conflict between vehicle movements and student marshalling.
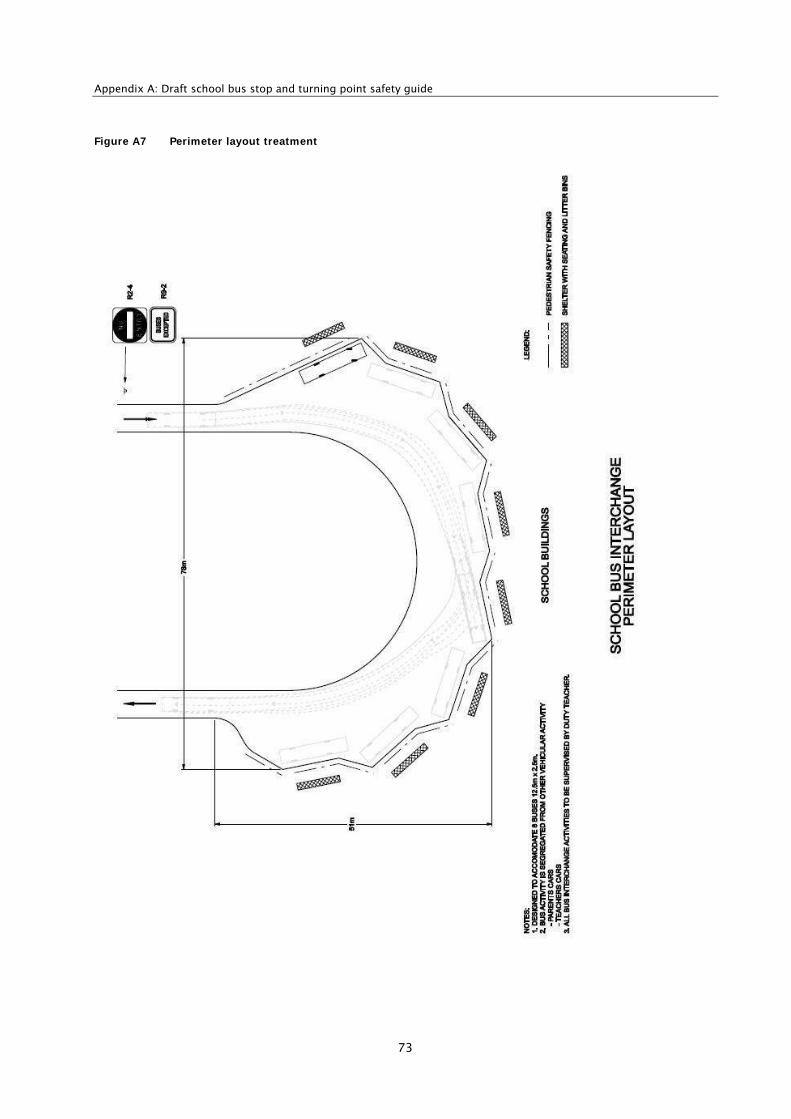
Appendix A: Draft school bus stop and turning point safety guide
73
Figure A7 Perimeter layout treatment
School bus safety
74
This arrangement requires an area of just under 4000m2 to accommodate eight vehicles. Bus shelters are
provided adjacent to each allocated bus bay and guard railing erected along the length of the interchange
with the appropriate size gaps for students to board or alight vehicles.
Buses are able to depart from the interchange independently although this would require certain vehicles
to reverse out from some of the allocated bays.
A5.4.3 Concourse layout
The concourse layout treatment is shown in figure A8. This arrangement has all boarding and alighting
activity occurring on one central concourse. Students wait for their buses on this central concourse, which
would include shelters with seating and litter bins.
Appendix A: Draft school bus stop and turning point safety guide
75
Figure A8 Concourse layout treatment
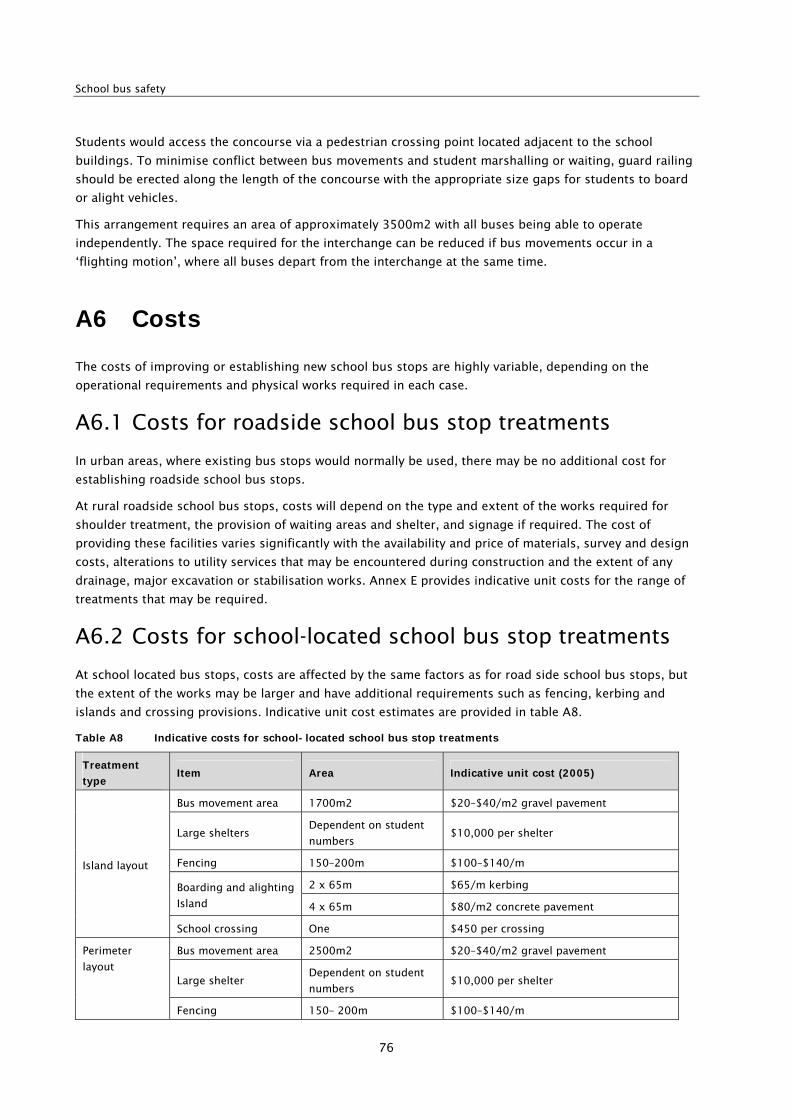
School bus safety
76
Students would access the concourse via a pedestrian crossing point located adjacent to the school
buildings. To minimise conflict between bus movements and student marshalling or waiting, guard railing
should be erected along the length of the concourse with the appropriate size gaps for students to board
or alight vehicles.
This arrangement requires an area of approximately 3500m2 with all buses being able to operate
independently. The space required for the interchange can be reduced if bus movements occur in a
‘flighting motion’, where all buses depart from the interchange at the same time.
A6 Costs
The costs of improving or establishing new school bus stops are highly variable, depending on the
operational requirements and physical works required in each case.
A6.1 Costs for roadside school bus stop treatments
In urban areas, where existing bus stops would normally be used, there may be no additional cost for
establishing roadside school bus stops.
At rural roadside school bus stops, costs will depend on the type and extent of the works required for
shoulder treatment, the provision of waiting areas and shelter, and signage if required. The cost of
providing these facilities varies significantly with the availability and price of materials, survey and design
costs, alterations to utility services that may be encountered during construction and the extent of any
drainage, major excavation or stabilisation works. Annex E provides indicative unit costs for the range of
treatments that may be required.
A6.2 Costs for school-located school bus stop treatments
At school located bus stops, costs are affected by the same factors as for road side school bus stops, but
the extent of the works may be larger and have additional requirements such as fencing, kerbing and
islands and crossing provisions. Indicative unit cost estimates are provided in table A8.
Table A8 Indicative costs for school-located school bus stop treatments
Treatment
type Item Area Indicative unit cost (2005)
Bus movement area 1700m2 $20–$40/m2 gravel pavement
Large shelters Dependent on student
numbers $10,000 per shelter
Fencing 150–200m $100–$140/m
2 x 65m $65/m kerbing Boarding and alighting
Island 4 x 65m $80/m2 concrete pavement
Island layout
School crossing One $450 per crossing
Bus movement area 2500m2 $20–$40/m2 gravel pavement
Large shelter Dependent on student
numbers $10,000 per shelter
Perimeter
layout
Fencing 150– 200m $100–$140/m
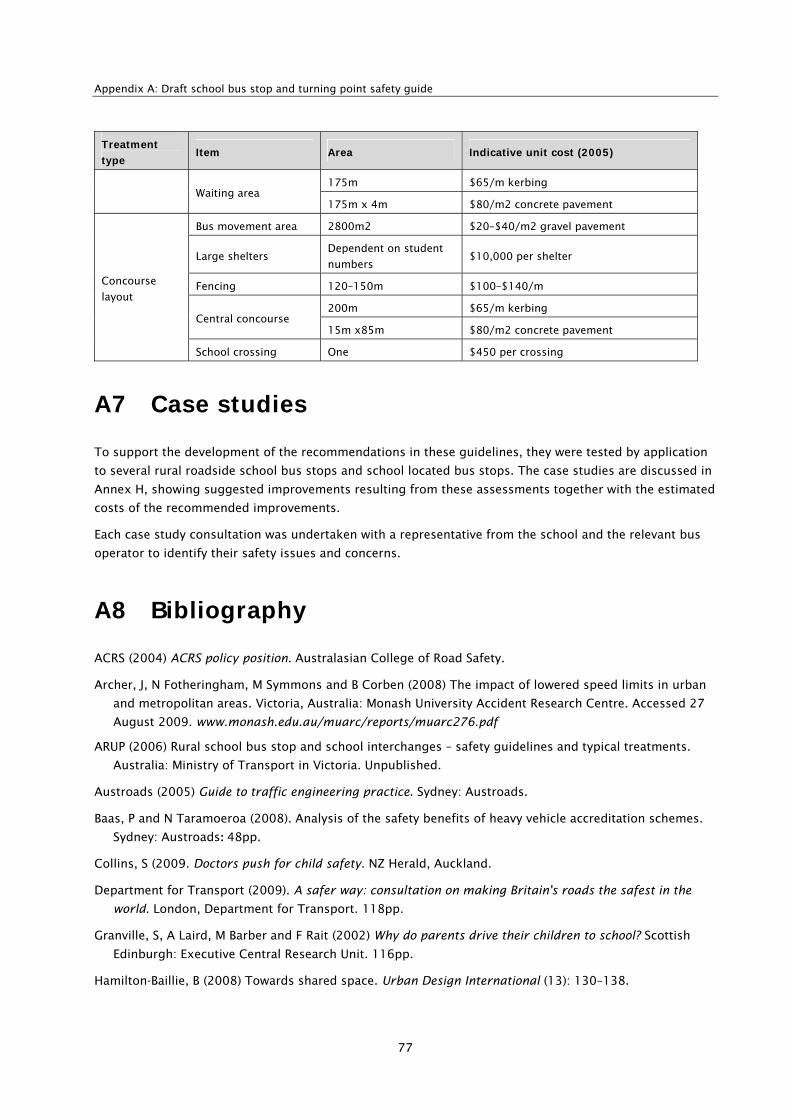
Appendix A: Draft school bus stop and turning point safety guide
77
Treatment
type Item Area Indicative unit cost (2005)
175m $65/m kerbing Waiting area
175m x 4m $80/m2 concrete pavement
Bus movement area 2800m2 $20–$40/m2 gravel pavement
Large shelters Dependent on student
numbers $10,000 per shelter
Fencing 120–150m $100–$140/m
200m $65/m kerbing Central concourse
15m x85m $80/m2 concrete pavement
Concourse
layout
School crossing One $450 per crossing
A7 Case studies
To support the development of the recommendations in these guidelines, they were tested by application
to several rural roadside school bus stops and school located bus stops. The case studies are discussed in
Annex H, showing suggested improvements resulting from these assessments together with the estimated
costs of the recommended improvements.
Each case study consultation was undertaken with a representative from the school and the relevant bus
operator to identify their safety issues and concerns.
A8 Bibliography
ACRS (2004) ACRS policy position. Australasian College of Road Safety.
Archer, J, N Fotheringham, M Symmons and B Corben (2008) The impact of lowered speed limits in urban
and metropolitan areas. Victoria, Australia: Monash University Accident Research Centre. Accessed 27
August 2009. www.monash.edu.au/muarc/reports/muarc276.pdf
ARUP (2006) Rural school bus stop and school interchanges – safety guidelines and typical treatments.
Australia: Ministry of Transport in Victoria. Unpublished.
Austroads (2005) Guide to traffic engineering practice. Sydney: Austroads.
Baas, P and N Taramoeroa (2008). Analysis of the safety benefits of heavy vehicle accreditation schemes.
Sydney: Austroads: 48pp.
Collins, S (2009. Doctors push for child safety. NZ Herald, Auckland.
Department for Transport (2009). A safer way: consultation on making Britain's roads the safest in the
world. London, Department for Transport. 118pp.
Granville, S, A Laird, M Barber and F Rait (2002) Why do parents drive their children to school? Scottish
Edinburgh: Executive Central Research Unit. 116pp.
Hamilton-Baillie, B (2008) Towards shared space. Urban Design International (13): 130–138.
School bus safety
78
Land Transport Safety Authority (LTSA) (2004) Guidelines for the safe siting of school bus stops.
Wellington: Land Transport Safety Authority. 6pp.
Larcombe Consulting Ltd (2008). School transport - a review of the 2007 Special Education School
Transport Assistance Tender Round. Wellington.
Matenga (2008) Reserve findings of Coroner Matenga from inquest into the death of Nathaniel Sicely
(Appendix to file ref: CSU-2008-WHG-000020). Accessed 27 August 2009. www.justice.govt.nz/
coroners/recommendations-register/2008/april/Recommendation.Scott-Collins.G.27.Apr.2008.pdf
Ministry of Education NZ (2009). Ministry of Education annual report 2009. Wellington: Ministry of
Education.
Ministry of Transport Victoria (2006) Rural school bus stop and school interchanges – safety guidelines and
typical treatments.
National Highway Traffic Safety Administration (NHTSA) (2000) Best practice guide: reducing the illegal
passing of school buses. Washington DC: NHTSA. 88pp.
National Highway Traffic Safety Administration (NHTSA) (2006) Traffic safety facts. Washington DC:
NHTSA. Accessed 27 August 2009. www-nrd.nhtsa.dot.gov/Pubs/810809.PDF
NZ Transport Agency (NZTA) (2010) Manual of traffic signs and markings. Wellington: NZTA.
Organisation for Economic Co-operation and Development (OECD) (2004) Keeping children safe in traffic.
Paris: OECD. 130pp.
Paine, MP and AJ Fisher (1996) Flashing warning lights on school buses. Fifteenth International Technical
Conference of the Enhanced Safety of Vehicles. Melbourne, Australia.
Scannell, B (2010). Ministry of Education contracted school bus services, Wellington.
Shortland, HB (2009) Reserve findings of Coroner H.B. Shortland from inquest into the death of Grant
Scott-Collins, File Ref: CSU-2008-WHG-000020. Accessed 27 August 2009.
www.justice.govt.nz/coroners/recommendations-register/2008/april/Recommendation.Scott-
Collins.G.27.Apr.2008.pdf
Transportation Research Board (1998) Special report 254: Managing speed: review of current practice for
setting and enforcing speed limits. Washington DC, Transportation Research Board.
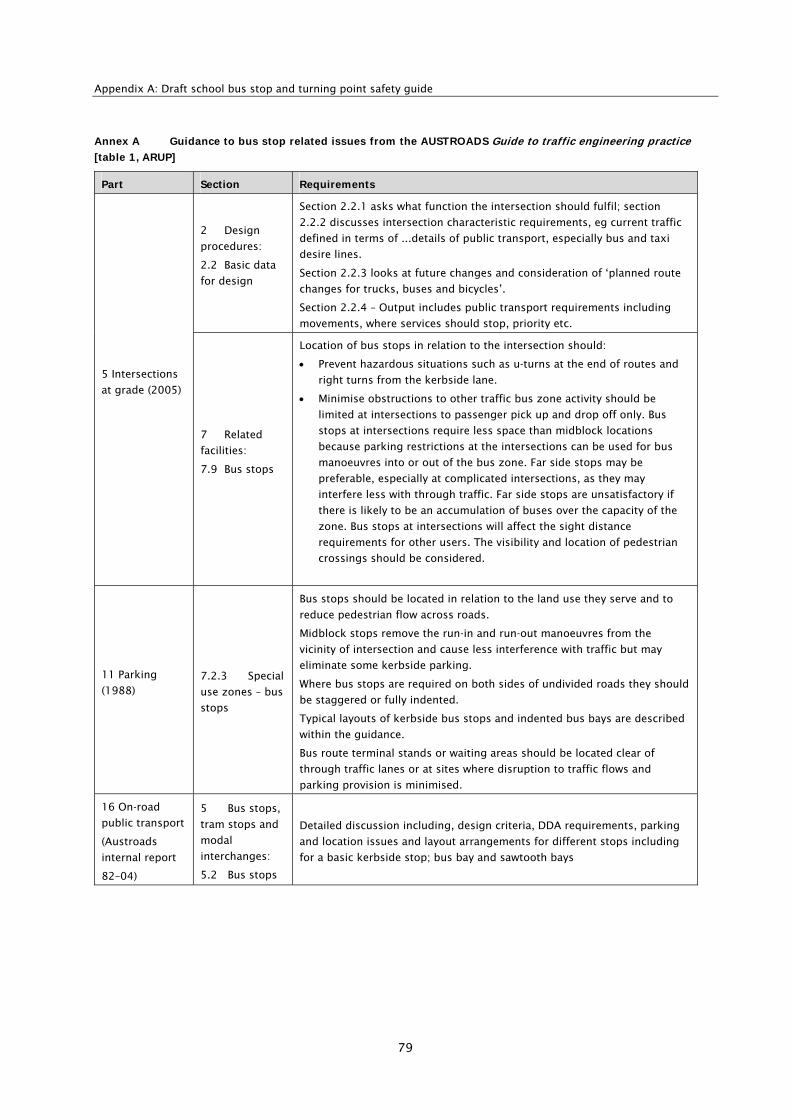
Appendix A: Draft school bus stop and turning point safety guide
79
Annex A Guidance to bus stop related issues from the AUSTROADS Guide to traffic engineering practice
[table 1, ARUP]
Part Section Requirements
2 Design
procedures:
2.2 Basic data
for design
Section 2.2.1 asks what function the intersection should fulfil; section
2.2.2 discusses intersection characteristic requirements, eg current traffic
defined in terms of ...details of public transport, especially bus and taxi
desire lines.
Section 2.2.3 looks at future changes and consideration of ‘planned route
changes for trucks, buses and bicycles’.
Section 2.2.4 – Output includes public transport requirements including
movements, where services should stop, priority etc.
5 Intersections
at grade (2005)
7 Related
facilities:
7.9 Bus stops
Location of bus stops in relation to the intersection should:
Prevent hazardous situations such as u-turns at the end of routes and
right turns from the kerbside lane.
Minimise obstructions to other traffic bus zone activity should be
limited at intersections to passenger pick up and drop off only. Bus
stops at intersections require less space than midblock locations
because parking restrictions at the intersections can be used for bus
manoeuvres into or out of the bus zone. Far side stops may be
preferable, especially at complicated intersections, as they may
interfere less with through traffic. Far side stops are unsatisfactory if
there is likely to be an accumulation of buses over the capacity of the
zone. Bus stops at intersections will affect the sight distance
requirements for other users. The visibility and location of pedestrian
crossings should be considered.
11 Parking
(1988)
7.2.3 Special
use zones – bus
stops
Bus stops should be located in relation to the land use they serve and to
reduce pedestrian flow across roads.
Midblock stops remove the run-in and run-out manoeuvres from the
vicinity of intersection and cause less interference with traffic but may
eliminate some kerbside parking.
Where bus stops are required on both sides of undivided roads they should
be staggered or fully indented.
Typical layouts of kerbside bus stops and indented bus bays are described
within the guidance.
Bus route terminal stands or waiting areas should be located clear of
through traffic lanes or at sites where disruption to traffic flows and
parking provision is minimised.
16 On-road
public transport
(Austroads
internal report
82–04)
5 Bus stops,
tram stops and
modal
interchanges:
5.2 Bus stops
Detailed discussion including, design criteria, DDA requirements, parking
and location issues and layout arrangements for different stops including
for a basic kerbside stop; bus bay and sawtooth bays
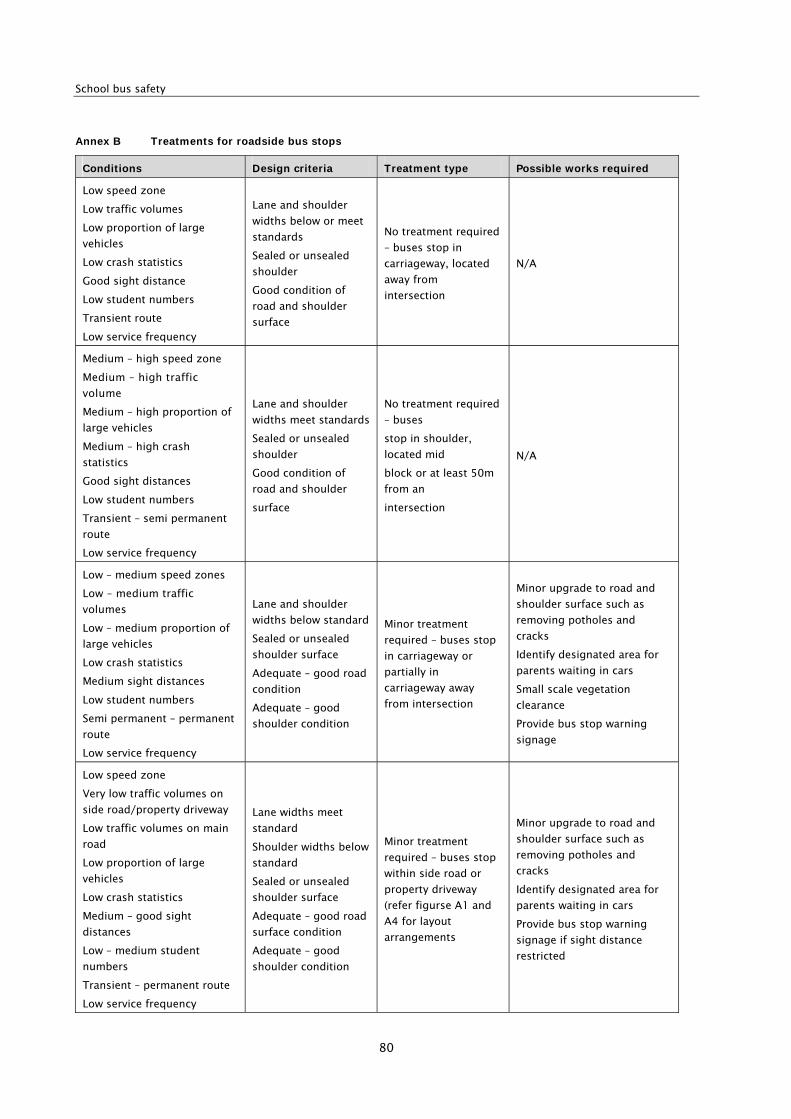
School bus safety
80
Annex B Treatments for roadside bus stops
Conditions Design criteria Treatment type Possible works required
Low speed zone
Low traffic volumes
Low proportion of large
vehicles
Low crash statistics
Good sight distance
Low student numbers
Transient route
Low service frequency
Lane and shoulder
widths below or meet
standards
Sealed or unsealed
shoulder
Good condition of
road and shoulder
surface
No treatment required
– buses stop in
carriageway, located
away from
intersection
N/A
Medium – high speed zone
Medium – high traffic
volume
Medium – high proportion of
large vehicles
Medium – high crash
statistics
Good sight distances
Low student numbers
Transient – semi permanent
route
Low service frequency
Lane and shoulder
widths meet standards
Sealed or unsealed
shoulder
Good condition of
road and shoulder
surface
No treatment required
– buses
stop in shoulder,
located mid
block or at least 50m
from an
intersection
N/A
Low – medium speed zones
Low – medium traffic
volumes
Low – medium proportion of
large vehicles
Low crash statistics
Medium sight distances
Low student numbers
Semi permanent – permanent
route
Low service frequency
Lane and shoulder
widths below standard
Sealed or unsealed
shoulder surface
Adequate – good road
condition
Adequate – good
shoulder condition
Minor treatment
required – buses stop
in carriageway or
partially in
carriageway away
from intersection
Minor upgrade to road and
shoulder surface such as
removing potholes and
cracks
Identify designated area for
parents waiting in cars
Small scale vegetation
clearance
Provide bus stop warning
signage
Low speed zone
Very low traffic volumes on
side road/property driveway
Low traffic volumes on main
road
Low proportion of large
vehicles
Low crash statistics
Medium – good sight
distances
Low – medium student
numbers
Transient – permanent route
Low service frequency
Lane widths meet
standard
Shoulder widths below
standard
Sealed or unsealed
shoulder surface
Adequate – good road
surface condition
Adequate – good
shoulder condition
Minor treatment
required – buses stop
within side road or
property driveway
(refer figurse A1 and
A4 for layout
arrangements
Minor upgrade to road and
shoulder surface such as
removing potholes and
cracks
Identify designated area for
parents waiting in cars
Provide bus stop warning
signage if sight distance
restricted
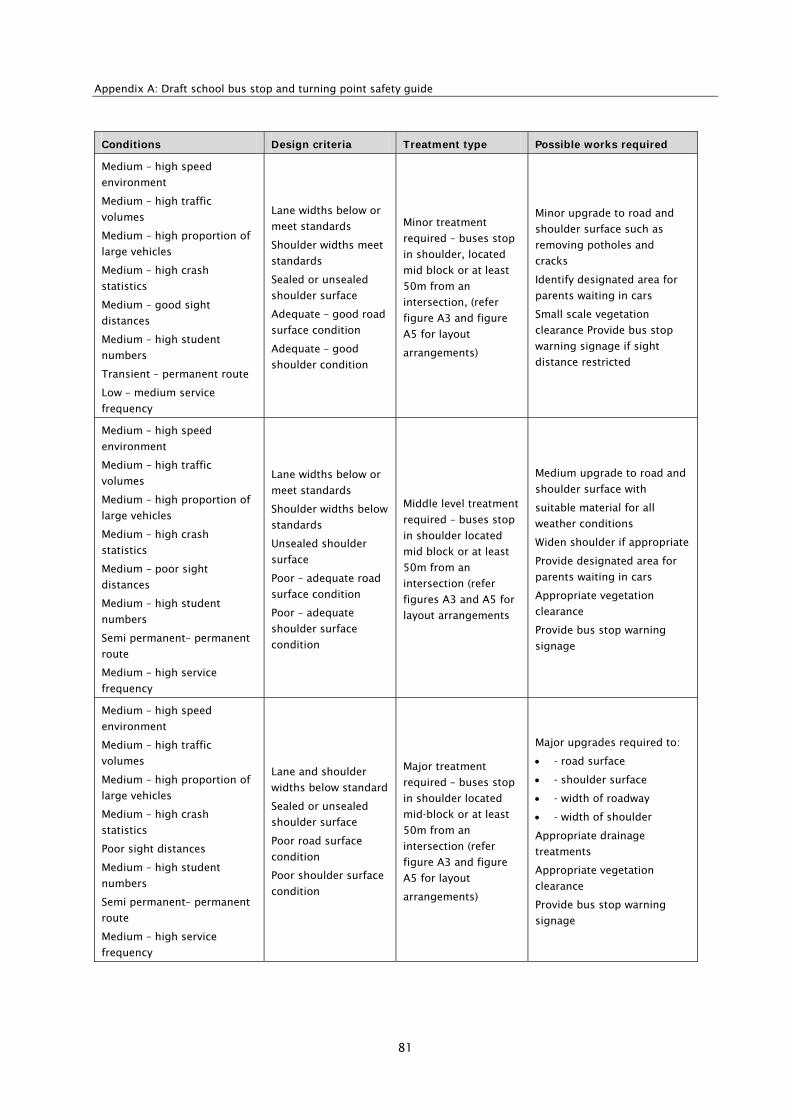
Appendix A: Draft school bus stop and turning point safety guide
81
Conditions Design criteria Treatment type Possible works required
Medium – high speed
environment
Medium – high traffic
volumes
Medium – high proportion of
large vehicles
Medium – high crash
statistics
Medium – good sight
distances
Medium – high student
numbers
Transient – permanent route
Low – medium service
frequency
Lane widths below or
meet standards
Shoulder widths meet
standards
Sealed or unsealed
shoulder surface
Adequate – good road
surface condition
Adequate – good
shoulder condition
Minor treatment
required – buses stop
in shoulder, located
mid block or at least
50m from an
intersection, (refer
figure A3 and figure
A5 for layout
arrangements)
Minor upgrade to road and
shoulder surface such as
removing potholes and
cracks
Identify designated area for
parents waiting in cars
Small scale vegetation
clearance Provide bus stop
warning signage if sight
distance restricted
Medium – high speed
environment
Medium – high traffic
volumes
Medium – high proportion of
large vehicles
Medium – high crash
statistics
Medium – poor sight
distances
Medium – high student
numbers
Semi permanent– permanent
route
Medium – high service
frequency
Lane widths below or
meet standards
Shoulder widths below
standards
Unsealed shoulder
surface
Poor – adequate road
surface condition
Poor – adequate
shoulder surface
condition
Middle level treatment
required – buses stop
in shoulder located
mid block or at least
50m from an
intersection (refer
figures A3 and A5 for
layout arrangements
Medium upgrade to road and
shoulder surface with
suitable material for all
weather conditions
Widen shoulder if appropriate
Provide designated area for
parents waiting in cars
Appropriate vegetation
clearance
Provide bus stop warning
signage
Medium – high speed
environment
Medium – high traffic
volumes
Medium – high proportion of
large vehicles
Medium – high crash
statistics
Poor sight distances
Medium – high student
numbers
Semi permanent– permanent
route
Medium – high service
frequency
Lane and shoulder
widths below standard
Sealed or unsealed
shoulder surface
Poor road surface
condition
Poor shoulder surface
condition
Major treatment
required – buses stop
in shoulder located
mid-block or at least
50m from an
intersection (refer
figure A3 and figure
A5 for layout
arrangements)
Major upgrades required to:
- road surface
- shoulder surface
- width of roadway
- width of shoulder
Appropriate drainage
treatments
Appropriate vegetation
clearance
Provide bus stop warning
signage
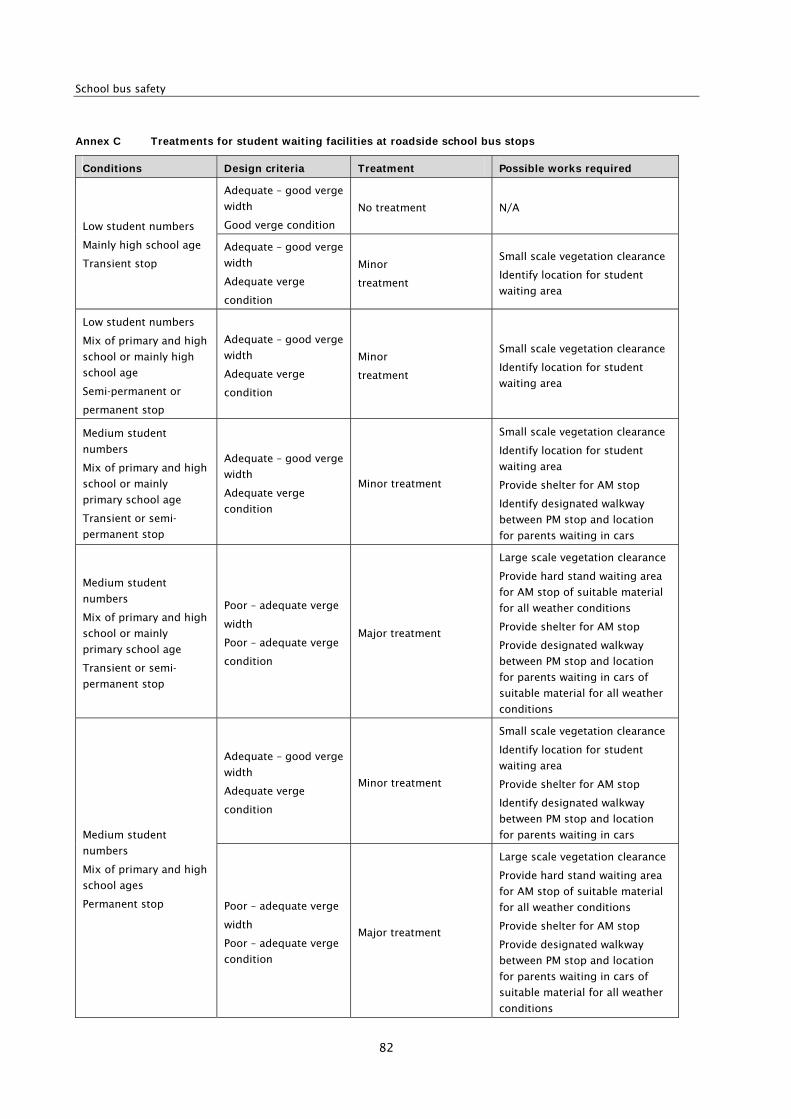
School bus safety
82
Annex C Treatments for student waiting facilities at roadside school bus stops
Conditions Design criteria Treatment Possible works required
Adequate – good verge
width
Good verge condition
No treatment N/A
Low student numbers
Mainly high school age
Transient stop
Adequate – good verge
width
Adequate verge
condition
Minor
treatment
Small scale vegetation clearance
Identify location for student
waiting area
Low student numbers
Mix of primary and high
school or mainly high
school age
Semi-permanent or
permanent stop
Adequate – good verge
width
Adequate verge
condition
Minor
treatment
Small scale vegetation clearance
Identify location for student
waiting area
Medium student
numbers
Mix of primary and high
school or mainly
primary school age
Transient or semi-
permanent stop
Adequate – good verge
width
Adequate verge
condition
Minor treatment
Small scale vegetation clearance
Identify location for student
waiting area
Provide shelter for AM stop
Identify designated walkway
between PM stop and location
for parents waiting in cars
Medium student
numbers
Mix of primary and high
school or mainly
primary school age
Transient or semi-
permanent stop
Poor – adequate verge
width
Poor – adequate verge
condition
Major treatment
Large scale vegetation clearance
Provide hard stand waiting area
for AM stop of suitable material
for all weather conditions
Provide shelter for AM stop
Provide designated walkway
between PM stop and location
for parents waiting in cars of
suitable material for all weather
conditions
Adequate – good verge
width
Adequate verge
condition
Minor treatment
Small scale vegetation clearance
Identify location for student
waiting area
Provide shelter for AM stop
Identify designated walkway
between PM stop and location
for parents waiting in cars Medium student
numbers
Mix of primary and high
school ages
Permanent stop Poor – adequate verge
width
Poor – adequate verge
condition
Major treatment
Large scale vegetation clearance
Provide hard stand waiting area
for AM stop of suitable material
for all weather conditions
Provide shelter for AM stop
Provide designated walkway
between PM stop and location
for parents waiting in cars of
suitable material for all weather
conditions
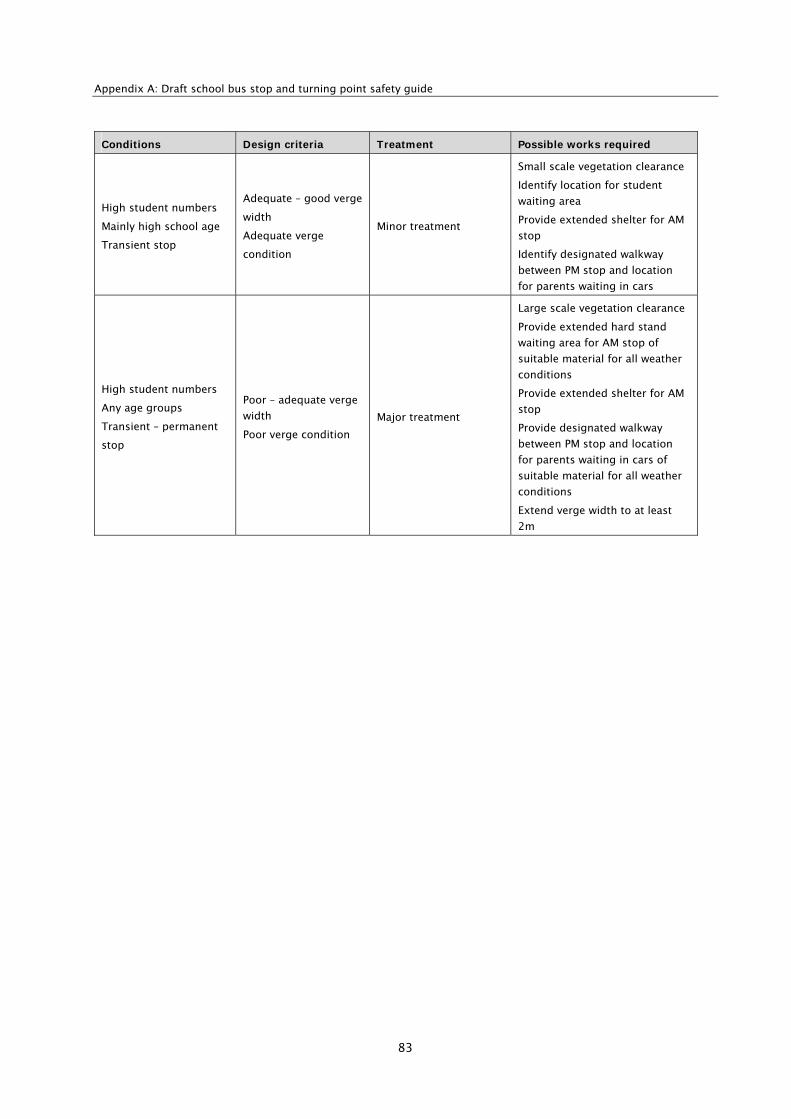
Appendix A: Draft school bus stop and turning point safety guide
83
Conditions Design criteria Treatment Possible works required
High student numbers
Mainly high school age
Transient stop
Adequate – good verge
width
Adequate verge
condition
Minor treatment
Small scale vegetation clearance
Identify location for student
waiting area
Provide extended shelter for AM
stop
Identify designated walkway
between PM stop and location
for parents waiting in cars
High student numbers
Any age groups
Transient – permanent
stop
Poor – adequate verge
width
Poor verge condition
Major treatment
Large scale vegetation clearance
Provide extended hard stand
waiting area for AM stop of
suitable material for all weather
conditions
Provide extended shelter for AM
stop
Provide designated walkway
between PM stop and location
for parents waiting in cars of
suitable material for all weather
conditions
Extend verge width to at least
2m
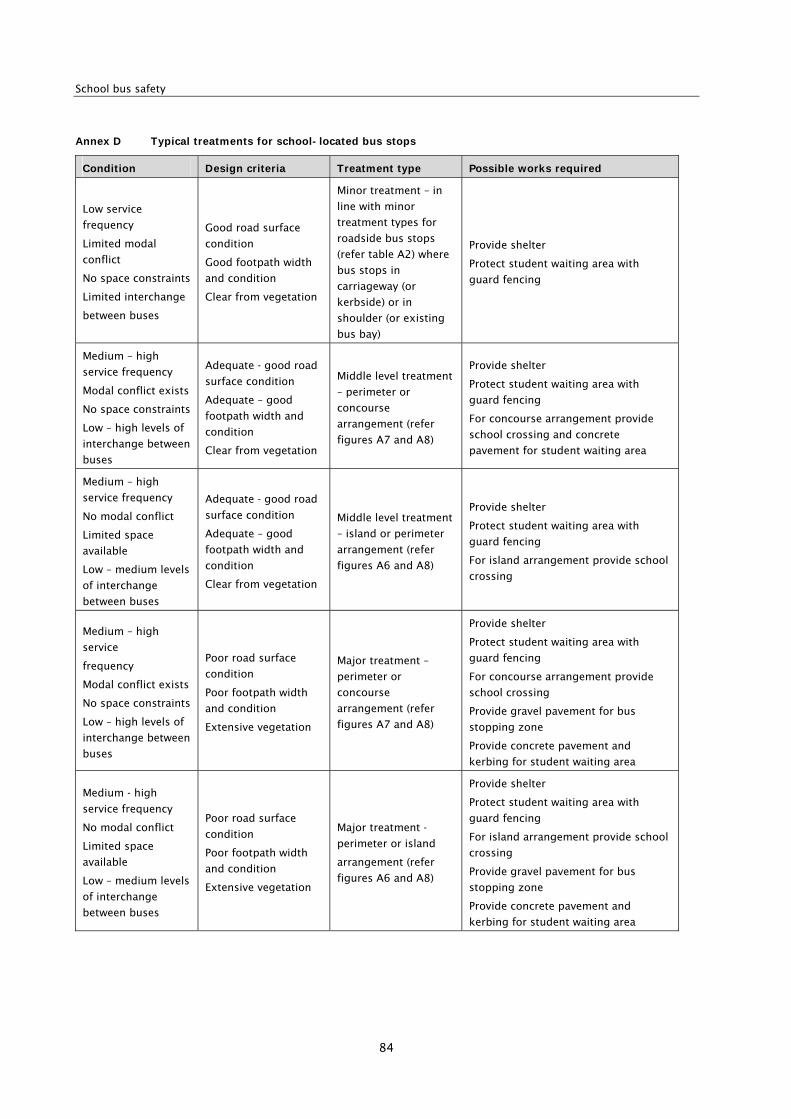
School bus safety
84
Annex D Typical treatments for school-located bus stops
Condition Design criteria Treatment type Possible works required
Low service
frequency
Limited modal
conflict
No space constraints
Limited interchange
between buses
Good road surface
condition
Good footpath width
and condition
Clear from vegetation
Minor treatment – in
line with minor
treatment types for
roadside bus stops
(refer table A2) where
bus stops in
carriageway (or
kerbside) or in
shoulder (or existing
bus bay)
Provide shelter
Protect student waiting area with
guard fencing
Medium – high
service frequency
Modal conflict exists
No space constraints
Low – high levels of
interchange between
buses
Adequate - good road
surface condition
Adequate – good
footpath width and
condition
Clear from vegetation
Middle level treatment
– perimeter or
concourse
arrangement (refer
figures A7 and A8)
Provide shelter
Protect student waiting area with
guard fencing
For concourse arrangement provide
school crossing and concrete
pavement for student waiting area
Medium – high
service frequency
No modal conflict
Limited space
available
Low – medium levels
of interchange
between buses
Adequate - good road
surface condition
Adequate – good
footpath width and
condition
Clear from vegetation
Middle level treatment
– island or perimeter
arrangement (refer
figures A6 and A8)
Provide shelter
Protect student waiting area with
guard fencing
For island arrangement provide school
crossing
Medium – high
service
frequency
Modal conflict exists
No space constraints
Low – high levels of
interchange between
buses
Poor road surface
condition
Poor footpath width
and condition
Extensive vegetation
Major treatment –
perimeter or
concourse
arrangement (refer
figures A7 and A8)
Provide shelter
Protect student waiting area with
guard fencing
For concourse arrangement provide
school crossing
Provide gravel pavement for bus
stopping zone
Provide concrete pavement and
kerbing for student waiting area
Medium - high
service frequency
No modal conflict
Limited space
available
Low – medium levels
of interchange
between buses
Poor road surface
condition
Poor footpath width
and condition
Extensive vegetation
Major treatment -
perimeter or island
arrangement (refer
figures A6 and A8)
Provide shelter
Protect student waiting area with
guard fencing
For island arrangement provide school
crossing
Provide gravel pavement for bus
stopping zone
Provide concrete pavement and
kerbing for student waiting area
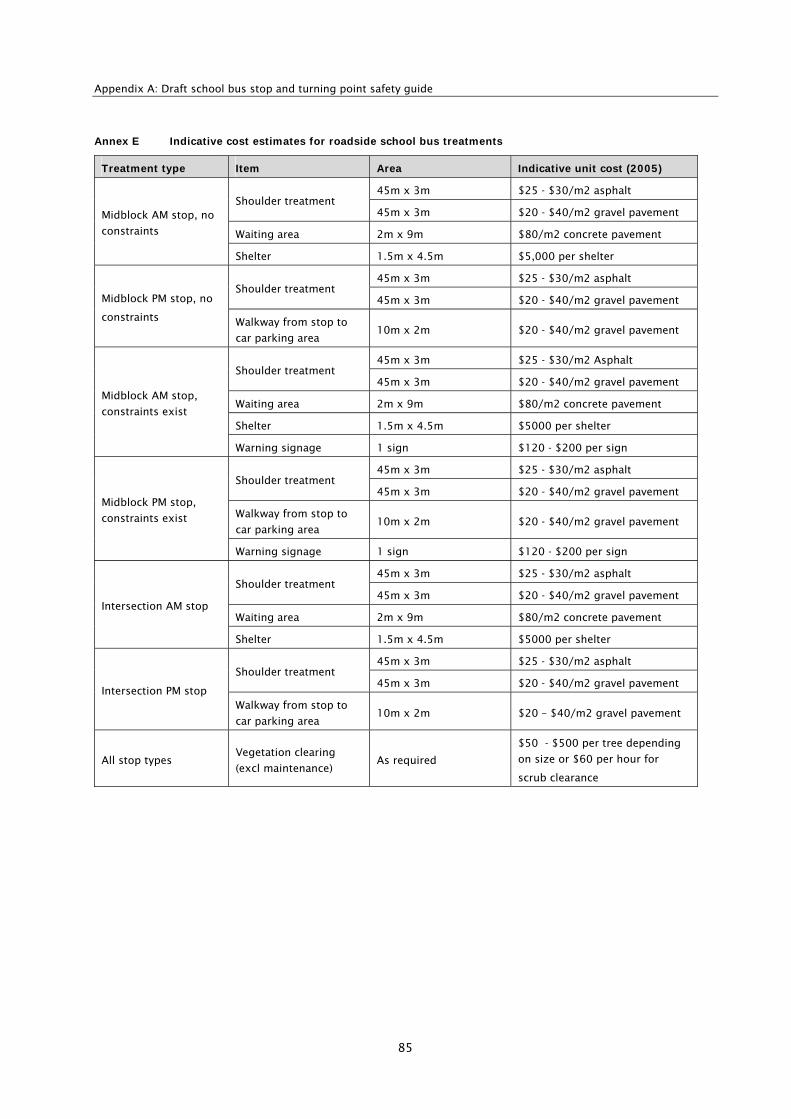
Appendix A: Draft school bus stop and turning point safety guide
85
Annex E Indicative cost estimates for roadside school bus treatments
Treatment type Item Area Indicative unit cost (2005)
45m x 3m $25 - $30/m2 asphalt Shoulder treatment
45m x 3m $20 - $40/m2 gravel pavement
Waiting area 2m x 9m $80/m2 concrete pavement
Midblock AM stop, no
constraints
Shelter 1.5m x 4.5m $5,000 per shelter
45m x 3m $25 - $30/m2 asphalt Shoulder treatment
45m x 3m $20 - $40/m2 gravel pavement Midblock PM stop, no
constraints Walkway from stop to
car parking area 10m x 2m $20 - $40/m2 gravel pavement
45m x 3m $25 - $30/m2 Asphalt Shoulder treatment
45m x 3m $20 - $40/m2 gravel pavement
Waiting area 2m x 9m $80/m2 concrete pavement
Shelter 1.5m x 4.5m $5000 per shelter
Midblock AM stop,
constraints exist
Warning signage 1 sign $120 - $200 per sign
45m x 3m $25 - $30/m2 asphalt Shoulder treatment
45m x 3m $20 - $40/m2 gravel pavement
Walkway from stop to
car parking area 10m x 2m $20 - $40/m2 gravel pavement
Midblock PM stop,
constraints exist
Warning signage 1 sign $120 - $200 per sign
45m x 3m $25 - $30/m2 asphalt Shoulder treatment
45m x 3m $20 - $40/m2 gravel pavement
Waiting area 2m x 9m $80/m2 concrete pavement Intersection AM stop
Shelter 1.5m x 4.5m $5000 per shelter
45m x 3m $25 - $30/m2 asphalt Shoulder treatment
45m x 3m $20 - $40/m2 gravel pavement Intersection PM stop
Walkway from stop to
car parking area 10m x 2m $20 – $40/m2 gravel pavement
All stop types Vegetation clearing
(excl maintenance) As required
$50 - $500 per tree depending
on size or $60 per hour for
scrub clearance
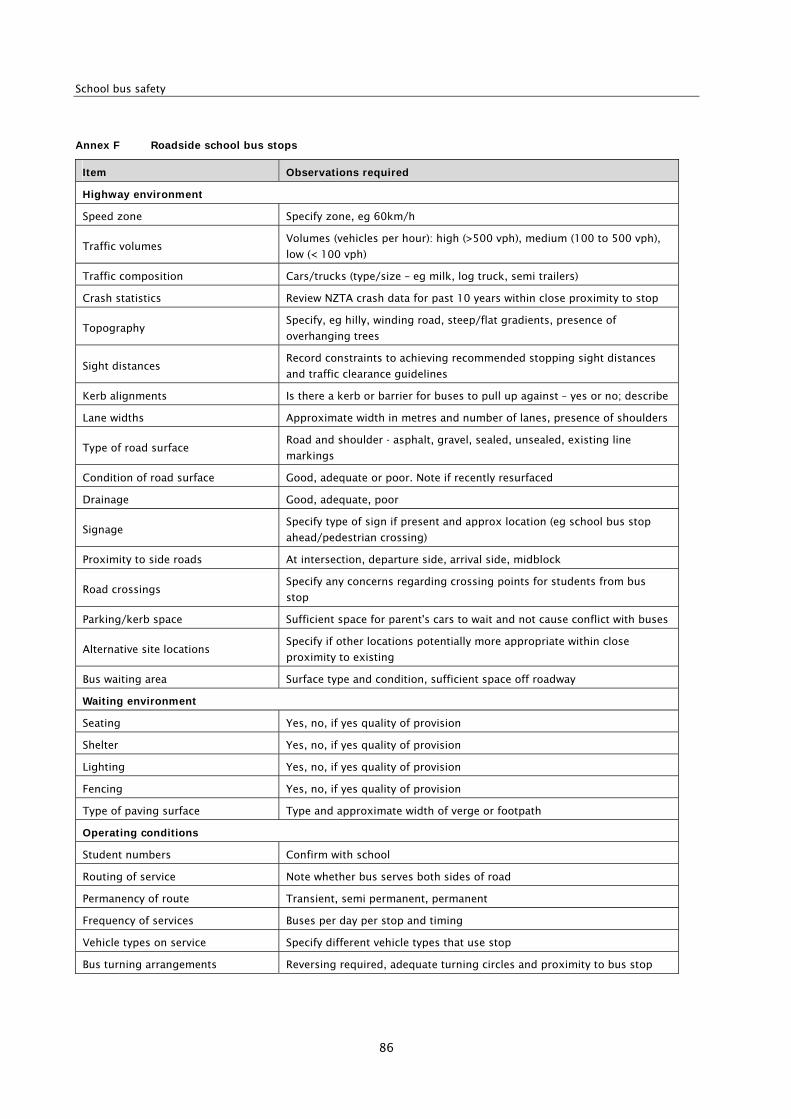
School bus safety
86
Annex F Roadside school bus stops
Item Observations required
Highway environment
Speed zone Specify zone, eg 60km/h
Traffic volumes Volumes (vehicles per hour): high (>500 vph), medium (100 to 500 vph),
low (< 100 vph)
Traffic composition Cars/trucks (type/size – eg milk, log truck, semi trailers)
Crash statistics Review NZTA crash data for past 10 years within close proximity to stop
Topography Specify, eg hilly, winding road, steep/flat gradients, presence of
overhanging trees
Sight distances Record constraints to achieving recommended stopping sight distances
and traffic clearance guidelines
Kerb alignments Is there a kerb or barrier for buses to pull up against – yes or no; describe
Lane widths Approximate width in metres and number of lanes, presence of shoulders
Type of road surface Road and shoulder - asphalt, gravel, sealed, unsealed, existing line
markings
Condition of road surface Good, adequate or poor. Note if recently resurfaced
Drainage Good, adequate, poor
Signage Specify type of sign if present and approx location (eg school bus stop
ahead/pedestrian crossing)
Proximity to side roads At intersection, departure side, arrival side, midblock
Road crossings Specify any concerns regarding crossing points for students from bus
stop
Parking/kerb space Sufficient space for parent's cars to wait and not cause conflict with buses
Alternative site locations Specify if other locations potentially more appropriate within close
proximity to existing
Bus waiting area Surface type and condition, sufficient space off roadway
Waiting environment
Seating Yes, no, if yes quality of provision
Shelter Yes, no, if yes quality of provision
Lighting Yes, no, if yes quality of provision
Fencing Yes, no, if yes quality of provision
Type of paving surface Type and approximate width of verge or footpath
Operating conditions
Student numbers Confirm with school
Routing of service Note whether bus serves both sides of road
Permanency of route Transient, semi permanent, permanent
Frequency of services Buses per day per stop and timing
Vehicle types on service Specify different vehicle types that use stop
Bus turning arrangements Reversing required, adequate turning circles and proximity to bus stop
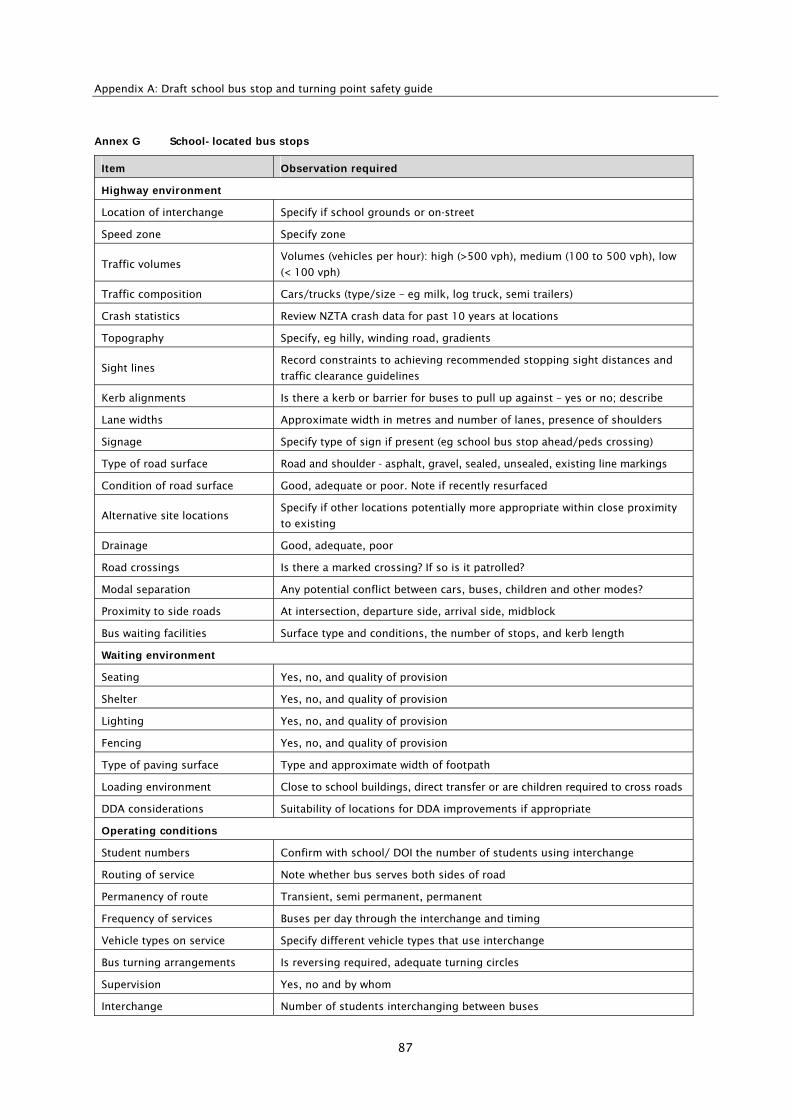
Appendix A: Draft school bus stop and turning point safety guide
87
Annex G School-located bus stops
Item Observation required
Highway environment
Location of interchange Specify if school grounds or on-street
Speed zone Specify zone
Traffic volumes Volumes (vehicles per hour): high (>500 vph), medium (100 to 500 vph), low
(< 100 vph)
Traffic composition Cars/trucks (type/size – eg milk, log truck, semi trailers)
Crash statistics Review NZTA crash data for past 10 years at locations
Topography Specify, eg hilly, winding road, gradients
Sight lines Record constraints to achieving recommended stopping sight distances and
traffic clearance guidelines
Kerb alignments Is there a kerb or barrier for buses to pull up against – yes or no; describe
Lane widths Approximate width in metres and number of lanes, presence of shoulders
Signage Specify type of sign if present (eg school bus stop ahead/peds crossing)
Type of road surface Road and shoulder - asphalt, gravel, sealed, unsealed, existing line markings
Condition of road surface Good, adequate or poor. Note if recently resurfaced
Alternative site locations Specify if other locations potentially more appropriate within close proximity
to existing
Drainage Good, adequate, poor
Road crossings Is there a marked crossing? If so is it patrolled?
Modal separation Any potential conflict between cars, buses, children and other modes?
Proximity to side roads At intersection, departure side, arrival side, midblock
Bus waiting facilities Surface type and conditions, the number of stops, and kerb length
Waiting environment
Seating Yes, no, and quality of provision
Shelter Yes, no, and quality of provision
Lighting Yes, no, and quality of provision
Fencing Yes, no, and quality of provision
Type of paving surface Type and approximate width of footpath
Loading environment Close to school buildings, direct transfer or are children required to cross roads
DDA considerations Suitability of locations for DDA improvements if appropriate
Operating conditions
Student numbers Confirm with school/ DOI the number of students using interchange
Routing of service Note whether bus serves both sides of road
Permanency of route Transient, semi permanent, permanent
Frequency of services Buses per day through the interchange and timing
Vehicle types on service Specify different vehicle types that use interchange
Bus turning arrangements Is reversing required, adequate turning circles
Supervision Yes, no and by whom
Interchange Number of students interchanging between buses

School bus safety
88
Annex H Case studies (to be completed when final guide produced)
Annex I Signage for school bus stops (to be completed when final guide produced)
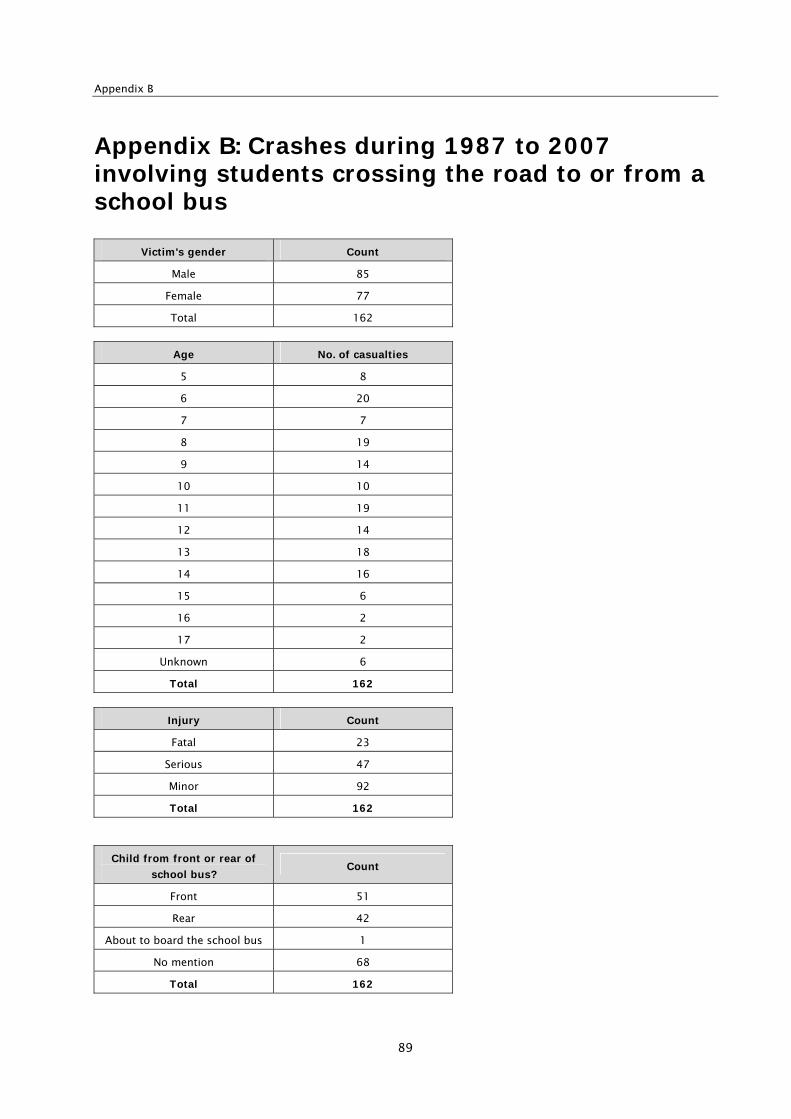
Appendix B
89
Appendix B: Crashes during 1987 to 2007 involving students crossing the road to or from a school bus
Victim's gender Count
Male 85
Female 77
Total 162
Age No. of casualties
5 8
6 20
7 7
8 19
9 14
10 10
11 19
12 14
13 18
14 16
15 6
16 2
17 2
Unknown 6
Total 162
Injury Count
Fatal 23
Serious 47
Minor 92
Total 162
Child from front or rear of
school bus? Count
Front 51
Rear 42
About to board the school bus 1
No mention 68
Total 162
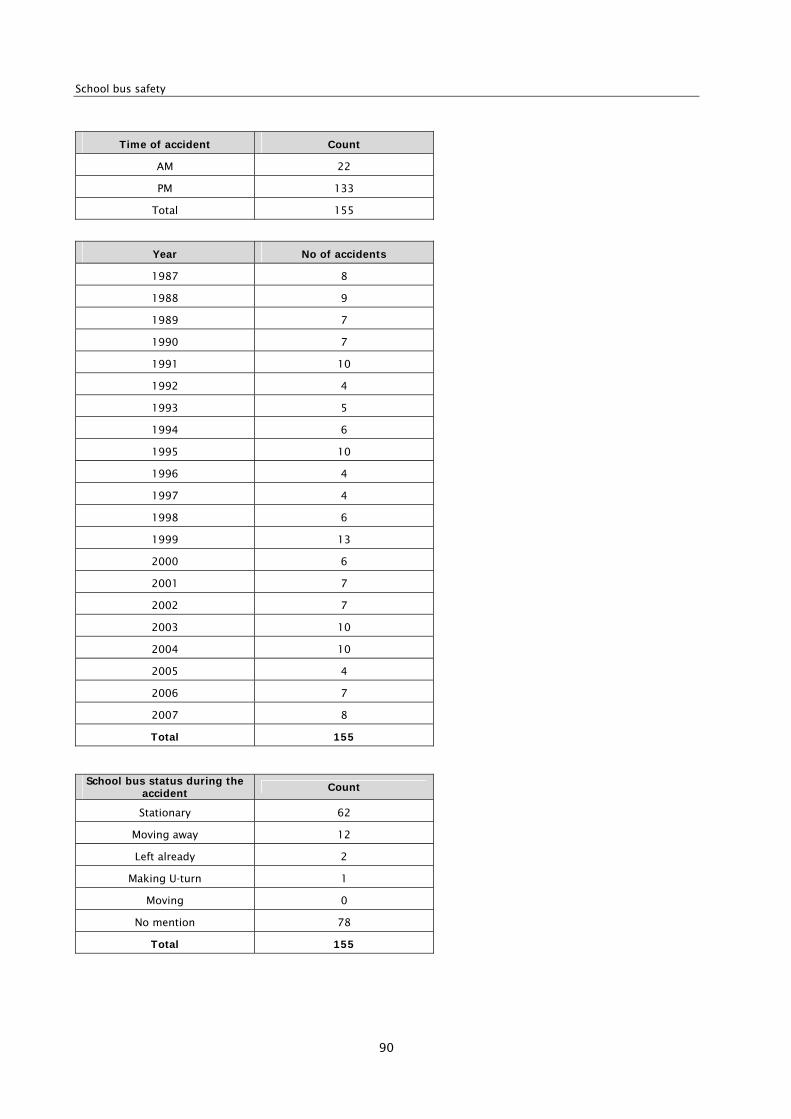
School bus safety
90
Time of accident Count
AM 22
PM 133
Total 155
Year No of accidents
1987 8
1988 9
1989 7
1990 7
1991 10
1992 4
1993 5
1994 6
1995 10
1996 4
1997 4
1998 6
1999 13
2000 6
2001 7
2002 7
2003 10
2004 10
2005 4
2006 7
2007 8
Total 155
School bus status during the accident Count
Stationary 62
Moving away 12
Left already 2
Making U-turn 1
Moving 0
No mention 78
Total 155
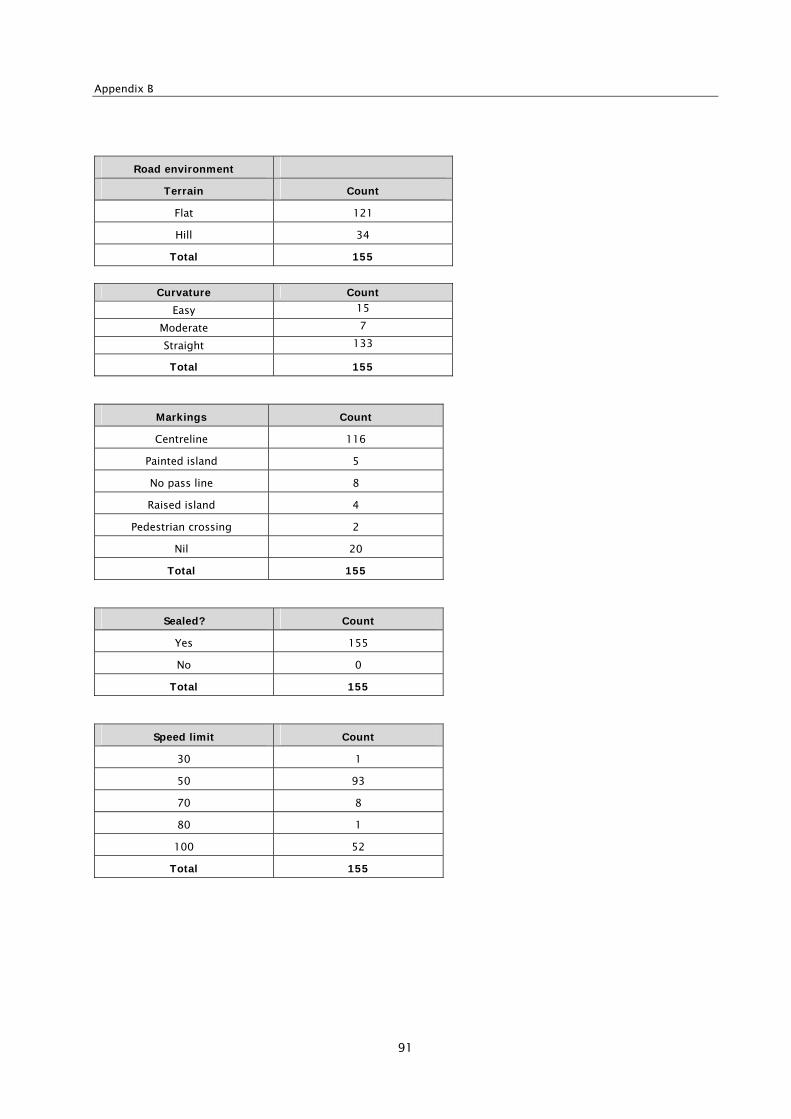
Appendix B
91
Road environment
Terrain Count
Flat 121
Hill 34
Total 155
Curvature Count
Easy 15
Moderate 7
Straight 133
Total 155
Markings Count
Centreline 116
Painted island 5
No pass line 8
Raised island 4
Pedestrian crossing 2
Nil 20
Total 155
Sealed? Count
Yes 155
No 0
Total 155
Speed limit Count
30 1
50 93
70 8
80 1
100 52
Total 155
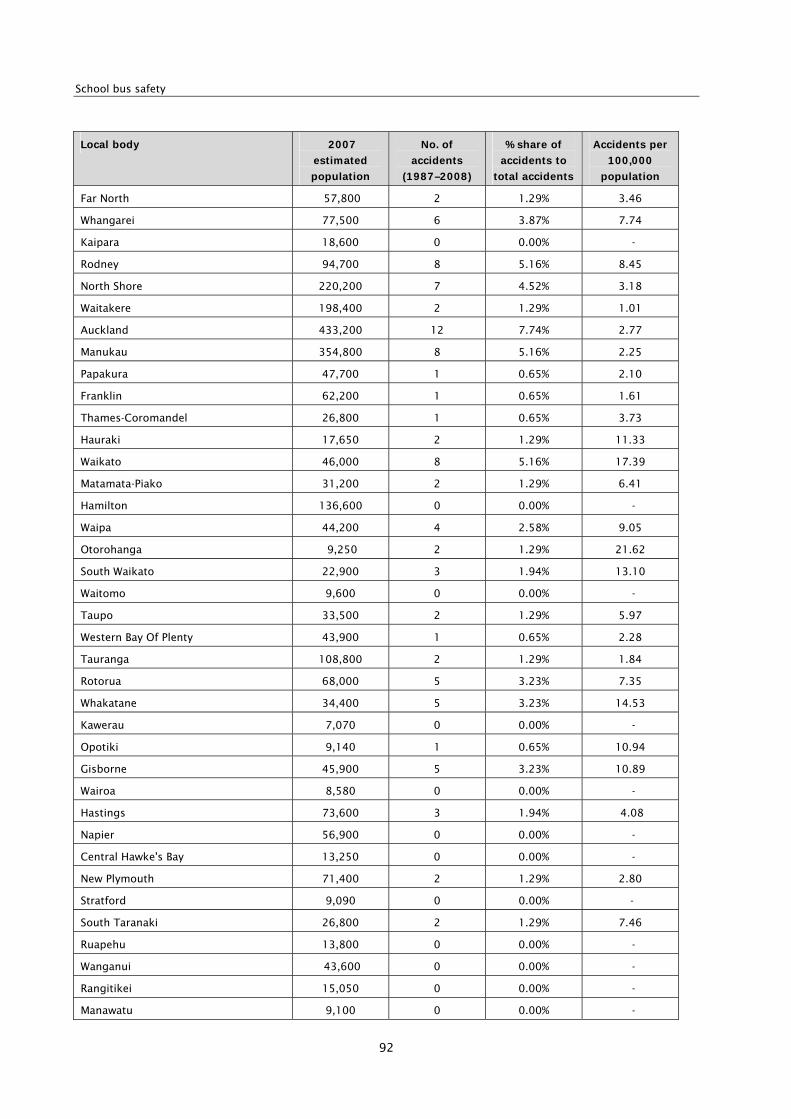
School bus safety
92
Local body 2007
estimated
population
No. of
accidents
(1987–2008)
% share of
accidents to
total accidents
Accidents per
100,000
population
Far North 57,800 2 1.29% 3.46
Whangarei 77,500 6 3.87% 7.74
Kaipara 18,600 0 0.00% -
Rodney 94,700 8 5.16% 8.45
North Shore 220,200 7 4.52% 3.18
Waitakere 198,400 2 1.29% 1.01
Auckland 433,200 12 7.74% 2.77
Manukau 354,800 8 5.16% 2.25
Papakura 47,700 1 0.65% 2.10
Franklin 62,200 1 0.65% 1.61
Thames-Coromandel 26,800 1 0.65% 3.73
Hauraki 17,650 2 1.29% 11.33
Waikato 46,000 8 5.16% 17.39
Matamata-Piako 31,200 2 1.29% 6.41
Hamilton 136,600 0 0.00% -
Waipa 44,200 4 2.58% 9.05
Otorohanga 9,250 2 1.29% 21.62
South Waikato 22,900 3 1.94% 13.10
Waitomo 9,600 0 0.00% -
Taupo 33,500 2 1.29% 5.97
Western Bay Of Plenty 43,900 1 0.65% 2.28
Tauranga 108,800 2 1.29% 1.84
Rotorua 68,000 5 3.23% 7.35
Whakatane 34,400 5 3.23% 14.53
Kawerau 7,070 0 0.00% -
Opotiki 9,140 1 0.65% 10.94
Gisborne 45,900 5 3.23% 10.89
Wairoa 8,580 0 0.00% -
Hastings 73,600 3 1.94% 4.08
Napier 56,900 0 0.00% -
Central Hawke's Bay 13,250 0 0.00% -
New Plymouth 71,400 2 1.29% 2.80
Stratford 9,090 0 0.00% -
South Taranaki 26,800 2 1.29% 7.46
Ruapehu 13,800 0 0.00% -
Wanganui 43,600 0 0.00% -
Rangitikei 15,050 0 0.00% -
Manawatu 9,100 0 0.00% -
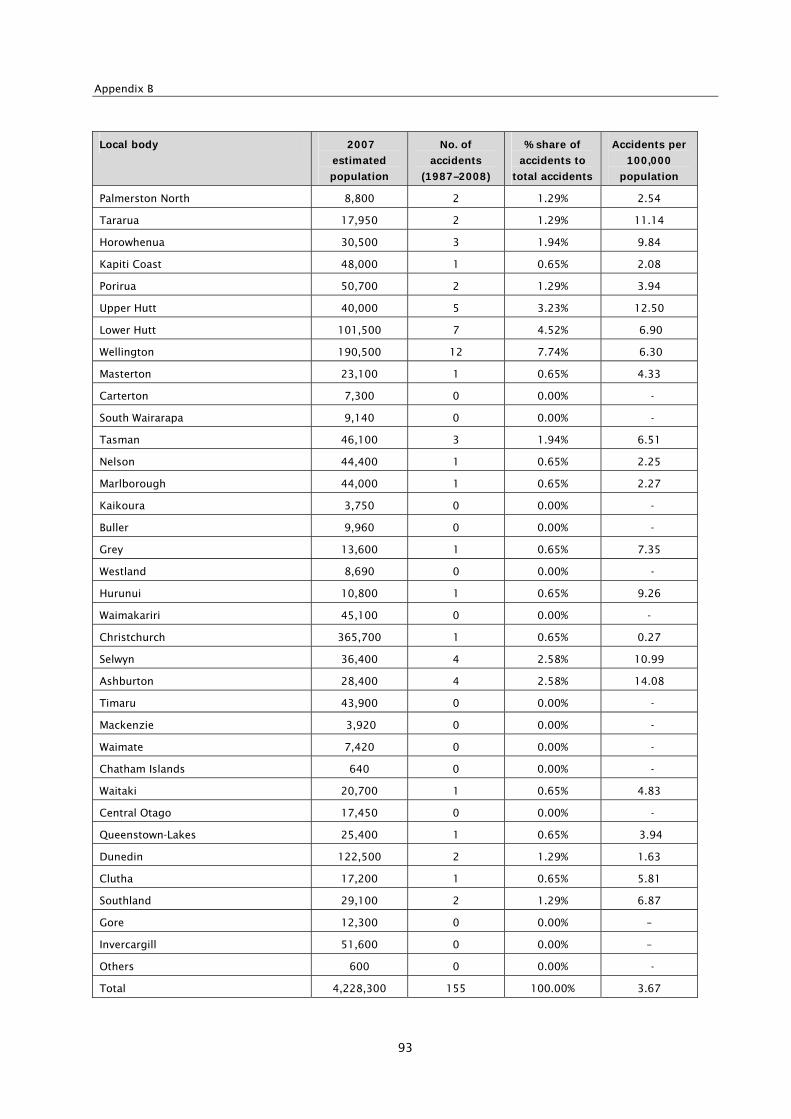
Appendix B
93
Local body 2007
estimated
population
No. of
accidents
(1987–2008)
% share of
accidents to
total accidents
Accidents per
100,000
population
Palmerston North 8,800 2 1.29% 2.54
Tararua 17,950 2 1.29% 11.14
Horowhenua 30,500 3 1.94% 9.84
Kapiti Coast 48,000 1 0.65% 2.08
Porirua 50,700 2 1.29% 3.94
Upper Hutt 40,000 5 3.23% 12.50
Lower Hutt 101,500 7 4.52% 6.90
Wellington 190,500 12 7.74% 6.30
Masterton 23,100 1 0.65% 4.33
Carterton 7,300 0 0.00% -
South Wairarapa 9,140 0 0.00% -
Tasman 46,100 3 1.94% 6.51
Nelson 44,400 1 0.65% 2.25
Marlborough 44,000 1 0.65% 2.27
Kaikoura 3,750 0 0.00% -
Buller 9,960 0 0.00% -
Grey 13,600 1 0.65% 7.35
Westland 8,690 0 0.00% -
Hurunui 10,800 1 0.65% 9.26
Waimakariri 45,100 0 0.00% -
Christchurch 365,700 1 0.65% 0.27
Selwyn 36,400 4 2.58% 10.99
Ashburton 28,400 4 2.58% 14.08
Timaru 43,900 0 0.00% -
Mackenzie 3,920 0 0.00% -
Waimate 7,420 0 0.00% -
Chatham Islands 640 0 0.00% -
Waitaki 20,700 1 0.65% 4.83
Central Otago 17,450 0 0.00% -
Queenstown-Lakes 25,400 1 0.65% 3.94
Dunedin 122,500 2 1.29% 1.63
Clutha 17,200 1 0.65% 5.81
Southland 29,100 2 1.29% 6.87
Gore 12,300 0 0.00% –
Invercargill 51,600 0 0.00% –
Others 600 0 0.00% -
Total 4,228,300 155 100.00% 3.67
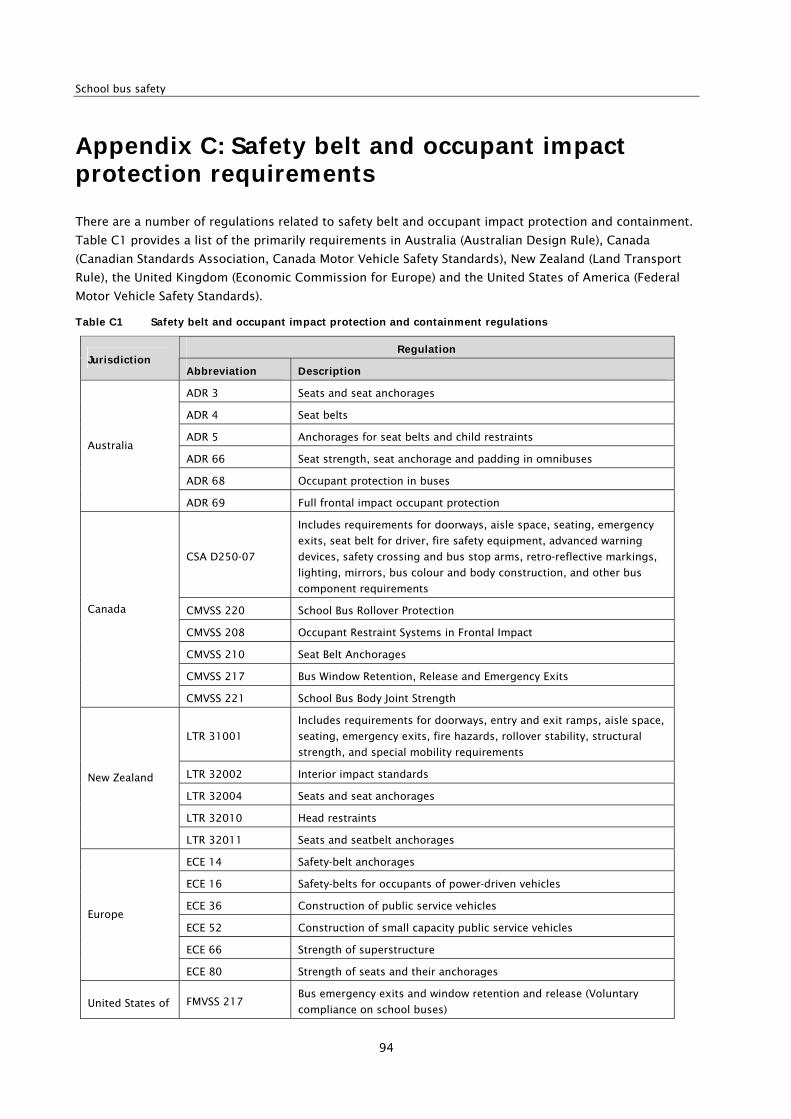
School bus safety
94
Appendix C: Safety belt and occupant impact protection requirements
There are a number of regulations related to safety belt and occupant impact protection and containment.
Table C1 provides a list of the primarily requirements in Australia (Australian Design Rule), Canada
(Canadian Standards Association, Canada Motor Vehicle Safety Standards), New Zealand (Land Transport
Rule), the United Kingdom (Economic Commission for Europe) and the United States of America (Federal
Motor Vehicle Safety Standards).
Table C1 Safety belt and occupant impact protection and containment regulations
Regulation Jurisdiction
Abbreviation Description
ADR 3 Seats and seat anchorages
ADR 4 Seat belts
ADR 5 Anchorages for seat belts and child restraints
ADR 66 Seat strength, seat anchorage and padding in omnibuses
ADR 68 Occupant protection in buses
Australia
ADR 69 Full frontal impact occupant protection
CSA D250-07
Includes requirements for doorways, aisle space, seating, emergency
exits, seat belt for driver, fire safety equipment, advanced warning
devices, safety crossing and bus stop arms, retro-reflective markings,
lighting, mirrors, bus colour and body construction, and other bus
component requirements
CMVSS 220 School Bus Rollover Protection
CMVSS 208 Occupant Restraint Systems in Frontal Impact
CMVSS 210 Seat Belt Anchorages
CMVSS 217 Bus Window Retention, Release and Emergency Exits
Canada
CMVSS 221 School Bus Body Joint Strength
LTR 31001
Includes requirements for doorways, entry and exit ramps, aisle space,
seating, emergency exits, fire hazards, rollover stability, structural
strength, and special mobility requirements
LTR 32002 Interior impact standards
LTR 32004 Seats and seat anchorages
LTR 32010 Head restraints
New Zealand
LTR 32011 Seats and seatbelt anchorages
ECE 14 Safety-belt anchorages
ECE 16 Safety-belts for occupants of power-driven vehicles
ECE 36 Construction of public service vehicles
ECE 52 Construction of small capacity public service vehicles
ECE 66 Strength of superstructure
Europe
ECE 80 Strength of seats and their anchorages
United States of FMVSS 217 Bus emergency exits and window retention and release (Voluntary
compliance on school buses)
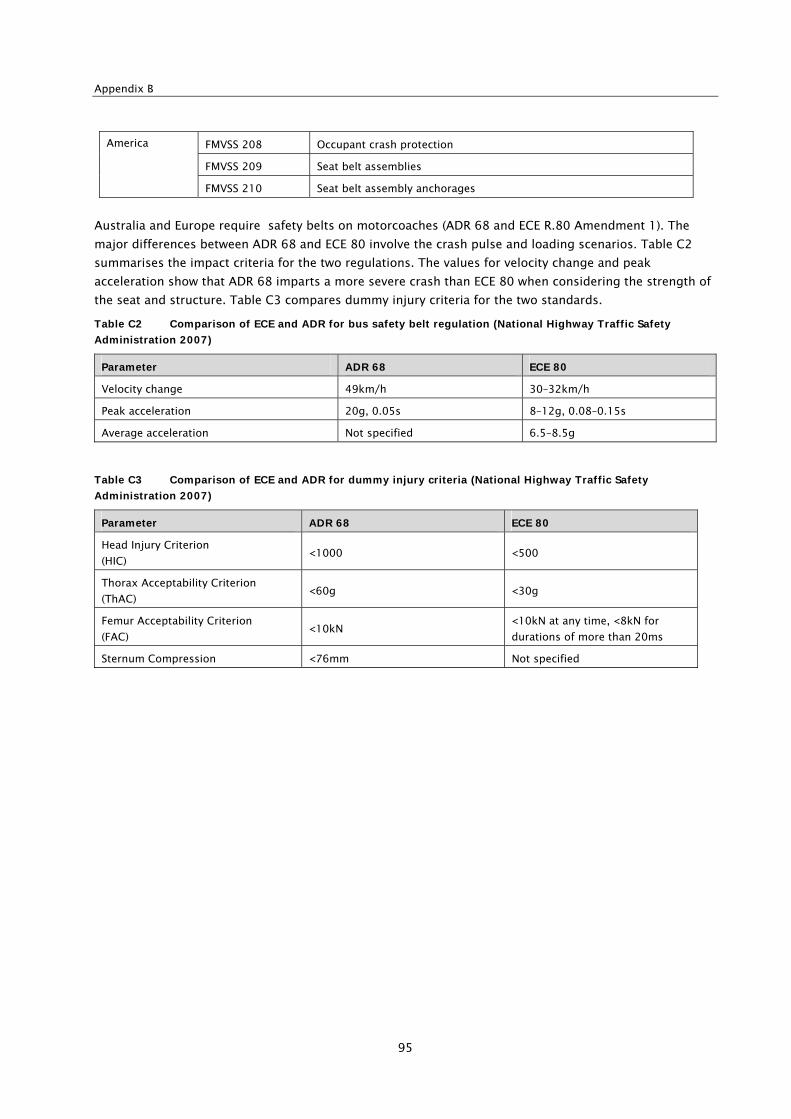
Appendix B
95
FMVSS 208 Occupant crash protection
FMVSS 209 Seat belt assemblies
America
FMVSS 210 Seat belt assembly anchorages
Australia and Europe require safety belts on motorcoaches (ADR 68 and ECE R.80 Amendment 1). The
major differences between ADR 68 and ECE 80 involve the crash pulse and loading scenarios. Table C2
summarises the impact criteria for the two regulations. The values for velocity change and peak
acceleration show that ADR 68 imparts a more severe crash than ECE 80 when considering the strength of
the seat and structure. Table C3 compares dummy injury criteria for the two standards.
Table C2 Comparison of ECE and ADR for bus safety belt regulation (National Highway Traffic Safety
Administration 2007)
Parameter ADR 68 ECE 80
Velocity change 49km/h 30–32km/h
Peak acceleration 20g, 0.05s 8–12g, 0.08–0.15s
Average acceleration Not specified 6.5–8.5g
Table C3 Comparison of ECE and ADR for dummy injury criteria (National Highway Traffic Safety
Administration 2007)
Parameter ADR 68 ECE 80
Head Injury Criterion
(HIC) <1000 <500
Thorax Acceptability Criterion
(ThAC) <60g <30g
Femur Acceptability Criterion
(FAC) <10kN
<10kN at any time, <8kN for
durations of more than 20ms
Sternum Compression <76mm Not specified
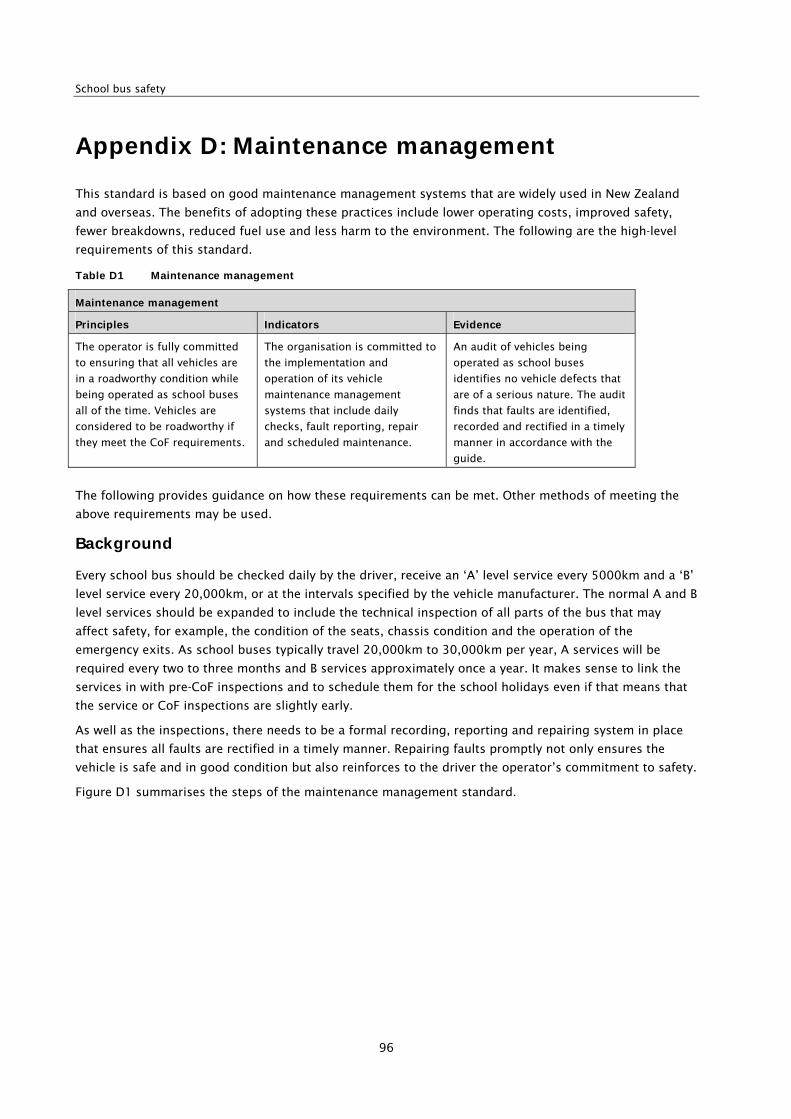
School bus safety
96
Appendix D: Maintenance management
This standard is based on good maintenance management systems that are widely used in New Zealand
and overseas. The benefits of adopting these practices include lower operating costs, improved safety,
fewer breakdowns, reduced fuel use and less harm to the environment. The following are the high-level
requirements of this standard.
Table D1 Maintenance management
Maintenance management
Principles Indicators Evidence
The operator is fully committed
to ensuring that all vehicles are
in a roadworthy condition while
being operated as school buses
all of the time. Vehicles are
considered to be roadworthy if
they meet the CoF requirements.
The organisation is committed to
the implementation and
operation of its vehicle
maintenance management
systems that include daily
checks, fault reporting, repair
and scheduled maintenance.
An audit of vehicles being
operated as school buses
identifies no vehicle defects that
are of a serious nature. The audit
finds that faults are identified,
recorded and rectified in a timely
manner in accordance with the
guide.
The following provides guidance on how these requirements can be met. Other methods of meeting the
above requirements may be used.
Background
Every school bus should be checked daily by the driver, receive an ‘A’ level service every 5000km and a ‘B’
level service every 20,000km, or at the intervals specified by the vehicle manufacturer. The normal A and B
level services should be expanded to include the technical inspection of all parts of the bus that may
affect safety, for example, the condition of the seats, chassis condition and the operation of the
emergency exits. As school buses typically travel 20,000km to 30,000km per year, A services will be
required every two to three months and B services approximately once a year. It makes sense to link the
services in with pre-CoF inspections and to schedule them for the school holidays even if that means that
the service or CoF inspections are slightly early.
As well as the inspections, there needs to be a formal recording, reporting and repairing system in place
that ensures all faults are rectified in a timely manner. Repairing faults promptly not only ensures the
vehicle is safe and in good condition but also reinforces to the driver the operator’s commitment to safety.
Figure D1 summarises the steps of the maintenance management standard.
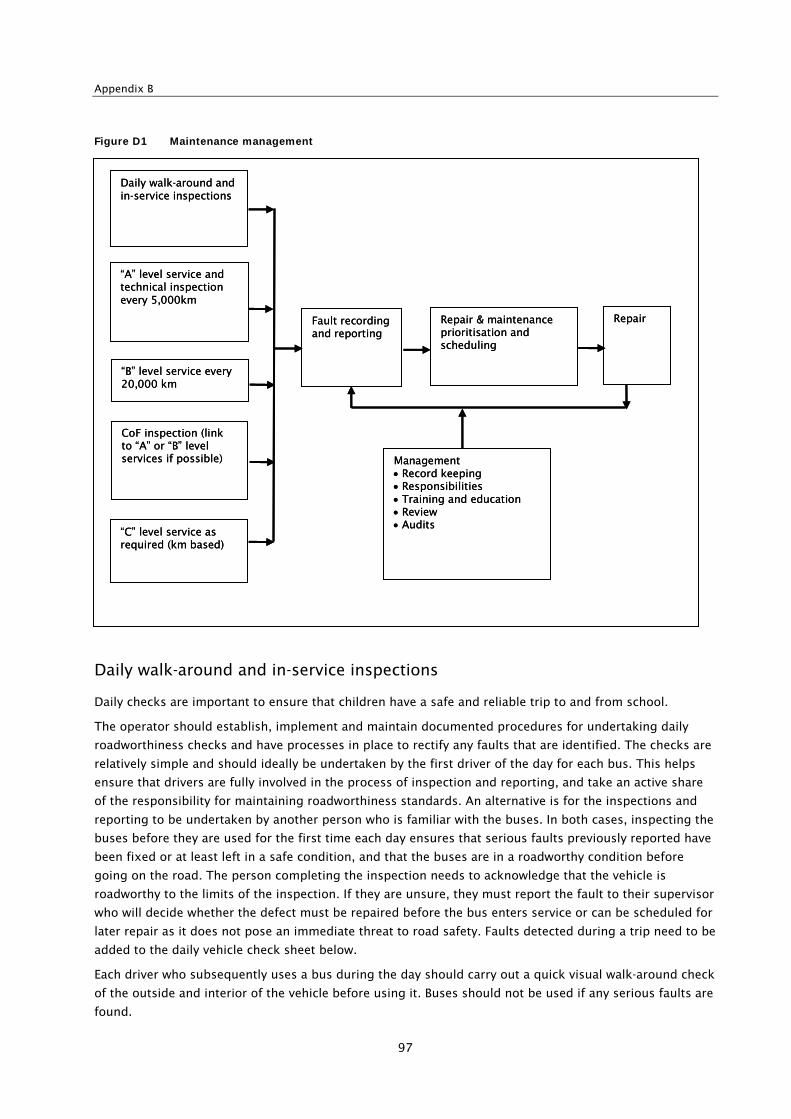
Appendix B
97
Daily walk-around and in-service inspections
Fault recording and reporting
“A” level service and technical inspection every 5,000km
“B” level service every 20,000 km
CoF inspection (link to “A” or “B” level services if possible)
“C” level service as required (km based)
RepairRepair & maintenance prioritisation and scheduling
Management Record keeping Responsibilities Training and education Review Audits
Figure D1 Maintenance management
Daily walk-around and in-service inspections
Daily checks are important to ensure that children have a safe and reliable trip to and from school.
The operator should establish, implement and maintain documented procedures for undertaking daily
roadworthiness checks and have processes in place to rectify any faults that are identified. The checks are
relatively simple and should ideally be undertaken by the first driver of the day for each bus. This helps
ensure that drivers are fully involved in the process of inspection and reporting, and take an active share
of the responsibility for maintaining roadworthiness standards. An alternative is for the inspections and
reporting to be undertaken by another person who is familiar with the buses. In both cases, inspecting the
buses before they are used for the first time each day ensures that serious faults previously reported have
been fixed or at least left in a safe condition, and that the buses are in a roadworthy condition before
going on the road. The person completing the inspection needs to acknowledge that the vehicle is
roadworthy to the limits of the inspection. If they are unsure, they must report the fault to their supervisor
who will decide whether the defect must be repaired before the bus enters service or can be scheduled for
later repair as it does not pose an immediate threat to road safety. Faults detected during a trip need to be
added to the daily vehicle check sheet below.
Each driver who subsequently uses a bus during the day should carry out a quick visual walk-around check
of the outside and interior of the vehicle before using it. Buses should not be used if any serious faults are
found.
School bus safety
98
The Land Transport NZ Roadside inspection guidelines for heavy vehicles is a good basis for the daily walk-
around inspection. As well as the items listed, the inspection needs to include interior and exterior parts
of the body such as fire extinguisher(s), seat condition, emergency exits, door function etc .
Fault recording, reporting and repair
An operator should establish, implement and maintain documented procedures for recording and
reporting faults. A vehicle fault record should be kept in every vehicle to record faults and to note if
repairs have been undertaken. Two examples of check sheets are attached to this standard.
Planned maintenance and safety inspections
An operator should establish, implement and maintain documented procedures for scheduling,
performing and recording periodic maintenance and CoF inspections. Those inspections include:
‘A’ level inspection
This inspection needs to be undertaken by a technically qualified person and should include:
• items recommended by the vehicle manufacturer such as fluid levels
• safety items such as brakes, tyres, couplings and steering (these checks should include all of the CoF
inspection items)
• a check on the items that should be inspected as part of the driver daily inspection.
‘B’ and ‘C’ level inspections
All items included in the A inspection and additional items recommended by the vehicle manufacturer and
body builder.
Repair procedures
An operator should establish, implement and maintain documented procedures that provide for a reported
fault to be assessed, the repair to be assigned a priority, and the repair to be undertaken. Repair
procedures should include:
At the end of each day, a review of the daily bus inspection form and vehicle fault log for each bus
that has been in operation that day.
Faults that cannot be repaired immediately, and are of a ‘low risk’ nature, should be entered into the
workshop repair request system, which can be paper or computer-based. Each repair entry should
record the date, the nature of the fault, who reported it, who undertook the repair and what parts
were used and what work was done.
If a fault is to be monitored instead of being immediately rectified, a record should be kept of what is
being monitored, by whom and when. If, after a period of monitoring, it is decided that a repair is not
required, this should be noted in the records along with who made that decision.
Recording all repairs, services and other actions in the vehicle file. This can be linked to the workshop
repair request system and can be paper or computer-based.
Owner-drivers should decide on the urgency of the repair or check with their contract repairers.
Management
There should be clear management processes in place that include:
Appendix B
99
Identification of the person with overall responsibility for the safe operation and roadworthiness
condition of all buses operated as a school bus and for ensuring full compliance with the following
management processes. This person should have the authority to commission repair work and to
remove any bus they consider to be unroadworthy from service. A second person should be appointed
to act as a fall back in emergency situations or to take overall responsibility when the first person is
unavailable due to sickness, holidays etc.
Ensuring periodic and CoF inspections are undertaken at, or before, the scheduled time, and that daily
walk-around inspections are undertaken before buses are used each day.
Ensuring good quality inspection and maintenance records are kept, and that these identify who made
the entry and when.
Ensuring all reported defects are assessed for risk and priority for repair or monitoring.
Ensuring repairs are undertaken or, if a repair is not undertaken, why and who made the decision not
to repair the fault.
Ensuring responsibilities are clearly understood and acted on. If repairs are contracted out, the
responsibilities of the repair shop and the vehicle owner/manager need to be clear.
Ensuring repairs are undertaken to a standard that is acceptable to bus operator.
Ensuring that all complaints about the condition of buses are recorded, investigated and that
corrective action is taken where necessary. Corrective action should include rectification of the
problem that led to the complaint, improvement of company systems (where investigation shows
these to be inadequate) and employment related action in cases where company policies and
procedures have not been followed.
Undertaking internal audits to ensure procedures and processes are being followed. Audits of the
repair shops could include inspections of a vehicle when returned from the workshop to ensure the
repairs and services have been undertaken correctly.
Training and education
The bus operator has a responsibility to ensure appropriate training is provided for all of the people
involved. This includes drivers, managers and maintenance personnel.
Fuel efficiency
How well a vehicle is maintained and how it is driven can make a large difference in the amount of fuel
used, the amount of harmful exhaust emissions produced, global warming and safety. The difference in
fuel consumption between a good and a poor driver can be as much as 35%. This difference is largely due
to differences in road speed, gear selection, the engine speeds at which gears are changed,
aggressiveness of accelerator use, and the amount of time the driver leaves the vehicle idling. Poorly-
tuned engines can use up to 50% more fuel than well-tuned ones. Clogged air filters increase fuel
consumption by up to 10%. Under-inflation increases fuel consumption, reduces tyre life and is a major
contributor to flat tyres and blowouts. There is also a strong link between safety and fuel efficiency as how
well a vehicle is maintained, speed and aggressive driving affect both.
It is recommended that operators focus on fuel saving by monitor fuel consumption and encouraging
drivers to drive carefully and to inspect their vehicles thoroughly.

School bus safety
100