Embed Size (px)
Citation preview
School breaktimes: Opportunities for promoting health enhancing diet and physical activity
Flo HarrisonUniversity of East Anglia, School of Environmental Sciences
UKCRC Centre for Diet and Physical Activity, Institute for Public Health, Cambridge24th January 2012

Why schools?
Schools are important settings for health promotion
Children are there a lot
Schools are already designed to shape knowledge and behaviour through education
The provide space and facilities for food and drink consumption and physical activity.
Why breaktimes?
Key opportunity for free play within school hours
The main time during which children interact with the school food environment
Analysis 1
Food and drink consumption at school lunchtime: the impact of lunch type and contribution to overall intake in British 9–10-year-old children
Flo Harrison*1, Amy Jennings2, Andy Jones*1, Ailsa Welch2, Esther van Sluijs*3, Simon Griffin*3 and Aedín Cassidy2
•UKCRC Centre for Diet and Physical Activity, Institute for Public Health, Cambridge
1 School of Environmental Sciences, University of East Anglia, Norwich NR4 7JT, UK 2 Department of Nutrition, Norwich Medical School, University of East Anglia, Norwich, UK
3 Medical Research Council Epidemiology Unit, Institute of Metabolic Science, Addenbrooke’s Hospital, Cambridge, UK
In Press Public Health Nutrition (2012) doi:10.1017/S1368980011002321

Food and drink consumption at school lunchtime
Research questions
How does lunchtime consumption differ between those eating packed
lunches and those having school meals?
Is there evidence of a school influence on lunchtime intake?
How do any differences in school lunchtime intake impact overall
intake?

23.0
2.8
2.5
20.3
3.0
46.5
47.6
20.3
69.6
6.1
11.0
10.4
82.7
1.9
46.9
20.9
51.0
71.9
100 75 50 25 0 25 50 75 100
Chips *
Confectionary *
Savoury snacks *
Squash *
Fizzy drinks
Fruit juice
Vegetables *
Fruit *
Fruit & vegetables
mean intake (g)
Packed lunches School meals
Adjusted mean intake at lunchtime on school days
Food and drink consumption at school lunchtimeExplanatory line if required.
Results II
Secondary text
Bullet
Bullet
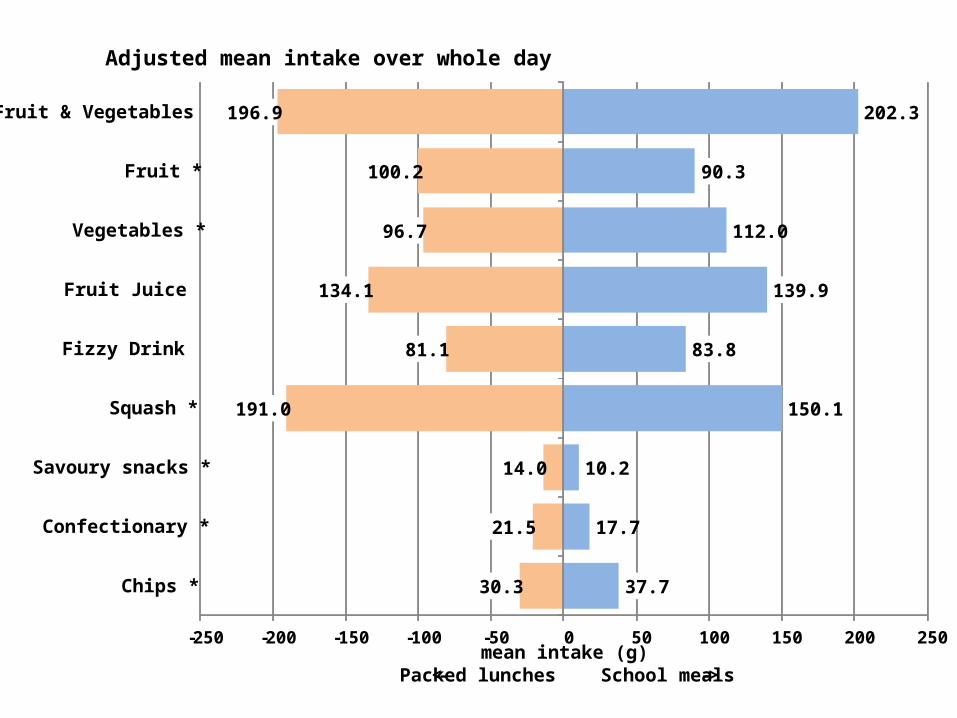
37.7
17.7
10.2
150.1
83.8
139.9
112.0
90.3
202.3
30.3
21.5
14.0
191.0
81.1
134.1
96.7
100.2
196.9
-250 -200 -150 -100 -50 0 50 100 150 200 250
Chips *
Confectionary *
Savoury snacks *
Squash *
Fizzy Drink
Fruit Juice
Vegetables *
Fruit *
Fruit & Vegetables
mean intake (g) <- Packed lunches School meals ->
Adjusted mean intake over whole day

Food and drink consumption at school lunchtimeExplanatory line if required.
Results II
Secondary text
Bullet
Bullet
61.1%
15.8%
24.4%
13.5%
3.6%
33.2%
42.5%
22.5%
34.4%
-250 -200 -150 -100 -50 0 50 100 150 200 250
Chips *
Confectionary *
Savoury snacks *
Squash *
Fizzy Drink
Fruit Juice
Vegetables *
Fruit *
Fruit & Vegetables
mean intake (g) <- Packed lunches School meals ->
Mean intake at lunchtime on school days as % of intake over whole day
20.2%
51.0%
74.4%
43.3%
2.3%
35.0%
21.6%
50.9%
36.5%
Food and drink consumption at school lunchtime
Conclusions and policy implications
Difference in intake between school meal and packed lunch eaters
School meal intake is in line with standards
For specific food groups school lunch consumption is important

Analysis 2
The impact of rainfall and school break time policies on physical activity in 9-10 year old British children: a repeated measures study
Flo Harrison*1, Andrew P Jones1, Graham Bentham1, Esther MF van Sluijs2, Aedín Cassidy3 and Simon J Griffin2
* UKCRC Centre for Diet and Physical Activity, Institute for Public Health, Cambridge1 School of Environmental Sciences, University of East Anglia, Norwich, NR4 7JT, UK. 2 Medical Research Council Epidemiology Unit, Institute of Metabolic Science, Addenbrooke’s Hospital, Cambridge, UK3 School of Medicine, University of East Anglia, Norwich, NR4 7JT, UK
International Journal of Behavioral Nutrition and Physical Activity 2011, 8:47

The impact of rainfall and school policies on physical activity
Research Questions
What is the relationship between physical activity and rainfall?
Can school policies moderate the relationship between physical activity and rainfall?

12
13
14
15
16
17
0 0.1-0.3 0.4-3.3 3.4+
Minutes MVPA over school lunchbreak
The impact of rainfall and school policies on physical activityResults
Total daily rainfall (7am-9pm)
0 0.1-0.3 0.4-3.3 3.4+
Minutes MVPA over whole day
Results I

The impact of rainfall and school policies on physical activity
School wet break policyNumber of
schools
Allowed out 11
Kept indoors - Indoor PA allowed 7
Kept indoors - No indoor PA allowed 72
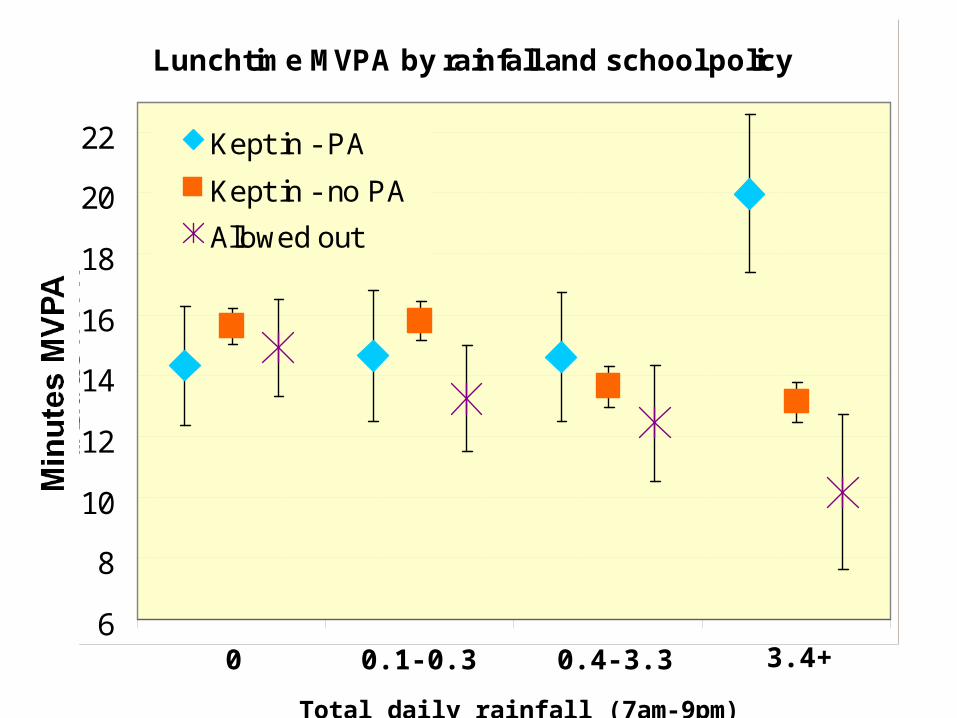
Lunchtime MVPA by rainfall and school policy
6
8
10
12
14
16
18
20
22
min
ute
s M
VP
A
Kept in - PA
Kept in - no PA
Allowed out
0 0.1-0.3 0.4-3.3 3.4+
Total daily rainfall (7am-9pm)
50
55
60
65
70
75
80
85
90
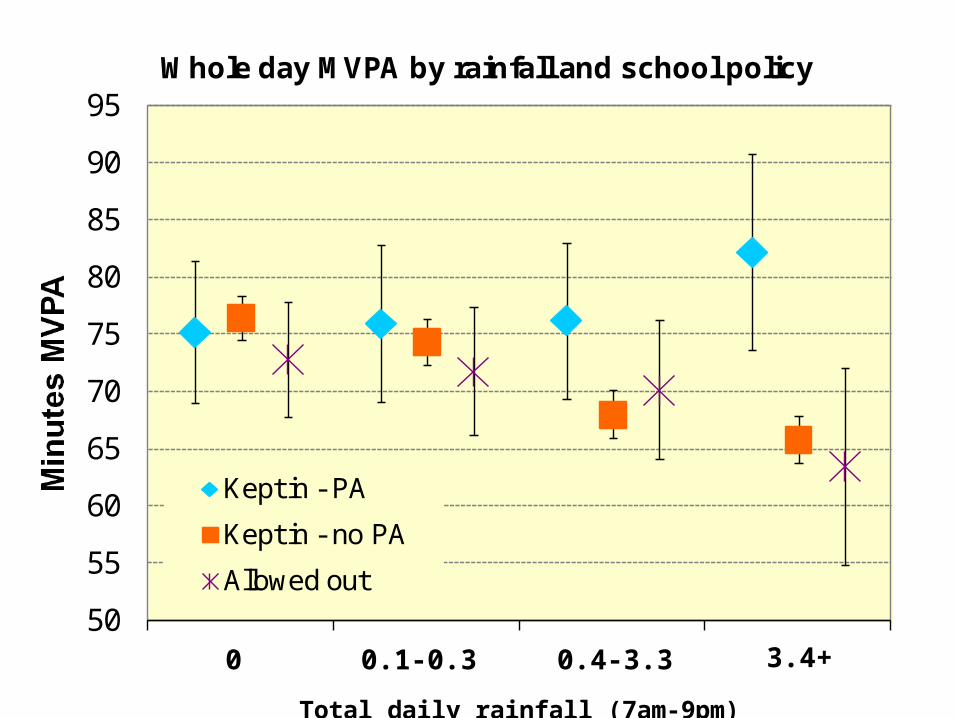
95Whole day MVPA by rainfall and school policy
Kept in - PA
Kept in - no PA
Allowed out
0 0.1-0.3 0.4-3.3 3.4+
Total daily rainfall (7am-9pm)

The impact of rainfall and school policies on physical activity
Conclusions
The relationship between rainfall and physical activity is moderated by school policy
Children allowed to play outdoors in wet weather are less active than those who can be active indoors
By allowing children to be physically active indoors in wet weather, schools may help children maintain activity levels.

ACKNOWLEDGEMENT
This work was undertaken by the Centre for Diet and Activity Research (CEDAR), a UKCRC Public Health Research Centre of Excellence.
Funding from the British Heart Foundation, Economic and Social Research Council, Medical Research Council, the National Institute for Health Research, and the Wellcome Trust, under the auspices of the UK Clinical Research Collaboration, is gratefully acknowledged.