Embed Size (px)
Citation preview


School Attendance Strategies Survey Results
April 2016
This report was developed by the Department of Education and Training‘s Data Analytics Working Group to provide survey information on Queensland state schools’ strategies to increase student attendance.
i

School Attendance Strategies Survey Results
April 2016
ii

School Attendance Strategies Survey Results
April 2016
EXECUTIVE SUMMARYIntroduction
There is strong interest in student attendance and engagement at the national and international levels. Attendance rates have been used as key performance indicators in a number of Australian Government National Partnership Agreements and are commonly used by education systems as a proxy measure for student engagement. Understanding the perspectives of school leaders is important for supporting schools to better respond to student needs and to improve their student attendance strategies.
In April–May 2015, approximately 300 Queensland state school leaders from lower and higher attendance schools were invited to participate in an online survey about initiatives and strategies for increasing student attendance. Of these, 157 completed the survey, comprising 102 primary schools, 15 combined schools (Prep to Year 10 or 12) and 40 secondary schools.
Survey results
Overview
Findings from the survey support the view that student attendance is a complex issue influenced by a range of factors and circumstances, not all of which are able to be influenced by school leaders. The survey demonstrates that all school leaders are actively engaged with student attendance and that they strive to achieve good attendance rates for all students. Almost all respondents said that monitoring and improving attendance was very important, and that a school leader such as a principal or deputy principal was responsible for monitoring student attendance in their school.
The survey results provide an indication of those strategies school leaders consider the most beneficial for improving or maintaining student attendance. The results show that:
a wide variety of attendance strategies, procedures and approaches are used by school leaders, with most perceived as having a slight to moderate impact
primary and secondary school leaders sometimes use different strategies to address student absenteeism
schools with higher and lower attendance rates often use similar strategies, but those with higher attendance rates more frequently perceive their strategies as having a greater impact.1 Schools with lower attendance rates, on the other hand, typically report having attempted a greater number of strategies
among both primary and secondary school leaders, ‘dedicated attendance officers’ was the strategy most frequently perceived as having had a significant impact
other approaches frequently perceived by school leaders as having a substantial impact include implementing targeted strategies to:
o improve student wellbeing
1 Note that schools with higher attendance rates tend to have students from higher socio-economic status families.
iii
School Attendance Strategies Survey Results
April 2016
o strengthen the school’s relationships with families (used more commonly by primary schools)
o ensure students feel connected to the school
o reward improved or good student attendance.
Comparison with 2012 survey results
The survey included questions to enable comparisons with results from a 2012 survey coordinated by the Queensland Audit Office. Compared to 2012, a greater percentage of school leaders said they regularly:
generate reports on patterns and trends of attendance analyse their data to identify absenteeism patterns and trends consistently follow up on unexplained absences.
There was also greater use of SMS texting and less use of letters to parents for individual absences.
The changes in schools’ analysis and use of attendance data reflect positively on system improvements, including better data collection and reporting at the school level through the OneSchool Daily Attendance Monitoring Dashboard.2
Perceived main causes of student non-attendance
Across the three different school types (primary, secondary and combined Prep to Year 10 or Prep to Year 12), the most commonly cited reasons for student non-attendance were parent apathy, family issues, student illness, family holiday and student refusal.
Among primary school leaders, ‘family holiday’ was reported more frequently as a main cause of non-attendance, whereas secondary school leaders more frequently cited ‘student refusal’, ‘student mental health’ and ‘student disengagement’ as a main reason for non-attendance.
Strategies to communicate school expectations
The most frequently used strategies for communicating school expectations to parents and students about school attendance, used by more than nine in 10 schools, included:
discussing the importance of student attendance in the classroom
regularly reminding parents through newsletters and/or social media of the importance of student attendance
regularly providing reminders of the importance of student attendance during school assemblies.
Strategies to improve or maintain attendance
Most of the strategies listed in the survey questionnaire had been widely used by schools in the previous 12 months. Strategies perceived to have the most significant impact were:
implementing targeted strategies to ensure students feel connected to their school
reward programs that recognise improved or good student attendance.
2 OneSchool is a comprehensive, flexible and sustainable information management system for Queensland state schools.
iv

School Attendance Strategies Survey Results
April 2016
Strategies with a high proportion of school leaders recording they perceived no impact were:
events for parents (e.g. morning teas, information nights) (26 per cent)
extra-curricular activities offered to students after school (24 per cent)
planned activities during lunch breaks that students look forward to (19 per cent).
Strategies for intervention and support for students with lower attendance
A wide range of strategies to provide intervention and support for students with lower attendance were used by schools in the previous 12 months and all had been more frequently used by secondary than primary schools.
The strategy perceived to have the most significant impact on the attendance of those with a poor history of attendance was referral ‘to school support staff (e.g. guidance officer, chaplain, Youth Support Co-ordinator)’. All secondary schools and two thirds of the primary schools had used this strategy.
Secondary school leaders much more frequently used:
implementation of disciplinary actions (e.g. detention for truancy) initiation of a prosecution process for parents who continue to neglect their legal
obligations development and implementation of Individual Attendance Improvement Plans.
School leaders noted that chronic non-attending students required significant support, with associated higher levels of resourcing for activities such as telephone calls, meetings, home visits and liaison with external agencies.
Conclusion
This report presents results from a survey of 157 Queensland state school leaders about their strategies for increasing student attendance. Findings from the survey will help inform further work by the department in relation to improving student attendance.
Further Information
For further information on the department’s approach to school absenteeism and student attendance, visit the Every day counts web page (http://education.qld.gov.au/everydaycounts/).
v
School Attendance Strategies Survey Results
April 2016
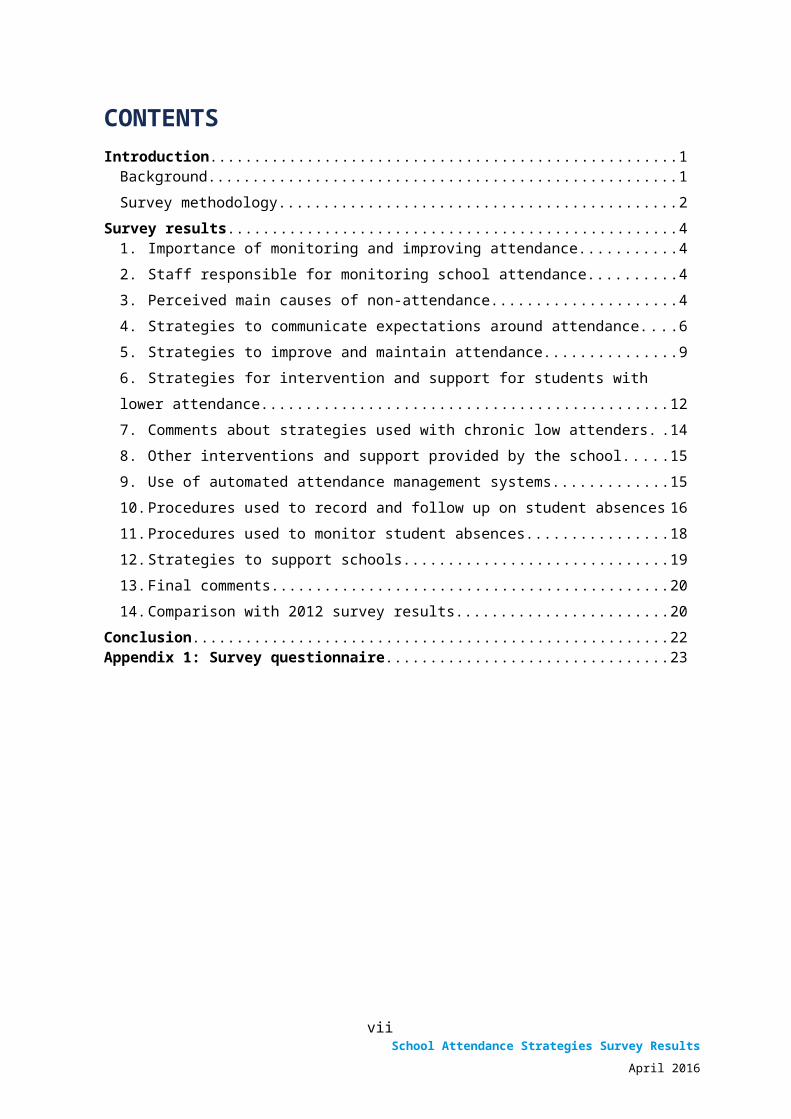
CONTENTSIntroduction......................................................................................................................................1
Background...................................................................................................................................1Survey methodology.....................................................................................................................2
Survey results...................................................................................................................................41. Importance of monitoring and improving attendance..........................................................4
2. Staff responsible for monitoring school attendance..............................................................43. Perceived main causes of non-attendance............................................................................4
4. Strategies to communicate expectations around attendance...............................................65. Strategies to improve and maintain attendance...................................................................9
6. Strategies for intervention and support for students with lower attendance.....................127. Comments about strategies used with chronic low attenders............................................14
8. Other interventions and support provided by the school...................................................159. Use of automated attendance management systems.........................................................15
10. Procedures used to record and follow up on student absences..........................................1611. Procedures used to monitor student absences...................................................................18
12. Strategies to support schools..............................................................................................1913. Final comments...................................................................................................................20
14. Comparison with 2012 survey results..................................................................................20Conclusion.......................................................................................................................................22Appendix 1: Survey questionnaire.................................................................................................23
vi
School Attendance Strategies Survey Results
April 2016
IntroductionIn April–May 2015, a sample of approximately 300 Queensland state school leaders were invited to participate in an online survey about their initiatives and strategies for increasing student attendance. A key aim of the survey was to examine points of difference between schools with higher and lower attendance rates. The survey was developed by the department’s Data Analytics Working Group.
Background
There is considerable evidence that absenteeism from school can have a significant impact on young people’s future prospects and social development.3 On any given day, an average nine per cent of Queensland’s state school students are absent from school. This equates to a student missing more than one full year of schooling from Prep to Year 10.
In 2008, the department launched its Every day counts initiative to increase awareness among parents and students of the importance of attending school all day, every day. A range of other strategies has subsequently been implemented to support schools and communities to promote increased attendance, including strategies for Indigenous communities. In 2012, Queensland Parliament’s Education and Innovation Committee (QPEIC) recommended the department undertake a comprehensive evaluation of initiatives and strategies underway to improve student attendance. In response, the department developed and published a Performance Insights report on Queensland state school attendance patterns, trends, case studies, and effective strategies identified in the literature.4 Further policy and program work is ongoing in response to the 2012 report and subsequent 2014 QPEIC recommendations, including the following:5
• The School Improvement Unit (SIU) reviews of schools incorporate a headline indicator on attendance rates, and the SIU may also identify successful school-level attendance practices as case studies for the Every day counts website.
• The department’s Annual Report includes information about the percentage of students at various levels of attendance, including those with attendance of less than 85 per cent.
• Every day counts web resources are being reviewed and enhanced to target parents of primary school students and those starting secondary school.
• A sample evaluation plan and template have been developed by the department to support schools to evaluate their school attendance strategies. Findings from school-level evaluations may be published on a dedicated section of the Every day counts website.
3 For example: (a) Simons, R., Bampton, M., Findlay, A. and Dempster, A. (2007) ‘Student Mobility, Attendance, and Student Achievement: The Power of Implementing a Unique Student Identifier (USI)’, paper prepared by Performance Monitoring and Reporting Branch of the Department of Education, Training and the Arts, Queensland, for the Annual Conference of the Australian Association for Research in Education. (b) Bridgeland, J., Dilulio, J. and Morison, K. (2006). The silent epidemic: Perspectives of high school dropouts. Washington, DC: Civic Enterprises. (c) Reid, K. (1999) Truancy and Schools. London: Routledge.4 http://education.qld.gov.au/everydaycounts/docs/performance-insights-report.pdf5 Queensland Government Education and Innovation Committee (2014) ‘Review of state school attendance rates’, Report No. 42, November 2014: http://www.parliament.qld.gov.au/Documents/TableOffice/TabledPapers/2014/5414T6462.pdf
1
School Attendance Strategies Survey Results
April 2016
Survey methodology
Calculating attendance rates in Queensland state schools
An average student attendance rate is calculated annually for all Queensland state schools by totalling the number of full (1.0) and part (0.5) days in which school is attended for all enrolled students, dividing by the total possible days students could attend and expressing this as a percentage. From year to year, a great deal of fluctuation is evident in school level measures of attendance. Schools with the largest attendance rate change in one direction in any given year will, overwhelmingly, demonstrate a large change in the opposite direction in the subsequent year.
Questionnaire
The survey questionnaire (refer Appendix 1) included 17 items from a 2011–12 Queensland Audit Office (QAO) survey of selected school leaders.6 This provides some degree of comparability over the intervening three year period, although the comparisons should be treated with some caution due to different sampling methods and relatively small sample sizes.
Sampling method
Two sub-samples (schools with higher and lower attendance rates), each of approximately 150 schools, were invited to participate. These schools were selected on the basis of average student attendance and attendance rate changes in recent years. The overall sample was restricted to schools with at least 30 students and was stratified by school type to be broadly representative of the distribution of state primary and secondary schools.7 In summary, schools were classified into the:
‘higher’ attendance group if they had a higher attendance rate in 2013 (more than 0.5 standard deviations above mean) or high positive change in attendance rate between 2011 and 2013
‘lower’ attendance group if they had a lower attendance rate in 2013 (more than 0.5 standard deviations below mean) and no positive change in attendance rate between 2011 and 2013.
Due to the targeted nature of the sample selection methodology, extrapolating key survey findings to all Queensland state schools should be done with caution. Schools invited to participate in the School Attendance Strategies survey were not intended to be representative of Queensland state schools. Nevertheless, the survey sample broadly reflects the distribution of attendance rates across state schools (primary and secondary).
6 Some of these include sub-items. Note, that due to a QAO reporting error, only 16 items have comparable data. In particular, the QAO reported result (p 43) for ‘Attendance is monitored by the Principal / Deputy Principal / authorised officer at your school’ adds to 169 per cent rather than 100 per cent.7 Combined schools (Prep to Year 10 or 12) were included in the primary school sub-sample. Also note that the year-on-year attendance rate volatility previously noted has direct implications for the validity of the sample frame, especially as the classification of schools as having ‘higher’ or ‘lower’ attendance rates relied, in part, on change between their 2011 and 2013 attendance rates.
2
School Attendance Strategies Survey Results
April 2016
Implementation
The survey was administered through a secure departmental web page. The survey commenced on 20 April 2015 and closed on 12 May 2015. The survey was supported by communications to school leaders encouraging their responses.
Respondent profile
The survey was completed by 157 school leaders (response rate approximately 55 per cent), including five who began but did not finish the questionnaire. Completed surveys were received from 15 combined schools (Prep to Year 10 or 12), 102 primary schools and 40 secondary schools. Due to the small number of responses from combined schools, the analysis in this report focuses predominantly on primary and secondary school results (providing an effective sample of 142).
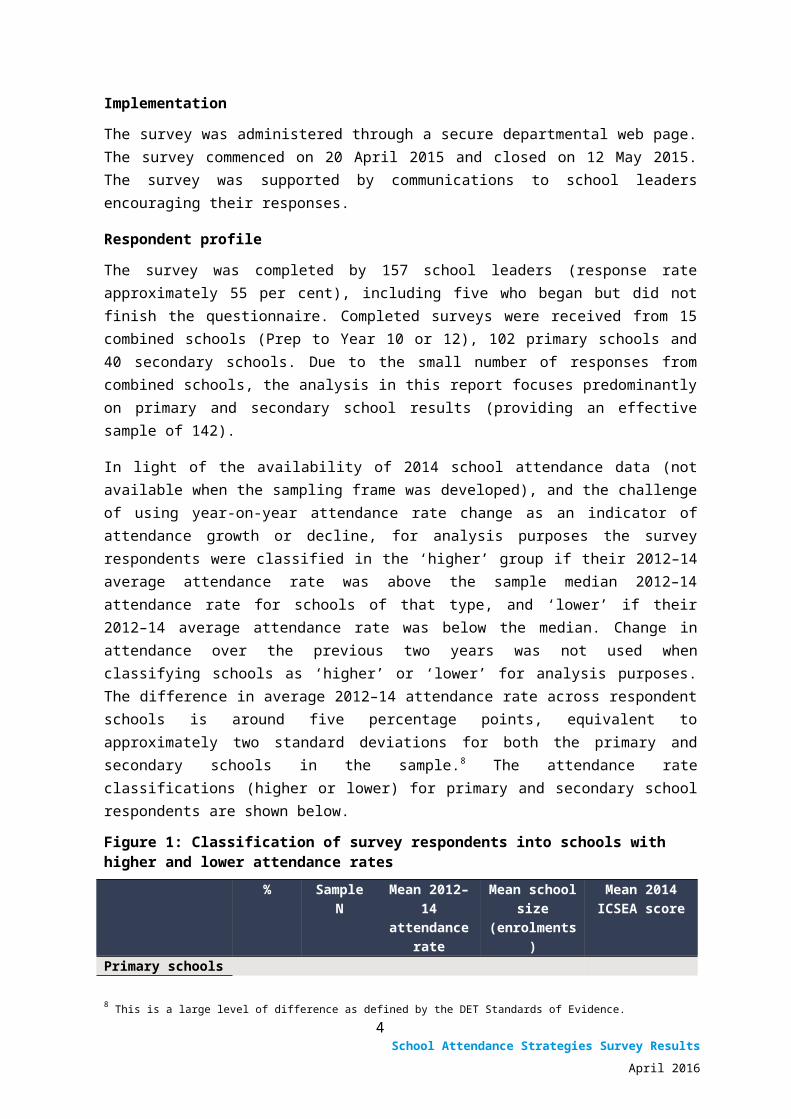
In light of the availability of 2014 school attendance data (not available when the sampling frame was developed), and the challenge of using year-on-year attendance rate change as an indicator of attendance growth or decline, for analysis purposes the survey respondents were classified in the ‘higher’ group if their 2012–14 average attendance rate was above the sample median 2012–14 attendance rate for schools of that type, and ‘lower’ if their 2012–14 average attendance rate was below the median. Change in attendance over the previous two years was not used when classifying schools as ‘higher’ or ‘lower’ for analysis purposes. The difference in average 2012–14 attendance rate across respondent schools is around five percentage points, equivalent to approximately two standard deviations for both the primary and secondary schools in the sample. 8 The attendance rate classifications (higher or lower) for primary and secondary school respondents are shown below.
Figure 1: Classification of survey respondents into schools with higher and lower attendance rates
% Sample N Mean 2012–14 attendance rate
Mean school size
(enrolments)
Mean 2014 ICSEA score
Primary schoolsHigherLower
51 52 94.0% 373 102649 50 89.5% 34 895
Secondary schoolsHigherLower
50 20 88.3% 1103 99050 20 84.8% 753 928
8 This is a large level of difference as defined by the DET Standards of Evidence.
3
School Attendance Strategies Survey Results
April 2016
Survey results1. Importance of monitoring and improving attendance
Respondents were asked: ‘What level of importance does this school place on monitoring attendance?’ and on ‘improving attendance?’ Overall, 96.2 per cent of respondents said that monitoring attendance was very important and 93.6 per cent said that improving attendance was very important for their school.9 These percentages were similar across school types and for schools with lower and higher attendance rates.
2. Staff responsible for monitoring school attendance
Respondents were asked: ‘At this school, who is responsible for monitoring student attendance?’ As multiple responses were permitted for three options (school leader, teaching staff or non-teaching staff), the results add to more than 100 per cent:
96.8 per cent said that a school leader (e.g. Principal, Deputy Principal, Head of Department) was responsible for monitoring student attendance.
62.4 per cent said that teaching staff were responsible for monitoring attendance.
46.5 per cent said that non-teaching staff were responsible for monitoring attendance.
3. Perceived main causes of non-attendance
Respondents were asked: ‘In your opinion, what are the five (5) main causes of non-attendance at this school, for those students with a history of poor attendance?’ As respondents were able to select up to five main causes (from a list of 17 different options) the results add to more than 100 per cent. Respondents were also able to specify additional reasons.
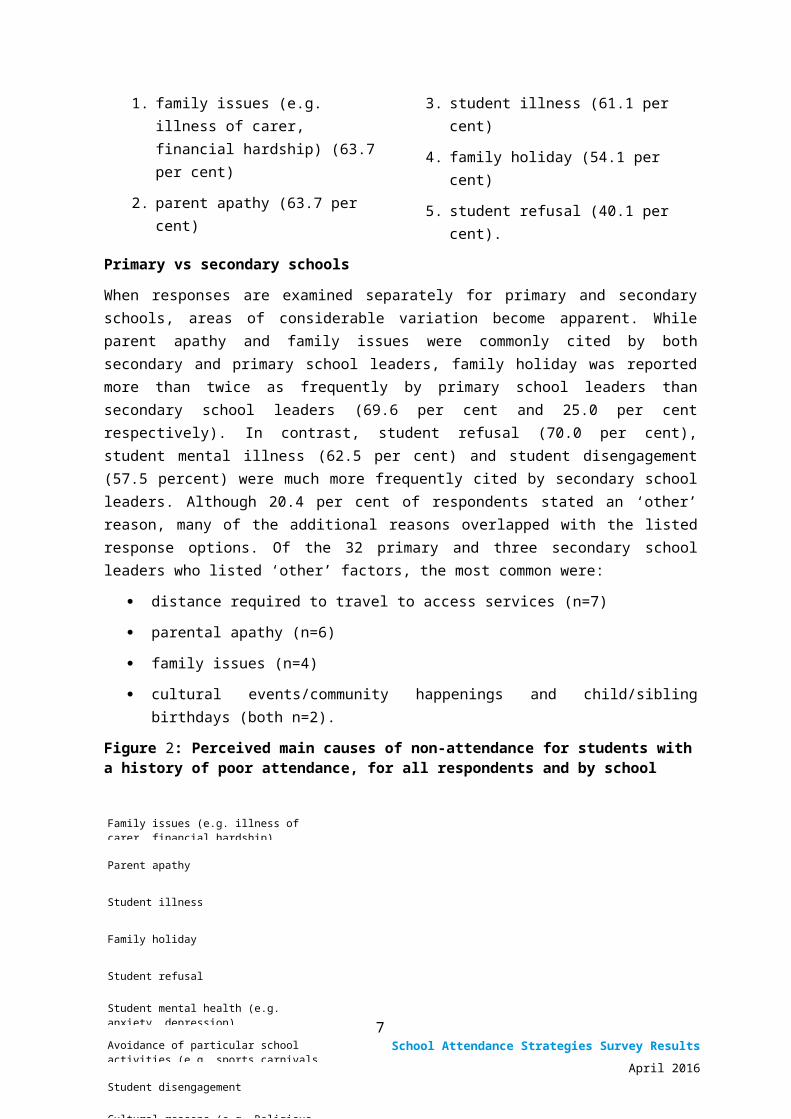
For all school types, the five most commonly cited reasons for the non-attendance of students with a history of poor attendance were:
1. family issues (e.g. illness of carer, financial hardship) (63.7 per cent)
2. parent apathy (63.7 per cent)
3. student illness (61.1 per cent)
4. family holiday (54.1 per cent)
5. student refusal (40.1 per cent).
Primary vs secondary schools
When responses are examined separately for primary and secondary schools, areas of considerable variation become apparent. While parent apathy and family issues were commonly cited by both secondary and primary school leaders, family holiday was reported more than twice as frequently by primary school leaders than secondary school leaders (69.6 per cent and 25.0 per cent respectively). In contrast, student refusal (70.0 per cent), student mental illness (62.5 per cent) and student disengagement (57.5 percent) were much more frequently cited by secondary school leaders. Although 20.4 per cent of respondents stated an ‘other’ reason, many of the additional reasons overlapped with the listed response options. Of the 32 primary and three secondary school leaders who listed ‘other’ factors, the most common were:
9 By comparison, in the 2012 QAO survey 100 per cent of schools said that monitoring and improving attendance was ‘important’ or ‘very important’. These results are not directly comparable due to different wording of the measurement scale.
4
School Attendance Strategies Survey Results
April 2016
distance required to travel to access services (n=7)
parental apathy (n=6)
family issues (n=4)
cultural events/community happenings and child/sibling birthdays (both n=2).
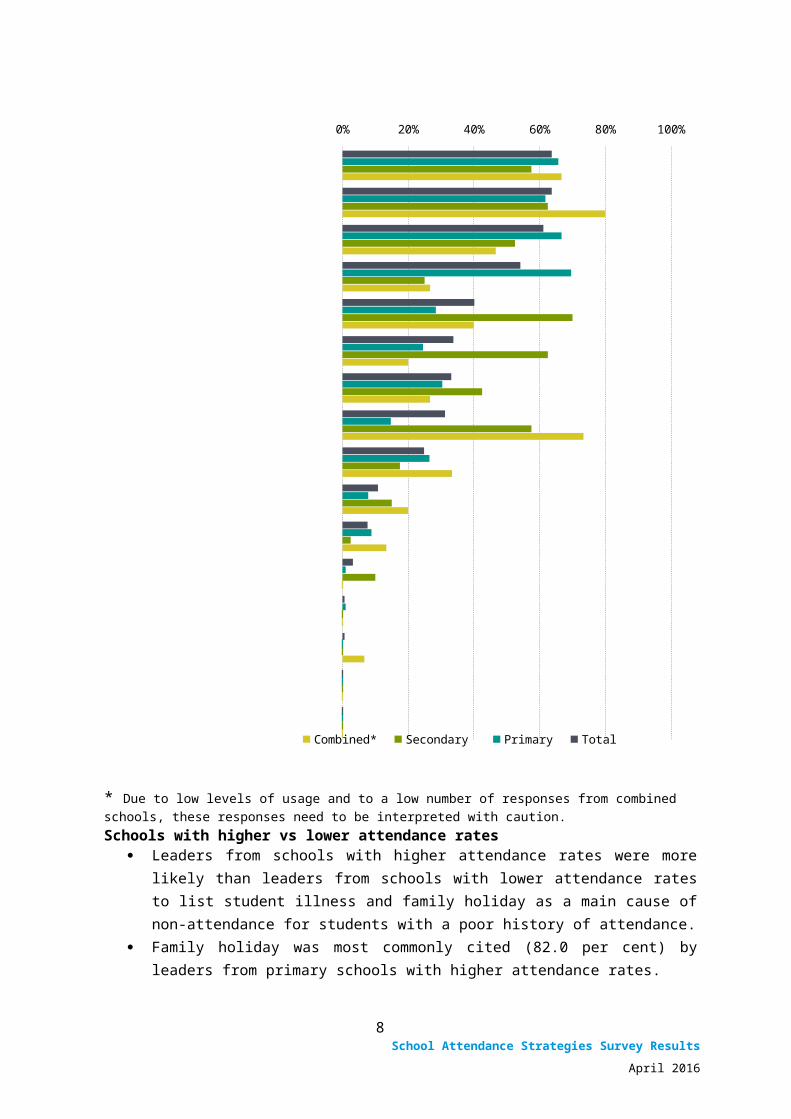
Figure 2: Perceived main causes of non-attendance for students with a history of poor attendance, for all respondents and by school type (%)
0% 20% 40% 60% 80% 100%
Combined* Secondary Primary Total
* Due to low levels of usage and to a low number of responses from combined schools, these responses need to be interpreted with caution.Schools with higher vs lower attendance rates
5
Parent apathy
Student illness
Family holiday
Student refusal
Student mental health (e.g. anxiety, depression)
Avoidance of particular school activities (e.g. sports carnivals, excursions)
Student disengagement
Cultural reasons (e.g. Religious holidays, ‘Sorry business’)
Student avoidance of school assessments
Distance required to travel to school
Conflict with other students
Lack of varied curriculum
Student part time work commitment
Bullying by other students
Conflict with teachers
Family issues (e.g. illness of carer, financial hardship)

School Attendance Strategies Survey Results
April 2016
Leaders from schools with higher attendance rates were more likely than leaders from schools with lower attendance rates to list student illness and family holiday as a main cause of non-attendance for students with a poor history of attendance.
Family holiday was most commonly cited (82.0 per cent) by leaders from primary schools with higher attendance rates.
Student refusal was predominately noted (85.0 per cent) by leaders from secondary schools with lower attendance rates.
Parent apathy was more frequently selected by school leaders (both primary and secondary) with lower attendance rates and student illness by school leaders with higher attendance rates.
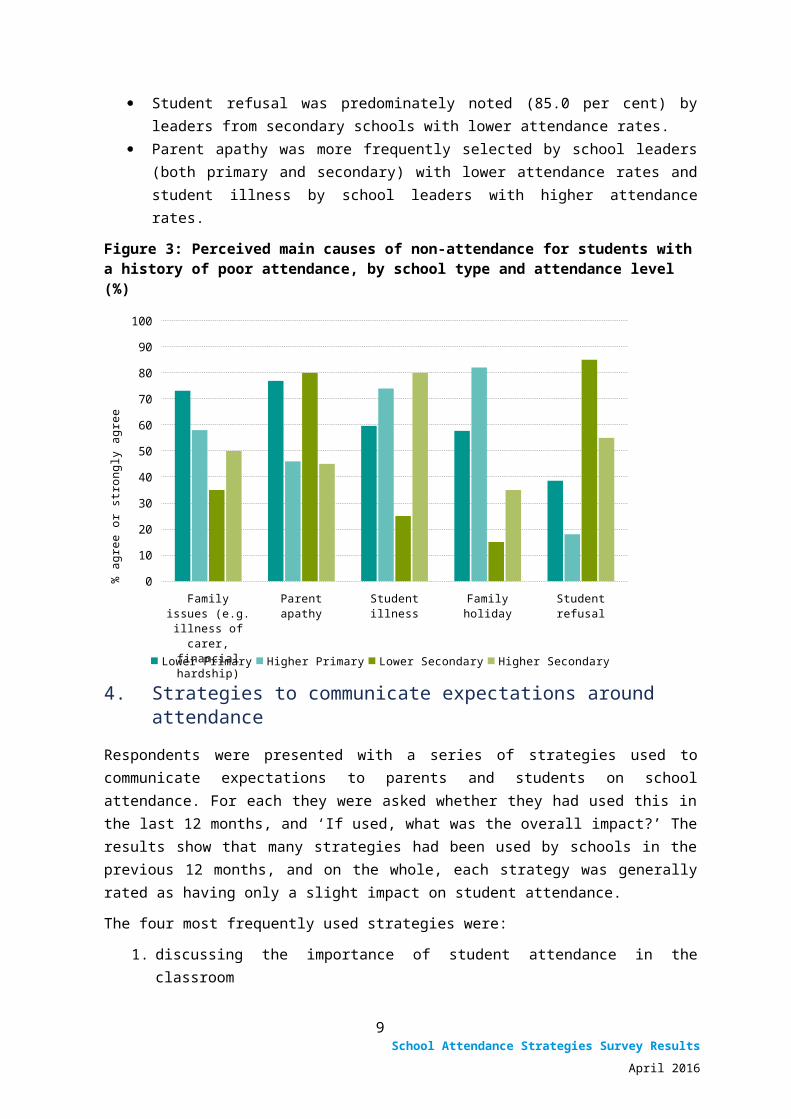
Figure 3: Perceived main causes of non-attendance for students with a history of poor attendance, by school type and attendance level (%)
Family issues (e.g. illness of carer, financial
hardship)
Parent apathy Student illness Family holiday Student refusal0
10
20
30
40
50
60
70
80
90
100
Lower Primary Higher Primary Lower Secondary Higher Secondary
% a
gree
or s
trong
ly a
gree
4. Strategies to communicate expectations around attendance
Respondents were presented with a series of strategies used to communicate expectations to parents and students on school attendance. For each they were asked whether they had used this in the last 12 months, and ‘If used, what was the overall impact?’ The results show that many strategies had been used by schools in the previous 12 months, and on the whole, each strategy was generally rated as having only a slight impact on student attendance.
The four most frequently used strategies were:
1. discussing the importance of student attendance in the classroom2. regularly providing reminders for parents in newsletters and/or social media3. regularly providing reminders during school assembly4. discussing the importance of student attendance at parent information sessions.
Strategies most frequently rated as having a significant impact were:
6
School Attendance Strategies Survey Results
April 2016
undertaking formal agreements with parents (but only used by 33 per cent of schools) regularly providing reminders during school assembly regularly providing reminders of the importance of student attendance for parents in
newsletters and/or social media collaboration with local businesses (e.g. students not being served during school hours).
Primary vs secondary schools
Collaboration with local business and undertaking formal agreements with parents were used approximately three times more frequently by secondary school leaders than primary school leaders.
Collaboration with local businesses, although used by only a very small number of primary schools, was more frequently rated as having a significant impact by primary school leaders than by secondary school leaders, who predominately rated this strategy as having no impact or a slight impact.
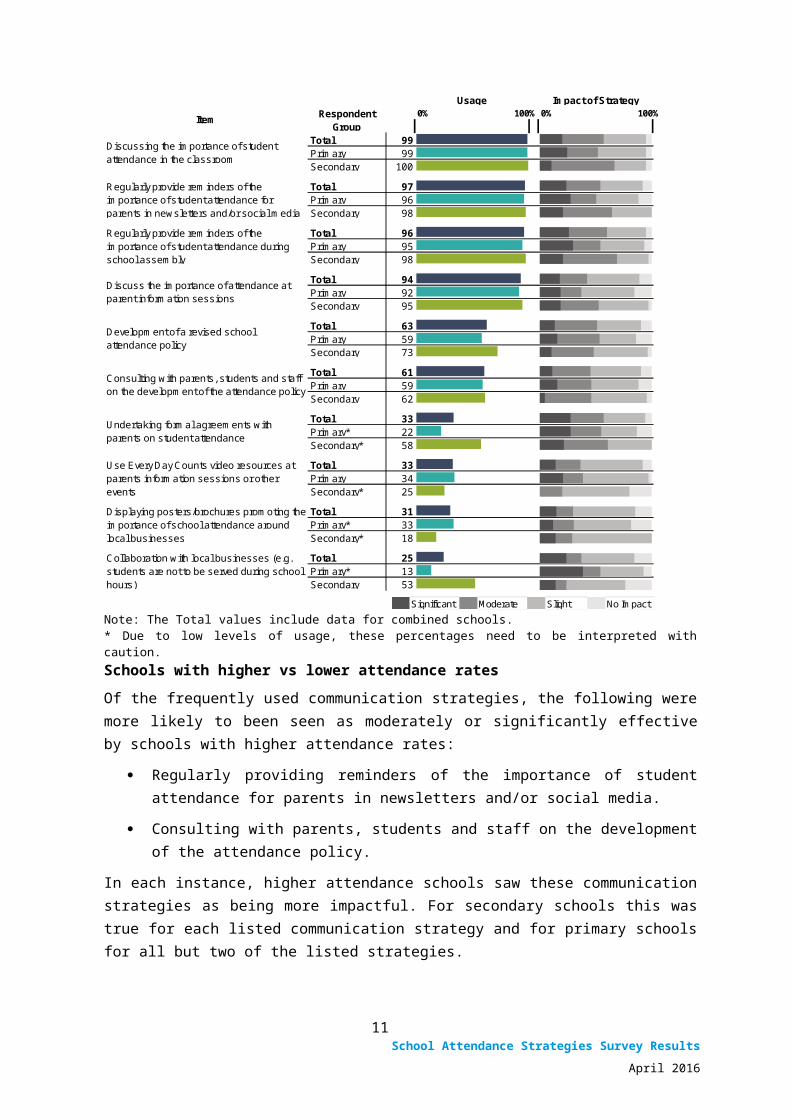
Figure 4: Strategies to communicate expectations around attendance, for all respondents and by school type — usage and impact ratings (%)
Usage Impact of Strategy0% 100%0% 100% 0% 100%
Total 99Primary 99Secondary 100
Total 97Primary 96Secondary 98
Total 96Primary 95Secondary 98
Total 94Primary 92Secondary 95
Total 63Primary 59Secondary 73
Total 61Primary 59Secondary 62
Total 33Primary* 22Secondary* 58
Total 33Primary 34Secondary* 25
Total 31Primary* 33Secondary* 18
Total 25Primary* 13Secondary 53
Item Respondent Group
Discussing the importance of student attendance in the classroom
Regularly provide reminders of the importance of student attendance for parents in newsletters and/or social media
Regularly provide reminders of the importance of student attendance during school assembly
Discuss the importance of attendance at parent information sessions
Development of a revised school attendance policy
Consulting with parents, students and staff on the development of the attendance policy
Undertaking formal agreements with parents on student attendance
Use Every Day Counts video resources at parents information sessions or other events
Displaying posters/brochures promoting the importance of school attendance around local businesses
Collaboration with local businesses (e.g. students are not to be served during school hours)
Significant Moderate Slight No Impact
Note: The Total values include data for combined schools.* Due to low levels of usage, these percentages need to be interpreted with caution.Schools with higher vs lower attendance rates
7
School Attendance Strategies Survey Results
April 2016
Of the frequently used communication strategies, the following were more likely to been seen as moderately or significantly effective by schools with higher attendance rates:
Regularly providing reminders of the importance of student attendance for parents in newsletters and/or social media.
Consulting with parents, students and staff on the development of the attendance policy.
In each instance, higher attendance schools saw these communication strategies as being more impactful. For secondary schools this was true for each listed communication strategy and for primary schools for all but two of the listed strategies.
Schools with higher attendance rates (primary and secondary) were more likely to perceive the following as effective strategies to communicate school expectations around attendance:
Undertaking formal agreements with parents on student attendance.
Collaboration with local businesses (e.g. students are not to be served during school hours).
Using Every day counts video resources at parents’ information sessions or other events.
Displaying posters/brochures around local businesses promoting the importance of attendance.
It is tempting to conclude that these attendance strategies, which are rated as highly effective by leaders at higher attendance schools, should be adopted by leaders at lower attendance schools who wish to improve their attendance rates. However, it is important to note that the profile of higher attendance schools is substantially different from lower attendance schools (e.g. in terms of having students with higher average socio-economic status), and that very few higher attendance schools report having used these strategies. Hence, these findings need to be interpreted with caution.10
Primary schools with lower attendance rates were more likely to perceive the following as effective strategies to communicate school expectations:
Regularly providing reminders of the importance of student attendance during school assembly.
Discussing the importance of student attendance in the classroom.
10 For example, only one higher attendance primary school leader recorded having tried the strategy, ‘collaboration with local businesses in the previous 12 months’. Likewise, only one higher attendance secondary school leader recorded having used the strategy ‘displaying posters/brochures around local businesses promoting the importance of school attendance’.
8
School Attendance Strategies Survey Results
April 2016
Figure 5: Strategies to communicate expectations around attendance, by school type and attendance level for those schools reporting use of strategy
Discussing the importance attendance in the classroom
Reminders of the importance of attendance for parents in newsletters and/or social media
Reminders of the importance of student at-tendance during school assembly
Discuss the importance of attendance at parent information sessions
Development of a revised school attendance pol-icy
Consulting with parents, students and staff on the development of the attendance policy
Undertaking formal agreements with parents on student attendance
Use Every Day Counts video resources at parents information sessions or other events
Posters/brochures promoting the importance of attendance around local businesses
Collaboration with local businesses (e.g. students are not to be served during school)
0 10 20 30 40 50 60 70 80 90 100
*
*
*
*
*
*
*
*
*
*
*
*
*
*
*
*
*
*
% significant or moderate
Lower Secondary Higher Secondary Lower Primary Higher Primary
* Due to low levels of usage, responses for these sub-groups need to be interpreted with caution.
5. Strategies to improve and maintain attendance
Respondents were presented with a series of strategies that could be used to improve or maintain student attendance. For each they were asked: ‘In the last 12 months has this school used any of the following strategies?’ and ‘If used, what was the overall impact on students’ attendance?’ The most frequently used strategy was ‘ensuring that learning occurs every school day’.
The results show that most of the strategies had been used in the previous 12 months, but were often perceived to have only slight to moderate impacts; no more than a quarter of school leaders who had used a particular strategy considered it to have had a significant impact on student attendance. Strategies that were perceived to have the most significant impact were:
implementing targeted strategies to ensure students feel connected to this school (27 per cent)
reward programs that recognise improved or good student attendance (23 per cent).
The provision of reward programs at the individual student, class and school level was the most frequently noted initiative amongst those school leaders who provided additional comments.
9
Discussing the importance of student attendance in the classroom
Regularly provide reminders of the importance of student attendance for parents in newsletters and/or social media
Regularly provide reminders of the importance of student attendance during school assembly
Discuss the importance of attendance at parent information sessions
Development of a revised school attendance policy
Consulting with parents, students and staff on the development of the attendance policy
Undertaking formal agreements with parents on student attendance
Use Every Day Counts video resources at parents information sessions or other events
Displaying posters/brochures promoting the importance of school attendance around local businesses
Collaboration with local businesses (e.g. students are not to be served during school hours)
School Attendance Strategies Survey Results
April 2016
Strategies with a high proportion of school leaders recording no perceived impact were:
events for parents (e.g. morning teas, information nights) (26 per cent) extra-curricular activities offered to students after school (24 per cent) planned activities during lunch breaks that students look forward to (19 per cent).
For each of these strategies, primary school leaders more frequently rated these strategies as having ‘no impact’ than did secondary school leaders.
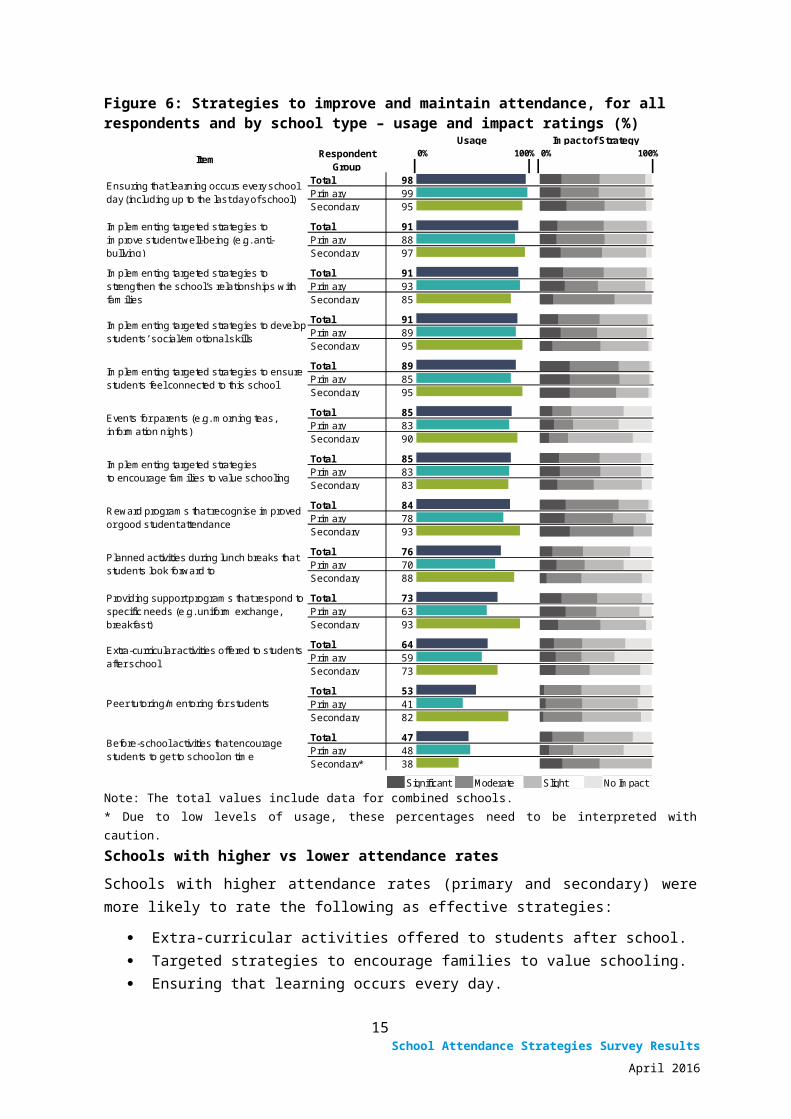
Figure 6: Strategies to improve and maintain attendance, for all respondents and by school type – usage and impact ratings (%)
Usage Impact of Strategy0% 100% 0% 100%
Total 98Primary 99Secondary 95
Total 91Primary 88Secondary 97
Total 91Primary 93Secondary 85
Total 91Primary 89Secondary 95
Total 89Primary 85Secondary 95
Total 85Primary 83Secondary 90
Total 85Primary 83Secondary 83
Total 84Primary 78Secondary 93
Total 76Primary 70Secondary 88
Total 73Primary 63Secondary 93
Total 64Primary 59Secondary 73
Total 53Primary 41Secondary 82
Total 47Primary 48Secondary* 38
Before-school activities that encourage students to get to school on time
Reward programs that recognise improved or good student attendance
Planned activities during lunch breaks that students look forward to
Providing support programs that respond to specific needs (e.g. uniform exchange, breakfast)
Extra-curricular activities offered to students after school
Peer tutoring/mentoring for students
Implementing targeted strategies to encourage families to value schooling
Ensuring that learning occurs every school day (including up to the last day of school)
Implementing targeted strategies to improve student well-being (e.g. anti-bullying)
Item Respondent Group
Implementing targeted strategies to strengthen the school’s relationships with families
Implementing targeted strategies to develop students’ social/emotional skills
Implementing targeted strategies to ensure students feel connected to this school
Events for parents (e.g. morning teas, information nights)
Significant Moderate Slight No ImpactNote: The total values include data for combined schools.* Due to low levels of usage, these percentages need to be interpreted with caution.
Schools with higher vs lower attendance rates
10

School Attendance Strategies Survey Results
April 2016
Schools with higher attendance rates (primary and secondary) were more likely to rate the following as effective strategies:
Extra-curricular activities offered to students after school. Targeted strategies to encourage families to value schooling. Ensuring that learning occurs every day.
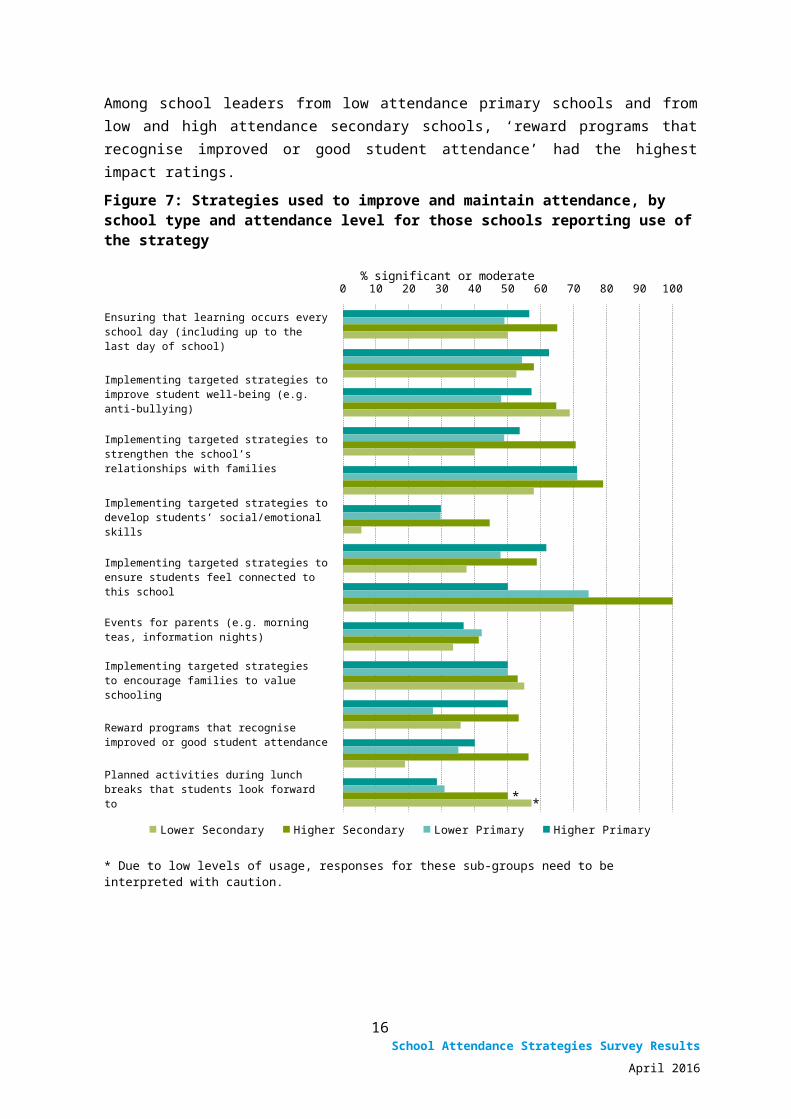
Among school leaders from low attendance primary schools and from low and high attendance secondary schools, ‘reward programs that recognise improved or good student attendance’ had the highest impact ratings.
Figure 7: Strategies used to improve and maintain attendance, by school type and attendance level for those schools reporting use of the strategy
Ensuring that learning occurs every day
Targeted strategies to improve student well-be-ing
Targeted strategies to strengthen relationships with families
Targeted strategies to develop students’ social/emotional skills
Targeted strategies to ensure students feel connected to this school
Events for parents (e.g. morning teas)
Targeted strategies to encourage families to value schooling
Reward programs that recognise improved or good attendance
Planned activities during lunch breaks
Support programs that respond to specific needs
Extra-curricular activities offered to students af-ter school
Peer tutoring/mentoring for students
Before-school activities that encourage students to get to school on time
0 10 20 30 40 50 60 70 80 90 100
* *
% significant or moderate
Lower Secondary Higher Secondary Lower Primary Higher Primary
* Due to low levels of usage, responses for these sub-groups need to be interpreted with caution.
11
Ensuring that learning occurs every school day (including up to the last day of school)
Implementing targeted strategies to improve student well-being (e.g. anti-bullying)
Implementing targeted strategies to strengthen the school’s relationships with families
Implementing targeted strategies to develop students’ social/emotional skills
Implementing targeted strategies to ensure students feel connected to this school
Events for parents (e.g. morning teas, information nights)
Implementing targeted strategies to encourage families to value schooling
Reward programs that recognise improved or good student attendance
Planned activities during lunch breaks that students look forward to
Providing support programs that respond to specific needs (e.g. uniform exchange, breakfast)
Extra-curricular activities offered to students after school
Peer tutoring/mentoring for students
Before-school activities that encourage students to get to school on time
School Attendance Strategies Survey Results
April 2016
6. Strategies for intervention and support for students with lower attendance
Respondents were presented with a series of strategies that provide intervention and support for students who have poor attendance or who have been identified as at-risk of poor attendance. For each they were asked whether they had used this in the last 12 months, and ‘If used, what was the overall impact on students’ attendance?’
Primary vs secondary schools
The results show that all strategies were more frequently used by secondary than primary school leaders. Secondary school leaders much more frequently used:
implementation of disciplinary actions (e.g. detention for truancy) initiation of a prosecution process for parents who continue to neglect their legal
obligations development and implementation of Individual Attendance Improvement Plans.
The most frequently used strategy, ‘discouraging families from taking holidays during the school term’, used by roughly 85 per cent of primary and secondary schools, was frequently rated as having no impact, and this was especially so for primary school leaders (52 per cent). ‘Initiation of a prosecution process’ was also rated by four in 10 primary and secondary school leaders as having ‘no impact’ on attendance. The strategy perceived to have the most significant impact on the attendance of those with a poor history of attendance, especially by secondary school leaders, was referral ‘to school support staff (e.g. guidance officer, chaplain, Youth Support Co-ordinator)’. All secondary schools and two thirds of the primary schools had used this strategy.
12
School Attendance Strategies Survey Results
April 2016
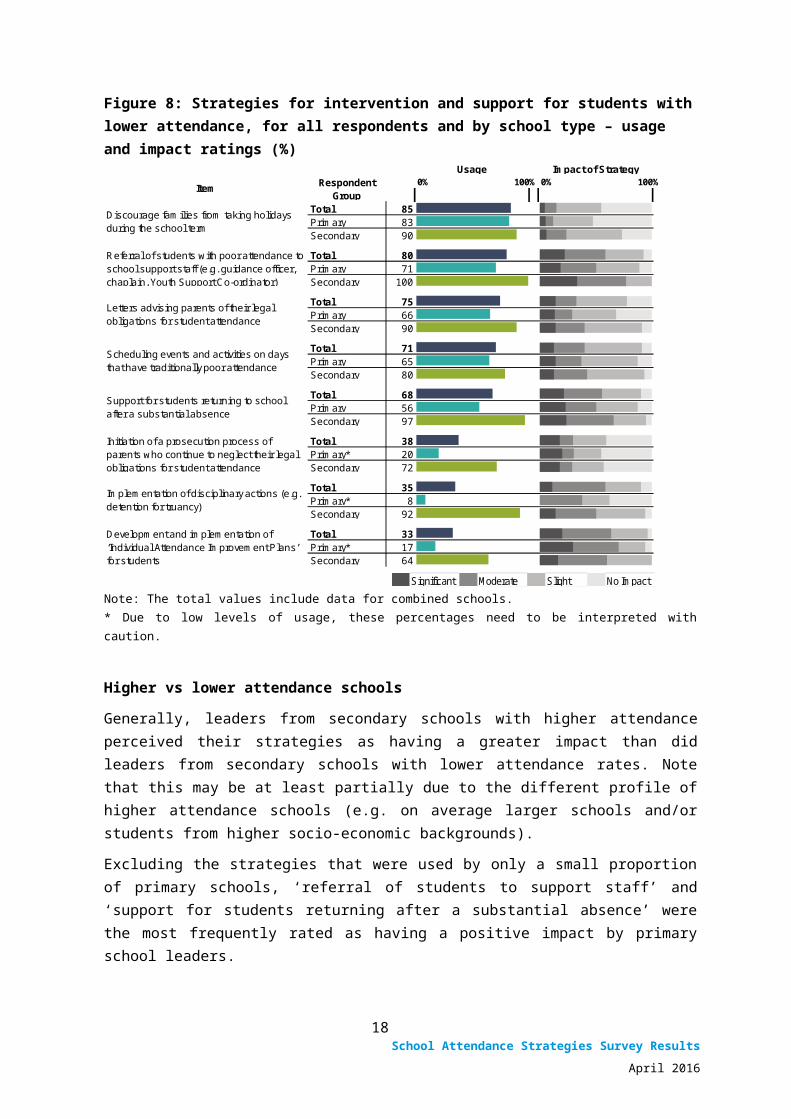
Figure 8: Strategies for intervention and support for students with lower attendance, for all respondents and by school type – usage and impact ratings (%)
Usage Impact of Strategy0% 100%0% 100% 0% 100%
Total 85Primary 83Secondary 90
Total 80Primary 71Secondary 100
Total 75Primary 66Secondary 90
Total 71Primary 65Secondary 80
Total 68Primary 56Secondary 97
Total 38Primary* 20Secondary 72
Total 35Primary* 8Secondary 92
Total 33Primary* 17Secondary 64
Item Respondent Group
Initiation of a prosecution process of parents who continue to neglect their legal obligations for student attendance
Implementation of disciplinary actions (e.g. detention for truancy)
Development and implementation of ‘Individual Attendance Improvement Plans’ for students
Discourage families from taking holidays during the school term
Referral of students with poor attendance to school support staff (e.g. guidance officer, chaplain, Youth Support Co-ordinator)
Letters advising parents of their legal obligations for student attendance
Scheduling events and activities on days that have traditionally poor attendance
Support for students returning to school after a substantial absence
Significant Moderate Slight No Impact
Note: The total values include data for combined schools.* Due to low levels of usage, these percentages need to be interpreted with caution.
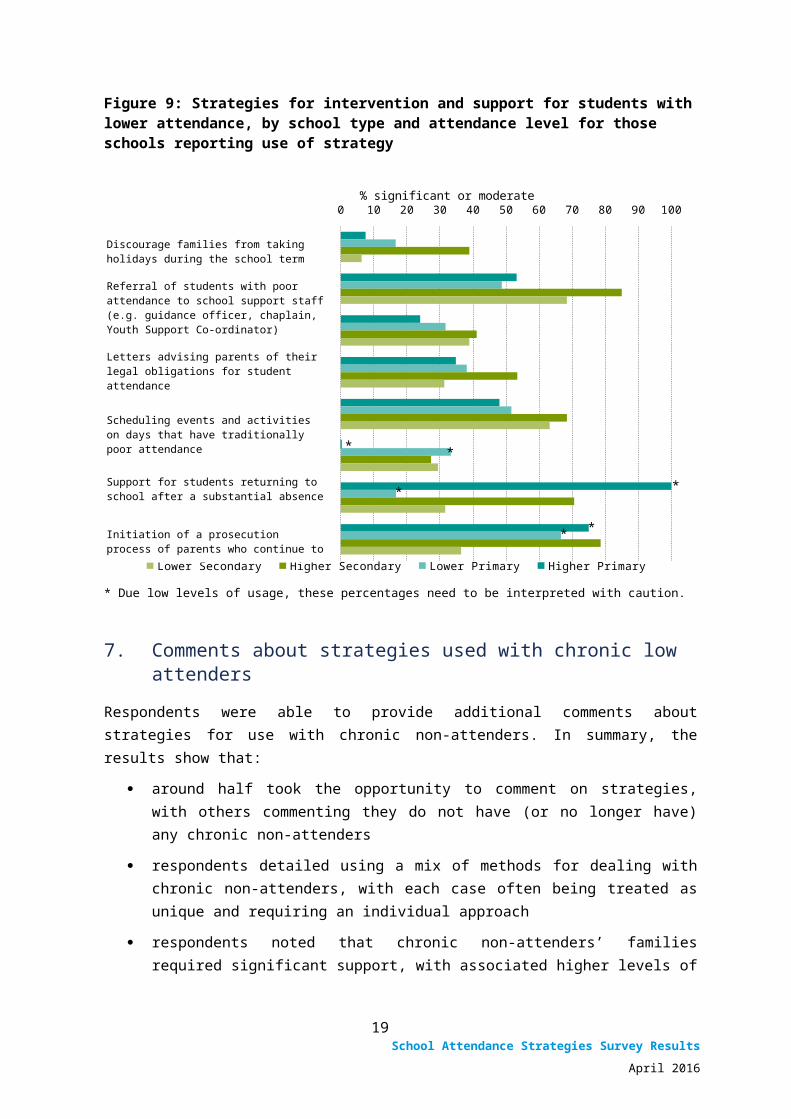
Higher vs lower attendance schools
Generally, leaders from secondary schools with higher attendance perceived their strategies as having a greater impact than did leaders from secondary schools with lower attendance rates. Note that this may be at least partially due to the different profile of higher attendance schools (e.g. on average larger schools and/or students from higher socio-economic backgrounds).
Excluding the strategies that were used by only a small proportion of primary schools, ‘referral of students to support staff’ and ‘support for students returning after a substantial absence’ were the most frequently rated as having a positive impact by primary school leaders.
13

School Attendance Strategies Survey Results
April 2016
Figure 9: Strategies for intervention and support for students with lower attendance, by school type and attendance level for those schools reporting use of strategy
0 10 20 30 40 50 60 70 80 90 100
*
*
*
*
*
*
% significant or moderate
Lower Secondary Higher Secondary Lower Primary Higher Primary
* Due low levels of usage, these percentages need to be interpreted with caution.
7. Comments about strategies used with chronic low attenders
Respondents were able to provide additional comments about strategies for use with chronic non-attenders. In summary, the results show that:
around half took the opportunity to comment on strategies, with others commenting they do not have (or no longer have) any chronic non-attenders
respondents detailed using a mix of methods for dealing with chronic non-attenders, with each case often being treated as unique and requiring an individual approach
respondents noted that chronic non-attenders’ families required significant support, with associated higher levels of resourcing (including phone calls, meetings, home visits and agency/Police referrals).
14
Discourage families from taking holidays during the school term
Referral of students with poor attendance to school support staff (e.g. guidance officer,
chaplain, Youth Support Co-ordinator)
Letters advising parents of their legal obligations for student attendance
Scheduling events and activities on days that have traditionally poor attendance
Support for students returning to school after a substantial absence
Initiation of a prosecution process of parents who continue to neglect their legal obligations
for student attendance
Implementation of disciplinary actions (e.g. detention for truancy)
Development and implementation of ‘Individual Attendance Improvement Plans’ for students
Discourage families from taking holidays during the school term
Referral of students with poor attendance to school support staff (e.g. guidance officer, chaplain, Youth Support Co-ordinator)
Letters advising parents of their legal obligations for student attendance
Scheduling events and activities on days that have traditionally poor attendance
Support for students returning to school after a substantial absence
Initiation of a prosecution process of parents who continue to neglect their legal obligations for student attendance
Implementation of disciplinary actions (e.g. detention for truancy)
Development and implementation of ‘Individual Attendance Improvement Plans’ for students

School Attendance Strategies Survey Results
April 2016
8. Other interventions and support provided by the school
Respondents were asked for the details of any other strategies used by their school to provide intervention and support to students who have poor attendance or are identified as at-risk of poor attendance. For each of these they were also asked to rate the overall impact on students’ attendance. Just under half of both primary school (42.2 per cent, n=43) and secondary school leaders (50.0 per cent, n=20) provided information on additional strategies and support. The most frequently listed initiatives by both primary and secondary schools were:
the provision of rewards at the student, class and school level for good attendance, including gift cards; sporting house point(s); a class BBQ or party; class ice blocks; and lucky draw tickets
promoting and publishing attendance expectations and statistics in: posters around the school (school level); newsletters (class level); and report cards (student level). Contact with parents following a student absence, either via a phone call or a home visit by a school representative, was also noted by both primary and secondary school leaders.
Primary vs secondary schools
A number of areas of difference emerged between primary and secondary schools. For example, the provision of assistance with transport to school and other support programs were more frequently suggested by leaders of primary than secondary schools.
9. Use of automated attendance management systems
Respondents were asked whether their school uses a system to assist with managing attendance, to which 38.9 per cent said ‘yes’.
Primary vs secondary schools
Secondary school leaders much more frequently than primary school leaders (87.5 per cent and 16.7 per cent respectively), reported using an attendance management system. Of the 16 primary schools that recorded using an attendance management system, 62.5 per cent (n=10) had more than 400 students enrolled in 2014, and therefore could be considered large schools. Only three of these schools had a student population of less than 100.
Schools with lower vs higher attendance rates
While the majority of secondary school leaders at both higher and lower attendance schools reported using an attendance management system (100.0 per cent and 75.0 per cent respectively), a larger proportion of primary school leaders at lower attendance schools reported using an attendance management system compared to leaders at higher attendance schools (21.2 per cent and 12.0 per cent respectively).
15
School Attendance Strategies Survey Results
April 2016
10. Procedures used to record and follow up on student absences
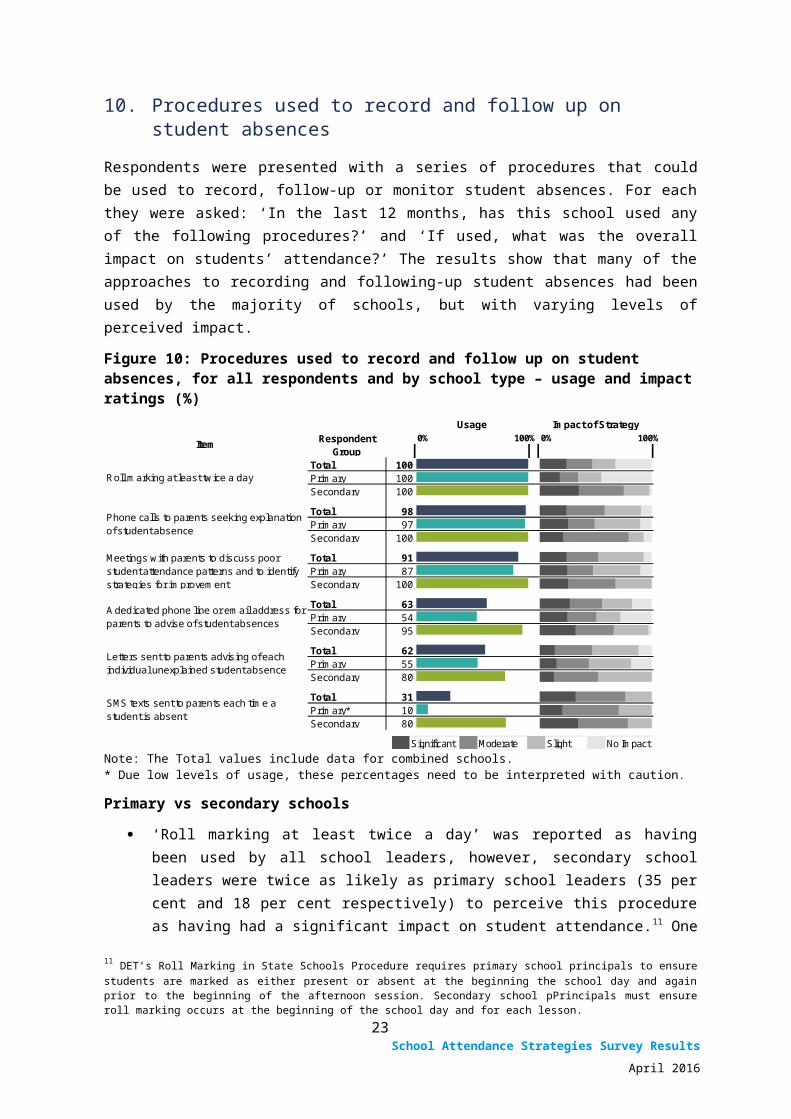
Respondents were presented with a series of procedures that could be used to record, follow-up or monitor student absences. For each they were asked: ‘In the last 12 months, has this school used any of the following procedures?’ and ‘If used, what was the overall impact on students’ attendance?’ The results show that many of the approaches to recording and following-up student absences had been used by the majority of schools, but with varying levels of perceived impact.
Figure 10: Procedures used to record and follow up on student absences, for all respondents and by school type – usage and impact ratings (%)
Usage Impact of Strategy0% 100%0% 100% 0% 100%
Total 100Primary 100Secondary 100
Total 98Primary 97Secondary 100
Total 91Primary 87Secondary 100
Total 63Primary 54Secondary 95
Total 62Primary 55Secondary 80
Total 31Primary* 10Secondary 80
Item Respondent Group
Roll marking at least twice a day
Phone calls to parents seeking explanation of student absence
Meetings with parents to discuss poor student attendance patterns and to identify strategies for improvement
A dedicated phone line or email address for parents to advise of student absences
Letters sent to parents advis ing of each individual unexplained student absence
SMS texts sent to parents each time a student is absent
Significant Moderate Slight No ImpactNote: The Total values include data for combined schools.* Due low levels of usage, these percentages need to be interpreted with caution.
Primary vs secondary schools
‘Roll marking at least twice a day’ was reported as having been used by all school leaders, however, secondary school leaders were twice as likely as primary school leaders (35 per cent and 18 per cent respectively) to perceive this procedure as having had a significant impact on student attendance.11 One third of respondents reported no perceived impact on student attendance from this approach, with primary school leaders being 20 times more likely than secondary school leaders to record ‘no impact’.
SMS text to parents each time a student is absent, overwhelmingly used by secondary school leaders (80.0 per cent in comparison to 10.1 per cent of primary school leaders), was frequently perceived to have had a significant impact on student attendance (34 per cent of secondary school leaders).
Primary school leaders more frequently than secondary school leaders rated ‘A dedicated phone line or email address for parents to advise of student absences’ as having had no impact on student attendance.
11 DET’s Roll Marking in State Schools Procedure requires primary school principals to ensure students are marked as either present or absent at the beginning the school day and again prior to the beginning of the afternoon session. Secondary school pPrincipals must ensure roll marking occurs at the beginning of the school day and for each lesson.
16
School Attendance Strategies Survey Results
April 2016
Schools with higher vs lower attendance rates
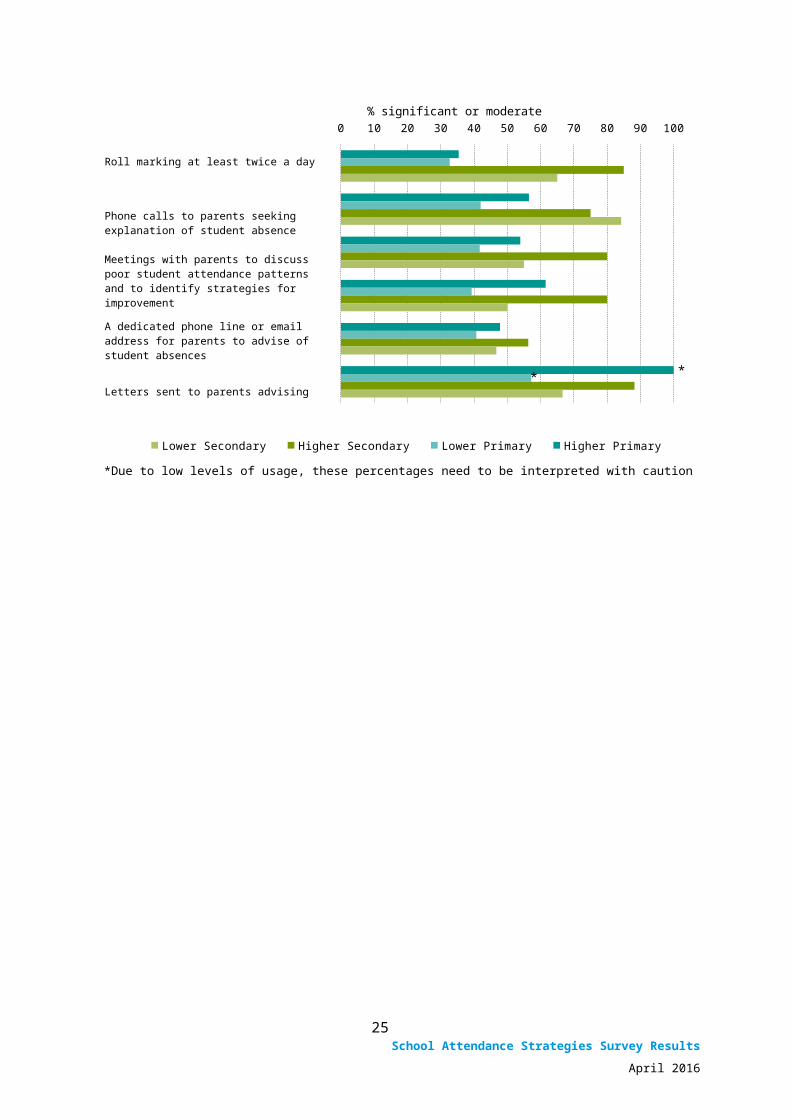
Schools with higher attendance rates (primary and secondary) were more likely to perceive their procedures as having a positive impact on student attendance than schools with lower attendance rates. The biggest differences were:
SMS texts sent to parents each time a student is absent (although very few primary schools used this)
a dedicated phone line or email address for parents to advise of student absences.
A large percentage of leaders from secondary schools with lower attendance rates perceived ‘phone calls to parents seeking explanation of student absence’ to be a particularly effective procedure. This was largely driven by the high proportion of secondary school leaders who rated this procedure as having had a moderate impact on student attendance.
Figure 11: Procedures used to record and follow up on student absences, by school type and attendance level for those schools reporting use of strategy
0 10 20 30 40 50 60 70 80 90 100
**
% significant or moderate
Lower Secondary Higher Secondary Lower Primary Higher Primary
*Due to low levels of usage, these percentages need to be interpreted with caution
17
Roll marking at least twice a day
Phone calls to parents seeking explanation of student absence
Meetings with parents to discuss poor student attendance patterns and to identify strategies for improvement
A dedicated phone line or email address for parents to advise of student absences
Letters sent to parents advising of each individual unexplained student absence
SMS texts sent to parents each time a student is absent

School Attendance Strategies Survey Results
April 2016
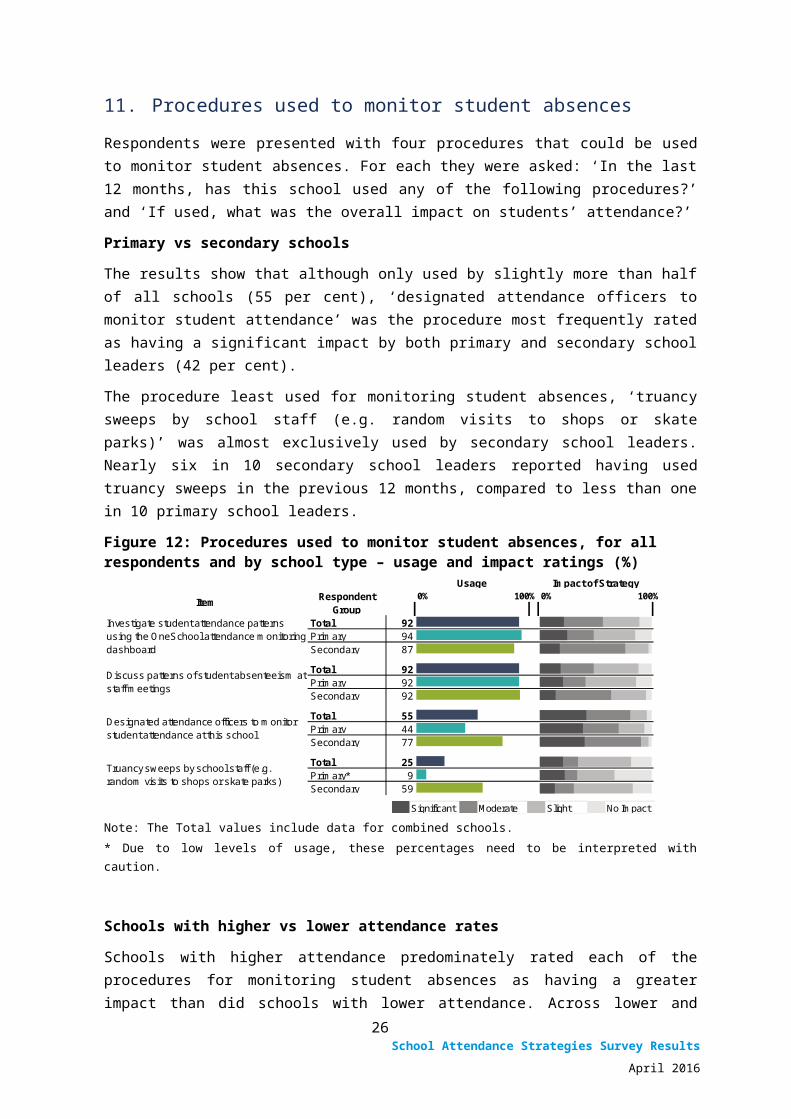
11. Procedures used to monitor student absences
Respondents were presented with four procedures that could be used to monitor student absences. For each they were asked: ‘In the last 12 months, has this school used any of the following procedures?’ and ‘If used, what was the overall impact on students’ attendance?’
Primary vs secondary schools
The results show that although only used by slightly more than half of all schools (55 per cent), ‘designated attendance officers to monitor student attendance’ was the procedure most frequently rated as having a significant impact by both primary and secondary school leaders (42 per cent).
The procedure least used for monitoring student absences, ‘truancy sweeps by school staff (e.g. random visits to shops or skate parks)’ was almost exclusively used by secondary school leaders. Nearly six in 10 secondary school leaders reported having used truancy sweeps in the previous 12 months, compared to less than one in 10 primary school leaders.
Figure 12: Procedures used to monitor student absences, for all respondents and by school type – usage and impact ratings (%)
Usage Impact of Strategy0% 100%0% 100% 0% 100%
Total 92Primary 94Secondary 87
Total 92Primary 92Secondary 92
Total 55Primary 44Secondary 77
Total 25Primary* 9Secondary 59
Item Respondent Group
Discuss patterns of student absenteeism at staff meetings
Designated attendance officers to monitor student attendance at this school
Investigate student attendance patterns using the OneSchool attendance monitoring dashboard
Truancy sweeps by school staff (e.g. random vis its to shops or skate parks)
Significant Moderate Slight No Impact
Note: The Total values include data for combined schools.* Due to low levels of usage, these percentages need to be interpreted with caution.
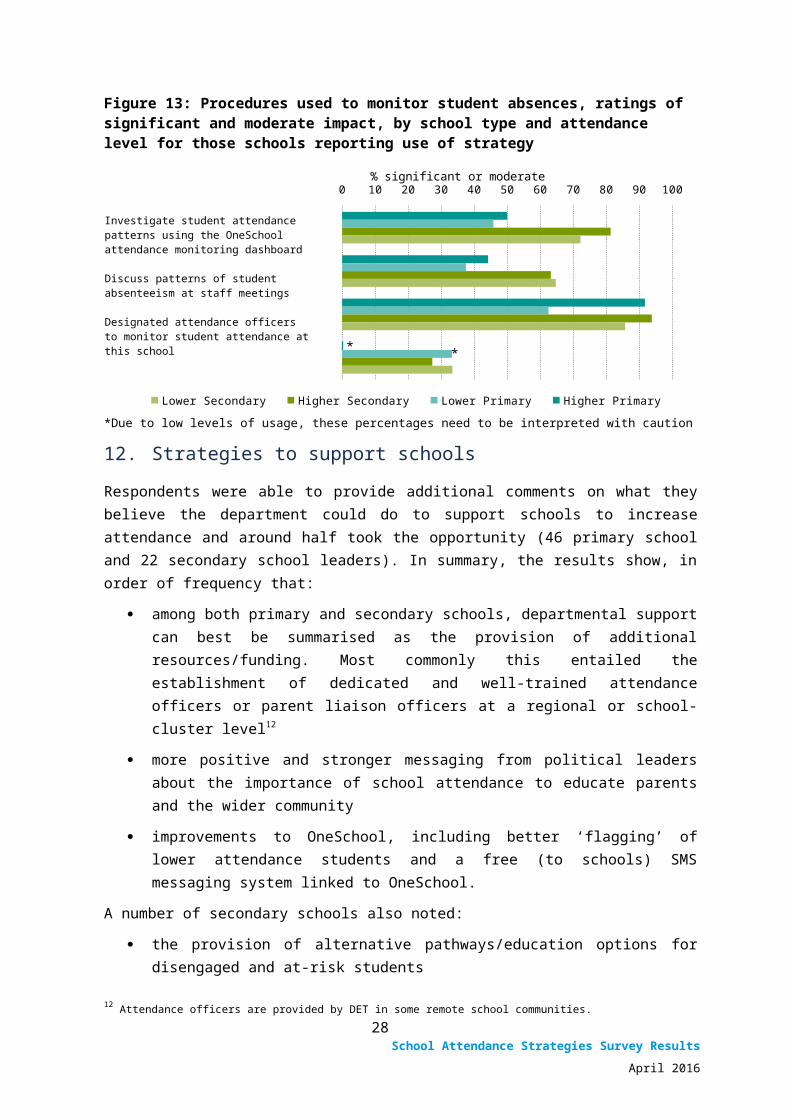
Schools with higher vs lower attendance rates
Schools with higher attendance predominately rated each of the procedures for monitoring student absences as having a greater impact than did schools with lower attendance. Across lower and higher attendance primary and secondary schools, ‘designated attendance officers to monitor student attendance’ was the procedure most frequently rated as having had a significant or moderate impact on student attendance.
18
School Attendance Strategies Survey Results
April 2016
Figure 13: Procedures used to monitor student absences, ratings of significant and moderate impact, by school type and attendance level for those schools reporting use of strategy
0 10 20 30 40 50 60 70 80 90 100
* *
% significant or moderate
Lower Secondary Higher Secondary Lower Primary Higher Primary
*Due to low levels of usage, these percentages need to be interpreted with caution
12. Strategies to support schools
Respondents were able to provide additional comments on what they believe the department could do to support schools to increase attendance and around half took the opportunity (46 primary school and 22 secondary school leaders). In summary, the results show, in order of frequency that:
among both primary and secondary schools, departmental support can best be summarised as the provision of additional resources/funding. Most commonly this entailed the establishment of dedicated and well-trained attendance officers or parent liaison officers at a regional or school-cluster level12
more positive and stronger messaging from political leaders about the importance of school attendance to educate parents and the wider community
improvements to OneSchool, including better ‘flagging’ of lower attendance students and a free (to schools) SMS messaging system linked to OneSchool.
A number of secondary schools also noted:
the provision of alternative pathways/education options for disengaged and at-risk students
increased support for student mental health issues.
Overall, the suggested additional supports reinforce key findings from the quantitative sections of the survey, as well as previously cited research around the importance of connective, sanction-based and incentive-based school attendance strategies.13
12 Attendance officers are provided by DET in some remote school communities.13 Refer DET (2013) ‘Performance Insights: School Attendance’, p 34: http://education.qld.gov.au/everydaycounts/docs/performance-insights-report.pdf.
19
Investigate student attendance patterns using the OneSchool attendance monitoring dashboard
Discuss patterns of student absenteeism at staff meetings
Designated attendance officers to monitor student attendance at this school
Truancy sweeps by school staff (e.g. random visits to shops or skate parks)
School Attendance Strategies Survey Results
April 2016
13. Final comments
Respondents were able to provide additional comments about student attendance as well as feedback on the survey. Around quarter of respondents took this opportunity. In summary, the results showed that some respondents (in no particular order):
highlighted the need for more parental support and buy-in
believed that simply emphasising non-attendance as an issue was not effective
noted that addressing non-attendance can be a financial drain on schools.
14. Comparison with 2012 survey results
The 2015 survey questionnaire included 17 selected items from a 2011–12 QAO school attendance survey of 107 selected school leaders. This provides some degree of comparability over the intervening three year period, although the comparisons should be treated with some caution due to different sampling methods and relatively small sample sizes. In particular, the department’s 2015 survey sample frame comprised 300 schools with approximately half the schools having ‘higher’ and half having ‘lower’ attendance rates, whereas the QAO survey frame comprised 119 randomly selected schools. Comparisons should also be undertaken with caution due to differences in the survey instrument, including wording and scale changes in some questions (e.g. on the importance of monitoring and improving attendance), and to the order in which questions were asked.
Comparisons show that the greatest apparent increases between 2012 and 2015 were in the percentage of respondents agreeing that:
reports on trends and patterns of attendance are generated regularly (increasing from 60 to 79 per cent)
unexplained absences are consistently followed up within three days (increasing from 72 to 86 per cent)
the school uses a third party tool to help manage attendance (increasing from 28 to 39 per cent)
the strategies used by their school are helping achieve the school’s attendance targets (increasing from 81 to 91 per cent).
The five main causes of absences were the same in both surveys (parental apathy, student illness, family issues, family holidays and student refusal to attend).
Compared to the 2012 results, letters to parents were less frequently used, whereas SMS texts to parents were more frequently used.
Interestingly, in the 2015 survey, while there was broad agreement among school leaders that they understood the strategies needed to improve attendance, eight in 10 nevertheless said they would welcome further guidance on how to develop strategies to improve attendance. This represents a slight increase (six percentage points) from the 2012 survey.
20

School Attendance Strategies Survey Results
April 2016
Figure 14: Comparison of QAO 2012 and DET 2015 survey results
QAO 2012 DET 2015Number of schools surveyed (No.) 119 287Number of responses (No.) 107 157Response rate (%) 90 55Does this school use a third party tool to help manage attendance, e.g. ID Attend? (% yes) 28 39What level of importance does this school place on monitoring attendance? (% important/very important)
100 96
What level of importance does this school place on improving student attendance? (% important/very important)
100 94
I have a strong understanding of the strategies needed to improve attendance at this school (%agree/strongly agree)
92 96
The strategies used by this school are helping achieve our school’s attendance targets (% agree/strongly agree)
81 91
The strategies used by this school to increase attendance are well supported by the wider community (% agree/strongly agree)
77 80
Generally, parents in this community understand the importance of sending their children to school regularly (% agree/strongly agree)
80 76
The strategies used at this school to increase student attendance are evaluated regularly (% agree/strongly agree)
80 89
I would welcome further guidance on how to develop strategies to improve attendance (% agree/strongly agree)
74 80
Students with patterns of irregular attendance are easily identified and monitored (% agree/strongly agree)
95 95
Attendance data is analysed regularly to identify trends and patterns of absenteeism (% agree/strongly agree)
84 93
Unexplained absences are consistently followed up within three days (% agree/strongly agree) 72 86There is sufficient support to manage persistent non-attendance (% agree/strongly agree) 37 39Reports on trends and patterns of attendance are generated regularly (% agree/strongly agree)
60 79
Attendance is monitored by the Principal / Deputy Principal / authorised officer at your school (% agree/strongly agree)
n/a 99
For the students at your school who have a history of poor attendance, please choose the five main causes: Parental apathy (%) 70 64 Student illness (%) 69 61 Family issues (e.g. illness of carer, financial hardship) (%) 68 64 Family holiday (%) 52 54 Refusal (%) 46 40
The strategies your school has put in place to increase student attendance are: Phone calls (% used) 95 98 Meeting parents (% used) 82 91 Letters (for individual absences) (% used) 79 62 SMS texts to parents (% used) 20 31
21
School Attendance Strategies Survey Results
April 2016
ConclusionNationally and internationally, there is strong interest in student attendance and engagement. Attendance rate has been used as a key performance indicator in a number of Australian Government National Partnership Agreements and continues to be used as a proxy for student engagement. Understanding the perspectives of school leaders is important for supporting schools to better respond to student needs and to improve their student attendance strategies.
This report presents results from a survey of 157 Queensland state school leaders about their strategies for increasing student attendance. Findings from the survey will help inform work by the department to promote increased student attendance. School improvement reviews incorporate a focus on attendance rates; Every day counts web resources are being reviewed and enhanced; and resources are being developed to help schools evaluate their attendance strategies and improve attendance.
The survey results provide an indication of those strategies that school leaders consider the most beneficial for improving or maintaining student attendance. Key findings will be used to help inform future programs and practices. The results show that:
primary and secondary schools deploy different strategies to address student absenteeism
a wide variety of attendance strategies, procedures and approaches are used by schools, with most perceived as having a slight to moderate impact
schools with higher and lower attendance often used similar strategies but schools with higher attendance more frequently perceived the strategies as having a greater impact (possibly due to the different socio-economic and other characteristics of these schools)
among both primary and secondary school leaders, ‘dedicated attendance officers‘ was the strategy that was the most frequently rated as having a significant impact
other approaches frequently perceived by school leaders as having a substantial impact include implementing targeted strategies to: improve student wellbeing; strengthen the school’s relationships with families (used more commonly by primary schools); ensure students feel connected to the school; and reward improved or good student attendance.
Comparison of the 2015 survey findings to a 2012 QAO survey show that a greater percentage of state schools now:
regularly generate reports on patterns and trends of attendance
analyse their data to identify absenteeism patterns and trends
consistently follow up on unexplained absences.
This reflects positively on system improvements, including better data collection and reporting at the school and systemic level through the OneSchool Daily Attendance Monitoring Dashboard.
Further Information
For further information on the department’s approach to school absenteeism and student attendance, visit the Every day counts web page (http://education.qld.gov.au/everydaycounts/).
22

School Attendance Strategies Survey Results
April 2016
Appendix 1: Survey questionnaire
Thank you for taking part in the Principal's Survey on School Attendance.
You can navigate through the questionnaire by selecting the 'Next' button at the bottom of the screen. If you would like to review one of your question answers, select the 'Back' button at any time to go to the previous screen. To submit the survey, select the 'Submit survey' button on the last screen.
The survey should take less than ten minutes to complete and will close at 5pm on Friday, 1 May 2015.
If you have any questions about this survey, please contact Director, State Schools – Operations on 3513 5919 or email…
Thank you for your time.
Please enter the login and password details from your email invitation to begin the survey.
Login: ____________________
Password: ____________________
(End of Page 1)
Question Text
Please confirm your school details.
Is %[SchoolDetails_Extra]Q1_2% the name of your school?
Yes
No
Destination: Page 4 (Set in 2 (Yes))
(End of Page 2)
Please enter the correct school details.
Centre Code ______
School name __________________________________________________
(End of Page 3)
23
School Attendance Strategies Survey Results
April 2016
What is your position at this school?
School leader (e.g. Principal, Deputy Principal, Head of department)
Teaching staff
Non-teaching staff
At this school, who is responsible for monitoring student attendance?
School leader (e.g. Principal, Deputy Principal, Head of department)
Teaching staff
Non-teaching staff
(End of Page 4)
1. Does this school use a system (e.g. ID Attend) to assist with managing attendance?
Yes
No
Destination: Page 7 (Set in SystemAttendance (No))
(End of Page 5)
Which system does this school use?
ID Attend
Other (please specify) _________________________________________
(End of Page 6)
What level of importance does this school place on...
Unimportant Moderately important
Very important
Unable to comment
2. ... monitoring attendance? 3. ... improving attendance?
(End of Page 7)
The following section asks a range of questions related to student absence and procedures used in this school to record and monitor student absences.
24

School Attendance Strategies Survey Results
April 2016
To what extent do you agree or disagree with the following statements:Strongly disagree
Disagree Neither agree nor disagree
Agree Strongly agree
Unable to comment
4. I have a strong understanding of the strategies needed to improve attendance at this school
5. The strategies used by this school are helping achieve our school’s attendance targets
6. I would welcome further guidance on how to develop strategies to improve attendance
7. There is sufficient support to manage persistent non-attendance
8. The strategies used by this school to increase attendance are well supported by the wider community
9. Generally, parents in this community understand the importance of sending their children to school regularly
10. Attendance is monitored by the Principal/ Deputy Principal/authorised officer at your school
11. The strategies used at this school to increase student attendance are evaluated regularly
12. Students with patterns of irregular attendance are easily identified and monitored
13. Attendance data is analysed regularly to identify trends and patterns of absenteeism
14. Unexplained absences are consistently followed up within three (3) days
15. Reports on trends and patterns of attendance are generated regularly
(End of Page 8)
16. In your opinion, what are the five (5) main causes of non-attendance at this school, for those students with a history of poor attendance?
Avoidance of particular school activities (e.g. sports carnivals, excursions)
Bullying by other students
Conflict with other students
Conflict with teachers
Cultural reasons (e.g. Religious holidays, ‘Sorry business’)
Distance required to travel to school
Family holiday
Family issues (e.g. illness of carer, financial hardship)
Lack of varied curriculum
Parent apathy
Student avoidance of school assessments
25
School Attendance Strategies Survey Results
April 2016
Student disengagement
Student illness
Student mental health (e.g. anxiety, depression)
Student part time work commitments
Student refusal
Other (please specify) _____________________________________
(End of Page 9)
Developing a positive school culture
In the last 12 months has this school used any of the following strategies to improve or maintain student attendance? If used, what was the overall impact on students’ attendance?
Impact on students’ attendance
Not used Used - no impact
Used - slight impact
Used - moderate impact
Used - significant impact
17. Implementing targeted strategies to develop students’ social/emotional skills
18. Implementing targeted strategies to improve student well-being (e.g. anti-bullying)
19. Implementing targeted strategies to ensure students feel connected to this school
20. Implementing targeted strategies to strengthen the school’s relationships with families
21. Implementing targeted strategies to encourage families to value schooling
22. Extra-curricular activities offered to students after school
23. Planned activities during lunch breaks that students look forward to
24. Before-school activities that encourage students to get to school on time
25. Reward programs that recognise improved or good student attendance
26. Events for parents (e.g. morning teas, information nights)
27. Providing support programs that respond to specific needs (e.g. uniform exchange, breakfast program, walking bus, shoe exchange)
28. Peer tutoring/mentoring for students 29. Ensuring that learning occurs every school day (including up to the last day of school)
(End of Page 10)
26
School Attendance Strategies Survey Results
April 2016
Recording and following-up student absences
In the last 12 months, has this school used any of the following procedures to record, follow-up or monitor student absences? If used, what was the overall impact on students' attendance?
Impact on students' attendance
Not used
Used - no impact
Used - slight impact
Used - moderate impact
Used - significant impact
30. Roll marking at least twice a day 31. A dedicated phone line or email address for parents to advise of student absences
32. SMS texts sent to parents each time a student is absent
33. Phone calls to parents seeking explanation of student absence
34. Letters sent to parents advising of each individual unexplained student absence
35. Meetings with parents to discuss poor student attendance patterns and to identify strategies for improvement
(End of Page 11)
Monitoring student attendance
In the last 12 months, has this school used any of the following procedures to monitor student absences? If used, what was the overall impact on students’ attendance?
Impact on students' attendance
Not used Used - no impact
Used - slight impact
Used - moderate impact
Used - significant impact
36. Investigate student attendance patterns using the OneSchool attendance monitoring dashboard
37. Discuss patterns of student absenteeism at staff meetings
38. Designated attendance officers to monitor student attendance at this school
39. Truancy sweeps by school staff (e.g. random visits to shops or skate parks)
(End of Page 12)
27

School Attendance Strategies Survey Results
April 2016
Communicating expectations of attendance
In the last 12 months, has this school used any of the following strategies to communicate expectations to parents and students around school attendance? If used, what was the overall impact on students’ attendance?
Impact on students' attendance
Not used Used - no impact
Used - slight impact
Used - moderate impact
Used - significant impact
40. Development of a revised school attendance policy
41. Consulting with parents, students and staff on the development of the attendance policy
42. Discussing the importance of student attendance in the classroom
43. Regularly provide reminders of the importance of student attendance during school assembly
44. Regularly provide reminders of the importance of student attendance for parents in newsletters and/or social media
45. Discuss the importance of attendance at parent information sessions
46. Use Every Day Counts video resources at parents information sessions or other events
47. Collaboration with local businesses (e.g. students are not to be served during school hours)
48. Undertaking formal agreements with parents on student attendance
49. Displaying posters/brochures promoting the importance of school attendance around local businesses
(End of Page 13)
28
School Attendance Strategies Survey Results
April 2016
Providing intervention and support
In the last 12 months, has this school used any of the following strategies to provide intervention and support to students who have poor attendance or who have been identified as at risk of poor attendance? If used, what was the overall impact on students’ attendance?
Impact on students' attendance
Not used Used - no impact
Used - slight impact
Used - moderate impact
Used - significant impact
50. Referral of students with poor attendance to school support staff (e.g. guidance officer, chaplain, Youth Support Co-ordinator)
51. Development and implementation of ‘Individual Attendance Improvement Plans’ for students
52. Implementation of disciplinary actions (e.g. detention for truancy)
53. Support for students returning to school after a substantial absence
54. Letters advising parents of their legal obligations for student attendance
55. Initiation of a prosecution process of parents who continue to neglect their legal obligations for student attendance
56. Discourage families from taking holidays during the school term
57. Scheduling events and activities on days that have traditionally poor attendance
(End of Page 14)
29
School Attendance Strategies Survey Results
April 2016
Other intervention and support provided by this school.
Please provide details of any other strategies used by this school to provide intervention and support to students who have poor attendance or who have been identified as at risk of poor attendance. What was the overall impact on students’ attendance?
Details of other strategies used by this school
58. Other strategy used (please specify) ____________________59. Other strategy used (please specify) ____________________60. Other strategy used (please specify) ____________________61. Other strategy used (please specify) ____________________62. Other strategy used (please specify) ____________________
Impact on students' attendance
Used no impact
Slight impact
Moderate impact
Significant impact
63. Other strategy used (please specify) 64. Other strategy used (please specify) 65. Other strategy used (please specify) 66. Other strategy used (please specify) 67. Other strategy used (please specify)
(End of Page 15)
68. Please provide any comments about strategies for use with chronic non-attenders.
________________________________________________________________________________
69. Please provide any comments about what the department could do to support schools in increasing attendance.
________________________________________________________________________________
________________________________________________________________________________
70. Please provide any additional comments about student attendance or feedback on this survey.
(End of Page 16)
30