Embed Size (px)
Citation preview

April 2012
SCHOOL AND TEACHING RESOURCES IN SUB-SAHARAN AFRICA
ANALYSIS OF THE 2011 UIS REGIONAL DATA COLLECTION ON EDUCATION
This information bulletin presents new data on factors which affect the quality of education in public schools in sub-Saharan Africa. Data such as class size, availability of textbooks, number of newly-recruited teachers, and availability of basic school services (toilets, clean water and electricity) were collected among 45 countries in sub-Saharan Africa as part of an initiative designed to better meet regional needs for education indicators and analyses, especially for the monitoring of progress towards the goals of the African Union’s Second Decade of Education. Given their link to educational outcomes, the survey results can feed into overall programme design and policy development in order to improve the quality of education in schools of the region.
1. INTRODUCTION The quality of education is one of the critical factors affecting the development and learning achievement of young people today. While the notion of education quality is often difficult to define, there are some basic features which are considered key to educational outcomes. These include the quality of the teaching workforce, the availability of adequate educational resources, a supportive learning environment, and suitable access to basic services in instructional settings (e.g. sanitation, clean water and electricity). All of these are important for the promotion of learning and educational performance. This bulletin presents new data on factors which affect the quality of education in public schools in sub-Saharan Africa. Data were collected among 45 countries in sub-Saharan Africa as part of an initiative designed to better meet regional needs for education indicators and analyses (see Box 1).
BOX 1. AFRICA’S REGIONAL INDICATORS INITIATIVE
The Pan African Institute of Education for Development (IPED) and the Association for the Development of Education in Africa (ADEA) worked closely with the UNESCO Institute for Statistics (UIS) to produce new indicators to monitor the action plan of the Second Decade of Education for Africa (2006-2015). The action plan identifies priority areas (see Box 2) and indicators, some of which are not covered by UIS international data collections. Therefore, in 2009 the committee responsible for monitoring requested that the UIS undertake a data collection specifically for sub-Saharan Africa.
To design this new regional questionnaire, a technical advisory group was established, including representatives of IPED, ADEA selected national statistical authorities from the region, and representatives of organizations such as the Pôle de Dakar of the UNESCO Regional Office for Africa and the World Bank. The advisory group recommended data items which could be used for monitoring purposes and were feasible to collect at the national level.
As part of this partnership, the UIS launched a regional data collection in 2011. Thirty-five out of 45 countries completed the data collection instrument.
UIS
IN
FO
RM
ATIO
N B
ULLETIN
NO
. 9
2 UIS/IB/2012/9
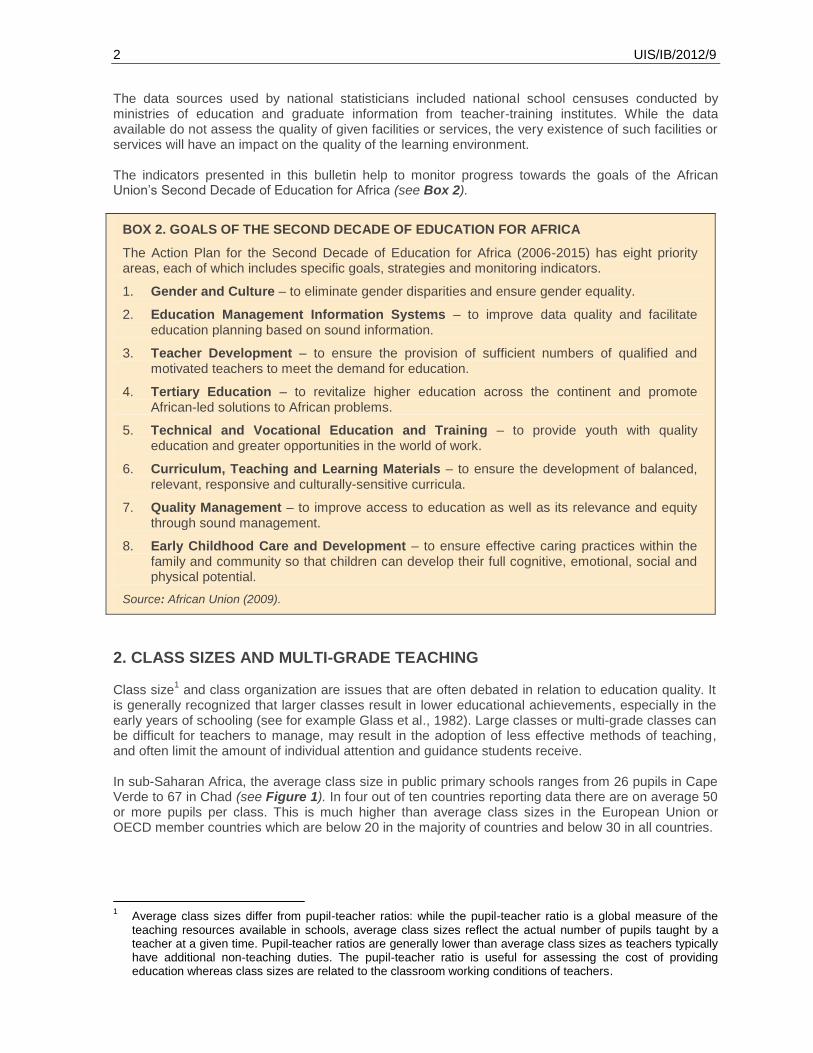
The data sources used by national statisticians included national school censuses conducted by ministries of education and graduate information from teacher-training institutes. While the data available do not assess the quality of given facilities or services, the very existence of such facilities or services will have an impact on the quality of the learning environment. The indicators presented in this bulletin help to monitor progress towards the goals of the African Union’s Second Decade of Education for Africa (see Box 2).
BOX 2. GOALS OF THE SECOND DECADE OF EDUCATION FOR AFRICA
The Action Plan for the Second Decade of Education for Africa (2006-2015) has eight priority areas, each of which includes specific goals, strategies and monitoring indicators.
1. Gender and Culture – to eliminate gender disparities and ensure gender equality.
2. Education Management Information Systems – to improve data quality and facilitate education planning based on sound information.
3. Teacher Development – to ensure the provision of sufficient numbers of qualified and motivated teachers to meet the demand for education.
4. Tertiary Education – to revitalize higher education across the continent and promote African-led solutions to African problems.
5. Technical and Vocational Education and Training – to provide youth with quality education and greater opportunities in the world of work.
6. Curriculum, Teaching and Learning Materials – to ensure the development of balanced, relevant, responsive and culturally-sensitive curricula.
7. Quality Management – to improve access to education as well as its relevance and equity through sound management.
8. Early Childhood Care and Development – to ensure effective caring practices within the family and community so that children can develop their full cognitive, emotional, social and physical potential.
Source: African Union (2009).
2. CLASS SIZES AND MULTI-GRADE TEACHING Class size
1 and class organization are issues that are often debated in relation to education quality. It
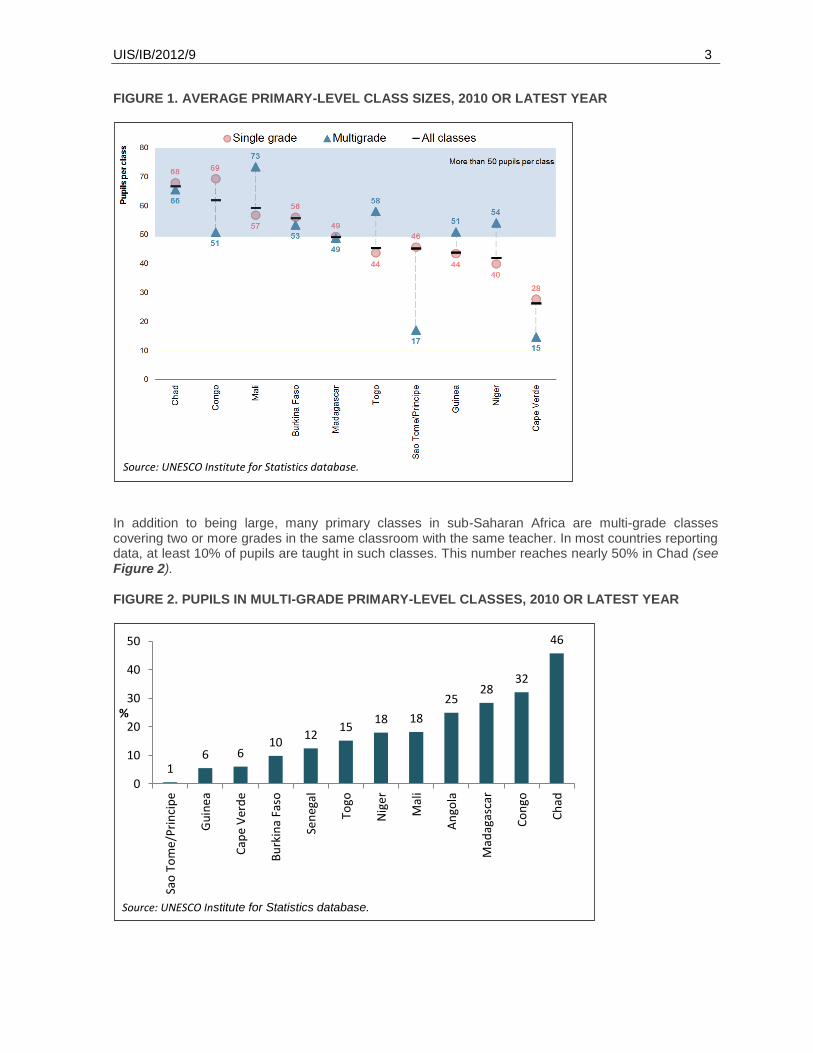
is generally recognized that larger classes result in lower educational achievements, especially in the early years of schooling (see for example Glass et al., 1982). Large classes or multi-grade classes can be difficult for teachers to manage, may result in the adoption of less effective methods of teaching, and often limit the amount of individual attention and guidance students receive. In sub-Saharan Africa, the average class size in public primary schools ranges from 26 pupils in Cape Verde to 67 in Chad (see Figure 1). In four out of ten countries reporting data there are on average 50 or more pupils per class. This is much higher than average class sizes in the European Union or OECD member countries which are below 20 in the majority of countries and below 30 in all countries.
1 Average class sizes differ from pupil-teacher ratios: while the pupil-teacher ratio is a global measure of the
teaching resources available in schools, average class sizes reflect the actual number of pupils taught by a teacher at a given time. Pupil-teacher ratios are generally lower than average class sizes as teachers typically have additional non-teaching duties. The pupil-teacher ratio is useful for assessing the cost of providing education whereas class sizes are related to the classroom working conditions of teachers.
UIS/IB/2012/9 3
FIGURE 1. AVERAGE PRIMARY-LEVEL CLASS SIZES, 2010 OR LATEST YEAR
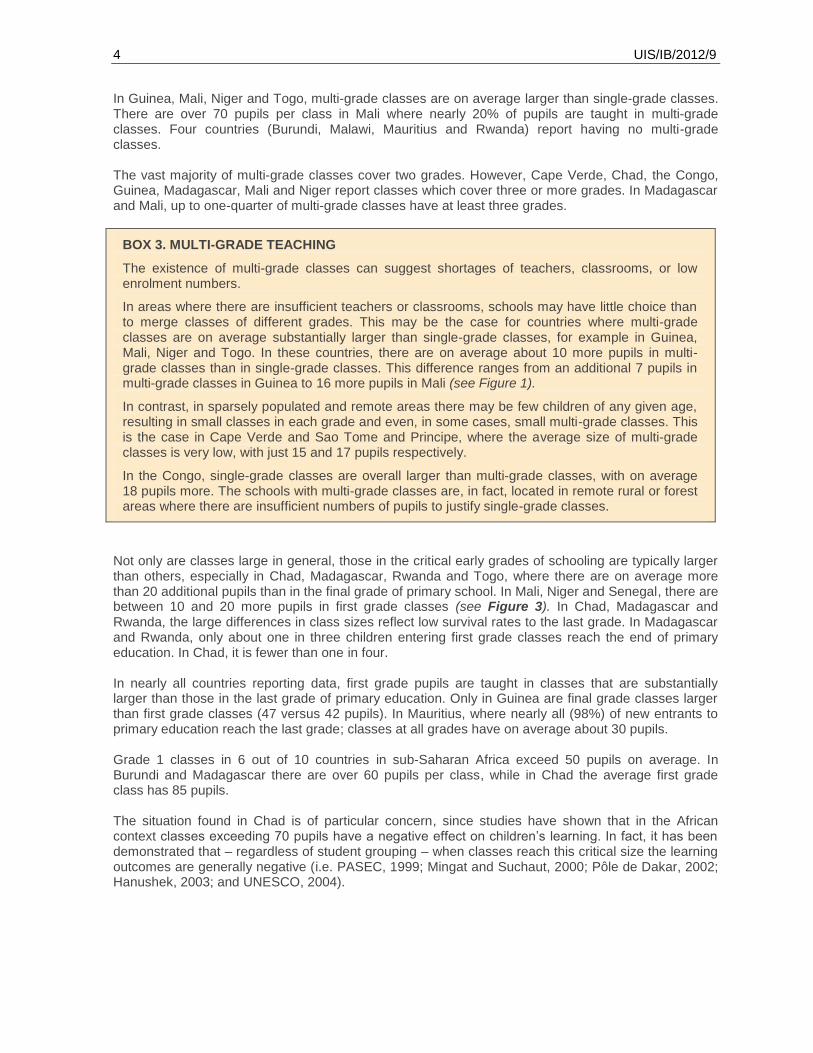
In addition to being large, many primary classes in sub-Saharan Africa are multi-grade classes covering two or more grades in the same classroom with the same teacher. In most countries reporting data, at least 10% of pupils are taught in such classes. This number reaches nearly 50% in Chad (see Figure 2). FIGURE 2. PUPILS IN MULTI-GRADE PRIMARY-LEVEL CLASSES, 2010 OR LATEST YEAR
16 6
1012
1518 18
2528
32
46
0
10
20
30
40
50
Sao
To
me
/Pri
nci
pe
Gu
ine
a
Cap
e V
erd
e
Bu
rkin
a Fa
so
Sen
egal
Togo
Nig
er
Mal
i
An
gola
Mad
agas
car
Co
ngo
Ch
ad
%
Source: UNESCO Institute for Statistics database.
Source: UNESCO Institute for Statistics database.
4 UIS/IB/2012/9
In Guinea, Mali, Niger and Togo, multi-grade classes are on average larger than single-grade classes. There are over 70 pupils per class in Mali where nearly 20% of pupils are taught in multi-grade classes. Four countries (Burundi, Malawi, Mauritius and Rwanda) report having no multi-grade classes. The vast majority of multi-grade classes cover two grades. However, Cape Verde, Chad, the Congo, Guinea, Madagascar, Mali and Niger report classes which cover three or more grades. In Madagascar and Mali, up to one-quarter of multi-grade classes have at least three grades.
BOX 3. MULTI-GRADE TEACHING
The existence of multi-grade classes can suggest shortages of teachers, classrooms, or low enrolment numbers.
In areas where there are insufficient teachers or classrooms, schools may have little choice than to merge classes of different grades. This may be the case for countries where multi-grade classes are on average substantially larger than single-grade classes, for example in Guinea, Mali, Niger and Togo. In these countries, there are on average about 10 more pupils in multi-grade classes than in single-grade classes. This difference ranges from an additional 7 pupils in multi-grade classes in Guinea to 16 more pupils in Mali (see Figure 1).
In contrast, in sparsely populated and remote areas there may be few children of any given age, resulting in small classes in each grade and even, in some cases, small multi-grade classes. This is the case in Cape Verde and Sao Tome and Principe, where the average size of multi-grade classes is very low, with just 15 and 17 pupils respectively.
In the Congo, single-grade classes are overall larger than multi-grade classes, with on average 18 pupils more. The schools with multi-grade classes are, in fact, located in remote rural or forest areas where there are insufficient numbers of pupils to justify single-grade classes.
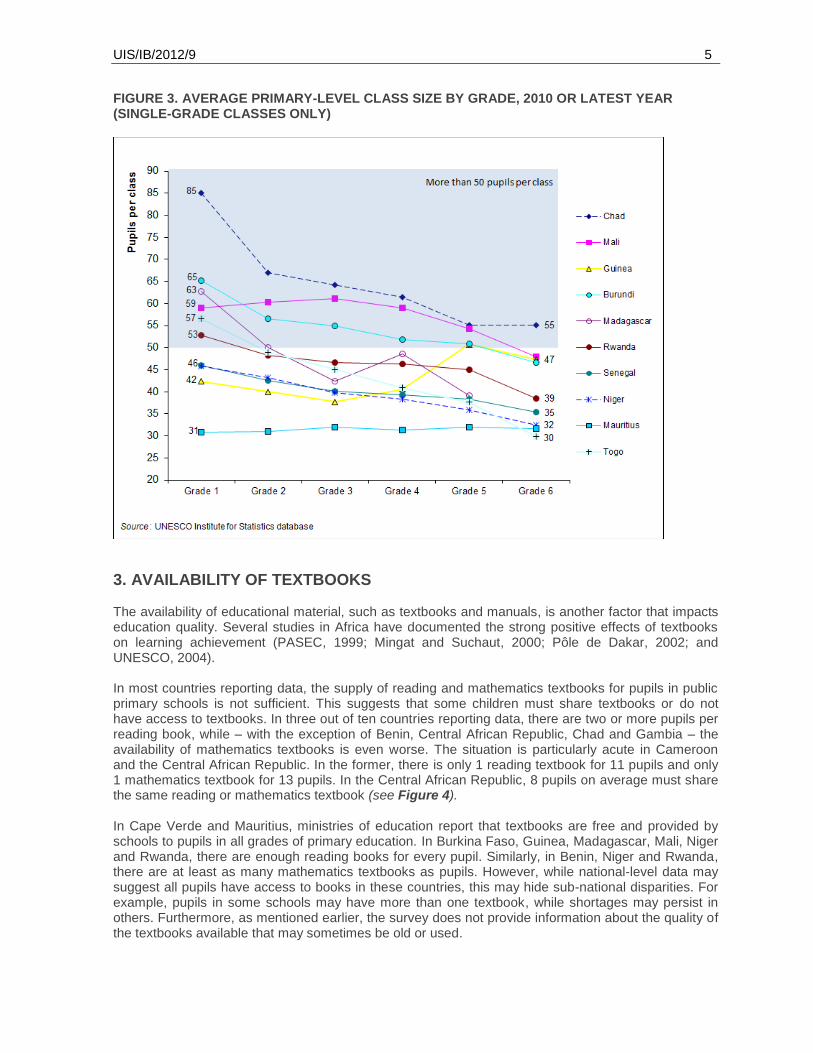
Not only are classes large in general, those in the critical early grades of schooling are typically larger than others, especially in Chad, Madagascar, Rwanda and Togo, where there are on average more than 20 additional pupils than in the final grade of primary school. In Mali, Niger and Senegal, there are between 10 and 20 more pupils in first grade classes (see Figure 3). In Chad, Madagascar and Rwanda, the large differences in class sizes reflect low survival rates to the last grade. In Madagascar and Rwanda, only about one in three children entering first grade classes reach the end of primary education. In Chad, it is fewer than one in four. In nearly all countries reporting data, first grade pupils are taught in classes that are substantially larger than those in the last grade of primary education. Only in Guinea are final grade classes larger than first grade classes (47 versus 42 pupils). In Mauritius, where nearly all (98%) of new entrants to primary education reach the last grade; classes at all grades have on average about 30 pupils. Grade 1 classes in 6 out of 10 countries in sub-Saharan Africa exceed 50 pupils on average. In Burundi and Madagascar there are over 60 pupils per class, while in Chad the average first grade class has 85 pupils. The situation found in Chad is of particular concern, since studies have shown that in the African context classes exceeding 70 pupils have a negative effect on children’s learning. In fact, it has been demonstrated that – regardless of student grouping – when classes reach this critical size the learning outcomes are generally negative (i.e. PASEC, 1999; Mingat and Suchaut, 2000; Pôle de Dakar, 2002; Hanushek, 2003; and UNESCO, 2004).
UIS/IB/2012/9 5
FIGURE 3. AVERAGE PRIMARY-LEVEL CLASS SIZE BY GRADE, 2010 OR LATEST YEAR (SINGLE-GRADE CLASSES ONLY)
3. AVAILABILITY OF TEXTBOOKS The availability of educational material, such as textbooks and manuals, is another factor that impacts education quality. Several studies in Africa have documented the strong positive effects of textbooks on learning achievement (PASEC, 1999; Mingat and Suchaut, 2000; Pôle de Dakar, 2002; and UNESCO, 2004). In most countries reporting data, the supply of reading and mathematics textbooks for pupils in public primary schools is not sufficient. This suggests that some children must share textbooks or do not have access to textbooks. In three out of ten countries reporting data, there are two or more pupils per reading book, while – with the exception of Benin, Central African Republic, Chad and Gambia – the availability of mathematics textbooks is even worse. The situation is particularly acute in Cameroon and the Central African Republic. In the former, there is only 1 reading textbook for 11 pupils and only 1 mathematics textbook for 13 pupils. In the Central African Republic, 8 pupils on average must share the same reading or mathematics textbook (see Figure 4). In Cape Verde and Mauritius, ministries of education report that textbooks are free and provided by schools to pupils in all grades of primary education. In Burkina Faso, Guinea, Madagascar, Mali, Niger and Rwanda, there are enough reading books for every pupil. Similarly, in Benin, Niger and Rwanda, there are at least as many mathematics textbooks as pupils. However, while national-level data may suggest all pupils have access to books in these countries, this may hide sub-national disparities. For example, pupils in some schools may have more than one textbook, while shortages may persist in others. Furthermore, as mentioned earlier, the survey does not provide information about the quality of the textbooks available that may sometimes be old or used.

6 UIS/IB/2012/9
FIGURE 4. PRIMARY PUPIL TEXTBOOK RATIO FOR READING AND MATHEMATICS, 2010 OR LATEST YEAR
11.2
1.1
1.4
1.3
0.8
Source : UNESCO Institute for Statistics database
3.6
1.0
1.0
8.0
2.9
2.7
2.4
13.1
7.9
3.0
2.6
0.3
0.8
2.3
2.4 3.2
2.1
2.0Côte d'IvoireGambiaUganda
1.5
DR CongoEthiopia
Congo 2.1
CameroonC. African Rep.
Angola
ChadTogo
Mauritius
1.0
1.0
Sao Tome/PrincipeBenin
GuineaNigerMali
Cape Verde
Pupils per
mathematics
textbook
Pupils per
reading
textbook
1.3
1.1
1.9
2.0
1.8
1.8
1.5
1.0
1.0
1.1
1.1
Rwanda
Mozambique
0.8
0.4
1.3
1.1
MadagascarBurkina Faso
1.0
1.0
4. ACCESS TO BASIC SERVICES IN SCHOOLS The level and quality of basic services in a school are important factors that can have a significant and positive impact both on child health and education outcomes. Studies show that safe, adequate water and sanitation facilities in schools, coupled with hygiene education, reduce the incidence of diarrhea and other water-borne diseases (UNICEF, 2009). Furthermore, inadequate access to sanitation may have a negative impact on enrolment and attendance, especially of girls, and on school performance. Many schools in sub-Saharan Africa, however, have little or no access to basic services such as clean water, adequate sanitation facilities or electricity. Adequate (improved) sanitation
2
A lack of toilets which are clean, safe and ideally segregated is bound to discourage children, especially girls, from attending school regularly. However, for many public primary schools in the region this is the norm. In 1 out of 3 countries with available data, more than one-half of schools have no toilets. Shortages are particularly severe in five countries: Chad, Côte d’Ivoire, Equatorial Guinea, Madagascar and Niger, where at least 60% of schools are without toilets (see Figures 5 and 6).
2 Access to adequate (or ’improved’) sanitation includes sustainable access to pit latrines or improved pit
latrines, flush toilets, pour-flush toilets or composting toilets.

UIS/IB/2012/9 7
FIGURE 5. PRIMARY SCHOOLS WITHOUT TOILETS, 2010 OR LATEST YEAR
FIGURE 6. PRIMARY SCHOOLS WITH SINGLE-SEX AND MIXED-SEX TOILETS, 2010 OR LATEST YEAR
0 10 20 30 40 50 60 70 80 90 100
Rwanda
Mauritius
Ethiopia
Burundi
Cape Verde
DR Congo
Burkina Faso
Guinea
Eritrea
Gabon
C. African Rep.
Cameroon
Ghana
Senegal
Benin
Mali
Congo
Togo
Côte d’Ivoire
Madagascar
Equatorial Guinea
Chad
Niger
Schools without toilets (%)
More than half of schools have no toilets
More than one third of schools have no toilets
0
0
10
13
14
30
34
35
39
41
43
44
51
51
55
60
60
66
72
75
46
44
29
Source: UNESCO Institute for Statistics database.
Source: UNESCO Institute for Statistics database.
8 UIS/IB/2012/9
On the other hand, schools in Cape Verde, Mauritius and Rwanda seem to be well equipped, with all schools having single-sex toilets in Mauritius and Rwanda. While sanitation facilities are rather common in Burundi and Ethiopia with around 90% of schools being equipped, the majority of these schools does not have single-sex or segregated toilets. Nevertheless, it should be noted that schools in general provide more access to improved sanitation than is available to households in sub-Saharan Africa, where less than one-third of the population has access (UNICEF, 2012). Potable (improved) water
3
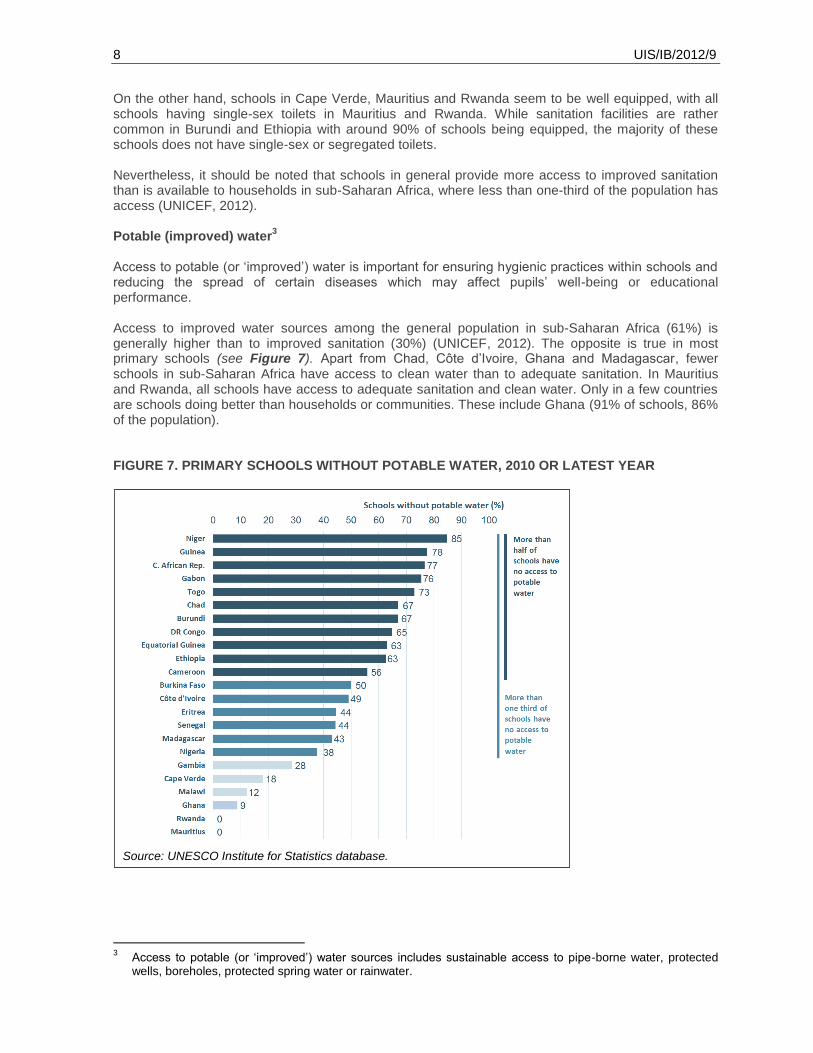
Access to potable (or ‘improved’) water is important for ensuring hygienic practices within schools and reducing the spread of certain diseases which may affect pupils’ well-being or educational performance. Access to improved water sources among the general population in sub-Saharan Africa (61%) is generally higher than to improved sanitation (30%) (UNICEF, 2012). The opposite is true in most primary schools (see Figure 7). Apart from Chad, Côte d’Ivoire, Ghana and Madagascar, fewer schools in sub-Saharan Africa have access to clean water than to adequate sanitation. In Mauritius and Rwanda, all schools have access to adequate sanitation and clean water. Only in a few countries are schools doing better than households or communities. These include Ghana (91% of schools, 86% of the population). FIGURE 7. PRIMARY SCHOOLS WITHOUT POTABLE WATER, 2010 OR LATEST YEAR
3 Access to potable (or ‘improved’) water sources includes sustainable access to pipe-borne water, protected
wells, boreholes, protected spring water or rainwater.
Source: UNESCO Institute for Statistics database.

UIS/IB/2012/9 9
Electricity In sub-Saharan Africa, some 585 million people (58%) do not have access to electricity at home (IEA, 2011). The majority of primary schools are also without electricity. The exception is Mauritius (among the countries reporting data), where all schools are equipped with electricity. In Cape Verde and Gabon, it is around 50%, but in the rest of the region less than one-third of schools have electricity. Lack of access is most acute in Burkina Faso, Burundi, Cameroon, the Democratic Republic of the Congo, Gambia, Guinea, Malawi, Niger and Togo, where more than 80% of schools lack electricity (see Figure 8). FIGURE 8. PRIMARY SCHOOLS WITHOUT ELECTRICITY, 2010 OR LATEST YEAR
5. TEACHER TRAINING AND ATTRITION RATES Since the late 1990s, data on trained teachers have been available internationally. A trained teacher is defined as “a teacher who has received at least the minimum organized teacher-training (pre-service or in-service) required for teaching at the relevant level”. However, since minimum standards of training can vary greatly between countries, these indicators are often not directly comparable. The UIS regional questionnaire collected data on the number of graduates from accredited pre-service teacher-training programmes. These graduates will often have received more than the minimum level of training required nationally and are typically regarded as fully qualified to teach. Even though there may be differences between teacher-training programmes in different countries, they are likely to be less variable than the minimum standards of training required. In sub-Saharan Africa, the demand for teachers is rising rapidly as the school-age population continues to grow, more children enrol in schools and fewer leave school early. Recent projections by the UIS show that to meet the rising demand for school places, sub-Saharan Africa will need to recruit more than 1.1 million additional primary school teachers between 2009 and 2015 to ensure that every child has access to and can complete a full course of primary education (UIS, 2011a).
Source: UNESCO Institute for Statistics database.
10 UIS/IB/2012/9
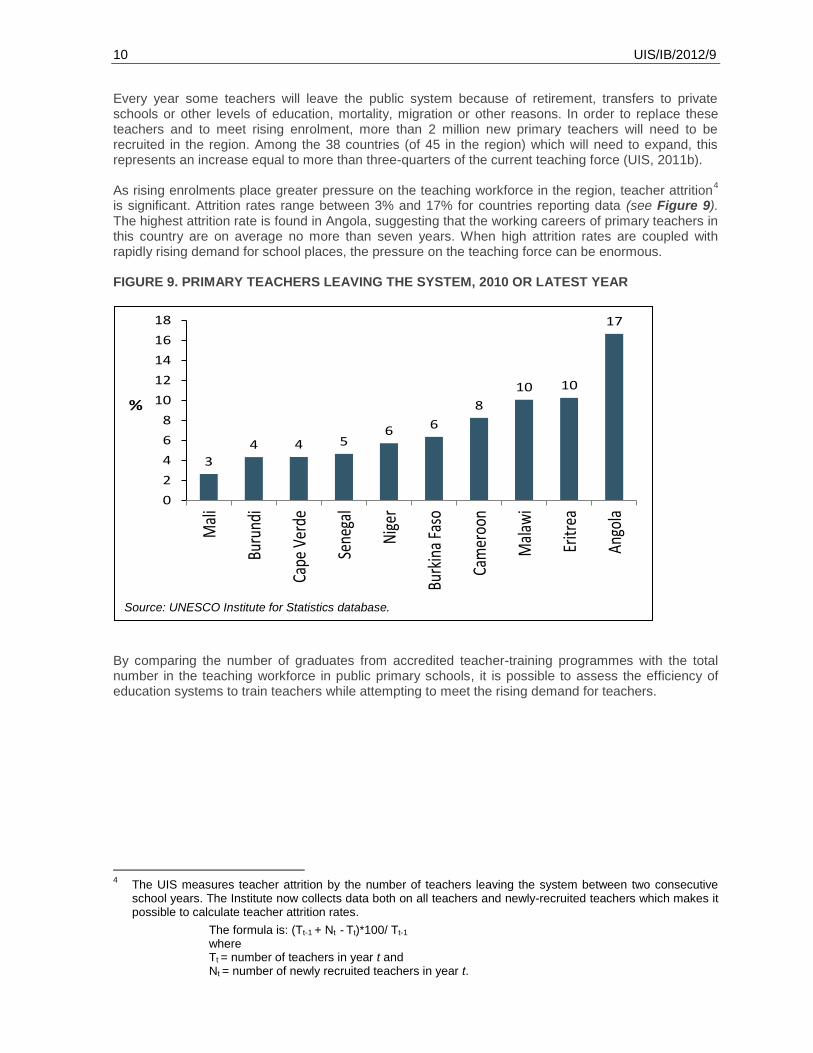
Every year some teachers will leave the public system because of retirement, transfers to private schools or other levels of education, mortality, migration or other reasons. In order to replace these teachers and to meet rising enrolment, more than 2 million new primary teachers will need to be recruited in the region. Among the 38 countries (of 45 in the region) which will need to expand, this represents an increase equal to more than three-quarters of the current teaching force (UIS, 2011b). As rising enrolments place greater pressure on the teaching workforce in the region, teacher attrition
4
is significant. Attrition rates range between 3% and 17% for countries reporting data (see Figure 9). The highest attrition rate is found in Angola, suggesting that the working careers of primary teachers in this country are on average no more than seven years. When high attrition rates are coupled with rapidly rising demand for school places, the pressure on the teaching force can be enormous. FIGURE 9. PRIMARY TEACHERS LEAVING THE SYSTEM, 2010 OR LATEST YEAR
By comparing the number of graduates from accredited teacher-training programmes with the total number in the teaching workforce in public primary schools, it is possible to assess the efficiency of education systems to train teachers while attempting to meet the rising demand for teachers.
4 The UIS measures teacher attrition by the number of teachers leaving the system between two consecutive
school years. The Institute now collects data both on all teachers and newly-recruited teachers which makes it possible to calculate teacher attrition rates.
The formula is: (Tt-1 + Nt - Tt)*100/ Tt-1
where
Tt = number of teachers in year t and Nt = number of newly recruited teachers in year t.
3
4 4 56 6
8
10 10
17
0
2
4
6
8
10
12
14
16
18
Mal
i
Buru
ndi
Cape
Ver
de
Sene
gal
Nig
er
Burk
ina
Faso
Cam
eroo
n
Mal
awi
Eritr
ea
Ango
la
%
Source: UNESCO Institute for Statistics database.
UIS/IB/2012/9 11
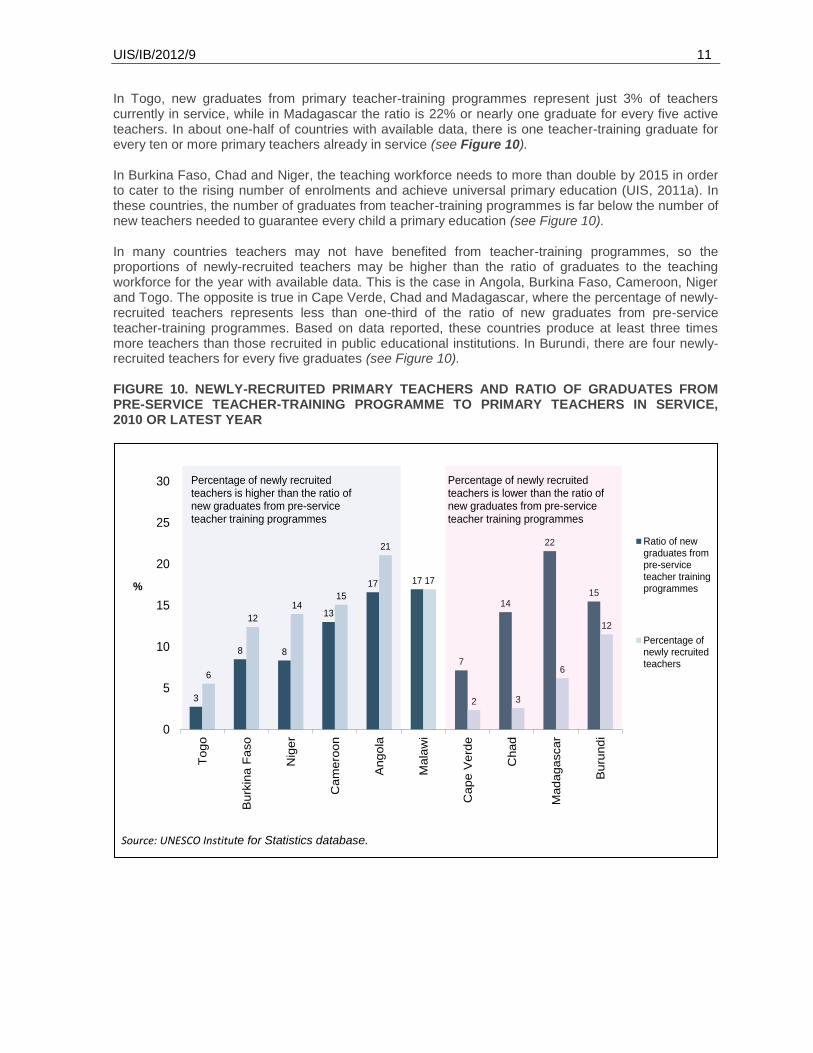
In Togo, new graduates from primary teacher-training programmes represent just 3% of teachers currently in service, while in Madagascar the ratio is 22% or nearly one graduate for every five active teachers. In about one-half of countries with available data, there is one teacher-training graduate for every ten or more primary teachers already in service (see Figure 10). In Burkina Faso, Chad and Niger, the teaching workforce needs to more than double by 2015 in order to cater to the rising number of enrolments and achieve universal primary education (UIS, 2011a). In these countries, the number of graduates from teacher-training programmes is far below the number of new teachers needed to guarantee every child a primary education (see Figure 10). In many countries teachers may not have benefited from teacher-training programmes, so the proportions of newly-recruited teachers may be higher than the ratio of graduates to the teaching workforce for the year with available data. This is the case in Angola, Burkina Faso, Cameroon, Niger and Togo. The opposite is true in Cape Verde, Chad and Madagascar, where the percentage of newly-recruited teachers represents less than one-third of the ratio of new graduates from pre-service teacher-training programmes. Based on data reported, these countries produce at least three times more teachers than those recruited in public educational institutions. In Burundi, there are four newly-recruited teachers for every five graduates (see Figure 10). FIGURE 10. NEWLY-RECRUITED PRIMARY TEACHERS AND RATIO OF GRADUATES FROM PRE-SERVICE TEACHER-TRAINING PROGRAMME TO PRIMARY TEACHERS IN SERVICE, 2010 OR LATEST YEAR
3
8 8
13
17 17
7
14
22
15
6
12
1415
21
17
2 3
6
12
0
5
10
15
20
25
30
To
go
Bu
rkin
a F
aso
Nig
er
Ca
me
roo
n
An
go
la
Mala
wi
Ca
pe
Ve
rde
Ch
ad
Mad
ag
asca
r
Bu
run
di
%
Ratio of newgraduates frompre-serviceteacher trainingprogrammes
Percentage ofnewly recruitedteachers
Percentage of newly recruited teachers is higher than the ratio of new graduates from pre-service teacher training programmes
Percentage of newly recruited teachers is lower than the ratio of new graduates from pre-service teacher training programmes
Source: UNESCO Institute for Statistics database.

12 UIS/IB/2012/9
Newly-recruited teachers represent 10% or less of the current teaching force in Cape Verde, Chad, Madagascar and Togo. However, given the current projected teacher demand in the region, the number of new teachers recruited every year should be higher than the levels observed in almost all of these countries. Especially in Burkina Faso, Chad and Niger, which need to double their teacher workforce to reach universal primary education – an increase of approximately 20% of the actual existing staff should occur every year until 2015. In 7 out of 10 countries that provided data, most new staff are trained. In Burundi, Cape Verde, Chad, Eritrea and Senegal, all newly-recruited staff have undergone some form of teacher training. Gender Gender is another important aspect of teacher recruitment. According to some studies, the presence of female teachers in the classroom is associated with higher levels of pupil performance (Elley, 1993; Makuwa, 2005), as well as increased rates of retention, progression and completion of primary education (UIS, 2011b; UIS, 2010). While women generally make up the majority of primary teachers in the world, there are more male teachers in sub-Saharan Africa. It has the lowest percentage of female primary teachers (43%) compared to all other regions, while Central Asia as well as North America and Western Europe have the highest proportions of female primary teachers – 89% and 83%, respectively (UIS, 2011b). As shown in Figure 11, women in Burundi and Ghana represent about 50% of newly-recruited teachers. The share of women among newly-recruited teachers is the highest in Angola (57%). The share is between 30% and 46% in Chad, Malawi, Madagascar, Niger and Senegal and falls below 30% in Eritrea and Mali. The gender balance observed among new staff is in fact similar to the current workforce, except for Angola, Chad and Ghana. In these three countries, the female share is far higher among new recruits than among active teachers.
FIGURE 11. NEWLY-RECRUITED FEMALE PRIMARY TEACHERS, 2010 OR LATEST YEAR
28 2931
38 39
45 4649 51
57
0
10
20
30
40
50
60
Eritr
ea
Mali
Cha
d
Mala
wi
Sene
gal
Nig
er
Mada
gascar
Buru
ndi
Ghana
Ango
la
% o
f n
ew
ly r
ecru
ite
d te
ach
ers
Source: UNESCO Institute for Statistics database.

UIS/IB/2012/9 13
6. CONCLUSIONS Some key findings have emerged in the first round of the regional survey:
Most pupils do not have textbooks of their own and the situation is critical in Cameroon and the Central African Republic, where there is just 1 reading textbook for every 13 and 8 pupils, respectively.
Primary-level class sizes are large, exceeding 40 pupils in 8 out of 10 countries and vary substantially across the continent.
Classes in the early years of schooling are typically larger than others, especially in Chad, Madagascar and Togo where there are 20 or more pupils in first grade classes than in the last grade.
The majority of countries have at least some multi-grade classes. While a minority of pupils is enrolled in such classes, more than one-quarter of pupils in Angola and Madagascar, around one-third in the Congo, and nearly one-half in Chad are taught in such classes.
Despite relatively high numbers of new primary teachers in some countries, the level of recruitment in the region still lags behind demand if universal primary education is to be achieved by 2015. Angola, Cameroon, the Congo and Malawi have the highest percentages of newly-recruited teachers among the total number of teachers in service (above15%).
Sanitation facilities/toilets, electricity and potable water are basic services that should be available in all schools. However, there is an overall shortage of these services among schools in the region. In Guinea, Niger and Togo, the majority of schools (50% or more) lack these three basic resources.
Given their link to educational outcomes, the survey results can be used for overall programme design and policy development in order to improve the quality of education in schools of the region.
14 UIS/IB/2012/9
REFERENCES African Union (2009). The Plan of Action for the Second Decade of Education for Africa http://www.africaunion.org/root/ar/index/INDICATORS%20AND%20DATA%20FOR%20MONITORING%20-REPORT.pdf Elley, W.B. (1993). The IEA Study of Reading Literacy: Achievement and Instruction in Thirty –Two School Systems. Oxford: Pergamon. Glass, G. V., L. S. Cahen, M. L. Smith and N. N. Filby (1982). School Class Size: Research and Policy. Beverly Hills: Sage Publication. Hanushek, E.A. (2003). “The failure if Input-based Schooling Policies”, Economic Journal, Vol 113, Nº 485 February: 64-98. International Energy Agency (IEA) (2011). World Energy Outlook 2011, Table 1 of paper on Energy for All http://www.iea.org/Papers/2011/weo2011_energy_for_all.pdf Makuwa, D. (2005). The SACMEQ II project in Namibia: a study of the conditions of schooling and the quality of education. Namibia: Ministry of Education. Mingat A. and B. Suchaut (2000). Les systèmes éducatifs africains. Une analyse économique comparative. De Boeck Université. PASEC (1999). “Les facteurs de l’efficacité dans l’enseignement primaire : Les résultats du programme PASEC sur neuf pays d’Afrique et de l’Océan Indien”, CONFEMEN (www.confemen.org) Pôle de Dakar (2002) Scolarisation primaire universelle : un objectif pour tous, document statistique pour la huitième conférence des ministres de l’éducation d’Afrique (6-12 décembre 2002, Dar es Salam), UNESCO-BREDA, 124 p. (www.poledakar.org) Pôle de Dakar (2005). Éducation Pour Tous en Afrique, Repères pour l’action, 300 p. United Nations Children’s Fund (UNICEF) (2009). Child-Friendly schools Manual (online at http://www.unicef.org/publications/files/Child_Friendly_Schools_Manual_EN_040809.pdf) United Nations Children’s Fund (UNICEF) (2012). State of the World’s Children. New York: UNICEF. United Nations Educational, Scientific and Cultural Organization (2004). Education Pour Tous. L’exigence de qualité. Rapport mondial de suivi de l’EPT 2004/05. UNESCO Institute for Statistics (UIS) (2010). Global Education Digest 2010. Montreal: UIS. _____(UIS) (2011a). “The Global Demand for Primary Teachers – 2011 Update”. UIS Information Sheet No. 6. Montreal: UIS. _____(UIS) (2011b). Global Education Digest 2011. Montreal: UIS.
Please consult the UIS website at www.uis.unesco.org to access the UIS Data Centre
and subscribe to eAlerts on the Institute’s latest publications and data releases.