Embed Size (px)
Citation preview
SCHOLAR Study Guide
CfE Advanced Higher BusinessManagementUnit 3
Authored by:Alan Hamilton (Stirling High School)
Reviewed by:Frances McCrudden (The Mary Erskine School)
Previously authored by:Linda Alison
Jane McFarlane
Heriot-Watt University
Edinburgh EH14 4AS, United Kingdom.
First published 2015 by Heriot-Watt University.
This edition published in 2016 by Heriot-Watt University SCHOLAR.
Copyright © 2016 SCHOLAR Forum.
Members of the SCHOLAR Forum may reproduce this publication in whole or in part foreducational purposes within their establishment providing that no profit accrues at any stage,Any other use of the materials is governed by the general copyright statement that follows.
All rights reserved. No part of this publication may be reproduced, stored in a retrieval systemor transmitted in any form or by any means, without written permission from the publisher.
Heriot-Watt University accepts no responsibility or liability whatsoever with regard to theinformation contained in this study guide.
Distributed by the SCHOLAR Forum.
SCHOLAR Study Guide Unit 3: CfE Advanced Higher Business Management
1. CfE Advanced Higher Business Management Course Code: C710 77
ISBN 978-1-911057-12-3
Print Production and Fulfilment in UK by Print Trail www.printtrail.com

AcknowledgementsThanks are due to the members of Heriot-Watt University's SCHOLAR team who planned andcreated these materials, and to the many colleagues who reviewed the content.
We would like to acknowledge the assistance of the education authorities, colleges, teachersand students who contributed to the SCHOLAR programme and who evaluated these materials.
Grateful acknowledgement is made for permission to use the following material in theSCHOLAR programme:
The Scottish Qualifications Authority for permission to use Past Papers assessments.
The Scottish Government for financial support.
The content of this Study Guide is aligned to the Scottish Qualifications Authority (SQA)curriculum.
All brand names, product names, logos and related devices are used for identification purposesonly and are trademarks, registered trademarks or service marks of their respective holders.


i
Contents
1 Research 11.1 Importance of referencing . . . . . . . . . . . . . . . . . . . . . . . . . 21.2 When must I provide a citation? . . . . . . . . . . . . . . . . . . . . . . 21.3 When do I not need to provide a citation? . . . . . . . . . . . . . . . . . 41.4 Plagiarism . . . . . . . . . . . . . . . . . . . . . . . . . . . . . . . . . . 41.5 How to reference . . . . . . . . . . . . . . . . . . . . . . . . . . . . . . 51.6 Verify sources of evidence . . . . . . . . . . . . . . . . . . . . . . . . . 81.7 Understand the reasons for using a bibliography . . . . . . . . . . . . . 91.8 Reference list for this topic . . . . . . . . . . . . . . . . . . . . . . . . . 91.9 Summary . . . . . . . . . . . . . . . . . . . . . . . . . . . . . . . . . . . 101.10 End of topic test . . . . . . . . . . . . . . . . . . . . . . . . . . . . . . . 11
2 Analytical research 132.1 Decision making . . . . . . . . . . . . . . . . . . . . . . . . . . . . . . . 142.2 Force field analysis . . . . . . . . . . . . . . . . . . . . . . . . . . . . . 152.3 SWOT analysis . . . . . . . . . . . . . . . . . . . . . . . . . . . . . . . 172.4 Critical path analysis (CPA) . . . . . . . . . . . . . . . . . . . . . . . . . 192.5 Gantt charts . . . . . . . . . . . . . . . . . . . . . . . . . . . . . . . . . 212.6 Summary . . . . . . . . . . . . . . . . . . . . . . . . . . . . . . . . . . . 242.7 End of topic test . . . . . . . . . . . . . . . . . . . . . . . . . . . . . . . 25
3 Evaluating financial information 273.1 Reported financial information . . . . . . . . . . . . . . . . . . . . . . . 283.2 Annual reports . . . . . . . . . . . . . . . . . . . . . . . . . . . . . . . . 323.3 Other information . . . . . . . . . . . . . . . . . . . . . . . . . . . . . . 333.4 Summary . . . . . . . . . . . . . . . . . . . . . . . . . . . . . . . . . . . 343.5 End of topic test . . . . . . . . . . . . . . . . . . . . . . . . . . . . . . . 35
Glossary 37
Answers to questions and activities 391 Research . . . . . . . . . . . . . . . . . . . . . . . . . . . . . . . . . . 392 Analytical research . . . . . . . . . . . . . . . . . . . . . . . . . . . . . 413 Evaluating financial information . . . . . . . . . . . . . . . . . . . . . . 45


1
Topic 1
Research
Contents
1.1 Importance of referencing . . . . . . . . . . . . . . . . . . . . . . . . . . . . . . 2
1.2 When must I provide a citation? . . . . . . . . . . . . . . . . . . . . . . . . . . 2
1.3 When do I not need to provide a citation? . . . . . . . . . . . . . . . . . . . . . 4
1.4 Plagiarism . . . . . . . . . . . . . . . . . . . . . . . . . . . . . . . . . . . . . . 4
1.5 How to reference . . . . . . . . . . . . . . . . . . . . . . . . . . . . . . . . . . . 5
1.5.1 Referencing tips . . . . . . . . . . . . . . . . . . . . . . . . . . . . . . . 7
1.6 Verify sources of evidence . . . . . . . . . . . . . . . . . . . . . . . . . . . . . 8
1.7 Understand the reasons for using a bibliography . . . . . . . . . . . . . . . . . 9
1.8 Reference list for this topic . . . . . . . . . . . . . . . . . . . . . . . . . . . . . 9
1.9 Summary . . . . . . . . . . . . . . . . . . . . . . . . . . . . . . . . . . . . . . . 10
1.10 End of topic test . . . . . . . . . . . . . . . . . . . . . . . . . . . . . . . . . . . 11
Learning objectives
After studying this topic, you should be able to:
• understand the importance of referencing when presenting findings;
• give examples of how to reference work;
• discuss issues around plagiarism and acknowledging the work of others;
• verify sources of evidence;
• understand the reasons for using a bibliography.
2 TOPIC 1. RESEARCH
1.1 Importance of referencing
Some material in this topic is reprinted from the 'Harvard Style Citing & ReferencingStudent Guide' with kind permission of Heriot-Watt University (http://bit.ly/1WA6i5P).
Citing and referencing allows you to acknowledge other peoples work. It also allowsyou to demonstrate that:
• you have gathered evidence to back up your ideas and arguments;
• you have used credible, good quality sources;
• you have read from a large number of sources;
• you have used sources that are appropriate to your level of study.
In addition, it allows your teacher to differentiate between your own work and the work ofothers and makes it easy for your teacher, and the SQA, to locate and verify the sourcesyou have used.
There are many different ways to reference ideas within a formal piece of work. The SQAstipulate that you can use any referencing style as long as you are consistent throughoutyour report. In this scholar unit the Harvard Reference style will be explained.
1.2 When must I provide a citation?
A citation is an acknowledgement that you have included the research of others withinyour work. You need to cite your source whenever you:
• use ideas from other people in your work;
• refer to the work of another person;
• quote from a book or journal;
• use market research from government or others.
Direct quotes are needed when you use another person's ideas in their own words. Ifyou include information exactly as it appears in a source you need to indicate this byusing quotation marks.
Short quotes can be included within the paragraph of text using quotation marks. Longquotes should be treated as a separate block of text, indented from the left margin, asthe example shows. Use p. to indicate a page number and pp. to indicate a range ofpages.
© HERIOT-WATT UNIVERSITY

TOPIC 1. RESEARCH 3
For example:
"60% of those surveyed said that they had never heard of other Highland Springproducts besides their bottled still water. This tells me that Highland Spring donot effectively advertise their variety of products. This means that they could loseout on additional profits due to their poor advertising of these other products."(Patterson 2014, p.34)
Paraphrasing is when you present another person's ideas in your own words but withoutthe need for quotation marks as you are not quoting directly. Using the example above,the paragraph below has been paraphrased. Its meaning is the same as the originalparagraph and so a citation must be provided:
More than half of the people surveyed had never heard of other Highland Springproducts besides their bottled still water. This could imply that the company doesnot effectively advertise their full product range resulting in additional productsbeing less profitable. (Patterson 2014, p.34)
Summarising is when you express another person's ideas using less words. Thefollowing example shows a passage from a book that has been shortened. Its meaning,however, is the same as the original, requiring a citation.
Original:
The Homeplus Group started in 1999 as a hypermarket only business and todayoperates as a multichannel retailer. The Homeplus Group operates online andthrough 1,075 outlets, of which 140 are hypermarkets, 609 are supermarketsand 326 are convenience stores (the supermarkets and convenience stores beinga mixture of directly owned and franchised). It also operates 139 shoppingmalls adjacent to its hypermarkets, with over 6,500 tenant leases. (Tesconews release (http://www.tescoplc.com/index.asp?pageid=17&newsid=1209) [Lastaccessed September 2015]).
Summary:
The Homeplus Group have operated for over 15 years and operate a number ofoutlets, consisting of hypermarkets, superstores and convenience stores. (Tesconews release (http://bit.ly/1iOauA2) [Last accessed September 2015]).
Asda
Go onlineThe following article extract comes from the Asda press centre (http://bit.ly/1jLoyvc) :
Speaking at an event in London this morning, Asda President and CEO of Asda,Andy Clarke reiterated his commitment to the company's five year strategy toredefine value retailing in a challenging market.
He stated that while there were signs of 'real and sustainable economic recovery'2015 was proving to be the most challenging year yet for traditional supermarkets.
© HERIOT-WATT UNIVERSITY
4 TOPIC 1. RESEARCH
Joined by Chief Financial Officer Alex Russo, they spoke about the pace andscale of change in the market and customer behaviours, while highlighting a solid,balanced Asda business.
Clarke commented: "This last quarter has been unprecedented. We have seendeflation in the market and exponential shifts in the industry. Although I still believethat 18 months ago we did a great job of predicting changes, we could not haveforeseen what's happened to others and the moves they have had to make in orderto restore their business - creating an impact on us in the short-term."
Answer the following questions relating to the above article and include a citation in youranswer.
Q1: Provide a direct quote to demonstrate Asda did a good job 18 months ago.
. . . . . . . . . . . . . . . . . . . . . . . . . . . . . . . . . . . . . . . . . .
Q2: Create a paraphrased version of the extract to demonstrate the job Asda did 18months ago.
. . . . . . . . . . . . . . . . . . . . . . . . . . . . . . . . . . . . . . . . . .
1.3 When do I not need to provide a citation?
You do not need to provide a citation when you are expressing your own ideas,arguments or conclusions or where you have created a survey yourself and are reportingthe results.
You should provide a citation when you are including information in your report that youhave found in your secondary research, for example:
Glasgow is in the west of Scotland and has a population of approximately593,000. (Area profiles on Scotland's Census, available online: (http://www.scotlandscensus.gov.uk/ods-web/area.html) [accessed 28 July 2015])
1.4 Plagiarism
The definition of plagiarism is using someone else's work and letting people think that itis your own. If you do not reference other people's ideas or quotes you may be accusedof plagiarism. It is the equivalent of stealing, often referred to as academic theft. To avoidplagiarism you should always note accurately and fully the details of all the sources youuse.
If you follow the correct referencing methods in this topic then you should avoidallegations of plagiarism. Be careful also that you do not give your work out to others -if they then copy your work you could be accused of plagiarism of their work.
© HERIOT-WATT UNIVERSITY

TOPIC 1. RESEARCH 5
SQA marking
Your teacher is used to your writing style, and can quickly tell if you have takeninformation from a book or the internet without referencing. The SQA employ teachersto mark your work. They have been marking for a number of years and are used toreading hundreds of Business Management essays. They can quickly spot a sourcethat has not been referenced.
Marking is carried out electronically. SQA have anti-plagiarism software that canhighlight any source that has been used but not referenced.
The flyleaf that accompanies your Advanced Higher Business Management report willrequire that you sign a declaration to say that the work you are submitting is your own.That doesn't just mean that you did all the work yourself, it also means that the work youare submitting contains the appropriate citations.
1.5 How to reference
There are a number of ways to reference your work. Any type of referencing isacceptable in your report as long as you are consistent throughout it. A popular methodis Harvard referencing, whose origins come from the American University of the samename. The system traces back to the eminent zoologist Edward Laurens Mark (1847-1946), Hersey professor of anatomy and director of Harvard's zoological laboratory untilhis retirement in 1921. (Chernin, Eli (1988). The 'Harvard system': a mystery dispelled,British Medical Journal. October 22, 1988, pp. 1062-1063).
Citations can appear within the text, at the end of a sentence or as a footnote at thebottom of the page. The same citation, with more information, should also be includedin the bibliography at the end of the report.
In-text citations
In-text citations appear in the body of your work. In-text citations from a book or printedpublication must provide the following information in order:
• the name of the author(s) or editor(s) of the source being cited;
• the publication date (year) of the source being cited;
• the page numbers you have taken material from.
The following text includes an example of a in-text citation:
With reference to capacities, Japan has a range of resources considered'desirable' (Klein, Nicholls, & Thomalla, 2003, p.34), that contribute to them beingone of the pioneers in the prevention of environmental disasters having an impacton the nation.
© HERIOT-WATT UNIVERSITY
6 TOPIC 1. RESEARCH
Bibliography
You must take a note of the name of the book, or publication, and the publisher as thisinformation needs to be added to the bibliography. Remember, the point of referencingis to allow the reader, in your case your examiner, to check your source.
The order of information that you need for a bibliography entry is as follows:
• surname(s) of author(s) and the initial(s) of their first name(s);
• publication date (year);
• book title;
• book edition (where the book is beyond the 1st edition);
• place of publication (town/city);
• publisher name;
• page numbers you have taken information from (if a direct quote or a diagram,picture, etc.).
One example of a bibliography entry is as follows (note that this example does notinclude a book edition or place of publication):
Wing, L., & Gould, J. (1979). Severe impairments of social interaction andassociated abnormalities in children: epidemiology and classification. Journalof Autism and Developmental Disorders, 9, pp. 11-29.
Website references
Text taken from websites is referenced in a similar way to books, for example:
Agency, W. C. (2005, September 27). U.S Not ready for Medical Disaster:Homeland Security Found Potential Failures. Retrieved April 3, 2013, from http://www.theledger.com/article/20050927/NEWS/509270432.
The above example includes the author name, date of publication, page title, dateretrieved, and full URL of the website. With websites, it is important to include thedate you last accessed the site, as the content of the website could change betweenyou writing your essay and the report being marked.
So, these citations within some text:
Autism is held to be a "lifelong developmental disability" (The National AutisticSociety, 2010), and is considered to be a neuro-developmental disorder (Trevarthen,2000)...
would be added to the reference list as:
© HERIOT-WATT UNIVERSITY
TOPIC 1. RESEARCH 7
The National Autistic Society (2010). Autism: What is it? Retrieved January 8,2010, from http://www.nas.org.uk/nas/jsp/polopoly.jsp?d=211.Trevarthen, C. (2000). Autism as a neurodevelopmental disorder affectingcommunication and learning in early childhood: Prenatal origins, post natalcourse and effective educational support. Prostoglandins, Leucotrines andEssential Fatty Acids, 63 (1-2), pp. 41-46.
Much of the information you gather for your assignment is likely to come from onlinenews stories with no author. An example of such as source is referenced as:
BBC (2015) Monsoon tops minimum wage list of shame [online], available: http://www.bbc.co.uk/news/business-34608028 [accessed 25 October 2015]
You can reference the above citation in your project as, for example, "A BBC report(2015) says..."
Online journals
An increasing number of journals can be freely accessed online. Google Scholar (https://scholar.google.co.uk/) is one way to find online articles or books that you may wishto included as part of your research. They are cited and referenced in the same way aspaper book and online web pages. For example:
Taylor, FW (2004) 'Scientific Management' Routledge [online], available: https://books.google.co.uk/books?id=AuLgsZJgSCsC&dq=scientific+management&lr=[accessed 25 October 2015]
Provide a reference
Go onlineQ3: Provide a reference for the ASDA example (http://bit.ly/1jLoyvc) cited in theprevious section:
. . . . . . . . . . . . . . . . . . . . . . . . . . . . . . . . . . . . . . . . . .
1.5.1 Referencing tips
When referencing authors:
• one author is straightforward as, for example, Klein, A., 2003, p. 34;
• two or three authors are written as, for example, Klein, Nicholls, & Thomalla, 2003,p. 34;
• four or more authors are written as, for example, Klein et al, 2003, p. 34.
It doesn't matter whether you use full stops after initials or write p 34 or p.34 - as longas you are consistent throughout.
Make sure you take a note of all the information you need at the time. Finding a great
© HERIOT-WATT UNIVERSITY

8 TOPIC 1. RESEARCH
source is brilliant and will improve your report, but you might not be able to use it ifyou do not take a note of the information needed for the reference and cannot find theoriginal source again later.
A big tip is to write the reference list as you write your report. Unlike your National 5 andHigher Business Management reports, that were researched in class and then writtenup in timed exam conditions, your Advanced Higher report should be written by youthroughout the year, with minimum help from your teacher.
Modern Microsoft Word programs allow you to build your reference list (they call it abibliography) as you write your report and lets you use the Harvard style. MicrosoftOffice has a helpful guide (http://bit.ly/1viYA49) on its website.
You will not be asked about referencing or plagiarism in your final exam, but you will losemarks in your assignment if you do not follow the advice in this guide. Remember, it isimportant to reference to acknowledge your source - failing to do this (and as a resultimplying that a piece of work is your own) could result in zero marks being awarded.
Cold calling
Go online
Q4: Using the Microsoft Word guide and the following three web sources, type up ashort paragraph on cold calling:
• The BBC website (http://bbc.in/1jFw6zx)• The Guardian website (http://bit.ly/1ihFZSr)• Cold calling techniques (http://bit.ly/1GFNoqd)
Use each of the links at least once to create a Harvard Style bibliography. Don't spendtoo long finding quotes, the challenge here is to create a reference list.
. . . . . . . . . . . . . . . . . . . . . . . . . . . . . . . . . . . . . . . . . .
1.6 Verify sources of evidence
As the saying goes, don't believe everything you read in the newspapers. The same istrue for the internet; just because it is written down does not mean that it is true. Whenyou find something online, it is worth checking how valid the information is.
Can the source be trusted? Popular news sources, such as the BBC, Guardian andTelegraph have to make sure they conform to press standards. That should meanthat they have verified information before putting it online or in print. Be careful, theyoccasionally get it wrong! Be wary of editorials - these are opinion pieces written byjournalists and therefore may be biased.
PLCs, by law, are required to publish accurate information about their sales, profits andfuture plans. These sources should be trusted. (There are some exceptions - searchthe internet for the story of the Tesco executes who falsified profit predictions. They gotcaught and no longer work for Tesco!)
Wikipedia is an increasingly popular website where information is crowdsourcedmeaning that anyone can add to it. This means that the information is current. It canalso mean that false information can be added, but the army of loyal supporters usually
© HERIOT-WATT UNIVERSITY
TOPIC 1. RESEARCH 9
catch this and remove it quickly. It is especially useful for your research as good articleswill cite where they got their information from (using the Harvard style!) so you can clickon the citation to find the original source of the text.
Using good keywords and a popular search engine can also help find useful information.Search engines like Google work by putting the most useful site at the top. The morea website is referenced (linked to) by another website, the higher the Google ranking.When you search, the site at the top are the ones that have been cited lots by others.Just watch out for the paid for adverts!
1.7 Understand the reasons for using a bibliography
A bibliography is similar to a reference list. In fact, the both look exactly thesame. A reference list appears first and includes, in alphabetical order of author, acomprehensive list of every source that you have referenced within the text.
A bibliography, if required, would follow. It looks the exact same as the reference list,but includes any texts or websites that you have read, but not directly sourced within thereport. It is used to show a wide range of reading.
Both are used to make it easy for the marker to locate the source, if required.
Example bibliography:
Arayici, Y., Coates, L., Koskela, L., Kagioglou, M., Usher, C and O'Reilly, K. (2011).BIM
Adoption and Implementation for Architectural Practices. Structural Survey. 29 (1),pp. 7-25.
ASHRAE. (2010) An Introduction to Building Information Modeling (BIM). A Guidefor ASHRAE Members.
Azhar, Salman. (2011) Building Information Modeling for Sustainable Design andLEED Rating Analysis. Automation in Construction. 20 (2), pp. 217-224.
Bausch, J. (2011). 7 Important Renewable Energy Sources. Available:http://tinyurl.com/4yqbbbv. Last accessed 30th Jan 2012.
Bernstein, P. (2007). Building Information Modeling for Sustainable Design.Environmental Design + Construction. 10 (12), pp. 1-2.
1.8 Reference list for this topic
Earlier in this chapter we referred to the Heriot-Watt citing and reference guide. Thisguide would be referenced as:
Heriot-Watt University Information Services (2015). Harvard Style Citing &Referencing Student Guide. Retrieved October 6, 2015 from http://www.hw.ac.uk/is/docs/Harvardguide.pdf.
© HERIOT-WATT UNIVERSITY

10 TOPIC 1. RESEARCH
1.9 Summary
Summary
You should now be able to:
• understand the importance of referencing when presenting findings;
• give examples of how to reference work;
• discuss issues around plagiarism and acknowledging the work of others;
• verify sources of evidence;
• understand the reasons for using a bibliography.
© HERIOT-WATT UNIVERSITY

TOPIC 1. RESEARCH 11
1.10 End of topic test
End of Topic 1 test
Go online
Q5: Which of the following is not a reason for referencing?
a) It is used to demonstrate that you have gathered evidence to back up your ideas andarguments.
b) It is used to demonstrate that you have used credible, good quality sources.c) It is used to demonstrate that you have read from a small number of sources.d) It is used to demonstrate that you have used sources that are appropriate to your
level of study.
. . . . . . . . . . . . . . . . . . . . . . . . . . . . . . . . . . . . . . . . . .
Q6: Presenting your own ideas but using another person's work you should: (you canchoose more than one option)
a) quote directly.
b) paraphrase.
c) cite.
d) summarise.
. . . . . . . . . . . . . . . . . . . . . . . . . . . . . . . . . . . . . . . . . .
Q7: Identify the errors in the following references:
1. Aldrich, D. The Crucial Role of Civil Society in Disaster Recovery and JapansPreparedness for Emergencies. Japan akuell, 1-12. (2008).
2. P M Bermejo (2006). Preparation and Response in Case of Natural Disasters:Cuban Programs and Experience. Journal of Public Health Policy, V.27, 13-21.
3. Garrett, L. (2000). Betrayal of the Trust: The Collapse of Global Public Health. NewYork: Hyperion. ppp
(3 marks)
. . . . . . . . . . . . . . . . . . . . . . . . . . . . . . . . . . . . . . . . . .
© HERIOT-WATT UNIVERSITY

12 TOPIC 1. RESEARCH
© HERIOT-WATT UNIVERSITY

13
Topic 2
Analytical research
Contents
2.1 Decision making . . . . . . . . . . . . . . . . . . . . . . . . . . . . . . . . . . . 14
2.2 Force field analysis . . . . . . . . . . . . . . . . . . . . . . . . . . . . . . . . . . 15
2.3 SWOT analysis . . . . . . . . . . . . . . . . . . . . . . . . . . . . . . . . . . . . 17
2.4 Critical path analysis (CPA) . . . . . . . . . . . . . . . . . . . . . . . . . . . . . 19
2.4.1 Identifying the critical path for a strategy . . . . . . . . . . . . . . . . . . 20
2.4.2 Usefulness of critical path analysis (CPA) . . . . . . . . . . . . . . . . . 21
2.5 Gantt charts . . . . . . . . . . . . . . . . . . . . . . . . . . . . . . . . . . . . . . 21
2.6 Summary . . . . . . . . . . . . . . . . . . . . . . . . . . . . . . . . . . . . . . . 24
2.7 End of topic test . . . . . . . . . . . . . . . . . . . . . . . . . . . . . . . . . . . . 25
Learning objectives
After studying this topic, you should be able to:
• prepare, describe and analyse a:
◦ force-field diagram;
◦ SWOT analysis;
◦ Gantt chart.
• describe and analyse a critical path.

14 TOPIC 2. ANALYTICAL RESEARCH
2.1 Decision making
Businesses must make informed decisions in order to best plan for the future. Themore informed a decision, the higher chance of success. Management is about makingdecisions.
There are processes that managers should go through to make sure that they aremaking the best decision to achieve the organisational goals. Organisational goals arethe targets that have been set by the senior management for the organisation to achieve.
Some decisions are very easy to make and may have little or no impact on anythingelse, e.g. creating a staff rota or ordering stationery. These are routine decisions that abusiness wouldn't normally have to spend a long time thinking about.
Some decisions take a little longer to make, e.g. deciding how to pay for new premises.This will involve some budgeting decisions in order that the business can save money.Many decisions will now be influenced by your aim to purchase new premises.
Other decisions may be about what the business wants to do in the future, e.g. decidingon the business's five-year strategy or changing the mission statement. These decisionsmay take some time to make, and businesses don't make them very often.
Management decisions
Managers are paid to make decisions which influence the running of the business. Someexamples of business decisions that managers may have to make include:
• whether or not to recruit more staff. More staff will cost the business money, but alack of staff could affect customer supplies, and so lose business.
• new product development. Managers have to decide whether the cost ofdevelopment will be too high, or if the company risk losing customers in the longrun by not developing a new product.
• merging with a competitor. A decision to merge two businesses must be carefullyconsidered. Is it the right thing to do? How will customers react? Will the existingcultures clash?
• moving into new markets. This involves great risks, but also great rewards. Is theirenough finance in place? Will the business cope with the increase in demand?
Managers must make decisions from a number of different options. Effective decisionsare those decisions which will achieve the desired goals or aims of the organisation.
To aid decision making, a business can carry out a number of research techniques, suchas:
• force-field diagram;
• SWOT analysis;
• critical path;
• Gantt chart.
The purpose of these techniques is to assist with planning and to ensure that thebusiness is fully prepared before making a decision.
© HERIOT-WATT UNIVERSITY
TOPIC 2. ANALYTICAL RESEARCH 15
Merlin
Go onlineQ1: Merlin, owners of Lego Land and Alton Towers, currently has five attractions inChina, with Madame Tussauds in Shanghai, Hong Kong, Beijing, and Wuhan, and theChang Feng Ocean World aquarium in Shanghai.
It plans to open another three in the next year and a half.
Identify the decisions the Board of Directors need to make to ensure further openingsare successful.
. . . . . . . . . . . . . . . . . . . . . . . . . . . . . . . . . . . . . . . . . .
2.2 Force field analysis
A business may produce a force field analysis before implementing a decision. Welooked at force field diagrams in detail in the previous unit, Unit 2: The internalbusiness environment. You may wish to reread the force field analysis section in Topic5 ('Managing change') before attempting the following revision activity.
Advantages of force field analysis:
• lots of evidence is used so that an informed decisions can be made;
• assets for change are included so it useful to see what the organisation alreadyhas that can enable the decision to happen.
Disadvantages of force field analysis:
• it is a static tool;
• it is out of date as soon as it is produced;
• it is subjective.
Force field analysis
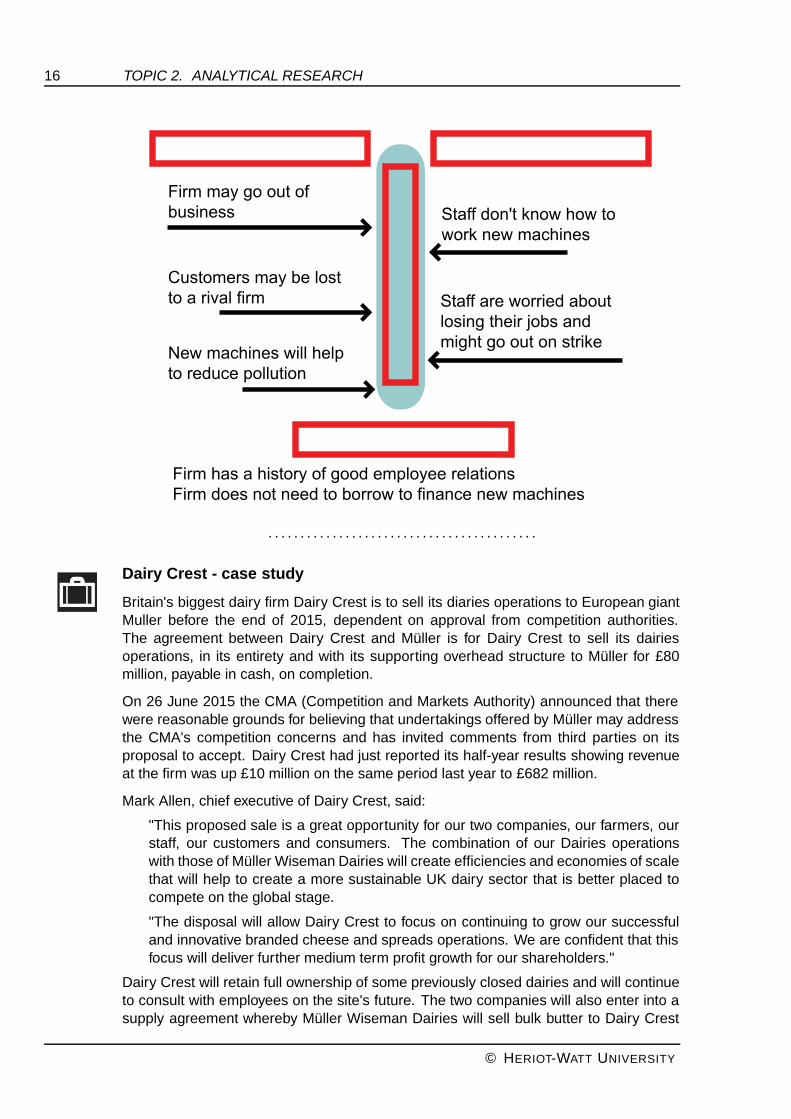
Go online
Q2: Put the following headings into the correct area (red box) in the force field analysisdiagram below:
• Assets for change;
• Drivers;
• Equilibrium;
• Resistors.
© HERIOT-WATT UNIVERSITY
16 TOPIC 2. ANALYTICAL RESEARCH
. . . . . . . . . . . . . . . . . . . . . . . . . . . . . . . . . . . . . . . . . .
Dairy Crest - case study
Britain's biggest dairy firm Dairy Crest is to sell its diaries operations to European giantMuller before the end of 2015, dependent on approval from competition authorities.The agreement between Dairy Crest and Müller is for Dairy Crest to sell its dairiesoperations, in its entirety and with its supporting overhead structure to Müller for £80million, payable in cash, on completion.
On 26 June 2015 the CMA (Competition and Markets Authority) announced that therewere reasonable grounds for believing that undertakings offered by Müller may addressthe CMA's competition concerns and has invited comments from third parties on itsproposal to accept. Dairy Crest had just reported its half-year results showing revenueat the firm was up £10 million on the same period last year to £682 million.
Mark Allen, chief executive of Dairy Crest, said:
"This proposed sale is a great opportunity for our two companies, our farmers, ourstaff, our customers and consumers. The combination of our Dairies operationswith those of Müller Wiseman Dairies will create efficiencies and economies of scalethat will help to create a more sustainable UK dairy sector that is better placed tocompete on the global stage.
"The disposal will allow Dairy Crest to focus on continuing to grow our successfuland innovative branded cheese and spreads operations. We are confident that thisfocus will deliver further medium term profit growth for our shareholders."
Dairy Crest will retain full ownership of some previously closed dairies and will continueto consult with employees on the site's future. The two companies will also enter into asupply agreement whereby Müller Wiseman Dairies will sell bulk butter to Dairy Crest
© HERIOT-WATT UNIVERSITY

TOPIC 2. ANALYTICAL RESEARCH 17
for five years. In addition, Dairy Crest will provide certain transitional services to MüllerWiseman Dairies.
Dairy Crest has dairies at Frome, in Somerset and at Stonehouse, Gloucestershire, plusa dairy at Chard in Somerset which was already under threat of closure. Dairy Crest willcontinue to meet the defined benefit pension obligations in relation to the Dairy CrestPension Scheme.
Source: Western Daily Press website (http://bit.ly/1Pf0fBm)
Q3: Using a force field analysis, justify Dairy Crest's decision to sell its dairies to MullerWiseman. In your answer you must show at least two drivers, two resistors, one assetfor change and arrows of different lengths facing inwards.
. . . . . . . . . . . . . . . . . . . . . . . . . . . . . . . . . . . . . . . . . .
2.3 SWOT analysis
SWOT analysis is a tool that management can use to help with decision making. It isused to evaluate where the organisation is now and where it should be in the future.It helps with planning, deciding the way forward for the organisation and looking atstrategies which could be used.
SWOT analysis is a tool that can be effectively used for any decision making, however,it is most often used when making strategic and tactical decisions. SWOT analysisshould not be seen as a one off exercise; it should be part of the continuing process ofevaluating how the organisation is doing now and what it should be doing in the future.It should be considered from the organisation's own point of view and from the point ofview of the people they deal with. It is important to be honest and realistic.
A SWOT analysis is often presented in a table such as the one below.
Strengths Weaknesses• internal areas where the
organisation performs well• internal areas where the
organisations performs poorly
Opportunities Threats
• external areas in which theorganisation could be involved inthe future
• external areas which pose a threatto the organisation, e.g.competitors, government, changesin the economy
SWOT analysis table
SWOT analysis considers all internal factors (strengths and weaknesses) and externalfactors (opportunities and threats).
© HERIOT-WATT UNIVERSITY

18 TOPIC 2. ANALYTICAL RESEARCH
Strengths
The following questions should be considered:
• What advantages do you have?
• What do you do well?
• What relevant resources do you have access to?
• What do other people see as your strengths?
In looking at strengths, the organisation should think about them in relation to itscompetitors - for example, if all the competitors sell at low prices, then competitive lowpricing is not a strength in the market, it is a necessity.
Weaknesses
The following questions should be considered:
• What could you improve?
• What do you do badly?
• What should you avoid?
Again, this should be considered from an internal and external basis.
Opportunities
The following questions should be considered:
• What changes have taken place in technology and markets on both a broad andnarrow scale?
• What changes in government policy related to your field?
• What changes have there been in social patterns, population profiles, lifestylechanges, etc.?
• What local events are taking place?
• Has there been a positive upturn in the economy?
A useful approach to looking at opportunities is to look at the strengths and ask whetherthese open up any opportunities. Alternatively, look at weaknesses and ask whether theorganisation could open up opportunities by eliminating them.
Threats
The following questions should be considered:
• What obstacles do you face?
• What is your competition doing?
• Are the required specifications for your job, products or services changing?
© HERIOT-WATT UNIVERSITY

TOPIC 2. ANALYTICAL RESEARCH 19
• Is changing technology threatening your position?
• Do you have bad debt or cash-flow weakness?
• Could any of your weaknesses seriously threaten your business?
SWOT analysis - Dairy Crest
Go online
Q4: Carry out a SWOT analysis of your school with your classmates and then shareyour findings with your class.
. . . . . . . . . . . . . . . . . . . . . . . . . . . . . . . . . . . . . . . . . .
Using a SWOT analysis, you can:
• understand your business better;
• address weaknesses;
• deter threats;
• capitalise on opportunities;
• take advantage of your strengths;
• develop business goals and strategies for achieving them.
Disadvantages of a SWOT analysis include that it:
• is a static analysis;
• doesn't prioritise issues;
• doesn't provide solutions or offer alternative decisions;
• can generate too many ideas but not help you choose which one is best.
2.4 Critical path analysis (CPA)
Critical path analysis (CPA) is another way of planning and monitoring theimplementation of a strategy. CPA starts by:
• identifying each of the activities needed to complete a project;
• calculating the time that will be taken by each activity;
• working out which activities can be done simultaneously;
• identifying which activities cannot start until others have been completed;
• putting the activities in order.
© HERIOT-WATT UNIVERSITY

20 TOPIC 2. ANALYTICAL RESEARCH
Carrying out a critical path analysis helps keep a project to time. It also allows allmembers of the team to complete in the planning of the project, and can help identifywhere time, and therefore financial, savings can be met.
The critical path is the sequence of activities which, when added together, give the totallength the project is expected to take. This determines how long a project will last.If there is any delay on the critical path (called "slippage"), the whole project will bedelayed.
Businesses who plan will avoid unnecessary delays. For example, completing worksimultaneously will shorten the overall length of the project. It may be possible howeverto delay activities not on the critical path without delaying the final completion of theproject.
The critical path is shown in diagrammatic form. The diagram below shows a simpleexample of a network used for critical path analysis:
Example of a network used for critical path analysis
Extra time that is available for particular activities not on the critical path is called floattime. In the diagram above tasks D and E carry 2.5 weeks of float time between them.
Critical path analysis (CPA)
Go online
Q5: In the above diagram, how long is the project expected to last?
. . . . . . . . . . . . . . . . . . . . . . . . . . . . . . . . . . . . . . . . . .
2.4.1 Identifying the critical path for a strategy
A college's strategy is to build a new extension equipped with computers toaccommodate increased demand for IT courses. The college works out that the tasksin the table below are needed need to implement the strategy.
© HERIOT-WATT UNIVERSITY

TOPIC 2. ANALYTICAL RESEARCH 21
A Choose a building firm 1 week
B Erect the new building 12 weeks
C Install plumbing 4 weeks
D Install electricity 5 weeks
E Decorate the building 3 weeks
F Install shelving for computers 3 weeks
G Order computers 8 weeks
H Install computers 2 weeks
Identifying the critical path for a strategy
Go online
Q6: Which of these tasks depend on other tasks being completed first?
. . . . . . . . . . . . . . . . . . . . . . . . . . . . . . . . . . . . . . . . . .
Q7: Which of these tasks do not depend on others being completed first?
. . . . . . . . . . . . . . . . . . . . . . . . . . . . . . . . . . . . . . . . . .
Q8: Which of these tasks could be done simultaneously?
. . . . . . . . . . . . . . . . . . . . . . . . . . . . . . . . . . . . . . . . . .
2.4.2 Usefulness of critical path analysis (CPA)
The advantages of CPA are that it:
• helps reduce the risk and costs of complex projects;
• encourages careful assessment of the requirements of each activity in a project;
• helps spot which activities have some slack ("float") and could lead to reallocation/ better allocation of resources;
• provides managers with a useful overview of a complex project.
The disadvantages of CPA are that:
• the reliability of CPA largely based on accurate estimates and assumptions made;
• CPA does not guarantee the success of a project - that still needs to be managedproperly.
2.5 Gantt charts
Gantt charts were invented by Henry Gantt, a writer in the classical school ofmanagement that you learned about in Unit 2. They are still widely used to scheduleprojects in modern businesses. They are basically bar charts displaying the different
© HERIOT-WATT UNIVERSITY

22 TOPIC 2. ANALYTICAL RESEARCH
activities involved in a project along with how long they will take. The bars are colouredin as each activity is completed so that progress can easily be checked at any time.
Steps to create a Gantt chart:
1. Identify each different activity that needs to be done to implement the strategy.
2. Decide how much time each activity will take.
3. Decide the order in which the activities must be done.
4. Create a table or a spreadsheet.
5. Key in days, weeks or months as appropriate across the top.
6. Write each activity that will need to be done down the left hand side.
7. For each activity, draw a rectangular box from the start time to the end time.
8. Check that every activity appears on the chart.
Gantt charts are similar to critical path analysis, in that both techniques chart theprogress of a project over a period of time. Gantt charts are updated as the projectdevelops, which makes them more helpful to some.
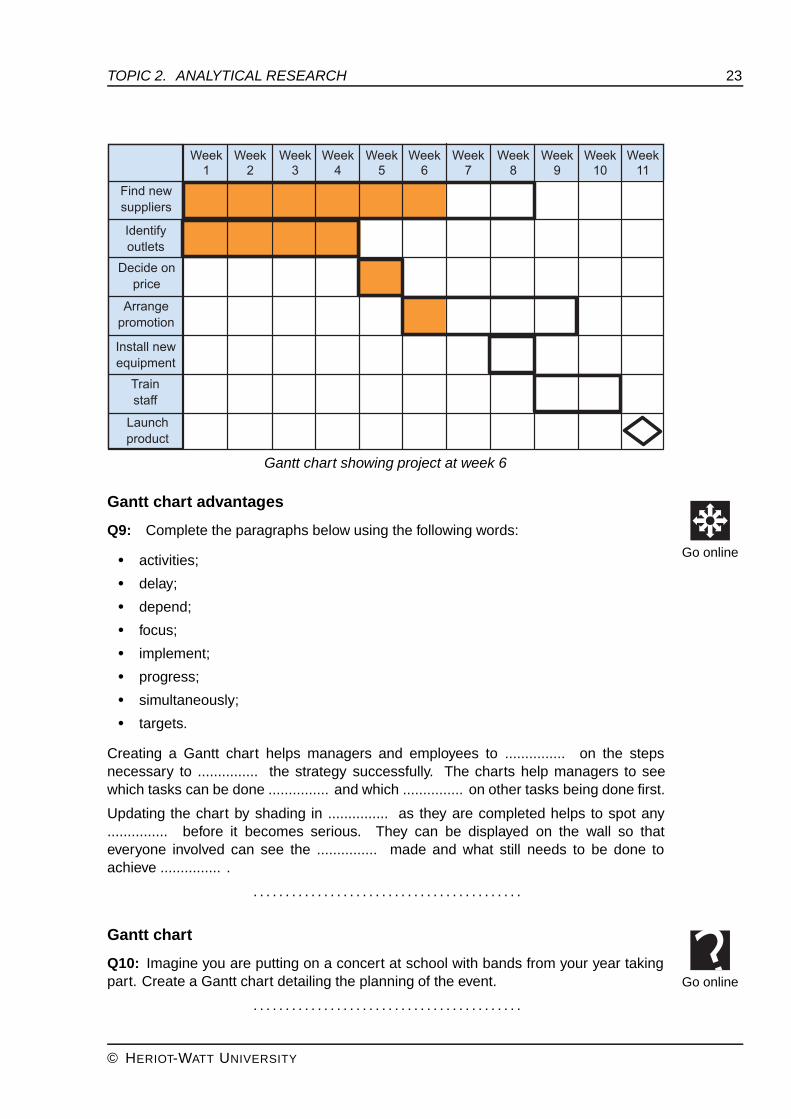
Here is the same project as before, shown as a Gantt chart:
Incomplete Gantt chart for project
Some Gantt charts have an actual row below each projected row, to record realprogress.
As each activity is completed the relevant part of the chart is shaded in. The chart canbe displayed on the wall as a clear indication of what has been done and whether theproject is ahead of time or delayed. Managers can then decide how to use any extratime profitably, or identify ways to make up for lost time.
The Gantt chart below shows where the project should be at week 6.
© HERIOT-WATT UNIVERSITY
TOPIC 2. ANALYTICAL RESEARCH 23
Gantt chart showing project at week 6
Gantt chart advantages
Go online
Q9: Complete the paragraphs below using the following words:
• activities;
• delay;
• depend;
• focus;
• implement;
• progress;
• simultaneously;
• targets.
Creating a Gantt chart helps managers and employees to ............... on the stepsnecessary to ............... the strategy successfully. The charts help managers to seewhich tasks can be done ............... and which ............... on other tasks being done first.
Updating the chart by shading in ............... as they are completed helps to spot any............... before it becomes serious. They can be displayed on the wall so thateveryone involved can see the ............... made and what still needs to be done toachieve ............... .
. . . . . . . . . . . . . . . . . . . . . . . . . . . . . . . . . . . . . . . . . .
Gantt chart
Go onlineQ10: Imagine you are putting on a concert at school with bands from your year takingpart. Create a Gantt chart detailing the planning of the event.
. . . . . . . . . . . . . . . . . . . . . . . . . . . . . . . . . . . . . . . . . .
© HERIOT-WATT UNIVERSITY

24 TOPIC 2. ANALYTICAL RESEARCH
2.6 Summary
Summary
You should now be able to:
• prepare, describe and analyse a:
◦ force-field diagram;
◦ SWOT analysis;
◦ Gantt chart.
• describe and analyse a critical path.
© HERIOT-WATT UNIVERSITY

TOPIC 2. ANALYTICAL RESEARCH 25
2.7 End of topic test
End of Topic 2 test
Go online
HSBC describes itself as a global investor with local knowledge. Senior managersrecently threatened to move its headquarters out of the UK (http://bit.ly/1kQRMZK) amidconcerns over excessive tax. Reports suggest that it sees the USA as a more suitablehome, with its similar language and business style. According to the Financial Times,the bank is concerned that moving to the Far East could see it end up in the hands ofthe Chinese.
The systems of banking regulation in the North America appeals to HSBC and thecountry would easily be able to handle a financial firm of its size - HSBC handles $2.6trillion worth of assets.
Douglas Flint, HSBC's chairman, told the FT the bank was "about halfway throughthe process" of looking into moving its HQ and had "prepared the ground by givingpresentations to the board on the various aspects, like the regulatory and economicframework, but we have not had any discussion of the relative merits".
In the contrary, Mr Flint recently gave a lecture in London (http://bit.ly/1POLuqf) on thefuture of banking in China, in which he welcomed the opportunities the country presentsfor growth as it opens up its markets to the world. Given the size of HSBC's profits fromthe region and its historic links to the country, Hong Kong is still thought to be the leadingalternative to London.
One factor pushing the bank to consider moving is the bank levy, a British tax introducedin 2010 that targets UK-based banks' global balance sheets. As a highly globalisedbank, this hit HSBC harder than any of its rivals.
In Chancellor George Osborne's emergency budget earlier this year, he said he wouldcut back the levy and introduce an 8% corporation tax surcharge on UK profits instead -a move aimed at encouraging HSBC to stay.
"The UK's made some changes to the tax framework which we think are positive to thestructure of taxing banks in the UK," Mr Flint said after the changes were announced.But he warned (http://bit.ly/1MpvHOc) that while the change "comes into the mix, it isnot determinative".
HSBC is due to make a decision on whether to relocate from the UK by the end of theyear.
Source: The Telegraph (http://www.telegraph.co.uk/finance/newsbysector/epic/hsba/)
Q11: Analyse HSBC's decision to move from the UK to the USA or China. Your answermust include a force field diagram. (8 marks)
. . . . . . . . . . . . . . . . . . . . . . . . . . . . . . . . . . . . . . . . . .
Q12: Using the case study and additional internet research, carry out a SWOT analysisfor HSBC bank. (4 marks)
. . . . . . . . . . . . . . . . . . . . . . . . . . . . . . . . . . . . . . . . . .
© HERIOT-WATT UNIVERSITY

26 TOPIC 2. ANALYTICAL RESEARCH
© HERIOT-WATT UNIVERSITY

27
Topic 3
Evaluating financial information
Contents
3.1 Reported financial information . . . . . . . . . . . . . . . . . . . . . . . . . . . . 28
3.1.1 Ratio analysis . . . . . . . . . . . . . . . . . . . . . . . . . . . . . . . . 28
3.1.2 Profitability ratios . . . . . . . . . . . . . . . . . . . . . . . . . . . . . . . 28
3.1.3 Liquidity ratios . . . . . . . . . . . . . . . . . . . . . . . . . . . . . . . . 29
3.1.4 Efficiency ratios . . . . . . . . . . . . . . . . . . . . . . . . . . . . . . . 30
3.1.5 Ratio analysis - a worked example . . . . . . . . . . . . . . . . . . . . . 31
3.1.6 Limitations of ratio analysis . . . . . . . . . . . . . . . . . . . . . . . . . 31
3.2 Annual reports . . . . . . . . . . . . . . . . . . . . . . . . . . . . . . . . . . . . 32
3.3 Other information . . . . . . . . . . . . . . . . . . . . . . . . . . . . . . . . . . . 33
3.4 Summary . . . . . . . . . . . . . . . . . . . . . . . . . . . . . . . . . . . . . . . 34
3.5 End of topic test . . . . . . . . . . . . . . . . . . . . . . . . . . . . . . . . . . . . 35
Learning objectives
After studying this topic, you should be able to reach conclusions from:
• reported financial information;
• annual reports;
• government statistics;
• market data;
• customers surveys.

28 TOPIC 3. EVALUATING FINANCIAL INFORMATION
3.1 Reported financial information
Public limited companies are required by law to prepare and publish final accounts atthe end of their financial period. This can be the end of the calendar year, the end of thefinancial year or any time of the business' choosing. The only proviso is that the datemust be the same every year.
These final accounts give a historical record for that financial period. The managementof the business will be interested in seeing whether the business has improved on lastyear's performance, has performed better than competitors or what problem areas arethere for further investigation.
A wide range of stakeholders will also be interested in the business performance,including prospective investors.
3.1.1 Ratio analysis
To enhance the information given by the final accounts, a business will carry outratio analysis. Further investigation on the financial performance will be based on thefollowing aspects of the business:
1. profitability;
2. liquidity;
3. efficiency.
Ratio analysis gives further information on the business performance over a financialperiod. It can also:
• compare a business performance over two time periods;
• compare business performance with that of a competitor;
• compare budgeted and actual performance;
• investigate areas where the business is not performing.
Ratio analysis is a useful tool used by a business to investigate further the financialperformance of the business. The ratios in themselves are meaningless unless they areused as a comparison with previous years' figures (inter-firm comparison), the figuresof a competitor in the same industry (intra-firm comparison) or as a measure of actualperformance against forecasted prediction figures produced by the business. To reachconclusions on the basis of reported financial information a business must analysethe data to draw comparisons, both from one year to the next and with comparableorganisations.
3.1.2 Profitability ratios
Profitability ratios will analyse the profit-making capacity of the business and whetherthe business has met its objectives. We are interested in two profitability ratios:
© HERIOT-WATT UNIVERSITY

TOPIC 3. EVALUATING FINANCIAL INFORMATION 29
• gross profit as a percentage of sales;
• net profit as a percentage of sales.
Gross profit as a percentage of sales is used to calculate the gross profit as apercentage of sales turnover. A high percentage may indicate that the business has anefficient buying policy, or high selling price compared to the purchase price of materials.
Changes in the ratio can be caused by:
• an increase or a decrease in the selling price (usually a deliberate companypolicy), or;
• a change in the cost of goods sold (usually outwith the company's control).
The formula used is (gross profit / sales) x 100%.
Net profit as a percentage of sales is used to calculate what percentage of their salesthey have turned into net profit. Where a low figure is calculated, this shows that thecompany's expenses may be high and should be further investigated. This ratio is oftenused to highlight efficiency and control of costs.
The formula used is (net profit / sales) × 100%.
Profitability ratios
Go online
Q1: For both years, work out the gross profit as a percentage of sales and net profitas a percentage of sales, based on the information given:
• Gross profit - £250,000 in Year 1 and £300,000 in Year 2;
• Net profit - £100,000 in Year 1 and £110,000 in Year 2;
• Sales - £450,000 in Year 1 and £500,000 in Year 2.
. . . . . . . . . . . . . . . . . . . . . . . . . . . . . . . . . . . . . . . . . .
3.1.3 Liquidity ratios
Liquidity ratios analyse how the business has performed over the time period in the useof its assets and the control of its debts. The two ratios used are current ratios andacid test ratios.
The current ratio is used to show the business's ability to meet its short-term debts.There is no ideal figure for this ratio although it should normally fall within the region of1:1 and 3:1.
Where the ratio is very low, this indicates that the business may have liquidity problems.Where the ratio is high this indicates that there is more than enough money to covershort-term business debts, however, it can also indicate that there is too much cash inthe business not being used to best advantage. Spare cash can be invested, even inthe short-term, and earn additional income for the business.
The formula used is current ratio = current assets:current liabilities.
© HERIOT-WATT UNIVERSITY
30 TOPIC 3. EVALUATING FINANCIAL INFORMATION
The acid test ratio is similar to the current ratio although it takes into account the factthat stocks of raw materials and goods for resale can often take some time to be turnedinto cash. The business's ability to pay its short-term debts is therefore looked at withoutincluding stock.
The average figure of 1:1 should be used as a guideline although anything less thanthis would show that the business may not be able to meet its short-term debts withoutselling stock or borrowing money. However, some types of businesses can operate withan acid test ratio of less than 1:1 so the typical ratio will depend on the type of business.
The formula used is acid test ratio = (current assets - stock):current liabilities.
Liquidity ratios
Go online
Q2: For both years, work out the current ratio and acid test ratio, based on theinformation given:
• Current assets - £1,500,000 in Year 1 and £1,700,000 in Year 2;• Current liabilities - £800,000 in Year 1 and £750,000 in Year 2;• Stock at end - 600,000 in Year 1 and 800,000 in Year 2.
. . . . . . . . . . . . . . . . . . . . . . . . . . . . . . . . . . . . . . . . . .
3.1.4 Efficiency ratios
Efficiency ratios analyse how easily a business can meet its debts. The current assetsand current liabilities are analysed here.
Return on capital employed (ROCE) is a ratio which is expressed as a percentage.ROCE measures how well, or how badly, a business has utilised the capital (moneyinvested by the owner) that has been invested in it. This gives a more usefulinterpretation of performance than merely looking at the profit figure.
When you invest money in a bank, you will probably pick the one with the best interestrates. The concept is similar here. The owner(s) want to know how much theirinvestment will earn in percentage terms.
One business might return a profit of £50,000 based on capital employed of £100,000,while another may have a profit of £100,000 on an investment of £500,000. Althoughthe second business has a higher profit figure, the first business provides a much betterreturn for each £1 invested.
The formula used is return on capital employed = (net profit / capital employed) ×100%.
Efficiency ratios
Go online
Q3: For both years, work out the return on capital employed (ROCE), based on theinformation given:
• Gross profit - £250,000 in Year 1 and £300,000 in Year 2;• Capital employed - £1,000,000 in Year 1 and £1,110,000 in Year 2.
. . . . . . . . . . . . . . . . . . . . . . . . . . . . . . . . . . . . . . . . . .
© HERIOT-WATT UNIVERSITY

TOPIC 3. EVALUATING FINANCIAL INFORMATION 31
3.1.5 Ratio analysis - a worked example
Ratio analysis - a worked example
Go online
The table below shows statistics from a company's annual report.
Year 2(in £)
Year 1(in £)
Revenue (sales) 7,000m 6,300m
Net profit 700m 970m
Current assets 10,000m 12,000m
Current liabilities 14,300m 10,900m
Capital employed 5,500m 6,000m
Share price 1.75 2.03
Q4: Using these statistics, complete the table below.
Year 2 Year 1
Net profit as a percentage of sales
Current ratio
Return on capital employed
Share price (in £) 1.75 2.03
. . . . . . . . . . . . . . . . . . . . . . . . . . . . . . . . . . . . . . . . . .
Q5: Give your analysis of the business based on the above statistics and your answerto the previous question.
. . . . . . . . . . . . . . . . . . . . . . . . . . . . . . . . . . . . . . . . . .
3.1.6 Limitations of ratio analysis
Ratio analysis can highlight potential issues, but it does not provide detail or answers.The limitations of ratio analysis are:
• the information is historical and becomes out of date quickly which meansborrowing decisions may not be based on current need;
• comparison has to be made with previous years' performance or predictedperformance - ratios are meaningless on their own;
• comparison must also be made with similar businesses of the same size in thesame industry - this can be difficult to predicate as you will not be aware of theunreported reasons for a competitors increase or decrease in fortune;
• different businesses may not calculate ratios in the same way, making comparisondifficult;
© HERIOT-WATT UNIVERSITY

32 TOPIC 3. EVALUATING FINANCIAL INFORMATION
• if used for comparison purposes it is imperative that businesses prepare theirfinal accounts in the same way following Financial Reporting Standards andCompanies Acts;
• the external environment of the business changes from year to year, and thesechanges do not need to be reported; changes in staff, initiatives, productdevelopment, production processes... there are many reasons why a businessmay show a greater or reduced profit one year to the next.
To summarise, a ratio calculated on it's own is meaningless unless it is compared to ayardstick - previous year's performance, budgeted performance or the performance of acompetitor.
Ratio analysis does not take account of other changes within the business suchnon- financial performance indicators such as staff changes, changes in methods ofproduction, or any new product developments or launches.
3.2 Annual reports
Annual reports are produced to coincide with the publication of the annual accounts.They set out to show the business's successes over the past trading period as well ashighlighting the business's programme for change in the coming year.
They audience for annual reports is both internal and external to the business. Thereport is aimed at existing investors who they will be keen to show growth and sounddecision making. It will also be aimed at potential future investors who will be lookingfor a history of improvement and financial stability. The report will also be aimed atemployees as it will contain key messages pointing towards the organisations futurestrategies.
Annual reports also contain messages from the business's senior management team.The report is usually introduced by the Chief Executive Officer (CEO) who will outlinethe key strengths of the past year and the action that the business is prepared to takein the coming year. As well as containing the business's financial statements, it mayalso include reports on key initiatives such as sustainable development and new growthopportunities.
Whist financial information must be 100% accurate, the wording and tone of the writtenreports will be blushed with a certain degree of bias. This is the business's opportunityto sell itself to the market.
In the past, annual reports would be written documents, downloadable from theorganisations website in pdf format. Whilst this is still the case, many businesses arenow taking advantage of web based technology and are including video and interactivetimeline content to their reports. The 2015 Marks and Spencer annual report, forexample, begins with a video highlighting the key strengths, as they see it, of thebusiness over the past year.
© HERIOT-WATT UNIVERSITY

TOPIC 3. EVALUATING FINANCIAL INFORMATION 33
Annual report analysis
Go online
Find the latest Marks and Spencer annual report online. Spend about 20 minutesreading it, noting anything interesting that you find.
Look out for financial data, key messages, new initiatives and interesting performancestats.
. . . . . . . . . . . . . . . . . . . . . . . . . . . . . . . . . . . . . . . . . .
3.3 Other information
You will also need to look outside of the business to glean information concerning theexternal factors and trends of the market the business operates in. There are a numberof sources of information, such as government departments which are funded by taxpayers and are required to document and make available everything that they find.
This means there is a wealth of information available online. When you are deciding ona topic for your Advanced Higher report, you should take some time to search throughthe following websites:
• UK Government statistics (http://bit.ly/1OfAosd) ;
• Office for National Statistics (http://bit.ly/1JOyTLu) ;
• Scottish Government statistics (http://bit.ly/1OhKVoD) .
Government statistics can be used to investigate trends in a market or sector. Thesetrends can then be compared to the business in question. How does the growth matchup? Is the wider economy growing or contracting in the same way? Has the populationchanged or does changes in the age of the population confirm why a business may beseeing a rise or decline of sales over time?
Of course, government statistics are only helpful to decision making if the informationexists. To ensure current and relevant information a business may be required to carryout the research for themselves.
You studied market research at both National 5 and Higher level and may haveconducted your own as part of your reports. You may choose to do the same foryou Advanced Higher report. You should be aware that market research companiesexist - businesses do not always complete the market research activities for themselves.Although you cannot influence the questioning or topics, they often publish reports thatyou may find useful.
Two of the leading market research companies are:
• Ipsos MORI (http://bit.ly/1Ltejrp);
• http://www.mintel.com/.
© HERIOT-WATT UNIVERSITY

34 TOPIC 3. EVALUATING FINANCIAL INFORMATION
3.4 Summary
Summary
After studying this topic, you should now be able to reach conclusions from:
• reported financial information;
• annual reports;
• government statistics;
• market data;
• customers surveys.
© HERIOT-WATT UNIVERSITY
TOPIC 3. EVALUATING FINANCIAL INFORMATION 35
3.5 End of topic test
End of Topic 3 test
Go online
Q6: Ratio analysis is used to:
a) predict the future.b) compare a business's performance over two time periods.c) explain why a performance has increased.d) justify an operations decision.
. . . . . . . . . . . . . . . . . . . . . . . . . . . . . . . . . . . . . . . . . .
Q7: Net profit as a percentage of sales is an example of a:
a) profitability ratio.b) liquidity ratio.c) efficiency ratio.
. . . . . . . . . . . . . . . . . . . . . . . . . . . . . . . . . . . . . . . . . .
Q8: Gross profit as a percentage of sales is interested in a business's efficiency.
a) Trueb) False
. . . . . . . . . . . . . . . . . . . . . . . . . . . . . . . . . . . . . . . . . .
Q9: Ratio analysis can only be used to compare a business's performance withprevious years.
a) Trueb) False
. . . . . . . . . . . . . . . . . . . . . . . . . . . . . . . . . . . . . . . . . .
Q10: An increase in net profit as a percentage of sales could indicate a business isusing cheaper suppliers.
a) Trueb) False
. . . . . . . . . . . . . . . . . . . . . . . . . . . . . . . . . . . . . . . . . .
Q11: Return on capital employed ratios require a business to know its opening capital.
a) Trueb) False
. . . . . . . . . . . . . . . . . . . . . . . . . . . . . . . . . . . . . . . . . .
Q12: Ratio analysis can also highlight issues with staff morale and turnover.
a) Trueb) False
. . . . . . . . . . . . . . . . . . . . . . . . . . . . . . . . . . . . . . . . . .
© HERIOT-WATT UNIVERSITY

36 TOPIC 3. EVALUATING FINANCIAL INFORMATION
Q13: The table below gives figures from year 1 and year 2 for a business.
Year 2(in £)
Year 1(in £)
Revenue (Sales) 24,000 million 10,500 million
Profit/(Loss) for the year (Net profit/(Loss)) 2,250 million 550 million
Current assets 18,000 million 12,000 million
Current liabilities 8,000 million 10,900 million
Capital employed 12,500 million 6,000 million
Share price 5.60 3.20
Using the figures provided in the table above, complete the following table and providean analysis of your findings.
Year 2 Year 1
Net profit as a percentage of sales
Current ratio
Return on capital employed
Share price (in £) 5.60 3.20
(6 marks - 3 marks for correct figures plus 3 marks for analysis)
. . . . . . . . . . . . . . . . . . . . . . . . . . . . . . . . . . . . . . . . . .
© HERIOT-WATT UNIVERSITY

GLOSSARY 37
Glossary
Acid test ratio
shows a business's ability to pay its short term debts but with stock removed fromthe calculation
Citing
providing a list of sources used
Critical path
a tool used to show the shortest number of activities a business must go throughto complete a project
Current ratio
shows a business's ability to pay its short term debts
Direct quotes
taking a quote from a published works and including it word for word and citing theoriginal
Efficiency
ratios used to show how a business is performing and the returns it is generating
Force-field diagram
a tool used to show the drivers for, and resistors against, change including assetsfor change that an organisation already has that enable change to happen
Gantt chart
a tool used to outline how long a project is likely to take, taking account of thedifferent activities' starting points
Gross profit percentage
the percentage of sales that a business has turned into gross profit
Harvard Reference style
a reference style, first used at the university of the same name, where sources arelisted alphabetically by surname of the author
Liquidity
ratios used to show how easily a business can meet its debts
Net profit percentage
the percentage of sales that a business has turned into net profit
Paraphrasing
taking information from a published works but changing it into your own words andciting the original
Plagiarism
using someone else's published work and passing it off as your own
© HERIOT-WATT UNIVERSITY
38 GLOSSARY
Profitability
ratios used to show how profitable a business is compared to previous orcompetitor performance
Referencing
providing a quote or acknowledgment of a source from a published author
Return on capital employed
measures the expected return to be paid on an investment into the business
Summarising
taking information from a published works but summarising it to reduce the contentand citing the original
SWOT analysis
a tool used to show the internal strengths and weaknesses and the externalopportunities and threats a business faces
© HERIOT-WATT UNIVERSITY

ANSWERS: TOPIC 1 39
Answers to questions and activities
1 Research
Asda (page 3)
Q1: "This last quarter has been unprecedented. We have seen deflation in the marketand exponential shifts in the industry. Although I still believe that 18 months ago wedid a great job of predicting changes, we could not have foreseen what's happenedto others and the moves they have had to make in order to restore their business -creating an impact on us in the short-term." (ASDA news release (http://your.asda.com/press-centre/asda-unveils-its-first-quarter-financial-results-and-strategy-update) [Lastaccessed October 2015])
Q2: The president of ASDA believes the company did a good job predicting changesto the market, but argues that they could not have predicted the external effects ofdeflation and the moves their competitors made to combat the changes in the market.(ASDA news release (http://your.asda.com/press-centre/asda-unveils-its-first-quarter-financial-results-and-strategy-update) [Last accessed October 2015])
Provide a reference (page 7)
Q3: ASDA (2015) news release [online], available http://your.asda.com/press-centre/asda-unveils-its-first-quarter-financial-results-and-strategy-update [Last accessedOctober 2015]
Cold calling (page 8)
Q4: Possible solution:
Schiffman (1987) says cold calling is the best and most cost-effective way for a businessto increase sales. Akhabau (2015) disagrees, stating that there has been a big increasein complaints from customers about cold calling techniques in recent years. An article inThe Guardian (Bachelor, 2015) backs this up with the news that "a cold-calling companythat has been pestering householders with automated calls on an "industrial scale" willbe hit with a record fine next week."
References
• Akhabau, I., 2015. Big increase in cold call complaints but few fines. [Online]Available at: http://www.bbc.co.uk/news/uk-politics-34618167 [last accessed 25October 2015]
• Bachelor, L., 2015. Cold-calling 'factory' gets record fine after 180,000 complaintslast year. [Online] Available at: http://www.theguardian.com/money/2015/sep/26/cold-calling-record-fine-complaints-data-protection [last accessed 25 October2015]
• Schiffman, S., 2007. Cold Calling Techniques (that really work). [Online] Availableat: https://books.google.co.uk/books?id=b46Kk2PpgcIC&printsec=frontcover#v=onepage&q&f=false [last accessed 25 October 2015]
© HERIOT-WATT UNIVERSITY

40 ANSWERS: TOPIC 1
End of Topic 1 test (page 11)
Q5: c) It is used to demonstrate that you have read from a small number of sources.
Q6: a) quote directly, b) paraphrase, c) cite and d) summarise
Q7: The error in the references are highlighted below:
1. Aldrich, D. The Crucial Role of Civil Society in Disaster Recovery and JapansPreparedness for Emergencies. Japan akuell, 1-12. (2008).The year should be included after the author name, i.e. Aldrich, D (2008). TheCrucial Role of Civil Society in Disaster Recovery and Japans Preparedness forEmergencies. Japan akuell, 1-12.
2. P M Bermejo (2006). Preparation and Response in Case of Natural Disasters:Cuban Programs and Experience. Journal of Public Health Policy, V.27, 13-21.The author's initials should be included after the author surname, i.e. Bermejo, P M(2006). Preparation and Response in Case of Natural Disasters: Cuban Programsand Experience. Journal of Public Health Policy, V.27, 13-21.
3. Garrett, L. (2000). Betrayal of the Trust: The Collapse of Global Public Health. NewYork: Hyperion. pppThe page number(s) should be included instead of ppp, e.g. Garrett, L. (2000).Betrayal of the Trust: The Collapse of Global Public Health. New York: Hyperion.1-12.
© HERIOT-WATT UNIVERSITY

ANSWERS: TOPIC 2 41
2 Analytical research
Merlin (page 15)
Q1: Possible decisions may include:
• whether or not to hire native Chinese staff to manage the new ventures or torelocate UK staff;
• how to market the new ventures;
• what attractions they should open in China that will appeal to the local market.
Force field analysis (page 15)
Q2:
© HERIOT-WATT UNIVERSITY

42 ANSWERS: TOPIC 2
Dairy Crest - case study (page 16)
Q3:
SWOT analysis - Dairy Crest (page 19)
Q4: The SWOT analysis depends on your school so there is no suggested answer tothis question. Check your answer with your teacher.
Critical path analysis (CPA) (page 20)
Q5: 12 weeks.
The critical path is A - B - C - F - G which equates to 12 weeks(4 + 2 + 3 + 1 + 2) and is shown in red in the network below.
© HERIOT-WATT UNIVERSITY

ANSWERS: TOPIC 2 43
Identifying the critical path for a strategy (page 21)
Q6: The building cannot be completed until the builder has been selected. Thebuilding must be erected before plumbing and electricity are installed, decoration takesplace, and shelving and computers are installed. Computers cannot be installed beforeshelving is in place.
Q7: Choosing the building firm because it is the first task. Ordering computers can bedone at any time.
Q8: Ordering the computers along with any other tasks apart from installing them.Installing the plumbing and electricity.
Gantt chart advantages (page 23)
Q9: Creating a Gantt chart helps managers and employees to focus on the stepsnecessary to implement the strategy successfully. The charts help managers to seewhich tasks can be done simultaneously and which depend on other tasks being donefirst.
Updating the chart by shading in activities as they are completed helps to spot anydelay before it becomes serious. They can be displayed on the wall so that everyoneinvolved can see the progress made and what still needs to be done to achieve targets.
Gantt chart (page 23)
Q10: There is no definitive Gantt chart for this as time frames, holidays, types of activity,etc. will be different for every school.
End of Topic 2 test (page 25)
Q11: Drivers: Excessive tax demands in the UK; the USA has similar businesspractices and culture with the UK; British tax introduced in 2010 that targets UK-basedbanks' global balance sheets; systems of banking regulation in the North America
© HERIOT-WATT UNIVERSITY
44 ANSWERS: TOPIC 2
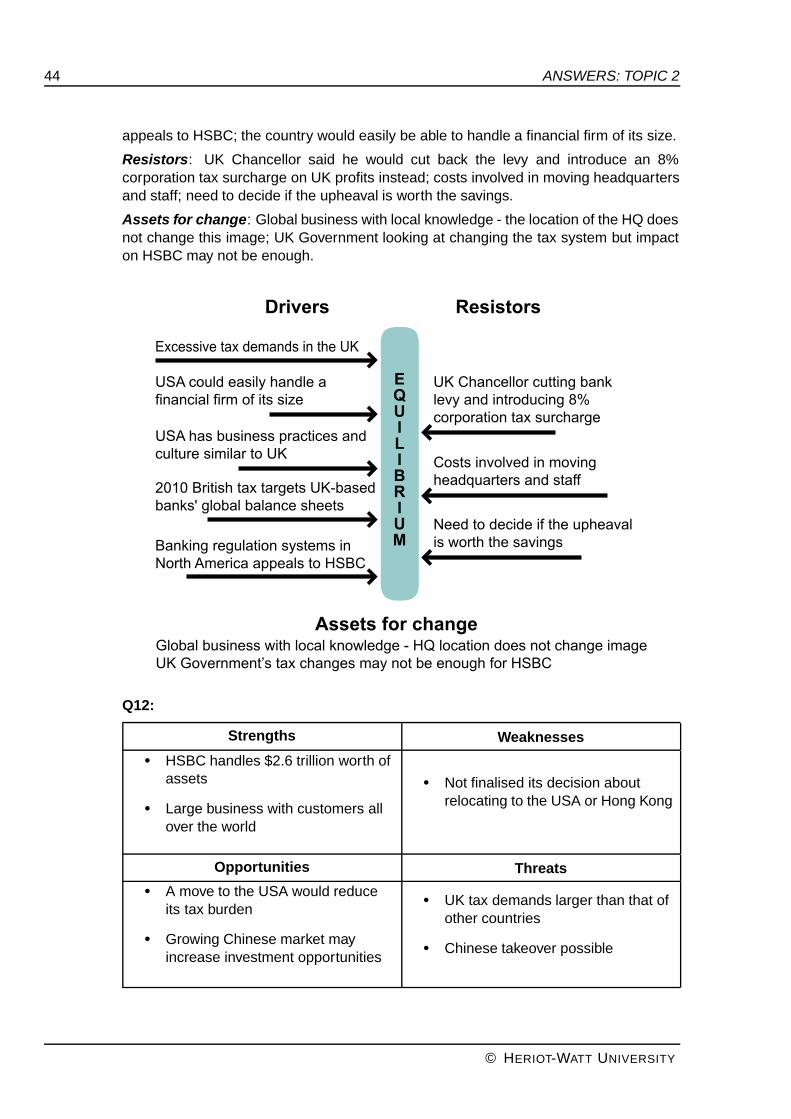
appeals to HSBC; the country would easily be able to handle a financial firm of its size.
Resistors: UK Chancellor said he would cut back the levy and introduce an 8%corporation tax surcharge on UK profits instead; costs involved in moving headquartersand staff; need to decide if the upheaval is worth the savings.
Assets for change: Global business with local knowledge - the location of the HQ doesnot change this image; UK Government looking at changing the tax system but impacton HSBC may not be enough.
Q12:
Strengths Weaknesses• HSBC handles $2.6 trillion worth of
assets
• Large business with customers allover the world
• Not finalised its decision aboutrelocating to the USA or Hong Kong
Opportunities Threats• A move to the USA would reduce
its tax burden
• Growing Chinese market mayincrease investment opportunities
• UK tax demands larger than that ofother countries
• Chinese takeover possible
© HERIOT-WATT UNIVERSITY

ANSWERS: TOPIC 3 45
3 Evaluating financial information
Profitability ratios (page 29)
Q1: Gross profit Year 1= (250 / 450) x 100% = 55%
Gross profit Year 2= (300 / 500) x 100% = 60%
Net profit Year 1 = (100 / 450) x 100% = 22%
Net profit Year 2 = (110 / 500) x 100% = 22%
Liquidity ratios (page 30)
Q2: Current ratio Year 1 = 1,500,000:800,000 = 1.88:1
Current ratio Year 2 = 1,700,000:750,000 = 2.27:1
Acid test ratio Year 1 = (1,500,000 - 600,000):800,000 = 1.13 :1
Acid test ratio Year 2 = (1,700,000 - 800,000):750,000 = 1.2:1
Efficiency ratios (page 30)
Q3: ROCE Year 1 = (250,000 / 1,000,000) x 100% = 25%
ROCE Year 2 = (300,000 / 1,100,000) x 100% = 27%.
Ratio analysis - a worked example (page 31)
Q4:
Year 2 Year 1
Net profit as a percentage of sales(700 / 7,000) x
100%10%
(970 / 6,300) x100%15%
Current ratio10,000 / 14,300
0.7:112,000 / 10,900
1.1:1
Return on capital employed(700 / 5,500) x
100%12.7%
(970 / 6,600) x100%16.1%
Share price (in £) 1.75 2.03
Q5: The net profit as a percentage of sales for both years is low. This suggests a smalloperating margin, meaning a high volume of sales must be sold to make a relativelysmall amount of profit, or that the mark-up on goods sold is small. It might also indicatethat expenses or purchasing costs are too high.
A decrease in net profit percentage from year one to year two is also concerning. Thisshows that the financial position of the business is declining.
A current ratio of 1.1:1 is concerning. If the business was required to pay its creditors it
© HERIOT-WATT UNIVERSITY

46 ANSWERS: TOPIC 3
would struggle. Although assets are greater than liabilities, much of their assets will betied up in stock.
A current ratio of 0.7:1 is very concerning. A business with liquidity problems is runningthe risk of not being able to pay employees, HMRC or suppliers. This could lead to thebusiness going into receivership. This business requires an injection of capital if it is tosurvive.
A decrease in the ROCE is concerning, although a ROCE of 12.7% still comparesfavourably to other investment options. In the longer term, this may further reduce theshare price.
A reduction in the share price is concerning as this business may need new investmentin the future as it has a poor current ratio. As the share price falls, so does the net worth.
End of Topic 3 test (page 35)
Q6: b) compare a business's performance over two time periods.
Q7: a) profitability ratio.
Q8: b) False
Q9: b) False
Q10: a) True
Q11: a) True
Q12: b) False
Q13:
Year 2 Year 1
Net profit as a percentage of sales 2,252 / 24,000 =9.4%
550 / 10,500 =5.2%
Current ratio18,000 / 8,000 =
2.2512,000 / 10,900
= 1.1:1
Return on capital employed 2,250 / 12,500 =18%
550 / 6,000 =9.2%
Share price (in £) 5.60 3.20
The net profit as a percentage of sales has doubled from year 1 to year 2. This suggestsan increase in the number of sales or an increase in selling price. It is also likely thatcosts of production have decreased. This is all positive.
A current ratio of 1.1:1 is very concerning. If the business was required to pay itscreditors it would struggle. Although assets are greater than liabilities, much of theirassets will be tied up in stock. An increase to 2.25 is very good news as anything over2:1 is positive. This means the business has been able to reduce its creditors whilstbuilding up its assets.
© HERIOT-WATT UNIVERSITY

ANSWERS: TOPIC 3 47
A doubling of the ROCE is very good news for current shareholders, who will see theirshare price increase. It may also encourage them to purchase more shares if they arereleased in the future.
An increase in the share price is encouraging as this business may wish to expandoperations in the future, funded by a release of new shares. As the share priceincreases, so does the net worth.
© HERIOT-WATT UNIVERSITY