Embed Size (px)
Citation preview
NeuroImage xxx (2012) xxx–xxx
YNIMG-09243; No. of pages: 19; 4C:
Contents lists available at SciVerse ScienceDirect
NeuroImage
j ourna l homepage: www.e lsev ie r .com/ locate /yn img
Review
Schizophrenia, neuroimaging and connectomics
Alex Fornito a,b,c,⁎, Andrew Zalesky a, Christos Pantelis a, Edward T. Bullmore d,e
a Melbourne Neuropsychiatry Centre, The University of Melbourne and Melbourne Health, Melbourne, Australiab NICTA Victorian Research Laboratory, The University of Melbourne, Melbourne, Australiac Centre for Neural Engineering, The University of Melbourne, Melbourne, Australiad Behavioural and Clinical Neuroscience Institute, The University of Cambridge, Cambridge, UKe Clinical Unit Cambridge, GlaxoSmithKline Cambridgeshire & Peterborough NHS Foundation Trust, Cambridge, UK
⁎ Corresponding author at: Melbourne NeuropsychiaE-mail address: [email protected] (A. Fornito
1053-8119/$ – see front matter © 2012 Elsevier Inc. Alldoi:10.1016/j.neuroimage.2011.12.090
Please cite this article as: Fornito, A.,j.neuroimage.2011.12.090
a b s t r a c t
a r t i c l e i n f oArticle history:Accepted 15 December 2011Available online xxxx
Keywords:ComplexResting stateCortexSmall worldDTIfMRI
Schizophrenia is frequently characterized as a disorder of brain connectivity. Neuroimaging has played a cen-tral role in supporting this view, with nearly two decades of research providing abundant evidence of struc-tural and functional connectivity abnormalities in the disorder. In recent years, our understanding of howschizophrenia affects brain networks has been greatly advanced by attempts to map the complete set ofinter-regional interactions comprising the brain's intricate web of connectivity; i.e., the human connectome.Imaging connectomics refers to the use of neuroimaging techniques to generate these maps which, combinedwith the application of graph theoretic methods, has enabled relatively comprehensive mapping of brain net-work connectivity and topology in unprecedented detail. Here, we review the application of these techniquesto the study of schizophrenia, focusing principally on magnetic resonance imaging (MRI) research, whiledrawing attention to key methodological issues in the field. The published findings suggest that schizophre-nia is associated with a widespread and possibly context-independent functional connectivity deficit, uponwhich are superimposed more circumscribed, context-dependent alterations associated with transient statesof hyper- and/or hypo-connectivity. In some cases, these changes in inter-regional functional coupling dy-namics can be related to measures of intra-regional dysfunction. Topological disturbances of functionalbrain networks in schizophrenia point to reduced local network connectivity and modular structure, aswell as increased global integration and network robustness. Some, but not all, of these functional abnormal-ities appear to have an anatomical basis, though the relationship between the two is complex. By comprehen-sively mapping connectomic disturbances in patients with schizophrenia across the entire brain, this workhas provided important insights into the highly distributed character of neural abnormalities in the disorder,and the potential functional consequences that these disturbances entail.
© 2012 Elsevier Inc. All rights reserved.
Contents
Introduction . . . . . . . . . . . . . . . . . . . . . . . . . . . . . . . . . . . . . . . . . . . . . . . . . . . . . . . . . . . . . . . . . 0A brief primer on connectomics . . . . . . . . . . . . . . . . . . . . . . . . . . . . . . . . . . . . . . . . . . . . . . . . . . . . . . . . 0
Node definition . . . . . . . . . . . . . . . . . . . . . . . . . . . . . . . . . . . . . . . . . . . . . . . . . . . . . . . . . . . . . 0Edge definition. . . . . . . . . . . . . . . . . . . . . . . . . . . . . . . . . . . . . . . . . . . . . . . . . . . . . . . . . . . . . . 0Comparing brain graphs . . . . . . . . . . . . . . . . . . . . . . . . . . . . . . . . . . . . . . . . . . . . . . . . . . . . . . . . . 0
Brain network connectivity in schizophrenia . . . . . . . . . . . . . . . . . . . . . . . . . . . . . . . . . . . . . . . . . . . . . . . . . . 0Is functional dysconnectivity in schizophrenia localized or diffuse? . . . . . . . . . . . . . . . . . . . . . . . . . . . . . . . . . . . . . 0Is functional connectivity in schizophrenia increased, decreased, or both? . . . . . . . . . . . . . . . . . . . . . . . . . . . . . . . . . . 0Is functional dysconnectivity in schizophrenia state-dependent? . . . . . . . . . . . . . . . . . . . . . . . . . . . . . . . . . . . . . . 0Does functional dysconnectivity in schizophrenia have a structural basis? . . . . . . . . . . . . . . . . . . . . . . . . . . . . . . . . . . 0Summary . . . . . . . . . . . . . . . . . . . . . . . . . . . . . . . . . . . . . . . . . . . . . . . . . . . . . . . . . . . . . . . . 0
Brain network topology in schizophrenia . . . . . . . . . . . . . . . . . . . . . . . . . . . . . . . . . . . . . . . . . . . . . . . . . . . . 0Global and local integration, efficiency and cost . . . . . . . . . . . . . . . . . . . . . . . . . . . . . . . . . . . . . . . . . . . . . . 0Degree distribution and robustness . . . . . . . . . . . . . . . . . . . . . . . . . . . . . . . . . . . . . . . . . . . . . . . . . . . . 0Modularity. . . . . . . . . . . . . . . . . . . . . . . . . . . . . . . . . . . . . . . . . . . . . . . . . . . . . . . . . . . . . . . . 0
try Centre, The University of Melbourne and Melbourne Health, Melbourne, Australia. Fax: +61 3 9348 0469.).
rights reserved.
et al., Schizophrenia, neuroimaging and connectomics, NeuroImage (2012), doi:10.1016/
2 A. Fornito et al. / NeuroImage xxx (2012) xxx–xxx
Summary . . . . . . . . . . . . . . . . . . . . . . . . . . . . . . . . . . . . . . . . . . . . . . . . . . . . . . . . . . . . . . . . 0Conclusions . . . . . . . . . . . . . . . . . . . . . . . . . . . . . . . . . . . . . . . . . . . . . . . . . . . . . . . . . . . . . . . . . . 0Financial disclosures. . . . . . . . . . . . . . . . . . . . . . . . . . . . . . . . . . . . . . . . . . . . . . . . . . . . . . . . . . . . . . 0Acknowledgments . . . . . . . . . . . . . . . . . . . . . . . . . . . . . . . . . . . . . . . . . . . . . . . . . . . . . . . . . . . . . . 0References . . . . . . . . . . . . . . . . . . . . . . . . . . . . . . . . . . . . . . . . . . . . . . . . . . . . . . . . . . . . . . . . . . 0
Introduction
Schizophrenia may be characterized as a prototypical disorder ofbrain connectivity. The very name implies a splitting (schizen) of themind's (phren) normally integrated processes. This breakdown is evi-dent in the disorder's clinical manifestations, including cognitive andaffective deficits, positive symptoms such as delusions, hallucinationsand thought disorder, and negative symptoms such as flattened affectand volitional disturbances. The link between these symptoms andbrain connectivity was not lost on early writers; over a century ago,Wernicke first suggested that the disorder arose from pathology ofthe brain's association fibers (1906; Figs. 7C and D) and Bleuler, whocoined the name schizophrenia, viewed a loosening of mental associa-tions as a cardinal feature of the illness (1911/1950). The advent ofmodern neuroimaging techniques has provided an unprecedented ca-pacity to test and extend these ideas via detailed mapping of brain net-work structure and dynamics. From the earliest in vivo demonstrationsof brain abnormalities in people with schizophrenia (Ingvar andFranzen, 1974a, 1974b; Johnstone et al., 1976), to the first study of con-nectivity disturbances in the disorder (Volkow et al., 1988), it did nottake long before connectivity-based hypotheses of schizophrenia re-emerged; first in the form of the disconnection hypothesis laid out byFriston and Frith (1995), followed by subsequent variants (Andreasenet al., 1998; Bullmore et al., 1997; Friston, 1998; McGuire and Frith,1996; Tononi and Edelman, 2000) and recently inmore general charac-terizations of schizophrenia as a dysconnection disorder1 (Pettersson-Yeo et al., 2011; Stephan et al., 2006, 2009).
In recent years, the study of connectivity abnormalities in schizo-phrenia has benefited greatly from rapid advances in the field of con-nectomics. Connectomics is an umbrella term that refers to scientificattempts to accurately map the set of neural elements and connec-tions comprising the brain, collectively referred to as the human con-nectome, at either mico-, meso- or macro-scopic resolutions (Sporns;Sporns et al., 2005). The term connectome was initially invoked inreference to a structural description of the brain's physical wiring,but the concept has since been extended to include maps of thebrain's functional interactions (e.g., Biswal et al., 2010), which are,by nature, more transient and state-dependent.
Imaging connectomics refers to the use of neuroimaging methodsto map various properties of structural and functional brain connec-tivity, principally at macroscopic resolution. In a general sense, imag-ing connectomics encompasses the full range of neuroimaginginvestigations into brain connectivity, including region-of-interestand voxel-wise mapping approaches. In a more specific sense howev-er, it refers to studies that aim to comprehensively map the large-scale architecture of the connectome by quantifying pair-wiseinteractions between large numbers of brain regions distributedthroughout the cerebrum. Methodological advances have enabledconstruction of these connectomic maps with increasing detail, and
1 The distinction between the prefixes dis and dyswas made by Stephan et al. (2006)on etymologic grounds. In Latin, dis implies apart, and suggests a disintegration or re-duction in connection. In Greek, dys connotes ‘bad’ or ‘ill’ and is favored because it isagnostic with respect to the direction of the abnormalities (i.e., increased or de-creased). In this article, we follow this distinction and use the term dysconnection ingeneral reference to connectivity abnormalities in schizophrenia, and not in referenceto the specific dysconnection hypothesis of the disorder proposed by Stephan andcolleagues.
Please cite this article as: Fornito, A., et al., Schizophrenia, neurj.neuroimage.2011.12.090
their application to schizophrenia has led to novel insights into howthe disorder affects distributed neural circuits. In this article, we crit-ically evaluate this literature, focusing principally on studies usingmagnetic resonance imaging (MRI). We consider how this work hasinformed our understandings of two key aspects of connectomic dis-turbance in schizophrenia—altered inter-regional connectivity and al-tered brain network topology—and discuss its implications forpathophysiological models while highlighting important methodo-logical issues. As a general orientation, we begin with a brief primeron the main principles and methods of imaging connectomics appliedthus far. (For reviews of other types of connectivity studies in schizo-phrenia, see Ellison-Wright and Bullmore, 2009; Konrad andWinterer, 2008; Pettersson-Yeo et al., 2011).
A brief primer on connectomics
A central tenet of the connectomic endeavor is that brain connec-tivity can be succinctly described as a connectivity matrix, C, whoserows and columns correspond to different brain regions. The ele-ments cij of C therefore index the degree of (structural or functional)interaction between regional pairs (Fig. 1). This representation allowsquantification of different aspects of network connectivity and topol-ogy, facilitated through the application of graph theory, a rich mathe-matical framework for the generic study of pair-wise relationsbetween interacting elements (Bollobás, 1985). Graph theory hasbeen applied to a wide range of technological (e.g., the world wideweb), social (e.g., collaborative networks in science), and biological(e.g., protein–protein interactions) networks (Barabasi and Oltvai,2004; Boccaletti et al., 2006; Newman, 2003). Such analyses haverevealed a striking conservation of certain organizational principlesacross these diverse datasets, suggesting that the human connectomemay be one example of a more general universality class of complexsystems found in nature (Bullmore et al., 2009).
Node definition
The connectivity matrix, C, can be represented in graph form,termed a brain graph (Bullmore and Bassett, 2011), as a collectionof nodes interconnected by edges (Fig. 1). The nodes should representdistinct, functionally homogeneous neural elements or brain regions.However, in the absence of any gold standard for large-scale parcella-tion of the brain on such grounds, the nodes are typically defined ar-bitrarily using various methods. The most common approach hasinvolved the use of an a priori anatomical parcellation, typically com-prising ~102 regions (e.g., Tzourio-Mazoyer et al., 2002; Fig. 1;Desikan et al., 2006). The boundaries of these parcellations are oftensubjective and may only marginally approximate true anatomicalborders. Moreover, the size of the resulting regions can vary consider-ably, biasing subsequent analyses (Salvador et al., 2007). One alterna-tive is to treat each voxel as a separate node, which results in verylarge, high-resolution networks (>104 nodes) (van den Heuvel etal., 2008; Fig. 1; Zalesky et al., 2011b) but may also yield noisy and/or underpowered estimation of brain network properties, given thatvoxels typically coalesce into functionally related clusters (thoughsee Zalesky et al., 2011b for an approach that exploits this property).A middle ground involves using random parcellations, comprising102 to 103 or more regions, constrained to minimize regional
oimaging and connectomics, NeuroImage (2012), doi:10.1016/
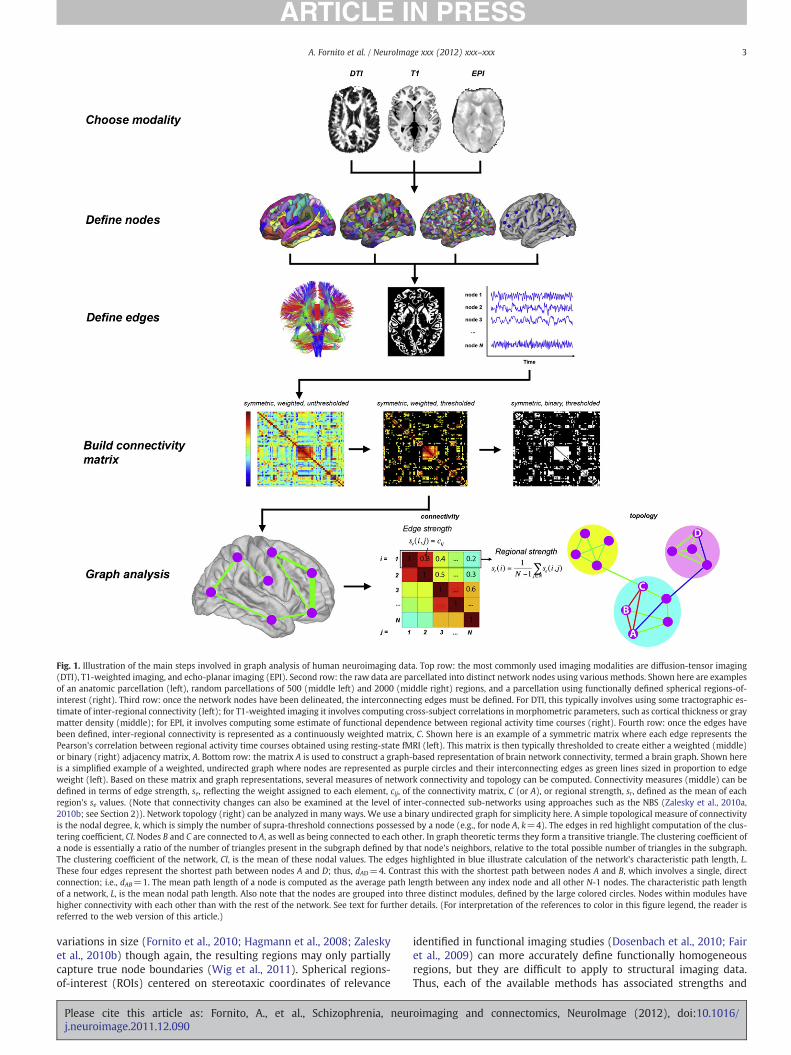
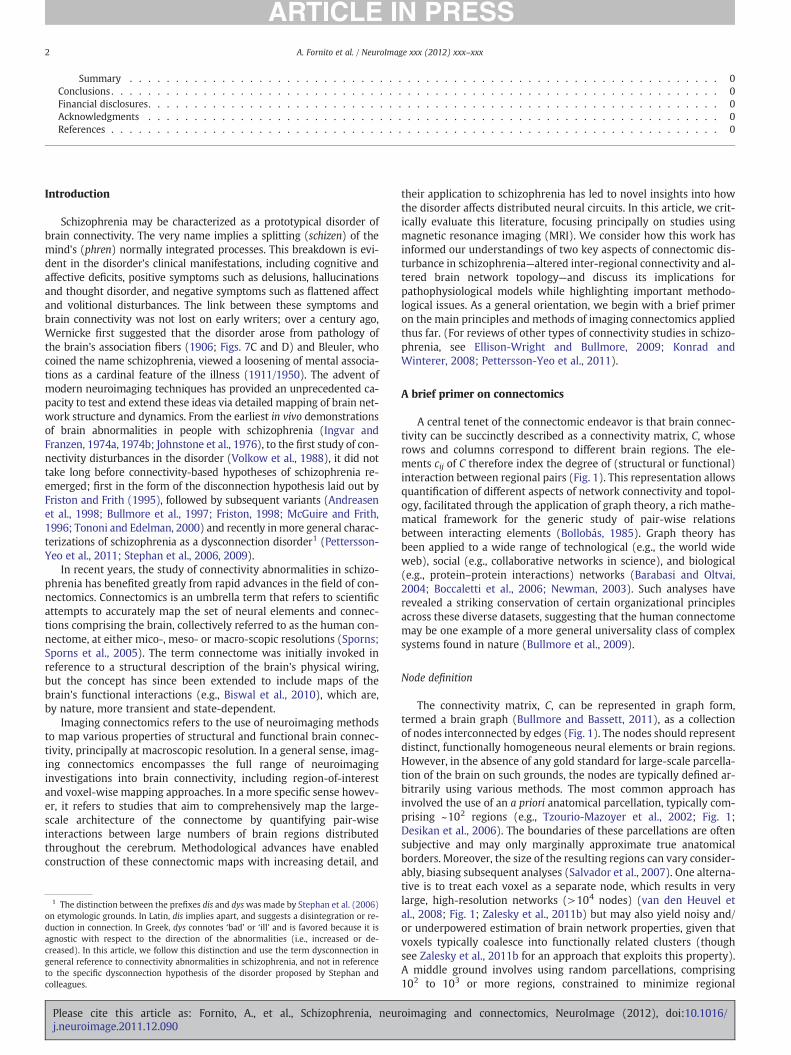
Fig. 1. Illustration of the main steps involved in graph analysis of human neuroimaging data. Top row: the most commonly used imaging modalities are diffusion-tensor imaging(DTI), T1-weighted imaging, and echo-planar imaging (EPI). Second row: the raw data are parcellated into distinct network nodes using various methods. Shown here are examplesof an anatomic parcellation (left), random parcellations of 500 (middle left) and 2000 (middle right) regions, and a parcellation using functionally defined spherical regions-of-interest (right). Third row: once the network nodes have been delineated, the interconnecting edges must be defined. For DTI, this typically involves using some tractographic es-timate of inter-regional connectivity (left); for T1-weighted imaging it involves computing cross-subject correlations in morphometric parameters, such as cortical thickness or graymatter density (middle); for EPI, it involves computing some estimate of functional dependence between regional activity time courses (right). Fourth row: once the edges havebeen defined, inter-regional connectivity is represented as a continuously weighted matrix, C. Shown here is an example of a symmetric matrix where each edge represents thePearson's correlation between regional activity time courses obtained using resting-state fMRI (left). This matrix is then typically thresholded to create either a weighted (middle)or binary (right) adjacency matrix, A. Bottom row: the matrix A is used to construct a graph-based representation of brain network connectivity, termed a brain graph. Shown hereis a simplified example of a weighted, undirected graph where nodes are represented as purple circles and their interconnecting edges as green lines sized in proportion to edgeweight (left). Based on these matrix and graph representations, several measures of network connectivity and topology can be computed. Connectivity measures (middle) can bedefined in terms of edge strength, se, reflecting the weight assigned to each element, cij, of the connectivity matrix, C (or A), or regional strength, sr, defined as the mean of eachregion's se values. (Note that connectivity changes can also be examined at the level of inter-connected sub-networks using approaches such as the NBS (Zalesky et al., 2010a,2010b; see Section 2)). Network topology (right) can be analyzed in many ways. We use a binary undirected graph for simplicity here. A simple topological measure of connectivityis the nodal degree, k, which is simply the number of supra-threshold connections possessed by a node (e.g., for node A, k=4). The edges in red highlight computation of the clus-tering coefficient, Cl. Nodes B and C are connected to A, as well as being connected to each other. In graph theoretic terms they form a transitive triangle. The clustering coefficient ofa node is essentially a ratio of the number of triangles present in the subgraph defined by that node's neighbors, relative to the total possible number of triangles in the subgraph.The clustering coefficient of the network, Cl, is the mean of these nodal values. The edges highlighted in blue illustrate calculation of the network's characteristic path length, L.These four edges represent the shortest path between nodes A and D; thus, dAD=4. Contrast this with the shortest path between nodes A and B, which involves a single, directconnection; i.e., dAB=1. The mean path length of a node is computed as the average path length between any index node and all other N-1 nodes. The characteristic path lengthof a network, L, is the mean nodal path length. Also note that the nodes are grouped into three distinct modules, defined by the large colored circles. Nodes within modules havehigher connectivity with each other than with the rest of the network. See text for further details. (For interpretation of the references to color in this figure legend, the reader isreferred to the web version of this article.)
3A. Fornito et al. / NeuroImage xxx (2012) xxx–xxx
variations in size (Fornito et al., 2010; Hagmann et al., 2008; Zaleskyet al., 2010b) though again, the resulting regions may only partiallycapture true node boundaries (Wig et al., 2011). Spherical regions-of-interest (ROIs) centered on stereotaxic coordinates of relevance
Please cite this article as: Fornito, A., et al., Schizophrenia, neurj.neuroimage.2011.12.090
identified in functional imaging studies (Dosenbach et al., 2010; Fairet al., 2009) can more accurately define functionally homogeneousregions, but they are difficult to apply to structural imaging data.Thus, each of the available methods has associated strengths and
oimaging and connectomics, NeuroImage (2012), doi:10.1016/
4 A. Fornito et al. / NeuroImage xxx (2012) xxx–xxx
limitations. Evidence that differences in node definitions can affectnetwork properties (Fornito et al., 2010; Hayasaka and Laurienti,2010; Wang et al., 2009a; Zalesky et al., 2010b), and that invalidnode definitions can distort estimates of true network interactions(Smith et al., 2011), underscores the caution that should be exercisedwhen defining nodes for graph analytic MRI (ga-MRI) studies.
Edge definition
Edges can also be defined in various ways. They can be eitherweighted according to the strength ofmeasured connectivity betweenregions or unweighted and binary (i.e., a connection is either presentor not) (Fig. 1). They can also be undirected, meaning that C is sym-metric (i.e., cij=cji), or directed, to represent the causal structure ofthe network (i.e., C is asymmetric and cij≠cji). In imaging connec-tomics, the edges describe the degree of either anatomical connectiv-ity or functional interaction between network nodes. In MRI studies,anatomical connectivity is defined using either T1- or diffusion-weightedMRI.With the former approach, connectivity is indirectly es-timated as the cross-subject correlation between regional morpho-metric parameters, such as gray matter volume or cortical thickness(e.g., Bassett et al., 2008). In diffusion-weighted MRI, connectivity istypically inferred from a tractographic estimate of anatomical
Fig. 2. Illustration of the relationship between thresholding and connectivity weight. A, A rep(right) from the sample analyzed in Fornito et al. (2011c). The network comprised 78 anatonique (see Fig. 5). B, The distribution of connectivity weights, cij is shifted towards lower vathe excess number of low weighted values in the patient's connectivity matrix. C, The differeold, κ; applying the same τ threshold (solid lines) to the patient and control (e.g., τ=.20) rbroken lines) results in a different minimum correlation weight threshold. D, The correlatipatient and control is the same and the mean weight is approximately equal, but the connecThe connection densities are equivalent, but the minimum and mean weight for the patientlow-value weights. (For interpretation of the references to color in this figure legend, the r
Please cite this article as: Fornito, A., et al., Schizophrenia, neurj.neuroimage.2011.12.090
connections between regional pairs, such as the number of intersect-ing reconstructed fiber trajectories (e.g., Zalesky et al., 2011a), orsome index of fiber integrity averaged over the reconstructed tract(e.g., van den Heuvel et al., 2010). In both cases, the resulting edgeswill be undirected (it is currently not possible to resolve fiber tract di-rection using current imaging techniques) and are typically weighted.
MRI studies of functional brain network interactions generally useblood-oxygenation-level-dependent (BOLD) functional MRI (fMRI),and the network edges measure either functional or effective connec-tivity between regional pairs. Functional connectivity reflects the sta-tistical dependence between neurophysiological signals recordedfrom each network node. The dependence can be estimated using nu-merous techniques (see Bullmore and Bassett, 2011). Most commonlyhowever, it is computed using the simple Pearson correlation be-tween regional activity time courses, resulting in edges that areweighted and undirected. Effective connectivity is defined as the in-fluence that one brain region exerts over another and explicitlymodels the causal structure of inter-regional interactions, resultingin a weighted, directed connectivity matrix. Dynamic causal modeling(DCM) (Friston et al., 2003) and granger causality analysis (Goebel etal., 2003) are two examples of methods designed to model effectiveconnectivity between regions, though inferring causal interactionsfrom BOLD measurements is often computationally intensive and
resentative functional connectivity matrix taken from a single patient (left) and controlmical nodes interconnected by 3003 edges, defined using a beta series correlation tech-lues in the patient (red) relative to the control (blue); the area shaded in red highlightsnce between using a weight-based threshold, τ, and a connection density-based thresh-esults in different connection densities whereas applying the same κ threshold (e.g., κ;on matrices after τ matched thresholding. The minimum weight in the matrix for thetion density is very different. E, The connectivity matrices after κmatched thresholding.is lower than for the control. Thus, the patient's connectivity matrix will contain moreeader is referred to the web version of this article.)
oimaging and connectomics, NeuroImage (2012), doi:10.1016/
5A. Fornito et al. / NeuroImage xxx (2012) xxx–xxx
subject to controversy (David, 2011; Friston, 2009; Roebroeck et al.,2011a, 2011b). As such, most imaging connectomic studies of schizo-phrenia to date have been concerned with analysis of undirectededges; that is, functional connectivity between regional pairs.
Comparing brain graphs
Most graph theoretic measures are dependent on the number ofnetwork nodes and edges. Consequently, graphs should only be com-pared if they are matched for the number of nodes, N, and connectiondensity, 0bκb1. The connection density is simply the total number ofnon-zero edges in the connectivity matrix relative to the totalN N−1ð Þ=2 possible number of edges. Connectivity matrices definedusing ga-MRI are often continuously weighted, and so κ is typicallydefined by applying an arbitrary threshold to remove spurious associ-ations and emphasize key topological properties. The result is a thre-sholded adjacency matrix, A, which is used to generate the braingraph (Fig. 1). Matching for κ in case–control comparisons poses a
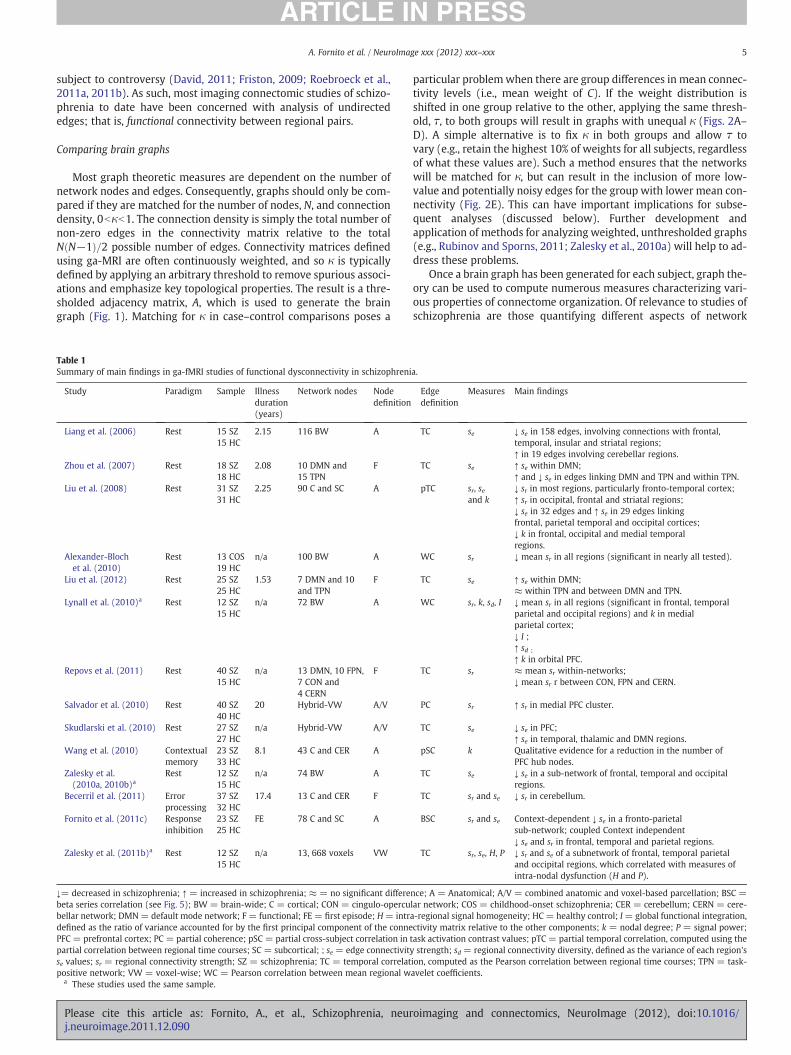
Table 1Summary of main findings in ga-fMRI studies of functional dysconnectivity in schizophreni
Study Paradigm Sample Illnessduration(years)
Network nodes Nodedefinition
Liang et al. (2006) Rest 15 SZ15 HC
2.15 116 BW A
Zhou et al. (2007) Rest 18 SZ18 HC
2.08 10 DMN and15 TPN
F
Liu et al. (2008) Rest 31 SZ31 HC
2.25 90 C and SC A
Alexander-Blochet al. (2010)
Rest 13 COS19 HC
n/a 100 BW A
Liu et al. (2012) Rest 25 SZ25 HC
1.53 7 DMN and 10and TPN
F
Lynall et al. (2010)a Rest 12 SZ15 HC
n/a 72 BW A
Repovs et al. (2011) Rest 40 SZ15 HC
n/a 13 DMN, 10 FPN,7 CON and4 CERN
F
Salvador et al. (2010) Rest 40 SZ40 HC
20 Hybrid-VW A/V
Skudlarski et al. (2010) Rest 27 SZ27 HC
n/a Hybrid-VW A/V
Wang et al. (2010) Contextualmemory
23 SZ33 HC
8.1 43 C and CER A
Zalesky et al.(2010a, 2010b)a
Rest 12 SZ15 HC
n/a 74 BW A
Becerril et al. (2011) Errorprocessing
37 SZ32 HC
17.4 13 C and CER F
Fornito et al. (2011c) Responseinhibition
23 SZ25 HC
FE 78 C and SC A
Zalesky et al. (2011b)a Rest 12 SZ15 HC
n/a 13, 668 voxels VW
↓= decreased in schizophrenia; ↑ = increased in schizophrenia; ≈ = no significant differebeta series correlation (see Fig. 5); BW = brain-wide; C = cortical; CON = cingulo-opercubellar network; DMN = default mode network; F = functional; FE = first episode; H= intrdefined as the ratio of variance accounted for by the first principal component of the connePFC = prefrontal cortex; PC = partial coherence; pSC = partial cross-subject correlation inpartial correlation between regional time courses; SC = subcortical; ; se = edge connectivityse values; sr = regional connectivity strength; SZ = schizophrenia; TC = temporal correlatpositive network; VW = voxel-wise; WC = Pearson correlation between mean regional w
a These studies used the same sample.
Please cite this article as: Fornito, A., et al., Schizophrenia, neurj.neuroimage.2011.12.090
particular problemwhen there are group differences in mean connec-tivity levels (i.e., mean weight of C). If the weight distribution isshifted in one group relative to the other, applying the same thresh-old, τ, to both groups will result in graphs with unequal κ (Figs. 2A–D). A simple alternative is to fix κ in both groups and allow τ tovary (e.g., retain the highest 10% of weights for all subjects, regardlessof what these values are). Such a method ensures that the networkswill be matched for κ, but can result in the inclusion of more low-value and potentially noisy edges for the group with lower mean con-nectivity (Fig. 2E). This can have important implications for subse-quent analyses (discussed below). Further development andapplication of methods for analyzing weighted, unthresholded graphs(e.g., Rubinov and Sporns, 2011; Zalesky et al., 2010a) will help to ad-dress these problems.
Once a brain graph has been generated for each subject, graph the-ory can be used to compute numerous measures characterizing vari-ous properties of connectome organization. Of relevance to studies ofschizophrenia are those quantifying different aspects of network
a.
Edgedefinition
Measures Main findings
TC se ↓ se in 158 edges, involving connections with frontal,temporal, insular and striatal regions;↑ in 19 edges involving cerebellar regions.
TC se ↑ se within DMN;↑ and ↓ se in edges linking DMN and TPN and within TPN.
pTC sr, seand k
↓ sr in most regions, particularly fronto-temporal cortex;↑ sr in occipital, frontal and striatal regions;↓ se in 32 edges and ↑ se in 29 edges linkingfrontal, parietal temporal and occipital cortices;↓ k in frontal, occipital and medial temporalregions.
WC sr ↓ mean sr in all regions (significant in nearly all tested).
TC se ↑ se within DMN;≈ within TPN and between DMN and TPN.
WC sr, k, sd, I ↓ mean sr in all regions (significant in frontal, temporalparietal and occipital regions) and k in medialparietal cortex;↓ I ;↑ sd ;
↑ k in orbital PFC.TC sr ≈ mean sr within-networks;
↓ mean sr r between CON, FPN and CERN.
PC sr ↑ sr in medial PFC cluster.
TC se ↓ se in PFC;↑ se in temporal, thalamic and DMN regions.
pSC k Qualitative evidence for a reduction in the number ofPFC hub nodes.
TC se ↓ se in a sub-network of frontal, temporal and occipitalregions.
TC sr and se ↓ sr in cerebellum.
BSC sr and se Context-dependent ↓ se in a fronto-parietalsub-network; coupled Context independent↓ se and sr in frontal, temporal and parietal regions.
TC sr, se, H, P ↓ sr and se of a subnetwork of frontal, temporal parietaland occipital regions, which correlated with measures ofintra-nodal dysfunction (H and P).
nce; A = Anatomical; A/V = combined anatomic and voxel-based parcellation; BSC =lar network; COS = childhood-onset schizophrenia; CER = cerebellum; CERN = cere-a-regional signal homogeneity; HC = healthy control; I= global functional integration,ctivity matrix relative to the other components; k = nodal degree; P = signal power;task activation contrast values; pTC = partial temporal correlation, computed using thestrength; sd = regional connectivity diversity, defined as the variance of each region's
ion, computed as the Pearson correlation between regional time courses; TPN = task-avelet coefficients.
oimaging and connectomics, NeuroImage (2012), doi:10.1016/
6 A. Fornito et al. / NeuroImage xxx (2012) xxx–xxx
connectivity and topology. The following discussion is organizedaccording to these two major themes.
Brain network connectivity in schizophrenia
Most imaging connectomic studies of schizophrenia have investi-gated functional brain networks so our discussion is anchored onthis work. In particular, we focus on four key issues in the literature;namely whether functional dysconnectivity in the disorder (1) is lo-calized or diffuse, (2) abnormally increased or decreased, (3) state-dependent, and (4) has a structural basis.
Is functional dysconnectivity in schizophrenia localized or diffuse?
ga-fMRI studies of functional brain networks in schizophrenia (seeTable 1) have localized functional connectivity abnormalities at threedifferent levels: (1) regionally, either in terms of regional connectivi-ty strength, sr, or (for binary graphs) nodal degree, k (Fig. 1, bottomrow, middle); (2) at the level of single edges, using edge strength,se, (Fig. 1, bottom row, middle); and (3) at the level of interconnectedsubnetworks, using techniques such as the network-based statistic(NBS) (Zalesky et al., 2010a). The last provides substantially morepower than will be afforded by testing large numbers of pairwise con-nections (e.g., mass bivariate hypothesis testing of each se value in C)when effects are distributed over multiple linked edges.
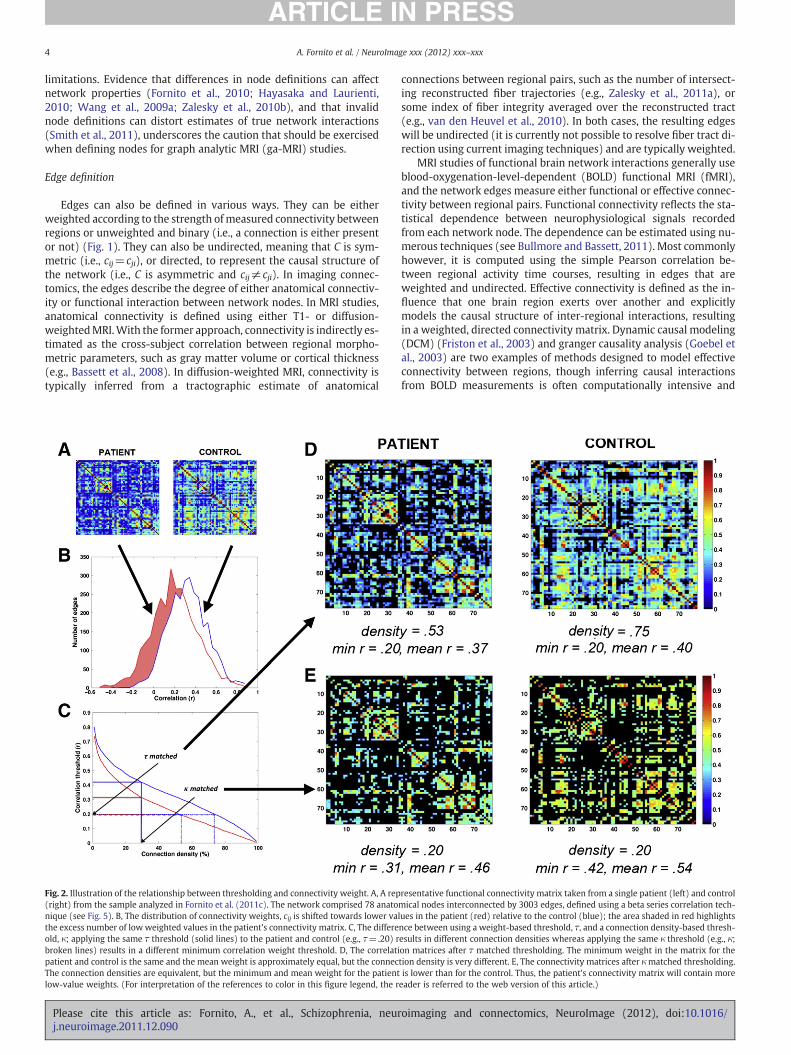
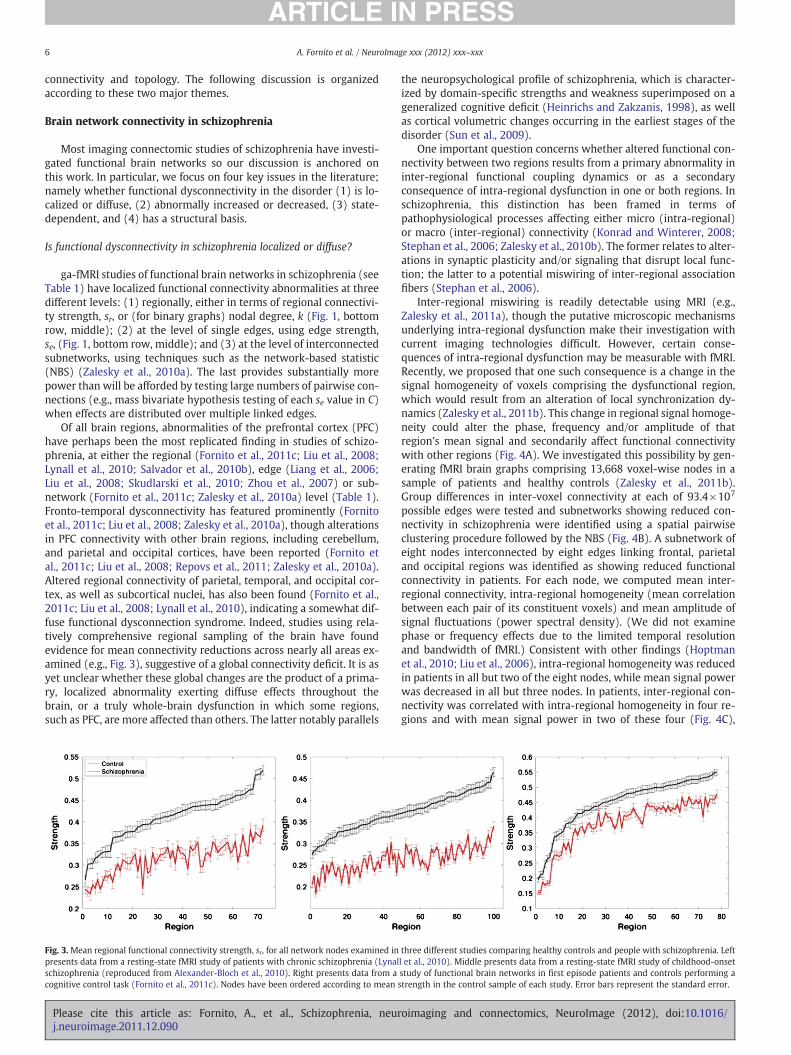
Of all brain regions, abnormalities of the prefrontal cortex (PFC)have perhaps been the most replicated finding in studies of schizo-phrenia, at either the regional (Fornito et al., 2011c; Liu et al., 2008;Lynall et al., 2010; Salvador et al., 2010b), edge (Liang et al., 2006;Liu et al., 2008; Skudlarski et al., 2010; Zhou et al., 2007) or sub-network (Fornito et al., 2011c; Zalesky et al., 2010a) level (Table 1).Fronto-temporal dysconnectivity has featured prominently (Fornitoet al., 2011c; Liu et al., 2008; Zalesky et al., 2010a), though alterationsin PFC connectivity with other brain regions, including cerebellum,and parietal and occipital cortices, have been reported (Fornito etal., 2011c; Liu et al., 2008; Repovs et al., 2011; Zalesky et al., 2010a).Altered regional connectivity of parietal, temporal, and occipital cor-tex, as well as subcortical nuclei, has also been found (Fornito et al.,2011c; Liu et al., 2008; Lynall et al., 2010), indicating a somewhat dif-fuse functional dysconnection syndrome. Indeed, studies using rela-tively comprehensive regional sampling of the brain have foundevidence for mean connectivity reductions across nearly all areas ex-amined (e.g., Fig. 3), suggestive of a global connectivity deficit. It is asyet unclear whether these global changes are the product of a prima-ry, localized abnormality exerting diffuse effects throughout thebrain, or a truly whole-brain dysfunction in which some regions,such as PFC, are more affected than others. The latter notably parallels
Fig. 3. Mean regional functional connectivity strength, sr, for all network nodes examined inpresents data from a resting-state fMRI study of patients with chronic schizophrenia (Lynalschizophrenia (reproduced from Alexander-Bloch et al., 2010). Right presents data from acognitive control task (Fornito et al., 2011c). Nodes have been ordered according to mean
Please cite this article as: Fornito, A., et al., Schizophrenia, neurj.neuroimage.2011.12.090
the neuropsychological profile of schizophrenia, which is character-ized by domain-specific strengths and weakness superimposed on ageneralized cognitive deficit (Heinrichs and Zakzanis, 1998), as wellas cortical volumetric changes occurring in the earliest stages of thedisorder (Sun et al., 2009).
One important question concerns whether altered functional con-nectivity between two regions results from a primary abnormality ininter-regional functional coupling dynamics or as a secondaryconsequence of intra-regional dysfunction in one or both regions. Inschizophrenia, this distinction has been framed in terms ofpathophysiological processes affecting either micro (intra-regional)or macro (inter-regional) connectivity (Konrad and Winterer, 2008;Stephan et al., 2006; Zalesky et al., 2010b). The former relates to alter-ations in synaptic plasticity and/or signaling that disrupt local func-tion; the latter to a potential miswiring of inter-regional associationfibers (Stephan et al., 2006).
Inter-regional miswiring is readily detectable using MRI (e.g.,Zalesky et al., 2011a), though the putative microscopic mechanismsunderlying intra-regional dysfunction make their investigation withcurrent imaging technologies difficult. However, certain conse-quences of intra-regional dysfunction may be measurable with fMRI.Recently, we proposed that one such consequence is a change in thesignal homogeneity of voxels comprising the dysfunctional region,which would result from an alteration of local synchronization dy-namics (Zalesky et al., 2011b). This change in regional signal homoge-neity could alter the phase, frequency and/or amplitude of thatregion's mean signal and secondarily affect functional connectivitywith other regions (Fig. 4A). We investigated this possibility by gen-erating fMRI brain graphs comprising 13,668 voxel-wise nodes in asample of patients and healthy controls (Zalesky et al., 2011b).Group differences in inter-voxel connectivity at each of 93.4×10⁷
possible edges were tested and subnetworks showing reduced con-nectivity in schizophrenia were identified using a spatial pairwiseclustering procedure followed by the NBS (Fig. 4B). A subnetwork ofeight nodes interconnected by eight edges linking frontal, parietaland occipital regions was identified as showing reduced functionalconnectivity in patients. For each node, we computed mean inter-regional connectivity, intra-regional homogeneity (mean correlationbetween each pair of its constituent voxels) and mean amplitude ofsignal fluctuations (power spectral density). (We did not examinephase or frequency effects due to the limited temporal resolutionand bandwidth of fMRI.) Consistent with other findings (Hoptmanet al., 2010; Liu et al., 2006), intra-regional homogeneity was reducedin patients in all but two of the eight nodes, while mean signal powerwas decreased in all but three nodes. In patients, inter-regional con-nectivity was correlated with intra-regional homogeneity in four re-gions and with mean signal power in two of these four (Fig. 4C),
three different studies comparing healthy controls and people with schizophrenia. Leftl et al., 2010). Middle presents data from a resting-state fMRI study of childhood-onsetstudy of functional brain networks in first episode patients and controls performing astrength in the control sample of each study. Error bars represent the standard error.
oimaging and connectomics, NeuroImage (2012), doi:10.1016/
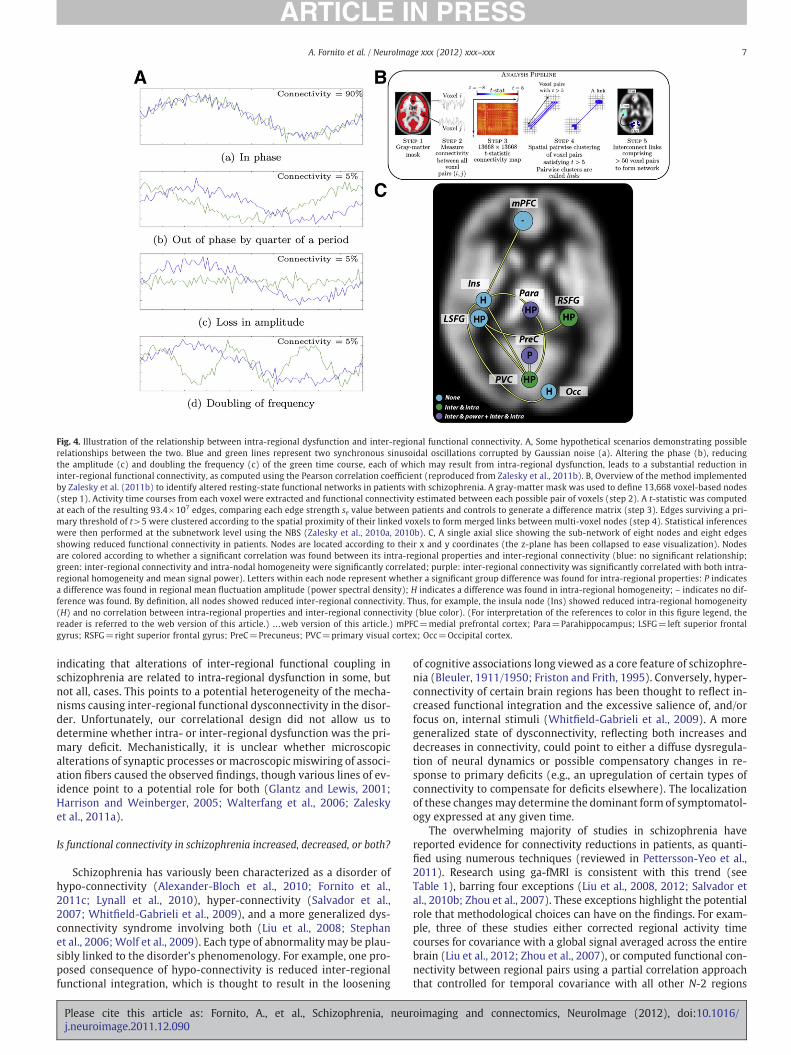
Fig. 4. Illustration of the relationship between intra-regional dysfunction and inter-regional functional connectivity. A, Some hypothetical scenarios demonstrating possiblerelationships between the two. Blue and green lines represent two synchronous sinusoidal oscillations corrupted by Gaussian noise (a). Altering the phase (b), reducingthe amplitude (c) and doubling the frequency (c) of the green time course, each of which may result from intra-regional dysfunction, leads to a substantial reduction ininter-regional functional connectivity, as computed using the Pearson correlation coefficient (reproduced from Zalesky et al., 2011b). B, Overview of the method implementedby Zalesky et al. (2011b) to identify altered resting-state functional networks in patients with schizophrenia. A gray-matter mask was used to define 13,668 voxel-based nodes(step 1). Activity time courses from each voxel were extracted and functional connectivity estimated between each possible pair of voxels (step 2). A t-statistic was computedat each of the resulting 93.4×10⁷ edges, comparing each edge strength se value between patients and controls to generate a difference matrix (step 3). Edges surviving a pri-mary threshold of t>5 were clustered according to the spatial proximity of their linked voxels to form merged links between multi-voxel nodes (step 4). Statistical inferenceswere then performed at the subnetwork level using the NBS (Zalesky et al., 2010a, 2010b). C, A single axial slice showing the sub-network of eight nodes and eight edgesshowing reduced functional connectivity in patients. Nodes are located according to their x and y coordinates (the z-plane has been collapsed to ease visualization). Nodesare colored according to whether a significant correlation was found between its intra-regional properties and inter-regional connectivity (blue: no significant relationship;green: inter-regional connectivity and intra-nodal homogeneity were significantly correlated; purple: inter-regional connectivity was significantly correlated with both intra-regional homogeneity and mean signal power). Letters within each node represent whether a significant group difference was found for intra-regional properties: P indicatesa difference was found in regional mean fluctuation amplitude (power spectral density); H indicates a difference was found in intra-regional homogeneity; – indicates no dif-ference was found. By definition, all nodes showed reduced inter-regional connectivity. Thus, for example, the insula node (Ins) showed reduced intra-regional homogeneity(H) and no correlation between intra-regional properties and inter-regional connectivity (blue color). (For interpretation of the references to color in this figure legend, thereader is referred to the web version of this article.) …web version of this article.) mPFC=medial prefrontal cortex; Para=Parahippocampus; LSFG=left superior frontalgyrus; RSFG=right superior frontal gyrus; PreC=Precuneus; PVC=primary visual cortex; Occ=Occipital cortex.
7A. Fornito et al. / NeuroImage xxx (2012) xxx–xxx
indicating that alterations of inter-regional functional coupling inschizophrenia are related to intra-regional dysfunction in some, butnot all, cases. This points to a potential heterogeneity of the mecha-nisms causing inter-regional functional dysconnectivity in the disor-der. Unfortunately, our correlational design did not allow us todetermine whether intra- or inter-regional dysfunction was the pri-mary deficit. Mechanistically, it is unclear whether microscopicalterations of synaptic processes or macroscopic miswiring of associ-ation fibers caused the observed findings, though various lines of ev-idence point to a potential role for both (Glantz and Lewis, 2001;Harrison and Weinberger, 2005; Walterfang et al., 2006; Zaleskyet al., 2011a).
Is functional connectivity in schizophrenia increased, decreased, or both?
Schizophrenia has variously been characterized as a disorder ofhypo-connectivity (Alexander-Bloch et al., 2010; Fornito et al.,2011c; Lynall et al., 2010), hyper-connectivity (Salvador et al.,2007; Whitfield-Gabrieli et al., 2009), and a more generalized dys-connectivity syndrome involving both (Liu et al., 2008; Stephanet al., 2006; Wolf et al., 2009). Each type of abnormality may be plau-sibly linked to the disorder's phenomenology. For example, one pro-posed consequence of hypo-connectivity is reduced inter-regionalfunctional integration, which is thought to result in the loosening
Please cite this article as: Fornito, A., et al., Schizophrenia, neurj.neuroimage.2011.12.090
of cognitive associations long viewed as a core feature of schizophre-nia (Bleuler, 1911/1950; Friston and Frith, 1995). Conversely, hyper-connectivity of certain brain regions has been thought to reflect in-creased functional integration and the excessive salience of, and/orfocus on, internal stimuli (Whitfield-Gabrieli et al., 2009). A moregeneralized state of dysconnectivity, reflecting both increases anddecreases in connectivity, could point to either a diffuse dysregula-tion of neural dynamics or possible compensatory changes in re-sponse to primary deficits (e.g., an upregulation of certain types ofconnectivity to compensate for deficits elsewhere). The localizationof these changesmay determine the dominant form of symptomatol-ogy expressed at any given time.
The overwhelming majority of studies in schizophrenia havereported evidence for connectivity reductions in patients, as quanti-fied using numerous techniques (reviewed in Pettersson-Yeo et al.,2011). Research using ga-fMRI is consistent with this trend (seeTable 1), barring four exceptions (Liu et al., 2008, 2012; Salvador etal., 2010b; Zhou et al., 2007). These exceptions highlight the potentialrole that methodological choices can have on the findings. For exam-ple, three of these studies either corrected regional activity timecourses for covariance with a global signal averaged across the entirebrain (Liu et al., 2012; Zhou et al., 2007), or computed functional con-nectivity between regional pairs using a partial correlation approachthat controlled for temporal covariance with all other N-2 regions
oimaging and connectomics, NeuroImage (2012), doi:10.1016/
8 A. Fornito et al. / NeuroImage xxx (2012) xxx–xxx
(Liu et al., 2008). While these methods can increase the specificity offunctional connectivity measures and correct for sources of non-neuronal physiological noise (Fox et al., 2009; Van Dijk et al.,2010), they also shift the distribution of connectivity weights cij inC so that it is approximately centered on zero. This results in agreater proportion of negative weights, some of which may be spu-rious (Fox et al., 2009; Murphy et al., 2009). As a result, a connectiv-ity increase in patients could either be due to a stronger positivecorrelation, reflecting a genuine functional connectivity increase,or a weaker negative correlation, indicating a reduction in (nega-tive) functional connectivity. These possibilities suggest distinctpathophysiological interpretations. Thus, while the appearance ofnegative weights in a connectivity matrix does not necessarily in-validate subsequent analyses (Fox et al., 2009), care should betaken to consider the sign of these weights when interpretinggroup differences in se or sr.
Salvador et al. (2010a, 2010b) found evidence of increased medialPFC connectivity, as estimated using partial coherence, in patientsusing a hybrid parcellation method that enabled voxel-resolutionmapping of connectivity differences. Other studies using more re-fined, functional or voxel-based node definitions have also reportedincreased connectivity in patients (Liu et al., 2012; Skudlarski et al.,2010; Zhou et al., 2007), suggesting that the resolution of analysismay also affect whether increases or decreases are observed. Howev-er, significant connectivity decreases in the absence of increases havebeen found in studies where global signal correction and/or high res-olution, functionally defined nodes have been used (Repovs et al.,2011; Zalesky et al., 2011b), indicating that these methods do not al-ways lead to abnormally increased connectivity in patients. Furtherwork examining how variations in node and edge definition affectwhether findings of increased or decreased connectivity are reportedin schizophrenia will be necessary before firm conclusions can bedrawn on the pathophysiological significance of these changes.
Symptomatology at the time of scanning may influence whetherhyper- or hypo-connectivity is found in patients, as positive associations
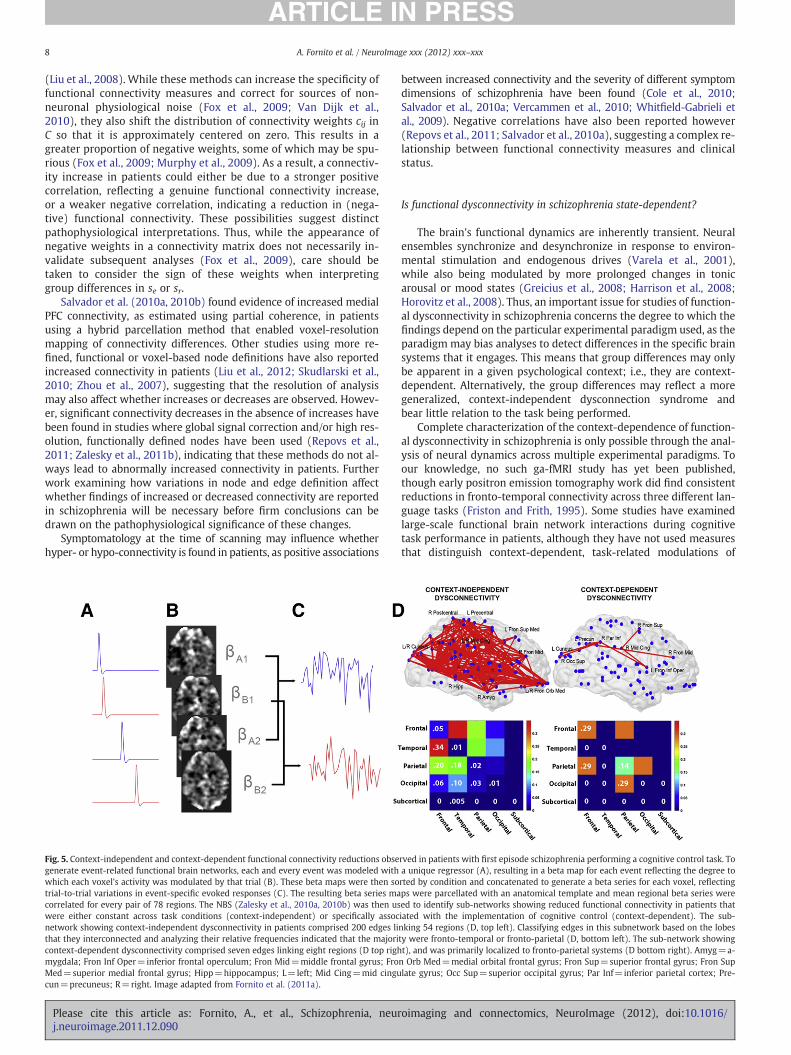
Fig. 5. Context-independent and context-dependent functional connectivity reductions obsegenerate event-related functional brain networks, each and every event was modeled withwhich each voxel's activity was modulated by that trial (B). These beta maps were then sotrial-to-trial variations in event-specific evoked responses (C). The resulting beta series macorrelated for every pair of 78 regions. The NBS (Zalesky et al., 2010a, 2010b) was then uswere either constant across task conditions (context-independent) or specifically assocnetwork showing context-independent dysconnectivity in patients comprised 200 edges lithat they interconnected and analyzing their relative frequencies indicated that the majoricontext-dependent dysconnectivity comprised seven edges linking eight regions (D top righmygdala; Fron Inf Oper=inferior frontal operculum; Fron Mid=middle frontal gyrus; FroMed=superior medial frontal gyrus; Hipp=hippocampus; L=left; Mid Cing=mid cingucun=precuneus; R=right. Image adapted from Fornito et al. (2011a).
Please cite this article as: Fornito, A., et al., Schizophrenia, neurj.neuroimage.2011.12.090
between increased connectivity and the severity of different symptomdimensions of schizophrenia have been found (Cole et al., 2010;Salvador et al., 2010a; Vercammen et al., 2010; Whitfield-Gabrieli etal., 2009). Negative correlations have also been reported however(Repovs et al., 2011; Salvador et al., 2010a), suggesting a complex re-lationship between functional connectivity measures and clinicalstatus.
Is functional dysconnectivity in schizophrenia state-dependent?
The brain's functional dynamics are inherently transient. Neuralensembles synchronize and desynchronize in response to environ-mental stimulation and endogenous drives (Varela et al., 2001),while also being modulated by more prolonged changes in tonicarousal or mood states (Greicius et al., 2008; Harrison et al., 2008;Horovitz et al., 2008). Thus, an important issue for studies of function-al dysconnectivity in schizophrenia concerns the degree to which thefindings depend on the particular experimental paradigm used, as theparadigm may bias analyses to detect differences in the specific brainsystems that it engages. This means that group differences may onlybe apparent in a given psychological context; i.e., they are context-dependent. Alternatively, the group differences may reflect a moregeneralized, context-independent dysconnection syndrome andbear little relation to the task being performed.
Complete characterization of the context-dependence of function-al dysconnectivity in schizophrenia is only possible through the anal-ysis of neural dynamics across multiple experimental paradigms. Toour knowledge, no such ga-fMRI study has yet been published,though early positron emission tomography work did find consistentreductions in fronto-temporal connectivity across three different lan-guage tasks (Friston and Frith, 1995). Some studies have examinedlarge-scale functional brain network interactions during cognitivetask performance in patients, although they have not used measuresthat distinguish context-dependent, task-related modulations of
rved in patients with first episode schizophrenia performing a cognitive control task. Toa unique regressor (A), resulting in a beta map for each event reflecting the degree torted by condition and concatenated to generate a beta series for each voxel, reflectingps were parcellated with an anatomical template and mean regional beta series wereed to identify sub-networks showing reduced functional connectivity in patients thatiated with the implementation of cognitive control (context-dependent). The sub-nking 54 regions (D, top left). Classifying edges in this subnetwork based on the lobesty were fronto-temporal or fronto-parietal (D, bottom left). The sub-network showingt), and was primarily localized to fronto-parietal systems (D bottom right). Amyg=a-n Orb Med=medial orbital frontal gyrus; Fron Sup=superior frontal gyrus; Fron Suplate gyrus; Occ Sup=superior occipital gyrus; Par Inf=inferior parietal cortex; Pre-
oimaging and connectomics, NeuroImage (2012), doi:10.1016/
9A. Fornito et al. / NeuroImage xxx (2012) xxx–xxx
functional connectivity from generic, task-unrelated dynamics (Lordet al., 2011; Wang et al., 2010; Yu et al., 2011).
We recently analyzed context-dependent and context-indepen-dent inter-regional functional interactions during performance ofone specific task assessing cognitive control by using a beta series cor-relation approach (Rissman et al., 2004; Yoon et al., 2008) to generatemeasures of event-related functional connectivity for each task con-dition (Fornito et al., 2011c) (Figs. 5A–C). The method allowed us totest for main effects of group, task and their interaction, on functionalconnectivity measured using sr and se. The main effect, reflecting dif-ferences between patients and controls that were insensitive to taskdemands (i.e., context-independent), revealed a marked, widespreadreduction of both sr and se in patients, with fronto-temporal andfronto-parietal connections being the most affected (see Fig. 5D).The interaction effect, reflecting group differences in connectivity as-sociated specifically with the implementation of cognitive control(i.e., context-dependent), revealed a more circumscribed deficit af-fecting interactions between frontal and parietal cortices. Together,these findings suggest that circuit-specific, context-dependent alter-ations in functional coupling are superimposed on a background ofpervasive, context-independent connectivity deficits in schizophre-nia, consistent with the profile of domain-specific and generalizedcognitive deficits known to characterize the disorder (Heinrichs andZakzanis, 1998).
Though our analysis was focused on one specific cognitive task,other studies conducted in patients at different illness stages and dur-ing diverse cognitive states have also found evidence for a relativelyglobal impairment of functional connectivity (Fig. 3). Moreover, dy-namic causal modeling of networks comprising a small number ofpre-defined brain regions has found that differences in endogenous(i.e., task-independent) inter-regional connectivity parameters aremore replicable than context-dependent changes (Allen, et al.,2010; Mechelli et al., 2007; Benetti et al., 2009; Crossley et al.,2009). These convergent findings support the idea of a diffuse andgeneralized functional connectivity deficit in schizophrenia, thoughfurther replication across multiple experimental paradigms isrequired.
An alternative and common strategy for investigating putativecontext-independent functional dysconnectivity in schizophreniahas been to study spontaneous brain dynamics with resting-statefMRI. In this work, participants are scanned as they quietly lie in thescanner without performing any explicit task. The topography offunctional connectivity networks measured under such conditions re-capitulates well-known task-evoked co-activation patterns (Smith etal., 2009) and is correlated with underlying anatomical connectivity(Honey et al., 2009; Skudlarski et al., 2008; Zalesky and Fornito,2009) and synchronized oscillations in neuronal activity (He et al.,2008). Resting-state connectivity measures are heritable (Glahn et
Table 2Summary of main findings of ga-MRI studies of structural dysconnectivity in schizophrenia
Study Modality Sample Illness duration(years)
Network
Bassett et al. (2008) T1 203 SZ259 HC
n/a 104 C and SC
Skudlarski et al. (2010) DTI 27 SZ27 HC
n/a Hybrid
van den Heuvel et al. (2010) DTI/MTI 40 SZ40 HC
2.08 108 BW
Zalesky et al. (2010a, 2010b) DTI 74 SZ32 HC
~15 82 C and SC
↓ = decreased in schizophrenia; ↑ = increased in schizophrenia; ≈ =no significant differebrain-wide; C = cortical; DTI = diffusion tensor imaging; GVC = inter-regional covariance inetic transfer ratio of the reconstructed tracts; MTI =magnetic transfer imaging; NIS = numedge connectivity strength; sr = regional connectivity strength; SZ = schizophrenia.
a The authors also defined edges using tract-averaged fractional anisotropy.b Differences were significant at uncorrected levels but did not survive correction for mu
Please cite this article as: Fornito, A., et al., Schizophrenia, neurj.neuroimage.2011.12.090
al., 2010; Fornito et al., 2011b) and robust across individuals andover time (Damoiseaux et al., 2006; Shehzad et al., 2009), leading tothe conclusion that they characterize a relatively stable and intrinsicproperty of brain function (Fox and Raichle, 2007). A corollary ofthis view is that case–control differences in such measures reflect acontext-independent alteration of the brain's intrinsic functional or-ganization, an assumption implicit in the widespread use of resting-state designs in most ga-fMRI studies of schizophrenia (Table 1).However, evidence that resting state measures correlate with pre-scan anxiety ratings (Seeley et al., 2007), and that they are affectedby the performance of a prior task (Albert et al., 2009; Barnes et al.,2009; Lewis et al., 2009; Tambini et al., 2010) and induced changesin mood state (Harrison et al., 2008), suggest that such an interpreta-tion may be too simplistic. Rather, such measures likely capture a sta-ble, intrinsic component of functional brain dynamics as well as amore transient context-dependent component (Fransson, 2006; Foxand Raichle, 2007). Unfortunately, it can be difficult to discernwhich component contributes to any observed differences betweenpatients and controls (Fornito and Bullmore, 2010), meaning thatthe functional and/or clinical significance of such differences shouldbe validated using additional measures.
Does functional dysconnectivity in schizophrenia have a structural basis?
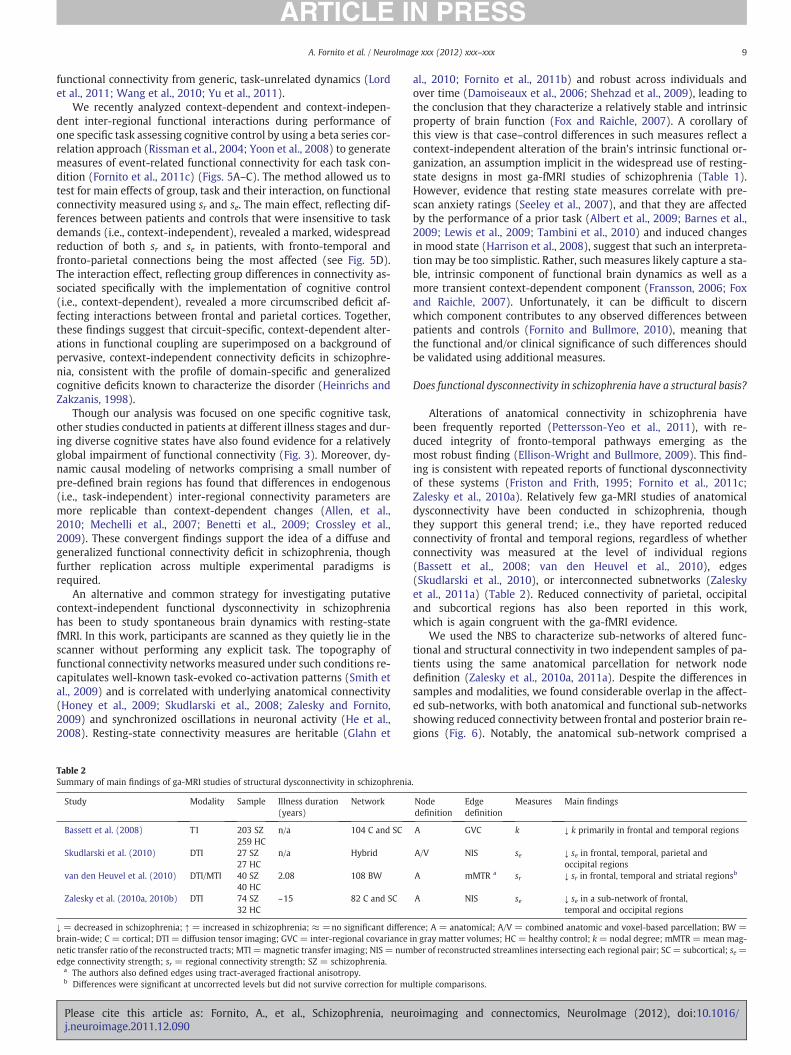
Alterations of anatomical connectivity in schizophrenia havebeen frequently reported (Pettersson-Yeo et al., 2011), with re-duced integrity of fronto-temporal pathways emerging as themost robust finding (Ellison-Wright and Bullmore, 2009). This find-ing is consistent with repeated reports of functional dysconnectivityof these systems (Friston and Frith, 1995; Fornito et al., 2011c;Zalesky et al., 2010a). Relatively few ga-MRI studies of anatomicaldysconnectivity have been conducted in schizophrenia, thoughthey support this general trend; i.e., they have reported reducedconnectivity of frontal and temporal regions, regardless of whetherconnectivity was measured at the level of individual regions(Bassett et al., 2008; van den Heuvel et al., 2010), edges(Skudlarski et al., 2010), or interconnected subnetworks (Zaleskyet al., 2011a) (Table 2). Reduced connectivity of parietal, occipitaland subcortical regions has also been reported in this work,which is again congruent with the ga-fMRI evidence.
We used the NBS to characterize sub-networks of altered func-tional and structural connectivity in two independent samples of pa-tients using the same anatomical parcellation for network nodedefinition (Zalesky et al., 2010a, 2011a). Despite the differences insamples and modalities, we found considerable overlap in the affect-ed sub-networks, with both anatomical and functional sub-networksshowing reduced connectivity between frontal and posterior brain re-gions (Fig. 6). Notably, the anatomical sub-network comprised a
.
Nodedefinition
Edgedefinition
Measures Main findings
A GVC k ↓ k primarily in frontal and temporal regions
A/V NIS se ↓ se in frontal, temporal, parietal andoccipital regions
A mMTR a sr ↓ sr in frontal, temporal and striatal regionsb
A NIS se ↓ se in a sub-network of frontal,temporal and occipital regions
nce; A = anatomical; A/V = combined anatomic and voxel-based parcellation; BW =n gray matter volumes; HC = healthy control; k= nodal degree; mMTR =mean mag-ber of reconstructed streamlines intersecting each regional pair; SC = subcortical; se =
ltiple comparisons.
oimaging and connectomics, NeuroImage (2012), doi:10.1016/
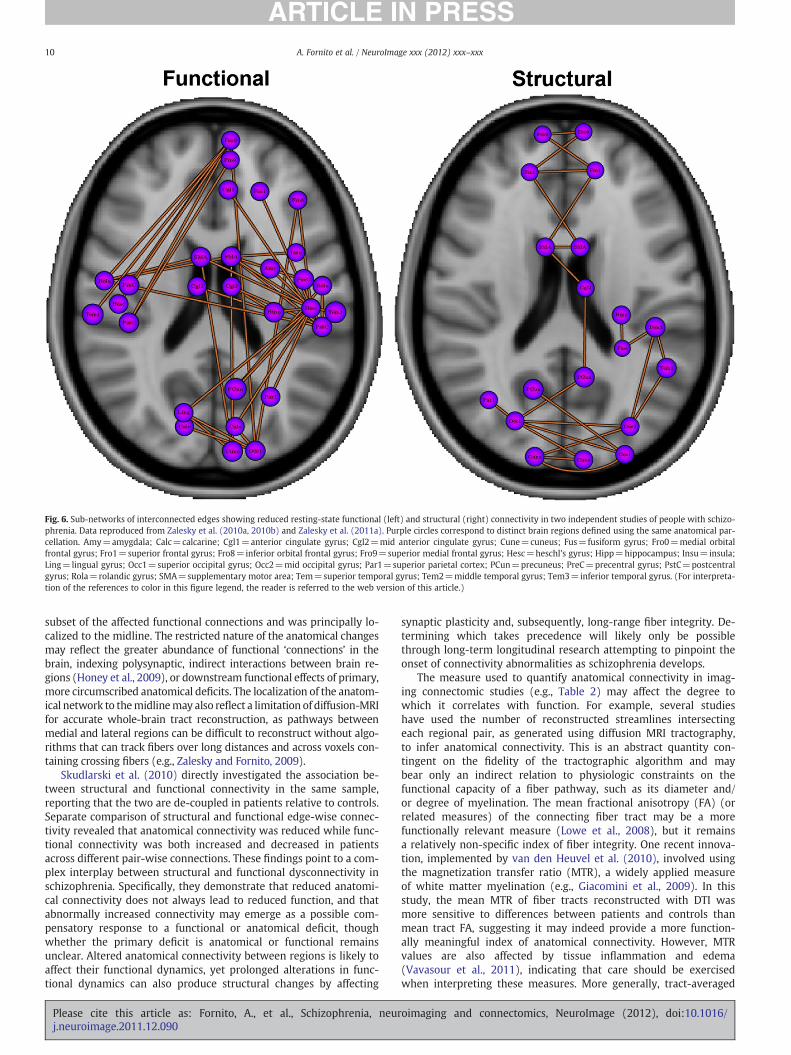
Fig. 6. Sub-networks of interconnected edges showing reduced resting-state functional (left) and structural (right) connectivity in two independent studies of people with schizo-phrenia. Data reproduced from Zalesky et al. (2010a, 2010b) and Zalesky et al. (2011a). Purple circles correspond to distinct brain regions defined using the same anatomical par-cellation. Amy=amygdala; Calc=calcarine; Cgl1=anterior cingulate gyrus; Cgl2=mid anterior cingulate gyrus; Cune=cuneus; Fus=fusiform gyrus; Fro0=medial orbitalfrontal gyrus; Fro1=superior frontal gyrus; Fro8=inferior orbital frontal gyrus; Fro9=superior medial frontal gyrus; Hesc=heschl's gyrus; Hipp=hippocampus; Insu=insula;Ling=lingual gyrus; Occ1=superior occipital gyrus; Occ2=mid occipital gyrus; Par1=superior parietal cortex; PCun=precuneus; PreC=precentral gyrus; PstC=postcentralgyrus; Rola=rolandic gyrus; SMA=supplementary motor area; Tem=superior temporal gyrus; Tem2=middle temporal gyrus; Tem3=inferior temporal gyrus. (For interpreta-tion of the references to color in this figure legend, the reader is referred to the web version of this article.)
10 A. Fornito et al. / NeuroImage xxx (2012) xxx–xxx
subset of the affected functional connections and was principally lo-calized to the midline. The restricted nature of the anatomical changesmay reflect the greater abundance of functional ‘connections’ in thebrain, indexing polysynaptic, indirect interactions between brain re-gions (Honey et al., 2009), or downstream functional effects of primary,more circumscribed anatomical deficits. The localization of the anatom-ical network to themidlinemay also reflect a limitation of diffusion-MRIfor accurate whole-brain tract reconstruction, as pathways betweenmedial and lateral regions can be difficult to reconstruct without algo-rithms that can track fibers over long distances and across voxels con-taining crossing fibers (e.g., Zalesky and Fornito, 2009).
Skudlarski et al. (2010) directly investigated the association be-tween structural and functional connectivity in the same sample,reporting that the two are de-coupled in patients relative to controls.Separate comparison of structural and functional edge-wise connec-tivity revealed that anatomical connectivity was reduced while func-tional connectivity was both increased and decreased in patientsacross different pair-wise connections. These findings point to a com-plex interplay between structural and functional dysconnectivity inschizophrenia. Specifically, they demonstrate that reduced anatomi-cal connectivity does not always lead to reduced function, and thatabnormally increased connectivity may emerge as a possible com-pensatory response to a functional or anatomical deficit, thoughwhether the primary deficit is anatomical or functional remainsunclear. Altered anatomical connectivity between regions is likely toaffect their functional dynamics, yet prolonged alterations in func-tional dynamics can also produce structural changes by affecting
Please cite this article as: Fornito, A., et al., Schizophrenia, neurj.neuroimage.2011.12.090
synaptic plasticity and, subsequently, long-range fiber integrity. De-termining which takes precedence will likely only be possiblethrough long-term longitudinal research attempting to pinpoint theonset of connectivity abnormalities as schizophrenia develops.
The measure used to quantify anatomical connectivity in imag-ing connectomic studies (e.g., Table 2) may affect the degree towhich it correlates with function. For example, several studieshave used the number of reconstructed streamlines intersectingeach regional pair, as generated using diffusion MRI tractography,to infer anatomical connectivity. This is an abstract quantity con-tingent on the fidelity of the tractographic algorithm and maybear only an indirect relation to physiologic constraints on thefunctional capacity of a fiber pathway, such as its diameter and/or degree of myelination. The mean fractional anisotropy (FA) (orrelated measures) of the connecting fiber tract may be a morefunctionally relevant measure (Lowe et al., 2008), but it remainsa relatively non-specific index of fiber integrity. One recent innova-tion, implemented by van den Heuvel et al. (2010), involved usingthe magnetization transfer ratio (MTR), a widely applied measureof white matter myelination (e.g., Giacomini et al., 2009). In thisstudy, the mean MTR of fiber tracts reconstructed with DTI wasmore sensitive to differences between patients and controls thanmean tract FA, suggesting it may indeed provide a more function-ally meaningful index of anatomical connectivity. However, MTRvalues are also affected by tissue inflammation and edema(Vavasour et al., 2011), indicating that care should be exercisedwhen interpreting these measures. More generally, tract-averaged
oimaging and connectomics, NeuroImage (2012), doi:10.1016/
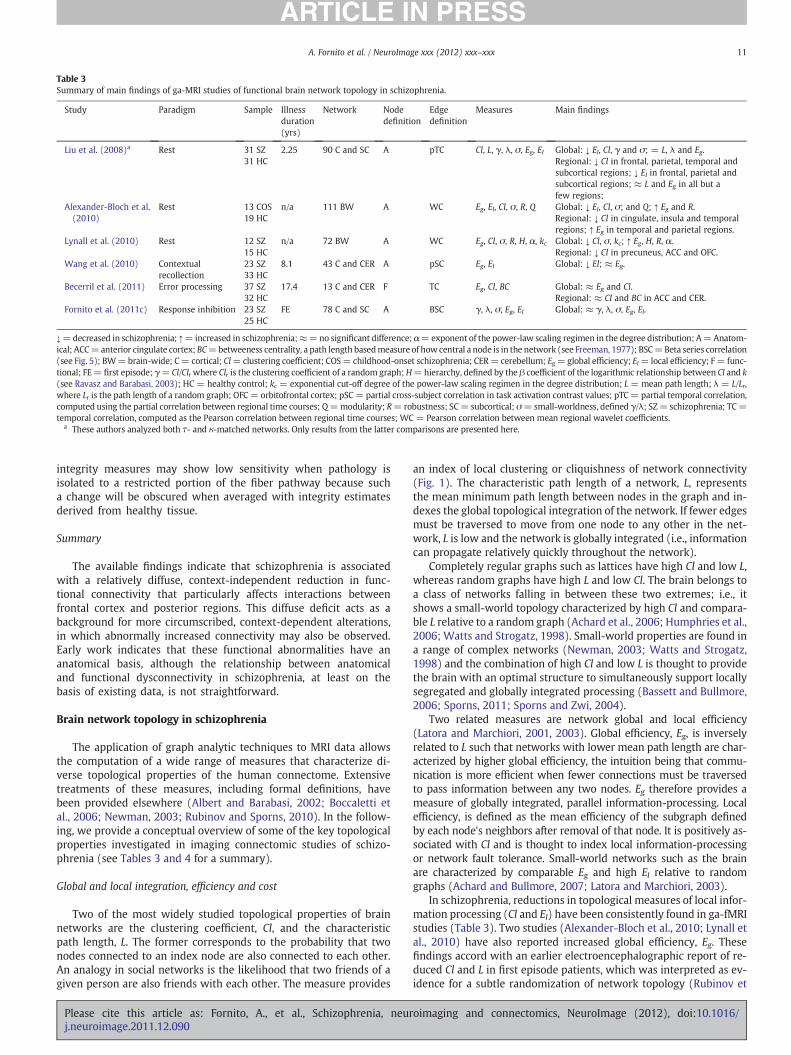
Table 3Summary of main findings of ga-MRI studies of functional brain network topology in schizophrenia.
Study Paradigm Sample Illnessduration(yrs)
Network Nodedefinition
Edgedefinition
Measures Main findings
Liu et al. (2008)a Rest 31 SZ31 HC
2.25 90 C and SC A pTC Cl, L, γ, λ, σ, Eg, El Global: ↓ El, Cl, γ and σ; = L, λ and Eg.Regional: ↓ Cl in frontal, parietal, temporal andsubcortical regions; ↓ El in frontal, parietal andsubcortical regions; ≈ L and Eg in all but afew regions;
Alexander-Bloch et al.(2010)
Rest 13 COS19 HC
n/a 111 BW A WC Eg, El, Cl, σ, R, Q Global: ↓ El, Cl, σ; and Q; ↑ Eg and R.Regional: ↓ Cl in cingulate, insula and temporalregions; ↑ Eg in temporal and parietal regions.
Lynall et al. (2010) Rest 12 SZ15 HC
n/a 72 BW A WC Eg, Cl, σ, R, H, α, kc Global: ↓ Cl, σ, kc; ↑ Eg, H, R, α.Regional: ↓ Cl in precuneus, ACC and OFC.
Wang et al. (2010) Contextualrecollection
23 SZ33 HC
8.1 43 C and CER A pSC Eg, El Global: ↓ El; ≈ Eg.
Becerril et al. (2011) Error processing 37 SZ32 HC
17.4 13 C and CER F TC Eg, Cl, BC Global: ≈ Eg and Cl.Regional: ≈ Cl and BC in ACC and CER.
Fornito et al. (2011c) Response inhibition 23 SZ25 HC
FE 78 C and SC A BSC γ, λ, σ, Eg, El Global: ≈ γ, λ, σ, Eg, El.
↓=decreased in schizophrenia; ↑= increased in schizophrenia;≈=no significant difference; α=exponent of the power-law scaling regimen in the degree distribution; A=Anatom-ical; ACC=anterior cingulate cortex; BC=betweeness centrality, a path length basedmeasure of how central a node is in the network (see Freeman, 1977); BSC=Beta series correlation(see Fig. 5); BW=brain-wide; C= cortical; Cl=clustering coefficient; COS= childhood-onset schizophrenia; CER= cerebellum; Eg=global efficiency; El= local efficiency; F= func-tional; FE= first episode; γ= Cl/Clrwhere Clr is the clustering coefficient of a random graph;H=hierarchy, defined by the β coefficient of the logarithmic relationship between Cl and k(see Ravasz and Barabasi, 2003); HC = healthy control; kc = exponential cut-off degree of the power-law scaling regimen in the degree distribution; L = mean path length; λ = L/Lr,where Lr is the path length of a random graph; OFC= orbitofrontal cortex; pSC = partial cross-subject correlation in task activation contrast values; pTC= partial temporal correlation,computed using the partial correlation between regional time courses; Q=modularity; R= robustness; SC= subcortical; σ=small-worldness, defined γ/λ; SZ= schizophrenia; TC=temporal correlation, computed as the Pearson correlation between regional time courses; WC = Pearson correlation between mean regional wavelet coefficients.
a These authors analyzed both τ- and κ-matched networks. Only results from the latter comparisons are presented here.
11A. Fornito et al. / NeuroImage xxx (2012) xxx–xxx
integrity measures may show low sensitivity when pathology isisolated to a restricted portion of the fiber pathway because sucha change will be obscured when averaged with integrity estimatesderived from healthy tissue.
Summary
The available findings indicate that schizophrenia is associatedwith a relatively diffuse, context-independent reduction in func-tional connectivity that particularly affects interactions betweenfrontal cortex and posterior regions. This diffuse deficit acts as abackground for more circumscribed, context-dependent alterations,in which abnormally increased connectivity may also be observed.Early work indicates that these functional abnormalities have ananatomical basis, although the relationship between anatomicaland functional dysconnectivity in schizophrenia, at least on thebasis of existing data, is not straightforward.
Brain network topology in schizophrenia
The application of graph analytic techniques to MRI data allowsthe computation of a wide range of measures that characterize di-verse topological properties of the human connectome. Extensivetreatments of these measures, including formal definitions, havebeen provided elsewhere (Albert and Barabasi, 2002; Boccaletti etal., 2006; Newman, 2003; Rubinov and Sporns, 2010). In the follow-ing, we provide a conceptual overview of some of the key topologicalproperties investigated in imaging connectomic studies of schizo-phrenia (see Tables 3 and 4 for a summary).
Global and local integration, efficiency and cost
Two of the most widely studied topological properties of brainnetworks are the clustering coefficient, Cl, and the characteristicpath length, L. The former corresponds to the probability that twonodes connected to an index node are also connected to each other.An analogy in social networks is the likelihood that two friends of agiven person are also friends with each other. The measure provides
Please cite this article as: Fornito, A., et al., Schizophrenia, neurj.neuroimage.2011.12.090
an index of local clustering or cliquishness of network connectivity(Fig. 1). The characteristic path length of a network, L, representsthe mean minimum path length between nodes in the graph and in-dexes the global topological integration of the network. If fewer edgesmust be traversed to move from one node to any other in the net-work, L is low and the network is globally integrated (i.e., informationcan propagate relatively quickly throughout the network).
Completely regular graphs such as lattices have high Cl and low L,whereas random graphs have high L and low Cl. The brain belongs toa class of networks falling in between these two extremes; i.e., itshows a small-world topology characterized by high Cl and compara-ble L relative to a random graph (Achard et al., 2006; Humphries et al.,2006; Watts and Strogatz, 1998). Small-world properties are found ina range of complex networks (Newman, 2003; Watts and Strogatz,1998) and the combination of high Cl and low L is thought to providethe brain with an optimal structure to simultaneously support locallysegregated and globally integrated processing (Bassett and Bullmore,2006; Sporns, 2011; Sporns and Zwi, 2004).
Two related measures are network global and local efficiency(Latora and Marchiori, 2001, 2003). Global efficiency, Eg, is inverselyrelated to L such that networks with lower mean path length are char-acterized by higher global efficiency, the intuition being that commu-nication is more efficient when fewer connections must be traversedto pass information between any two nodes. Eg therefore provides ameasure of globally integrated, parallel information-processing. Localefficiency, is defined as the mean efficiency of the subgraph definedby each node's neighbors after removal of that node. It is positively as-sociated with Cl and is thought to index local information-processingor network fault tolerance. Small-world networks such as the brainare characterized by comparable Eg and high El relative to randomgraphs (Achard and Bullmore, 2007; Latora and Marchiori, 2003).
In schizophrenia, reductions in topological measures of local infor-mation processing (Cl and El) have been consistently found in ga-fMRIstudies (Table 3). Two studies (Alexander-Bloch et al., 2010; Lynall etal., 2010) have also reported increased global efficiency, Eg. Thesefindings accord with an earlier electroencephalographic report of re-duced Cl and L in first episode patients, which was interpreted as ev-idence for a subtle randomization of network topology (Rubinov et
oimaging and connectomics, NeuroImage (2012), doi:10.1016/
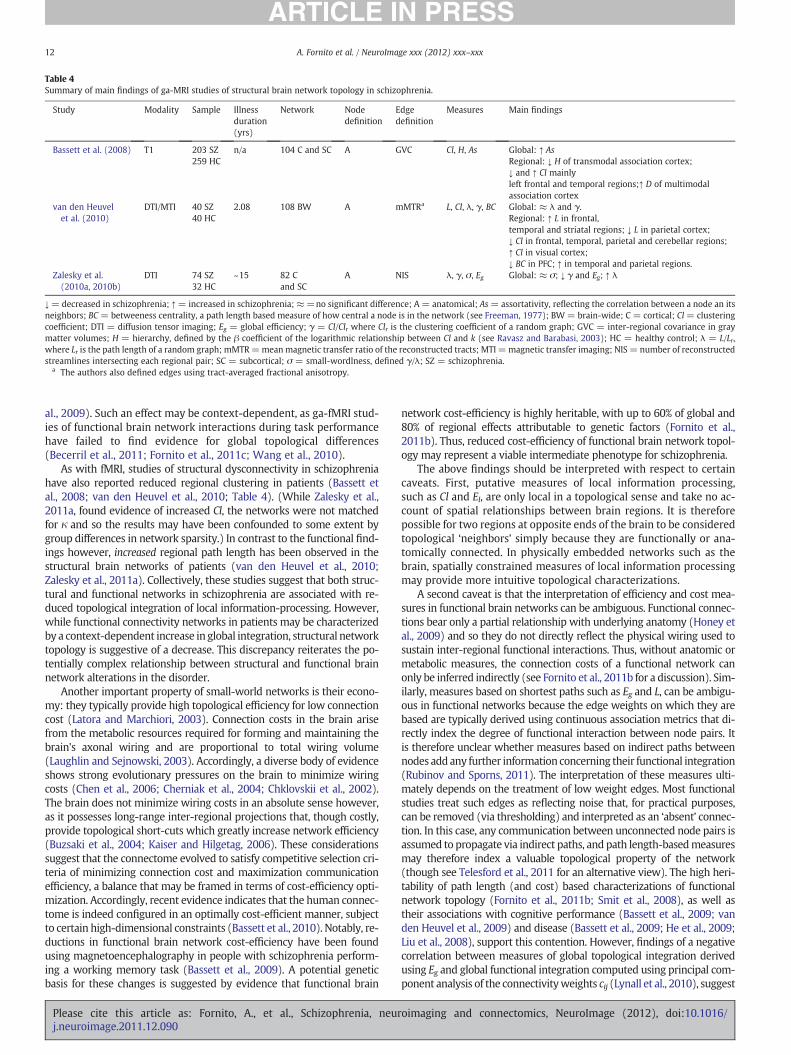
Table 4Summary of main findings of ga-MRI studies of structural brain network topology in schizophrenia.
Study Modality Sample Illnessduration(yrs)
Network Nodedefinition
Edgedefinition
Measures Main findings
Bassett et al. (2008) T1 203 SZ259 HC
n/a 104 C and SC A GVC Cl, H, As Global: ↑ AsRegional: ↓ H of transmodal association cortex;↓ and ↑ Cl mainlyleft frontal and temporal regions;↑ D of multimodalassociation cortex
van den Heuvelet al. (2010)
DTI/MTI 40 SZ40 HC
2.08 108 BW A mMTRa L, Cl, λ, γ, BC Global: ≈ λ and γ.Regional: ↑ L in frontal,temporal and striatal regions; ↓ L in parietal cortex;↓ Cl in frontal, temporal, parietal and cerebellar regions;↑ Cl in visual cortex;↓ BC in PFC; ↑ in temporal and parietal regions.
Zalesky et al.(2010a, 2010b)
DTI 74 SZ32 HC
~15 82 Cand SC
A NIS λ, γ, σ, Eg Global: ≈ σ; ↓ γ and Eg; ↑ λ
↓= decreased in schizophrenia; ↑= increased in schizophrenia; ≈=no significant difference; A = anatomical; As = assortativity, reflecting the correlation between a node an itsneighbors; BC = betweeness centrality, a path length based measure of how central a node is in the network (see Freeman, 1977); BW = brain-wide; C = cortical; Cl = clusteringcoefficient; DTI = diffusion tensor imaging; Eg = global efficiency; γ = Cl/Clr where Clr is the clustering coefficient of a random graph; GVC = inter-regional covariance in graymatter volumes; H = hierarchy, defined by the β coefficient of the logarithmic relationship between Cl and k (see Ravasz and Barabasi, 2003); HC = healthy control; λ = L/Lr,where Lr is the path length of a random graph; mMTR=meanmagnetic transfer ratio of the reconstructed tracts; MTI =magnetic transfer imaging; NIS = number of reconstructedstreamlines intersecting each regional pair; SC = subcortical; σ = small-wordlness, defined γ/λ; SZ = schizophrenia.
a The authors also defined edges using tract-averaged fractional anisotropy.
12 A. Fornito et al. / NeuroImage xxx (2012) xxx–xxx
al., 2009). Such an effect may be context-dependent, as ga-fMRI stud-ies of functional brain network interactions during task performancehave failed to find evidence for global topological differences(Becerril et al., 2011; Fornito et al., 2011c; Wang et al., 2010).
As with fMRI, studies of structural dysconnectivity in schizophreniahave also reported reduced regional clustering in patients (Bassett etal., 2008; van den Heuvel et al., 2010; Table 4). (While Zalesky et al.,2011a, found evidence of increased Cl, the networks were not matchedfor κ and so the results may have been confounded to some extent bygroup differences in network sparsity.) In contrast to the functional find-ings however, increased regional path length has been observed in thestructural brain networks of patients (van den Heuvel et al., 2010;Zalesky et al., 2011a). Collectively, these studies suggest that both struc-tural and functional networks in schizophrenia are associated with re-duced topological integration of local information-processing. However,while functional connectivity networks in patients may be characterizedby a context-dependent increase in global integration, structural networktopology is suggestive of a decrease. This discrepancy reiterates the po-tentially complex relationship between structural and functional brainnetwork alterations in the disorder.
Another important property of small-world networks is their econo-my: they typically provide high topological efficiency for low connectioncost (Latora and Marchiori, 2003). Connection costs in the brain arisefrom the metabolic resources required for forming and maintaining thebrain's axonal wiring and are proportional to total wiring volume(Laughlin and Sejnowski, 2003). Accordingly, a diverse body of evidenceshows strong evolutionary pressures on the brain to minimize wiringcosts (Chen et al., 2006; Cherniak et al., 2004; Chklovskii et al., 2002).The brain does not minimize wiring costs in an absolute sense however,as it possesses long-range inter-regional projections that, though costly,provide topological short-cuts which greatly increase network efficiency(Buzsaki et al., 2004; Kaiser and Hilgetag, 2006). These considerationssuggest that the connectome evolved to satisfy competitive selection cri-teria of minimizing connection cost and maximization communicationefficiency, a balance that may be framed in terms of cost-efficiency opti-mization. Accordingly, recent evidence indicates that the human connec-tome is indeed configured in an optimally cost-efficient manner, subjectto certain high-dimensional constraints (Bassett et al., 2010). Notably, re-ductions in functional brain network cost-efficiency have been foundusing magnetoencephalography in people with schizophrenia perform-ing a working memory task (Bassett et al., 2009). A potential geneticbasis for these changes is suggested by evidence that functional brain
Please cite this article as: Fornito, A., et al., Schizophrenia, neurj.neuroimage.2011.12.090
network cost-efficiency is highly heritable, with up to 60% of global and80% of regional effects attributable to genetic factors (Fornito et al.,2011b). Thus, reduced cost-efficiency of functional brain network topol-ogy may represent a viable intermediate phenotype for schizophrenia.
The above findings should be interpreted with respect to certaincaveats. First, putative measures of local information processing,such as Cl and El, are only local in a topological sense and take no ac-count of spatial relationships between brain regions. It is thereforepossible for two regions at opposite ends of the brain to be consideredtopological ‘neighbors’ simply because they are functionally or ana-tomically connected. In physically embedded networks such as thebrain, spatially constrained measures of local information processingmay provide more intuitive topological characterizations.
A second caveat is that the interpretation of efficiency and cost mea-sures in functional brain networks can be ambiguous. Functional connec-tions bear only a partial relationship with underlying anatomy (Honey etal., 2009) and so they do not directly reflect the physical wiring used tosustain inter-regional functional interactions. Thus, without anatomic ormetabolic measures, the connection costs of a functional network canonly be inferred indirectly (see Fornito et al., 2011b for a discussion). Sim-ilarly, measures based on shortest paths such as Eg and L, can be ambigu-ous in functional networks because the edge weights on which they arebased are typically derived using continuous association metrics that di-rectly index the degree of functional interaction between node pairs. Itis therefore unclear whether measures based on indirect paths betweennodes addany further information concerning their functional integration(Rubinov and Sporns, 2011). The interpretation of these measures ulti-mately depends on the treatment of low weight edges. Most functionalstudies treat such edges as reflecting noise that, for practical purposes,can be removed (via thresholding) and interpreted as an ‘absent’ connec-tion. In this case, any communication between unconnected node pairs isassumed to propagate via indirect paths, and path length-basedmeasuresmay therefore index a valuable topological property of the network(though see Telesford et al., 2011 for an alternative view). The high heri-tability of path length (and cost) based characterizations of functionalnetwork topology (Fornito et al., 2011b; Smit et al., 2008), as well astheir associations with cognitive performance (Bassett et al., 2009; vanden Heuvel et al., 2009) and disease (Bassett et al., 2009; He et al., 2009;Liu et al., 2008), support this contention. However, findings of a negativecorrelation between measures of global topological integration derivedusing Eg and global functional integration computed using principal com-ponent analysis of the connectivityweights cij (Lynall et al., 2010), suggest
oimaging and connectomics, NeuroImage (2012), doi:10.1016/
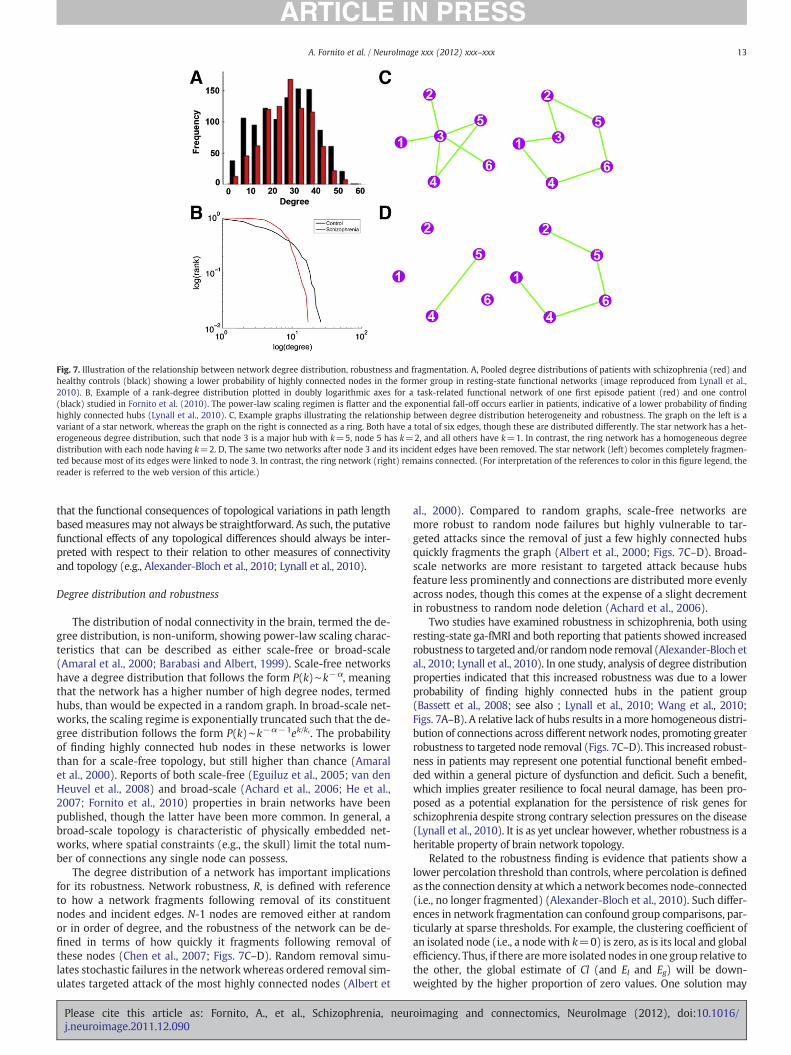
Fig. 7. Illustration of the relationship between network degree distribution, robustness and fragmentation. A, Pooled degree distributions of patients with schizophrenia (red) andhealthy controls (black) showing a lower probability of highly connected nodes in the former group in resting-state functional networks (image reproduced from Lynall et al.,2010). B, Example of a rank-degree distribution plotted in doubly logarithmic axes for a task-related functional network of one first episode patient (red) and one control(black) studied in Fornito et al. (2010). The power-law scaling regimen is flatter and the exponential fall-off occurs earlier in patients, indicative of a lower probability of findinghighly connected hubs (Lynall et al., 2010). C, Example graphs illustrating the relationship between degree distribution heterogeneity and robustness. The graph on the left is avariant of a star network, whereas the graph on the right is connected as a ring. Both have a total of six edges, though these are distributed differently. The star network has a het-erogeneous degree distribution, such that node 3 is a major hub with k=5, node 5 has k=2, and all others have k=1. In contrast, the ring network has a homogeneous degreedistribution with each node having k=2. D, The same two networks after node 3 and its incident edges have been removed. The star network (left) becomes completely fragmen-ted because most of its edges were linked to node 3. In contrast, the ring network (right) remains connected. (For interpretation of the references to color in this figure legend, thereader is referred to the web version of this article.)
13A. Fornito et al. / NeuroImage xxx (2012) xxx–xxx
that the functional consequences of topological variations in path lengthbasedmeasuresmay not always be straightforward. As such, the putativefunctional effects of any topological differences should always be inter-preted with respect to their relation to other measures of connectivityand topology (e.g., Alexander-Bloch et al., 2010; Lynall et al., 2010).
Degree distribution and robustness
The distribution of nodal connectivity in the brain, termed the de-gree distribution, is non-uniform, showing power-law scaling charac-teristics that can be described as either scale-free or broad-scale(Amaral et al., 2000; Barabasi and Albert, 1999). Scale-free networkshave a degree distribution that follows the form P(k)∼k−α, meaningthat the network has a higher number of high degree nodes, termedhubs, than would be expected in a random graph. In broad-scale net-works, the scaling regime is exponentially truncated such that the de-gree distribution follows the form P(k)∼k−α−1ek/kc. The probabilityof finding highly connected hub nodes in these networks is lowerthan for a scale-free topology, but still higher than chance (Amaralet al., 2000). Reports of both scale-free (Eguiluz et al., 2005; van denHeuvel et al., 2008) and broad-scale (Achard et al., 2006; He et al.,2007; Fornito et al., 2010) properties in brain networks have beenpublished, though the latter have been more common. In general, abroad-scale topology is characteristic of physically embedded net-works, where spatial constraints (e.g., the skull) limit the total num-ber of connections any single node can possess.
The degree distribution of a network has important implicationsfor its robustness. Network robustness, R, is defined with referenceto how a network fragments following removal of its constituentnodes and incident edges. N-1 nodes are removed either at randomor in order of degree, and the robustness of the network can be de-fined in terms of how quickly it fragments following removal ofthese nodes (Chen et al., 2007; Figs. 7C–D). Random removal simu-lates stochastic failures in the network whereas ordered removal sim-ulates targeted attack of the most highly connected nodes (Albert et
Please cite this article as: Fornito, A., et al., Schizophrenia, neurj.neuroimage.2011.12.090
al., 2000). Compared to random graphs, scale-free networks aremore robust to random node failures but highly vulnerable to tar-geted attacks since the removal of just a few highly connected hubsquickly fragments the graph (Albert et al., 2000; Figs. 7C–D). Broad-scale networks are more resistant to targeted attack because hubsfeature less prominently and connections are distributed more evenlyacross nodes, though this comes at the expense of a slight decrementin robustness to random node deletion (Achard et al., 2006).
Two studies have examined robustness in schizophrenia, both usingresting-state ga-fMRI and both reporting that patients showed increasedrobustness to targeted and/or randomnode removal (Alexander-Bloch etal., 2010; Lynall et al., 2010). In one study, analysis of degree distributionproperties indicated that this increased robustness was due to a lowerprobability of finding highly connected hubs in the patient group(Bassett et al., 2008; see also ; Lynall et al., 2010; Wang et al., 2010;Figs. 7A–B). A relative lack of hubs results in amore homogeneous distri-bution of connections across different network nodes, promoting greaterrobustness to targeted node removal (Figs. 7C–D). This increased robust-ness in patients may represent one potential functional benefit embed-ded within a general picture of dysfunction and deficit. Such a benefit,which implies greater resilience to focal neural damage, has been pro-posed as a potential explanation for the persistence of risk genes forschizophrenia despite strong contrary selection pressures on the disease(Lynall et al., 2010). It is as yet unclear however, whether robustness is aheritable property of brain network topology.
Related to the robustness finding is evidence that patients show alower percolation threshold than controls, where percolation is definedas the connection density atwhich a network becomes node-connected(i.e., no longer fragmented) (Alexander-Bloch et al., 2010). Such differ-ences in network fragmentation can confound group comparisons, par-ticularly at sparse thresholds. For example, the clustering coefficient ofan isolated node (i.e., a nodewith k=0) is zero, as is its local and globalefficiency. Thus, if there aremore isolated nodes in one group relative tothe other, the global estimate of Cl (and El and Eg) will be down-weighted by the higher proportion of zero values. One solution may
oimaging and connectomics, NeuroImage (2012), doi:10.1016/
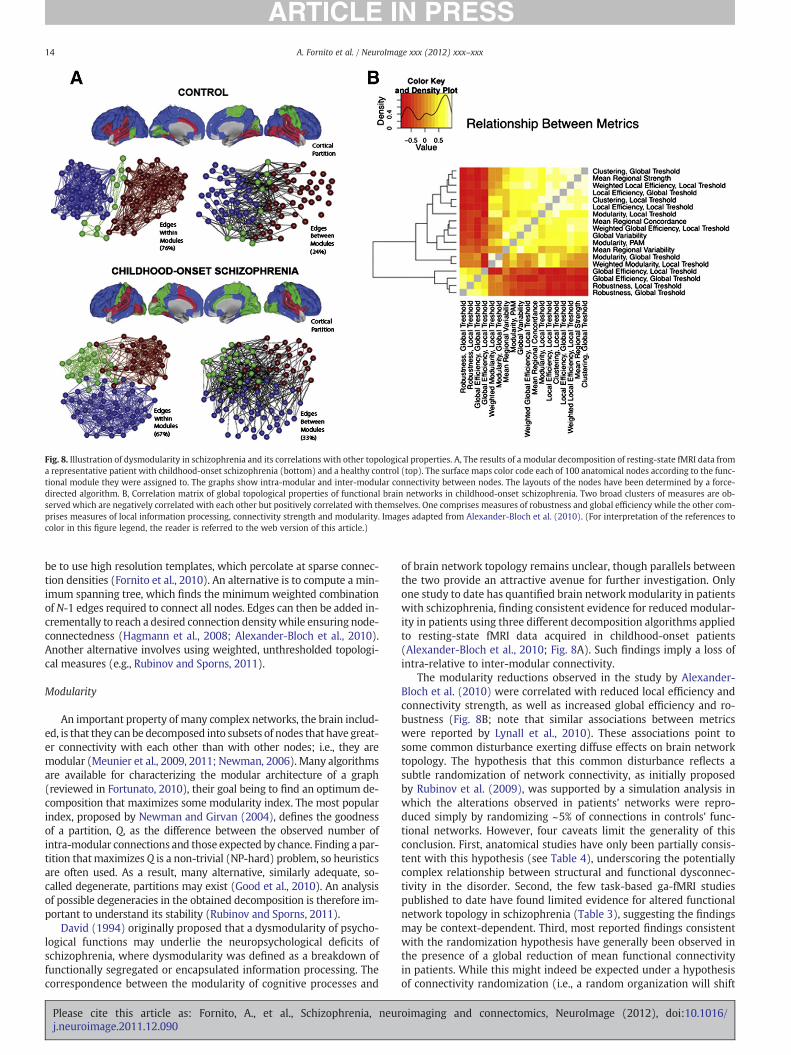
Fig. 8. Illustration of dysmodularity in schizophrenia and its correlations with other topological properties. A, The results of a modular decomposition of resting-state fMRI data froma representative patient with childhood-onset schizophrenia (bottom) and a healthy control (top). The surface maps color code each of 100 anatomical nodes according to the func-tional module they were assigned to. The graphs show intra-modular and inter-modular connectivity between nodes. The layouts of the nodes have been determined by a force-directed algorithm. B, Correlation matrix of global topological properties of functional brain networks in childhood-onset schizophrenia. Two broad clusters of measures are ob-served which are negatively correlated with each other but positively correlated with themselves. One comprises measures of robustness and global efficiency while the other com-prises measures of local information processing, connectivity strength and modularity. Images adapted from Alexander-Bloch et al. (2010). (For interpretation of the references tocolor in this figure legend, the reader is referred to the web version of this article.)
14 A. Fornito et al. / NeuroImage xxx (2012) xxx–xxx
be to use high resolution templates, which percolate at sparse connec-tion densities (Fornito et al., 2010). An alternative is to compute a min-imum spanning tree, which finds the minimum weighted combinationof N-1 edges required to connect all nodes. Edges can then be added in-crementally to reach a desired connection densitywhile ensuring node-connectedness (Hagmann et al., 2008; Alexander-Bloch et al., 2010).Another alternative involves using weighted, unthresholded topologi-cal measures (e.g., Rubinov and Sporns, 2011).
Modularity
An important property of many complex networks, the brain includ-ed, is that they can be decomposed into subsets of nodes that have great-er connectivity with each other than with other nodes; i.e., they aremodular (Meunier et al., 2009, 2011; Newman, 2006). Many algorithmsare available for characterizing the modular architecture of a graph(reviewed in Fortunato, 2010), their goal being to find an optimum de-composition that maximizes some modularity index. The most popularindex, proposed by Newman and Girvan (2004), defines the goodnessof a partition, Q, as the difference between the observed number ofintra-modular connections and those expected by chance. Finding a par-tition thatmaximizes Q is a non-trivial (NP-hard) problem, so heuristicsare often used. As a result, many alternative, similarly adequate, so-called degenerate, partitions may exist (Good et al., 2010). An analysisof possible degeneracies in the obtained decomposition is therefore im-portant to understand its stability (Rubinov and Sporns, 2011).
David (1994) originally proposed that a dysmodularity of psycho-logical functions may underlie the neuropsychological deficits ofschizophrenia, where dysmodularity was defined as a breakdown offunctionally segregated or encapsulated information processing. Thecorrespondence between the modularity of cognitive processes and
Please cite this article as: Fornito, A., et al., Schizophrenia, neurj.neuroimage.2011.12.090
of brain network topology remains unclear, though parallels betweenthe two provide an attractive avenue for further investigation. Onlyone study to date has quantified brain network modularity in patientswith schizophrenia, finding consistent evidence for reduced modular-ity in patients using three different decomposition algorithms appliedto resting-state fMRI data acquired in childhood-onset patients(Alexander-Bloch et al., 2010; Fig. 8A). Such findings imply a loss ofintra-relative to inter-modular connectivity.
The modularity reductions observed in the study by Alexander-Bloch et al. (2010) were correlated with reduced local efficiency andconnectivity strength, as well as increased global efficiency and ro-bustness (Fig. 8B; note that similar associations between metricswere reported by Lynall et al., 2010). These associations point tosome common disturbance exerting diffuse effects on brain networktopology. The hypothesis that this common disturbance reflects asubtle randomization of network connectivity, as initially proposedby Rubinov et al. (2009), was supported by a simulation analysis inwhich the alterations observed in patients' networks were repro-duced simply by randomizing ~5% of connections in controls' func-tional networks. However, four caveats limit the generality of thisconclusion. First, anatomical studies have only been partially consis-tent with this hypothesis (see Table 4), underscoring the potentiallycomplex relationship between structural and functional dysconnec-tivity in the disorder. Second, the few task-based ga-fMRI studiespublished to date have found limited evidence for altered functionalnetwork topology in schizophrenia (Table 3), suggesting the findingsmay be context-dependent. Third, most reported findings consistentwith the randomization hypothesis have generally been observed inthe presence of a global reduction of mean functional connectivityin patients. While this might indeed be expected under a hypothesisof connectivity randomization (i.e., a random organization will shift
oimaging and connectomics, NeuroImage (2012), doi:10.1016/
15A. Fornito et al. / NeuroImage xxx (2012) xxx–xxx
the distribution of patients' connectivity weights to be centered onzero), one consequence is that any analysis of graphs matched forconnection density, κ, will result in the inclusion of proportionallymore low-value (non-significant) edges in patients' networks(Fig. 2). If these values merely reflect noise, their inclusion will pro-duce a more random topology. Evidence that profound reductions infunctional connectivity can be observed in the absence of marked to-pological differences (Fornito et al., 2011a) suggests that topologicalalterations are not a necessary consequence of connectivity differ-ences, although the two are often related (Alexander-Bloch et al.,2010; Lynall et al., 2010). Thus, care should be taken to distinguishbona fide topological disturbances from case–control differences inmean connectivity levels (e.g., van den Heuvel et al., 2010).
A final caveat is that a tendency towards a more random network ar-chitecture has been observed in several conditions other than schizophre-nia, leading to the view that it may merely reflect a generic response toneural insult (Stam and Reijneveld, 2007). In schizophrenia, the insultcould correspond to an early neurodevelopmental lesion or an aberrationof later brain maturation, consistent with multi-hit developmental etio-logical models (Pantelis et al., 2005). Further work is therefore requiredto understand how topological variations in different disorders relate tosimilarities and differences in their phenotypic expression.
Summary
Numerous topological disturbances of structural and functionalbrain networks have been found in schizophrenia. Functional networksin particular may be characterized by a subtle randomization of net-work connectivity associated with reduced local connectivity andmod-ularity and increased topological integration and robustness. Thesechanges have not been observed during task-based studies (e.g.,Fornito et al., 2011c), suggesting they may be context-dependent. Thedependence of these topological changes on basic alterations of connec-tivity levels, and methodological procedures used for graph construc-tion, needs to be clarified. Direct investigation of structural andfunctional topological disturbances in the same patients is an importantavenue for future investigation. Finally, one important caveat affectinginterpretation of all studies of functional network topology discussedhere concerns the treatment of negative weights. Most commonlyused graph theoretic measures of network topology are defined in rela-tion to unsigned edge weights, and methods for accommodating nega-tively weighted edges between nodes are scarce. Consequently,investigators have either generated networks based on absolute corre-lation values or have excluded negative edgeweights from further anal-ysis. These practices may distort the actual topological properties of thenetwork. The continued development of measures that can accommo-date both positive and negative edge weights (Rubinov and Sporns,2011) will be an important goal for future research.
Conclusions
The studies reviewedhere add to the already extensive literature doc-umenting connectivity abnormalities in schizophrenia (Ellison-Wrightand Bullmore, 2009; Konrad and Winterer, 2008; Pettersson-Yeo et al.,2011). The power of the imaging connectomic methods we have consid-ered lies in their ability to provide relatively succinct, multidimensionalcharacterizations of regional and whole-brain disturbances in brain net-work connectivity and topology. The findings suggest that schizophreniais associated with a relatively diffuse and possibly context-independentfunctional connectivity deficit, upon which are superimposed morecircumscribed, context-dependent changes resulting in transient hypo-and/or hyper-connected states. The causes of these changes in inter-regional functional coupling remain unclear, but in some cases appearrelated to localized intra-regional dysfunction. These abnormalities arealso associated with widespread topological changes broadly character-ized by reductions in measures of local information-processing and, to
Please cite this article as: Fornito, A., et al., Schizophrenia, neurj.neuroimage.2011.12.090
a lesser extent, increases in measures of global functional integration.Some of these functional abnormalities may have an anatomical basis,though the relationship between functional and anatomical dysconnec-tivity in the disorder is complex.
While several consistent themes emerged in the reviewed findings,discrepancies were also apparent. These discrepancies may partly re-flect the heterogeneous nature of schizophrenia, which is an umbrellaterm that likely describes multiple disease processes with distinct etiol-ogies and overlapping clinical manifestations. Such heterogeneity iscompounded by the small samples usually studied in the literature.The discrepancies may also reflect variations in the clinical status ofthe patients at the time of scanning, including differences in symptom-atology, medication status, and/or illness stage. As previously men-tioned, positive and negative associations between connectivity levelsand various symptom dimensions of schizophrenia have been reported(Cole et al., 2010; Salvador et al., 2010a; Vercammen et al., 2010;Whitfield-Gabrieli et al., 2009) suggesting thefindingsmay, to some ex-tent, be associated with transient variations in the clinical expression ofthe disease. Antipsychotic treatment has also been shown to modulatefunctional connectivity (Achard and Bullmore, 2007; Lui et al., 2010),and represents a potentially serious confound inmany studies. Howev-er, reports of connectivity disturbances in patients' unaffected siblings(Liu et al., 2012; Repovs et al., 2011;Whitfield-Gabrieli et al., 2009) sug-gest that at least some connectomic abnormalitiesmay reflect an inher-ited susceptibility to the disease. These changes may represent viableintermediate phenotypes, consistent with evidence for high heritabilityof brain network connectivity and topology measures (Glahn et al.,2010; Fornito et al., 2011b; Smit et al., 2008) and their associationwith schizophrenia risk genes (Esslinger et al., 2009). Further delinea-tion of state- and trait-related effects on brain connectivity in the disor-der will be an important avenue of further investigation.
Heterogeneity across studies may also be caused by generic meth-odological issues common to all case–control neuroimaging studies,such as differences in image processing and quality assurance proto-cols. Methods for dealing with the problems posed by physiologicalor scanner related noise in both functional and structural studiesvary considerably across different research groups, and it is often dif-ficult to ascertain the impact that these variations have on the find-ings. In particular, the problems posed by head motion are notalways accounted for with traditional pre-processing strategies (VanDijk et al., 2012), and may require more detailed analysis than thesimple (and commonplace) exclusion of participants exceedingsome pre-specified motion threshold.
While the studies reviewed here demonstrate the utility of imag-ing connectomics and ga-MRI in particular for characterizing connec-tivity disturbances in schizophrenia, considerable work remains. Aglaring omission from the reviewed literature is longitudinal data.Brain changes in schizophrenia have a dynamic trajectory, beginningbefore disease onset and progressing with ongoing illness (HulshoffPol and Kahn, 2008; Olabi, et al., 2011; Pantelis et al., 2005; Woodet al., 2008). The findings listed in Tables 1–4 indicate that changesin brain connectivity and topology are present in both early and latestages of schizophrenia. Evidence that these changes are manifestprior to illness onset has been provided by one recent study reportingincreased nodal degree, k, of the anterior cingulate cortex in high-riskindividuals displaying elevated levels of psychotic symptoms (Lord etal., 2011). Whether these changes are predictive of which individualssubsequently develop schizophrenia is unclear, though volumetricchanges in the region do show predictive utility (Borgwardt et al.,2007; Fornito et al., 2008; Koutsouleris et al., 2009) consistent withthe known role that this region plays in the disorder's pathophysiol-ogy (Fornito et al., 2009a, 2009b). Such findings point to a potentialconvergence of volumetric and connectivity changes in the earlieststages of the illness. Whether the documented progression of volu-metric changes in schizophrenia is associated with connectomic ab-normalities has not yet been studied, but associations between
oimaging and connectomics, NeuroImage (2012), doi:10.1016/
16 A. Fornito et al. / NeuroImage xxx (2012) xxx–xxx
functional connectivity and volumetric losses in other brain disorders(Seeley et al., 2009) suggest that this relationship warrants furtherinvestigation.
Longitudinal work will prove particularly valuable for under-standing the generative mechanisms of connectomic disturbancesin schizophrenia. The literature reviewed here suggests that investi-gation of these mechanisms can be broadly framed in three terms:(1) whether brain network changes in schizophrenia are a globalphenomenon, or a secondary consequence of a localized dysfunctionpropagating throughout the network; (2) whether altered inter-regional connectivity is a cause or consequence of intra-regionaldysfunction; and (3) whether functional deficits are caused by ana-tomical abnormalities or vice-versa. All these changes have been ob-served in schizophrenia and relations between each of them havebeen established (e.g., Skudlarski et al., 2010; Zalesky et al., 2011b).Establishing the temporal sequence of these abnormalities will be acritical step in understanding their causal relationships.
Finally, an important issue concerns the specificity of the findings toschizophrenia. Altered functional and structural connectivity levels, aswell as network topological properties, have been reported in a rangeof psychiatric and neurological conditions (e.g., Di Martino, et al.,2011; Lin, et al., 2011; Lo, et al., 2010; Wang et al., 2009b), though sim-ilarities and differences between the disorders have seldombeen exam-ined directly. Preliminary work suggests that connectivity measuresmay indeed be useful in discriminating schizophrenia from other pa-tient groups (Calhoun et al., 2008), although no study to date has usedthe connectomic measures described in this article for these purposes.
In summary, imaging connectomics offers a rich conceptual and an-alytic framework for the comprehensive study of brain network abnor-malities in schizophrenia. The findings reported to date are consistentwith the ideas first proposed by Wernicke a century ago (1906), andhave extended contemporary pathophysiological models by demon-strating the highly distributed character of brain dysfunction associatedwith the disease. The continued refinement and application of thesemethods is likely to yield increasingly detailed insights into the dyscon-nection syndrome that characterizes schizophrenia.
Financial disclosures
ETB is employed half-time by GlaxoSmithKline. CP has receivedgrant support from Janssen-Cilag, Eli Lilly, Hospira (Mayne), andAstra Zeneca. He has provided consultancy to Janssen-Cilag, Eli Lilly,Hospira (Mayne), Astra Zeneca, Pfizer, Schering Plough, and Lund-beck. He has undertaken investigator initiated studies supported byEli Lilly, Hospira, Janssen Cilag and Astra Zeneca.
Acknowledgments
The authors thank Mary-Ellen Lynall and Aaron Alexander-Blochfor generously providing data and images to assist in generatingsome of the figures. AF was supported by a National Health and Med-ical Research Council CJ Martin Fellowship (ID: 454797). AZ is sup-ported by a Melbourne Neuroscience Institute Fellowship and anAustralian Research Council Research Fellow (APD; ID: DP0986320).CP was supported by a NHMRC Senior Principal Research Fellowship(ID: 628386) and NHMRC program grants (ID: 350241, 566529).
References
Achard, S., Bullmore, E., 2007. Efficiency and cost of economical brain functional net-works. PLoS Comput. Biol. 3, e17.
Achard, S., Salvador, R., Whitcher, B., Suckling, J., Bullmore, E., 2006. A resilient, low-frequency, small-world human brain functional network with highly connectedassociation cortical hubs. J. Neurosci. 26, 63–72.
Albert, R., Barabasi, A.L., 2002. Statistical mechanics of complex networks. Rev. Mod.Phys. 74, 47–97.
Please cite this article as: Fornito, A., et al., Schizophrenia, neurj.neuroimage.2011.12.090
Albert, R., Jeong, H., Barabasi, A.L., 2000. Error and attack tolerance of complex net-works. Nature 406, 378–382.
Albert, N.B., Robertson, E.M., Miall, R.C., 2009. The resting human brain and motorlearning. Curr. Biol. 19, 1023–1027.
Alexander-Bloch, A.F., Gogtay, N., Meunier, D., Birn, R., Clasen, L., Lalonde, F., Lenroot, R.,Giedd, J., Bullmore, E.T., 2010. Disrupted modularity and local connectivity of brainfunctional networks in childhood-onset schizophrenia. Front. Syst. Neurosci. 4, 147.
Allen, P., Stephan, K.E., Mechelli, A., Day, F., Ward, N., Dalton, J., Williams, S.C., McGuire,P., 2010. Cingulate activity and fronto-temporal connectivity in people with pro-dromal signs of psychosis. Neuroimage 49, 947–955.
Amaral, L.A., Scala, A., Barthelemy, M., Stanley, H.E., 2000. Classes of small-world net-works. Proc. Natl. Acad. Sci. U. S. A. 97, 11149–11152.
Andreasen, N.C., Paradiso, S., O'Leary, D.S., 1998. “Cognitive dysmetria” as an integra-tive theory of schizophrenia: a dysfunction in cortical–subcortical–cerebellar cir-cuitry? Schizophr. Bull. 24, 203–218.
Barabasi, A.L., Albert, R., 1999. Emergence of scaling in random networks. Science 286,509–512.
Barabasi, A.L., Oltvai, Z.N., 2004. Network biology: understanding the cell's functionalorganization. Nat. Rev. Genet. 5, 101–113.
Barnes, A., Bullmore, E.T., Suckling, J., 2009. Endogenous human brain dynamics recov-er slowly following cognitive effort. PLoS One 4, e6626.
Bassett, D.S., Bullmore, E., 2006. Small-world brain networks. Neuroscientist 12, 512–523.Bassett, D.S., Bullmore, E., Verchinski, B.A., Mattay, V.S., Weinberger, D.R., Meyer-
Lindenberg, A., 2008. Hierarchical organization of human cortical networks inhealth and schizophrenia. J. Neurosci. 28, 9239–9248.
Bassett, D.S., Bullmore, E.T., Meyer-Lindenberg, A., Apud, J.A., Weinberger, D.R.,Coppola, R., 2009. Cognitive fitness of cost-efficient brain functional networks.Proc. Natl. Acad. Sci. U. S. A. 106, 11747–11752.
Bassett, D.S., Greenfield, D.L.,Meyer-Lindenberg, A.,Weinberger, D.R.,Moore, S.W., Bullmore,E.T., 2010. Efficient physical embedding of topologically complex information proces-sing networks in brains and computer circuits. PLoS Comput. Biol. 6, e1000748.
Becerril, K.E., Repovs, G., Barch, D.M., 2011. Error processing network dynamics inschizophrenia. NeuroImage 54, 1495–1505.
Benetti, S., Mechelli, A., Picchioni,M., Broome,M.,Williams, S.,McGuire, P., 2009. Functionalintegration between the posterior hippocampus and prefrontal cortex is impaired inboth first episode schizophrenia and the at risk mental state. Brain 132, 2426–2436.
Biswal, B.B., Mennes, M., Zuo, X.N., Gohel, S., Kelly, C., Smith, S.M., Beckmann, C.F.,Adelstein, J.S., Buckner, R.L., Colcombe, S., Dogonowski, A.M., Ernst, M., Fair, D.,Hampson, M., Hoptman, M.J., Hyde, J.S., Kiviniemi, V.J., Kotter, R., Li, S.J., Lin, C.P.,Lowe, M.J., Mackay, C., Madden, D.J., Madsen, K.H., Margulies, D.S., Mayberg, H.S.,McMahon, K., Monk, C.S., Mostofsky, S.H., Nagel, B.J., Pekar, J.J., Peltier, S.J.,Petersen, S.E., Riedl, V., Rombouts, S.A., Rypma, B., Schlaggar, B.L., Schmidt, S.,Seidler, R.D., Siegle, G.J., Sorg, C., Teng, G.J., Veijola, J., Villringer, A., Walter, M.,Wang, L., Weng, X.C., Whitfield-Gabrieli, S., Williamson, P., Windischberger, C.,Zang, Y.F., Zhang, H.Y., Castellanos, F.X., Milham, M.P., 2010. Toward discovery sci-ence of human brain function. Proc. Natl. Acad. Sci. U. S. A. 107, 4734–4739.
Bleuler, E., 1911/1950. Dementia Praecox or the Group of Schizophrenias. InternationalUniversity Press, New York.
Boccaletti, S., Latora, V., Moreno, Y., Chavez, M., Hwang, D.-U., 2006. Complex net-works: structure and dynamics. Phys. Rep. 424, 175–308.
Bollobás, B., 1985. Random Graphs. Cambridge University Press, Cambridge, UK.Borgwardt, S.J., Riecher-Rossler, A., Dazzan, P., Chitnis, X., Aston, J., Drewe, M.,
Gschwandtner, U., Haller, S., Pfluger, M., Rechsteiner, E., D'Souza, M., Stieglitz,R.D., Radu, E.W., McGuire, P.K., 2007. Regional gray matter volume abnormalitiesin the at risk mental state. Biol. Psychiatry 61, 1148–1156.
Bullmore, E.T., Bassett, D.S., 2011. Brain graphs: graphical models of the human brainconnectome. Annu. Rev. Clin. Psychol. 7, 113–140.
Bullmore, E.T., Frangou, S., Murray, R.M., 1997. The dysplastic net hypothesis: an inte-gration of developmental and dysconnectivity theories of schizophrenia. Schi-zophr. Res. 28, 143–156.
Bullmore, E., Barnes, A., Bassett, D.S., Fornito, A., Kitzbichler, M., Meunier, D., Suckling,J., 2009. Generic aspects of complexity in brain imaging data and other biologicalsystems. NeuroImage 47, 1125–1134.
Buzsaki, G., Geisler, C., Henze, D.A.,Wang, X.J., 2004. Interneuron diversity series: circuit com-plexity and axonwiring economyof cortical interneurons. TrendsNeurosci. 27, 186–193.
Calhoun, V.D., Maciejewski, P.K., Pearlson, G.D., Kiehl, K.A., 2008. Temporal lobe and“default” hemodynamic brain modes discriminate between schizophrenia and bi-polar disorder. Hum. Brain Mapp. 29, 1265–1275.
Chen, B.L., Hall, D.H., Chklovskii, D.B., 2006. Wiring optimization can relate neuronalstructure and function. Proc. Natl. Acad. Sci. U. S. A. 103, 4723–4728.
Chen, Y., Paul, G., Cohen, R., Havlin, S., Borgatti, S.P., Liljeros, F., Stanley, H.E., 2007. Per-colation theory applied to measures of fragmentation in social networks. Phys. Rev.E: Stat. Nonlinear Soft Matter Phys. 75, 046107.
Cherniak, C., Mokhtarzada, Z., Rodriguez-Esteban, R., Changizi, K., 2004. Global optimi-zation of cerebral cortex layout. Proc. Natl. Acad. Sci. U. S. A. 101, 1081–1086.
Chklovskii, D.B., Schikorski, T., Stevens, C.F., 2002. Wiring optimization in cortical cir-cuits. Neuron 34, 341–347.
Cole, D.M., Smith, S.M., Beckmann, C.F., 2010. Advances and pitfalls in the analysis andinterpretation of resting-state FMRI data. Front Syst. Neurosci. 4, 8.
Crossley, N.A., Mechelli, A., Fusar-Poli, P., Broome, M.R., Matthiasson, P., Johns, L.C.,Bramon, E., Valmaggia, L., Williams, S.C., McGuire, P.K., 2009. Superior temporallobe dysfunction and frontotemporal dysconnectivity in subjects at risk of psycho-sis and in first-episode psychosis. Hum. Brain Mapp. 30, 4129–4137.
Damoiseaux, J.S., Rombouts, S.A., Barkhof, F., Scheltens, P., Stam, C.J., Smith, S.M.,Beckmann, C.F., 2006. Consistent resting-state networks across healthy subjects.Proc. Natl. Acad. Sci. U. S. A. 103, 13848–13853.
oimaging and connectomics, NeuroImage (2012), doi:10.1016/
17A. Fornito et al. / NeuroImage xxx (2012) xxx–xxx
David, A.S., 1994. Dysmodularity: a neurocognitive model for schizophrenia. Schizophr.Bull. 20, 249–255.
David, O., 2011. fMRI connectivity, meaning and empiricism Comments on: Roebroeck etal. The identification of interacting networks in the brain using fMRI:model selection,causality and deconvolution. Neuroimage 58 (2), 306–309 (author reply 310-1).
Desikan, R.S., Segonne, F., Fischl, B., Quinn, B.T., Dickerson, B.C., Blacker, D., Buckner,R.L., Dale, A.M., Maguire, R.P., Hyman, B.T., Albert, M.S., Killiany, R.J., 2006. An auto-mated labeling system for subdividing the human cerebral cortex on MRI scansinto gyral based regions of interest. NeuroImage 31, 968–980.
Di Martino, A., Kelly, C., Grzadzinski, R., Zuo, X.N., Mennes, M., Mairena, M.A., Lord, C.,Castellanos, F.X., Milham, M.P., 2011. Aberrant striatal functional connectivity inchildren with autism. Biol. Psychiatry 69, 847–856.
Dosenbach, N.U., Nardos, B., Cohen, A.L., Fair, D.A., Power, J.D., Church, J.A., Nelson, S.M.,Wig, G.S., Vogel, A.C., Lessov-Schlaggar, C.N., Barnes, K.A., Dubis, J.W., Feczko, E.,Coalson, R.S., Pruett Jr., J.R., Barch, D.M., Petersen, S.E., Schlaggar, B.L., 2010. Predic-tion of individual brain maturity using fMRI. Science 329, 1358–1361.
Eguiluz, V.M., Chialvo, D.R., Cecchi, G.A., Baliki, M., Apkarian, A.V., 2005. Scale-free brainfunctional networks. Phys. Rev. Lett. 94, 018102.
Ellison-Wright, I., Bullmore, E., 2009. Meta-analysis of diffusion tensor imaging studiesin schizophrenia. Schizophr. Res. 108, 3–10.
Esslinger, C., Walter, H., Kirsch, P., Erk, S., Schnell, K., Arnold, C., Haddad, L., Mier, D.,Opitz von Boberfeld, C., Raab, K., Witt, S.H., Rietschel, M., Cichon, S., Meyer-Lindenberg, A., 2009. Neural mechanisms of a genome-wide supported psychosisvariant. Science 324, 605.
Fair, D.A., Cohen, A.L., Power, J.D., Dosenbach, N.U., Church, J.A., Miezin, F.M., Schlaggar,B.L., Petersen, S.E., 2009. Functional brain networks develop from a “local to dis-tributed” organization. PLoS Comput. Biol. 5, e1000381.
Fornito, A., Bullmore, E.T., 2010. What can spontaneous fluctuations of the bloodoxygenation-level-dependent signal tell us about psychiatric disorders? Curr.Opin. Psychiatry 23, 239–249.
Fornito, A., Yung, A.R., Wood, S.J., Phillips, L.J., Nelson, B., Cotton, S., Velakoulis, D.,McGorry, P.D., Pantelis, C., Yucel, M., 2008. Anatomic abnormalities of the anteriorcingulate cortex before psychosis onset: an MRI study of ultra-high-risk individ-uals. Biol. Psychiatry 64, 758–765.
Fornito, A., Yucel, M., Dean, B., Wood, S.J., Pantelis, C., 2009a. Anatomical abnormalitiesof the anterior cingulate cortex in schizophrenia: bridging the gap between neuro-imaging and neuropathology. Schizophr. Bull. 35, 973–993.
Fornito, A., Yucel, M., Patti, J., Wood, S.J., Pantelis, C., 2009b. Mapping grey matter re-ductions in schizophrenia: an anatomical likelihood estimation analysis of voxel-based morphometry studies. Schizophr. Res. 108, 104–113.
Fornito, A., Zalesky, A., Bullmore, E.T., 2010. Network scaling effects in graph analyticstudies of human resting-state FMRI data. Front. Syst. Neurosci. 4, 22.
Fornito, A., Yoon, J., Zalesky, A., Bullmore, E.T., Carter, C.S., 2011a. General and specificfunctional connectivity disturbances in first-episode schizophrenia during cogni-tive control performance. Biol. Psychiatry 70, 64–72.
Fornito, A., Zalesky, A., Bassett, D.S., Meunier, D., Ellison-Wright, I., Yucel, M., Wood, S.J.,Shaw, K., O'Connor, J., Nertney, D., Mowry, B.J., Pantelis, C., Bullmore, E.T., 2011b.Genetic influences on cost-efficient organization of human cortical functional net-works. J. Neurosci. 31, 3261–3270.
Fornito, A., Yoon, J., Zalesky, A., Bullmore, E.T., Carter, C.S., 2011c. General and specificfunctional connectivity deficits in first episode schizophrenia during cognitive con-trol performance. Biol. Psychiatry 70 (1), 64–72.
Fortunato, S., 2010. Community detection in graphs. Phys. Rep. 486, 75–174.Fox, M.D., Raichle, M.E., 2007. Spontaneous fluctuations in brain activity observed with
functional magnetic resonance imaging. Nat. Rev. Neurosci. 8, 700–711.Fox, M.D., Zhang, D., Snyder, A.Z., Raichle, M.E., 2009. The global signal and observed
anticorrelated resting state brain networks. J. Neurophysiol. 101, 3270–3283.Fransson, P., 2006. How default is the default mode of brain function? Further evidence
from intrinsic BOLD signal fluctuations. Neuropsychologia 44, 2836–2845.Freeman, L.C., 1977. A set of measures of centrality based on betweeness. Sociometry
40, 35–41.Friston, K.J., 1998. The disconnection hypothesis. Schizophr. Res. 30, 115–125.Friston, K., 2009. Causal modelling and brain connectivity in functional magnetic reso-
nance imaging. PLoS Biol. 7, e33.Friston, K.J., Frith, C.D., 1995. Schizophrenia: a disconnection syndrome? Clin. Neurosci.
3, 89–97.Friston, K.J., Harrison, L., Penny, W., 2003. Dynamic causal modelling. NeuroImage 19,
1273–1302.Giacomini, P.S., Levesque, I.R., Ribeiro, L., Narayanan, S., Francis, S.J., Pike, G.B., Arnold,
D.L., 2009. Measuring demyelination and remyelination in acute multiple sclerosislesion voxels. Arch. Neurol. 66, 375–381.
Glahn, D.C., Winkler, A.M., Kochunov, P., Almasy, L., Duggirala, R., Carless, M.A.,Curran, J.C., Olvera, R.L., Laird, A.R., Smith, S.M., Beckmann, C.F., Fox, P.T.,Blangero, J., 2010. Genetic control over the resting brain. Proc. Natl. Acad. Sci. U.S. A. 107, 1223–1228.
Glantz, L.A., Lewis, D.A., 2001. Dendritic spine density in schizophrenia and depression.Arch. Gen. Psychiatry 58, 203.
Goebel, R., Roebroeck, A., Kim, D.S., Formisano, E., 2003. Investigating directed corticalinteractions in time-resolved fMRI data using vector autoregressive modeling andGranger causality mapping. Magn. Reson. Imaging 21, 1251–1261.
Good, B.H., de Montjoye, Y.A., Clauset, A., 2010. Performance of modularity maximiza-tion in practical contexts. Phys. Rev. E: Stat. Nonlinear Soft Matter Phys. 81,046106.
Greicius, M.D., Kiviniemi, V., Tervonen, O., Vainionpaa, V., Alahuhta, S., Reiss, A.L.,Menon, V., 2008. Persistent default-mode network connectivity during light seda-tion. Hum. Brain Mapp. 29, 839–847.
Please cite this article as: Fornito, A., et al., Schizophrenia, neurj.neuroimage.2011.12.090
Hagmann, P., Cammoun, L., Gigandet, X., Meuli, R., Honey, C.J., Wedeen, V.J., Sporns, O.,2008. Mapping the structural core of human cerebral cortex. PLoS Biol. 6, e159.
Harrison, P.J., Weinberger, D.R., 2005. Schizophrenia genes, gene expression, and neuro-pathology: on the matter of their convergence. Mol. Psychiatry 10, 40–68 image 45.
Harrison, B.J., Pujol, J., Ortiz, H., Fornito, A., Pantelis, C., Yucel, M., 2008. Modulation ofbrain resting-state networks by sad mood induction. PLoS One 3, e1794.
Hayasaka, S., Laurienti, P.J., 2010. Comparison of characteristics between region- andvoxel-based network analyses in resting-state fMRI data. NeuroImage 50, 499–508.
He, Y., Chen, Z.J., Evans, A.C., 2007. Small-world anatomical networks in the humanbrain revealed by cortical thickness from MRI. Cereb. Cortex 17, 2407–2419.
He, B.J., Snyder, A.Z., Zempel, J.M., Smyth, M.D., Raichle, M.E., 2008. Electrophysiologicalcorrelates of the brain's intrinsic large-scale functional architecture. Proc. Natl.Acad. Sci. U. S. A. 105, 16039–16044.
He, Y., Dagher, A., Chen, Z., Charil, A., Zijdenbos, A., Worsley, K., Evans, A., 2009. Im-paired small-world efficiency in structural cortical networks in multiple sclerosisassociated with white matter lesion load. Brain 132, 3366–3379.
Heinrichs, R.W., Zakzanis, K.K., 1998. Neurocognitive deficit in schizophrenia: a quan-titative review of the evidence. Neuropsychology 12, 426–445.
Honey, C.J., Sporns, O., Cammoun, L., Gigandet, X., Thiran, J.P., Meuli, R., Hagmann, P.,2009. Predicting human resting-state functional connectivity from structural con-nectivity. Proc. Natl. Acad. Sci. U. S. A. 106, 2035–2040.
Hoptman, M.J., Zuo, X.N., Butler, P.D., Javitt, D.C., D'Angelo, D., Mauro, C.J., Milham, M.P.,2010. Amplitude of low-frequency oscillations in schizophrenia: a resting statefMRI study. Schizophr. Res. 117 (1), 13–20.
Horovitz, S.G., Fukunaga, M., de Zwart, J.A., van Gelderen, P., Fulton, S.C., Balkin, T.J.,Duyn, J.H., 2008. Low frequency BOLD fluctuations during resting wakefulnessand light sleep: a simultaneous EEG–fMRI study. Hum. Brain Mapp. 29, 671–682.
Hulshoff Pol, H.E., Kahn, R.S., 2008. What happens after the first episode? A review ofprogressive brain changes in chronically ill patients with schizophrenia. Schizophr.Bull. 34, 354–366.
Humphries, M.D., Gurney, K., Prescott, T.J., 2006. The brainstem reticular formation is asmall-world, not scale-free, network. Proc. Biol. Sci. 273, 503–511.
Ingvar, D.H., Franzen, G., 1974a. Abnormalities of cerebral blood flow distribution inpatients with chronic schizophrenia. Acta Psychiatr. Scand. 50, 425–462.
Ingvar, D.H., Franzen, G., 1974b. Distribution of cerebral activity in chronic schizophre-nia. Lancet 2, 1484–1486.
Johnstone, E.C., Crow, T.J., Frith, C.D., Husband, J., Kreel, L., 1976. Cerebral ventricularsize and cognitive impairment in chronic schizophrenia. Lancet 2, 924–926.
Kaiser, M., Hilgetag, C.C., 2006. Nonoptimal component placement, but short proces-sing paths, due to long-distance projections in neural systems. PLoS Comput.Biol. 2, e95.
Konrad, A., Winterer, G., 2008. Disturbed structural connectivity in schizophrenia pri-mary factor in pathology or epiphenomenon? Schizophr. Bull. 34, 72–92.
Koutsouleris, N., Schmitt, G.J., Gaser, C., Bottlender, R., Scheuerecker, J., McGuire, P.,Burgermeister, B., Born, C., Reiser, M., Moller, H.J., Meisenzahl, E.M., 2009. Neuro-anatomical correlates of different vulnerability states for psychosis and their clini-cal outcomes. Br. J. Psychiatry 195, 218–226.
Latora, V., Marchiori, M., 2001. Efficient behavior of small-world networks. Phys. Rev.Lett. 87, 198701.
Latora, V., Marchiori, M., 2003. Economic small-world behavior in weighted networks.Eur. Phys. J. B 32, 249–263.
Laughlin, S.B., Sejnowski, T.J., 2003. Communication in neuronal networks. Science 301,1870–1874.
Lewis, C.M., Baldassarre, A., Committeri, G., Romani, G.L., Corbetta, M., 2009. Learningsculpts the spontaneous activity of the resting human brain. Proc. Natl. Acad. Sci.U. S. A. 106, 17558–17563.
Liang, M., Zhou, Y., Jiang, T., Liu, Z., Tian, L., Liu, H., Hao, Y., 2006. Widespread functionaldisconnectivity in schizophrenia with resting-state functional magnetic resonanceimaging. Neuroreport 17, 209–213.
Lin, F., Weng, S., Xie, B., Wu, G., Lei, H., 2011. Abnormal frontal cortex white matter con-nections in bipolar disorder: a DTI tractography study. J. Affect. Disord. 131,299–306.
Liu, H., Liu, Z., Liang, M., Hao, Y., Tan, L., Kuang, F., Yi, Y., Xu, L., Jiang, T., 2006. Decreasedregional homogeneity in schizophrenia: a resting state functional magnetic reso-nance imaging study. Neuroreport 17, 19–22.
Liu, Y., Liang, M., Zhou, Y., He, Y., Hao, Y., Song, M., Yu, C., Liu, H., Liu, Z., Jiang, T., 2008.Disrupted small-world networks in schizophrenia. Brain 131, 945–961.
Liu, H., Kaneko, Y., Ouyang, X., Li, L., Hao, Y., Chen, E.Y., Jiang, T., Zhou, Y., Liu, Z., 2012.Schizophrenic patients and their unaffected siblings share increased resting-stateconnectivity in the task-negative network but not its anticorrelated task-positivenetwork. Schizophr. Bull. 38 (2), 285–294.
Lo, C.Y., Wang, P.N., Chou, K.H., Wang, J., He, Y., Lin, C.P., 2010. Diffusion tensor tracto-graphy reveals abnormal topological organization in structural cortical networks inAlzheimer's disease. J. Neurosci. 30, 16876–16885.
Lord, L.D., Allen, P., Expert, P., Howes, O., Lambiotte, R., McGuire, P., Bose, S.K., Hyde, S.,Turkheimer, F.E., 2011. Characterization of the anterior cingulate's role in the at-risk mental state using graph theory. NeuroImage 56, 1531–1539.
Lowe, M.J., Beall, E.B., Sakaie, K.E., Koenig, K.A., Stone, L., Marrie, R.A., Phillips, M.D.,2008. Resting state sensorimotor functional connectivity in multiple sclerosis in-versely correlates with transcallosal motor pathway transverse diffusivity. Hum.Brain Mapp. 29, 818–827.
Lui, S., Li, T., Deng, W., Jiang, L., Wu, Q., Tang, H., Yue, Q., Huang, X., Chan, R.C., Collier,D.A., Meda, S.A., Pearlson, G., Mechelli, A., Sweeney, J.A., Gong, Q., 2010. Short-term effects of antipsychotic treatment on cerebral function in drug-naive first-episode schizophrenia revealed by “resting state” functional magnetic resonanceimaging. Arch. Gen. Psychiatry 67, 783–792.
oimaging and connectomics, NeuroImage (2012), doi:10.1016/
18 A. Fornito et al. / NeuroImage xxx (2012) xxx–xxx
Lynall, M.E., Bassett, D.S., Kerwin, R., McKenna, P.J., Kitzbichler, M., Muller, U., Bullmore,E., 2010. Functional connectivity and brain networks in schizophrenia. J. Neurosci.30, 9477–9487.
McGuire, P.K., Frith, C.D., 1996. Disordered functional connectivity in schizophrenia.Psychol. Med. 26, 663–667.
Mechelli, A., Allen, P., Amaro Jr., E., Fu, C.H., Williams, S.C., Brammer, M.J., Johns, L.C.,McGuire, P.K., 2007. Misattribution of speech and impaired connectivity in patientswith auditory verbal hallucinations. Hum. Brain Mapp. 28, 1213–1222.
Meunier, D., Lambiotte, R., Fornito, A., Ersche, K.D., Bullmore, E.T., 2009. Hierarchicalmodularity in human brain functional networks. Front Neuroinformatics 3, 37.
Meunier, D., Lambiotte, R., Bullmore, E.T., 2011. Modular and hierarchically modularorganization of brain networks. Front. Neurosci. 4, 200.
Murphy, K., Birn, R.M., Handwerker, D.A., Jones, T.B., Bandettini, P.A., 2009. The impactof global signal regression on resting state correlations: are anti-correlated net-works introduced? NeuroImage 44, 893–905.
Newman, M.J.E., 2003. The structure and function of complex networks. SIAM Rev. 45,167–256.
Newman, M.E., 2006. Modularity and community structure in networks. Proc. Natl.Acad. Sci. U. S. A. 103, 8577–8582.
Newman, M.E., Girvan, M., 2004. Finding and evaluating community structure in net-works. Phys. Rev. E: Stat. Nonlinear Soft Matter Phys. 69, 026113.
Olabi, B., Ellison-Wright, I., McIntosh, A.M., Wood, S.J., Bullmore, E., Lawrie, S.M., 2011.Are there progressive brain changes in schizophrenia? A meta-analysis of structur-al magnetic resonance imaging studies. Biol Psychiatry 70 (1), 88–96.
Pantelis, C., Yucel, M., Wood, S.J., Velakoulis, D., Sun, D., Berger, G., Stuart, G.W., Yung,A., Phillips, L., McGorry, P.D., 2005. Structural brain imaging evidence for multiplepathological processes at different stages of brain development in schizophrenia.Schizophr. Bull. 31, 672–696.
Pettersson-Yeo, W., Allen, P., Benetti, S., McGuire, P., Mechelli, A., 2011. Dysconnectiv-ity in schizophrenia: where are we now? Neurosci. Biobehav. Rev. 35, 1110–1124.
Ravasz, E., Barabasi, A.L., 2003. Hierarchical organization in complex networks. Phys.Rev. E: Stat. Nonlinear Soft Matter Phys. 67, 026112.
Repovs, G., Csernansky, J.G., Barch, D.M., 2011. Brain network connectivity in individ-uals with schizophrenia and their siblings. Biol. Psychiatry 69, 967–973.
Rissman, J., Gazzaley, A., D'Esposito, M., 2004. Measuring functional connectivity dur-ing distinct stages of a cognitive task. NeuroImage 23, 752–763.
Roebroeck, A., Formisano, E., Goebel, R., 2011a. The identification of interacting net-works in the brain using fMRI: Model selection, causality and deconvolution. Neu-roimage 58 (2), 296–302.
Roebroeck, A., Formisano, E., Goebel, R., 2011b. Reply to Friston and David After com-ments on: The identification of interacting networks in the brain using fMRI:Model selection, causality and deconvolution. Neuroimage 58 (2), 310–311.
Rubinov, M., Sporns, O., 2010. Complex network measures of brain connectivity: usesand interpretations. NeuroImage 52 (3), 1059–1069.
Rubinov, M., Sporns, O., 2011. Weight-conserving characterization of complex func-tional brain networks. NeuroImage 56 (4), 2068–2079.
Rubinov, M., Knock, S.A., Stam, C.J., Micheloyannis, S., Harris, A.W., Williams, L.M.,Breakspear, M., 2009. Small-world properties of nonlinear brain activity in schizo-phrenia. Hum. Brain Mapp. 30, 403–416.
Salvador, R., Martinez, A., Pomarol-Clotet, E., Sarro, S., Suckling, J., Bullmore, E., 2007.Frequency based mutual information measures between clusters of brain regionsin functional magnetic resonance imaging. NeuroImage 35, 83–88.
Salvador, R., Anguera, M., Gomar, J.J., Bullmore, E.T., Pomarol-Clotet, E., 2010a. Condi-tional mutual information maps as descriptors of net connectivity levels in thebrain. Front Neuroinformatics 4, 115.
Salvador, R., Sarro, S., Gomar, J.J., Ortiz-Gil, J., Vila, F., Capdevila, A., Bullmore, E., McKenna,P.J., Pomarol-Clotet, E., 2010b. Overall brain connectivity maps show cortico-subcortical abnormalities in schizophrenia. Hum. Brain Mapp. 31, 2003–2014.
Salvador, R., Sarro, S., Gomar, J.J., Ortiz-Gil, J., Vila, F., Capdevila, A., Bullmore, E., McKenna,P.J., Pomarol-Clotet, E., 2010. Overall brain connectivity maps show cortico-subcorticalabnormalities in schizophrenia. Hum Brain Mapp 31 (12), 2003–2014.
Seeley, W.W., Menon, V., Schatzberg, A.F., Keller, J., Glover, G.H., Kenna, H., Reiss, A.L.,Greicius, M.D., 2007. Dissociable intrinsic connectivity networks for salience pro-cessing and executive control. J. Neurosci. 27, 2349–2356.
Seeley, W.W., Crawford, R.K., Zhou, J., Miller, B.L., Greicius, M.D., 2009. Neurodegener-ative diseases target large-scale human brain networks. Neuron 62, 42–52.
Shehzad, Z., Kelly, A.M., Reiss, P.T., Gee, D.G., Gotimer, K., Uddin, L.Q., Lee, S.H.,Margulies, D.S., Roy, A.K., Biswal, B.B., Petkova, E., Castellanos, F.X., Milham,M.P., 2009. The resting brain: unconstrained yet reliable. Cereb. Cortex 19,2209–2229.
Skudlarski, P., Jagannathan, K., Calhoun, V.D., Hampson, M., Skudlarska, B.A., Pearlson,G., 2008. Measuring brain connectivity: diffusion tensor imaging validates restingstate temporal correlations. NeuroImage 43, 554–561.
Skudlarski, P., Jagannathan, K., Anderson, K., Stevens, M.C., Calhoun, V.D., Skudlarska, B.A.,Pearlson, G., 2010. Brain connectivity is not only lower but different in schizophrenia:a combined anatomical and functional approach. Biol. Psychiatry 68, 61–69.
Smit, D.J., Stam, C.J., Posthuma, D., Boomsma, D.I., de Geus, E.J., 2008. Heritability of“small-world” networks in the brain: a graph theoretical analysis of resting-stateEEG functional connectivity. Hum. Brain Mapp. 29, 1368–1378.
Smith, S.M., Fox, P.T., Miller, K.L., Glahn, D.C., Fox, P.M., Mackay, C.E., Filippini, N.,Watkins, K.E., Toro, R., Laird, A.R., Beckmann, C.F., 2009. Correspondence of thebrain's functional architecture during activation and rest. Proc. Natl. Acad. Sci.U. S. A. 106, 13040–13045.
Smith, S.M., Miller, K.L., Salimi-Khorshidi, G., Webster, M., Beckmann, C.F., Nichols, T.E.,Ramsey, J.D., Woolrich, M.W., 2011. Network modelling methods for fMRI. Neuro-Image 54 (2), 875–891.
Please cite this article as: Fornito, A., et al., Schizophrenia, neurj.neuroimage.2011.12.090
Sporns, O., 2011. The human connectome: a complex network. Ann. N. Y. Acad. Sci.1224, 109–125.
Sporns, O. The human connectome: a complex network. Ann N Y Acad Sci 1224: 109–125.Sporns, O., Zwi, J.D., 2004. The small world of the cerebral cortex. Neuroinformatics 2,
145–162.Sporns, O., Tononi, G., Kotter, R., 2005. The human connectome: a structural description
of the human brain. PLoS Comput. Biol. 1, e42.Stam, C.J., Reijneveld, J.C., 2007. Graph theoretical analysis of complex networks in the
brain. Nonlinear Biomed. Phys. 1, 3.Stephan, K.E., Baldeweg, T., Friston, K.J., 2006. Synaptic plasticity and dysconnection in
schizophrenia. Biol. Psychiatry 59, 929–939.Stephan, K.E., Friston, K.J., Frith, C.D., 2009. Dysconnection in schizophrenia: from abnor-
mal synaptic plasticity to failures of self-monitoring. Schizophr. Bull. 35, 509–527.Sun, D., Stuart, G.W., Jenkinson, M., Wood, S.J., McGorry, P.D., Velakoulis, D., van Erp,
T.G., Thompson, P.M., Toga, A.W., Smith, D.J., Cannon, T.D., Pantelis, C., 2009.Brain surface contraction mapped in first-episode schizophrenia: a longitudinalmagnetic resonance imaging study. Mol. Psychiatry 14, 976–986.
Tambini, A., Ketz, N., Davachi, L., 2010. Enhanced brain correlations during rest are re-lated to memory for recent experiences. Neuron 65, 280–290.
Telesford, Q., Simpson, S.L., Burdette, J.H., Hayasaka, S., Laurienti, P.J., 2011. The brain asa complex system: using network science as a tool for understanding the brain.Brain Connectivity 1, 295–308.
Tononi, G., Edelman, G.M., 2000. Schizophrenia and the mechanisms of conscious inte-gration. Brain Res. Brain Res. Rev. 31, 391–400.
Tzourio-Mazoyer, N., Landeau, B., Papathanassiou, D., Crivello, F., Etard, O., Delcroix, N.,Mazoyer, B., Joliot, M., 2002. Automated anatomical labeling of activations in SPMusing a macroscopic anatomical parcellation of the MNI MRI single-subject brain.NeuroImage 15, 273–289.
van den Heuvel, M.P., Stam, C.J., Boersma, M., Hulshoff Pol, H.E., 2008. Small-world andscale-free organization of voxel-based resting-state functional connectivity in thehuman brain. NeuroImage 43, 528–539.
van den Heuvel, M.P., Stam, C.J., Kahn, R.S., Hulshoff Pol, H.E., 2009. Efficiency of func-tional brain networks and intellectual performance. J. Neurosci. 29, 7619–7624.
van den Heuvel, M.P., Mandl, R.C., Stam, C.J., Kahn, R.S., Hulshoff Pol, H.E., 2010. Aber-rant frontal and temporal complex network structure in schizophrenia: a graphtheoretical analysis. J. Neurosci. 30 (47), 15915–15926.
Van Dijk, K.R., Hedden, T., Venkataraman, A., Evans, K.C., Lazar, S.W., Buckner, R.L.,2010. Intrinsic functional connectivity as a tool for human connectomics: theory,properties, and optimization. J. Neurophysiol. 103, 297–321.
Van Dijk, K.R., Sabuncu, M.R., Buckner, R.L., 2012. The influence of head motion on in-trinsic functional connectivity MRI. NeuroImage 59, 431–438.
Varela, F., Lachaux, J.P., Rodriguez, E., Martinerie, J., 2001. The brainweb: phase syn-chronization and large-scale integration. Nat. Rev. Neurosci. 2, 229–239.
Vavasour, I.M., Laule, C., Li, D.K., Traboulsee, A.L., MacKay, A.L., 2011. Is the magnetiza-tion transfer ratio a marker for myelin in multiple sclerosis? J. Magn. Reson. Imag-ing 33, 713–718.
Vercammen, A., Knegtering, H., den Boer, J.A., Liemburg, E.J., Aleman, A., 2010. Auditoryhallucinations in schizophrenia are associated with reduced functional connectiv-ity of the temporo-parietal area. Biol. Psychiatry 67, 912–918.
Volkow, N.D., Wolf, A.P., Brodie, J.D., Cancro, R., Overall, J.E., Rhoades, H., Van Gelder, P.,1988. Brain interactions in chronic schizophrenics under resting and activationconditions. Schizophr. Res. 1, 47–53.
Walterfang, M., Wood, S.J., Velakoulis, D., Pantelis, C., 2006. Neuropathological, neuro-genetic and neuroimaging evidence for white matter pathology in schizophrenia.Neurosci. Biobehav. Rev. 30, 918–948.
Wang, J., Wang, L., Zang, Y., Yang, H., Tang, H., Gong, Q., Chen, Z., Zhu, C., He, Y., 2009a.Parcellation-dependent small-world brain functional networks: a resting-statefMRI study. Hum. Brain Mapp. 30, 1511–1523.
Wang, L., Zhu, C., He, Y., Zang, Y., Cao, Q., Zhang, H., Zhong, Q., Wang, Y., 2009b. Alteredsmall-world brain functional networks in children with attention-deficit/hyperactivity disorder. Hum. Brain Mapp. 30, 638–649.
Wang, L., Metzak, P.D., Honer, W.G., Woodward, T.S., 2010. Impaired efficiency of func-tional networks underlying episodic memory-for-context in schizophrenia. J. Neu-rosci. 30, 13171–13179.
Watts, D.J., Strogatz, S.H., 1998. Collective dynamics of ‘small-world’ networks. Nature393, 440–442.
Wernicke, C., 1906. Grundrisse der Psychiatrie. Thieme, Leipzig, Germany.Whitfield-Gabrieli, S., Thermenos, H.W., Milanovic, S., Tsuang, M.T., Faraone, S.V.,
McCarley, R.W., Shenton, M.E., Green, A.I., Nieto-Castanon, A., LaViolette, P.,Wojcik, J., Gabrieli, J.D., Seidman, L.J., 2009. Hyperactivity and hyperconnectivityof the default network in schizophrenia and in first-degree relatives of personswith schizophrenia. Proc. Natl. Acad. Sci. U. S. A. 106, 1279–1284.
Wig, G.S., Schlaggar, B.L., Petersen, S.E., 2011. Concepts and principles in the analysis ofbrain networks. Ann. N. Y. Acad. Sci. 1224, 126–146.
Wolf, R.C., Vasic, N., Sambataro, F., Hose, A., Frasch, K., Schmid, M., Walter, H., 2009.Temporally anticorrelated brain networks during working memory performancereveal aberrant prefrontal and hippocampal connectivity in patients with schizo-phrenia. Prog. Neuropsychopharmacol. Biol. Psychiatry 33, 1464–1473.
Wood, S.J., Pantelis, C., Velakoulis, D., Yucel, M., Fornito, A., McGorry, P.D., 2008. Pro-gressive changes in the development toward schizophrenia: studies in subjectsat increased symptomatic risk. Schizophr. Bull. 34, 322–329.
Yoon, J.H., Minzenberg, M.J., Ursu, S., Ryan Walter, B.S., Wendelken, C., Ragland, J.D.,Carter, C.S., 2008. Association of dorsolateral prefrontal cortex dysfunction withdisrupted coordinated brain activity in schizophrenia: relationship with impairedcognition, behavioral disorganization, and global function. Am. J. Psychiatry 165,1006–1014.
oimaging and connectomics, NeuroImage (2012), doi:10.1016/

19A. Fornito et al. / NeuroImage xxx (2012) xxx–xxx
Yu, Q., Sui, J., Rachakonda, S., He, H., Gruner, W., Pearlson, G., Kiehl, K.A., Calhoun, V.D.,2011. Altered topological properties of functional network connectivity in schizo-phrenia during resting state: a small-world brain network study. PLoS One 6, e25423.
Zalesky, A., Fornito, A., 2009. A DTI-derived measure of cortico-cortical connectivity.IEEE Trans. Med. Imaging 28, 1023–1036.
Zalesky, A., Fornito, A., Bullmore, E.T., 2010a. Network-based statistic: identifying dif-ferences in brain networks. NeuroImage 53, 1197–1207.
Zalesky, A., Fornito, A., Harding, I.H., Cocchi, L., Yucel, M., Pantelis, C., Bullmore, E.T.,2010b. Whole-brain anatomical networks: does the choice of nodes matter? Neu-roImage 50, 970–983.
Please cite this article as: Fornito, A., et al., Schizophrenia, neurj.neuroimage.2011.12.090
Zalesky, A., Fornito, A., Seal, M.L., Cocchi, L., Westin, C.F., Bullmore, E.T., Egan, G.F.,Pantelis, C., 2011a. Disrupted axonal fiber connectivity in schizophrenia. Biol. Psy-chiatry 69, 80–89.
Zalesky, A., Fornito, A., Egan, G.F., Pantelis, C., Bullmore, E.T., 2011b. The relationshipbetween regional and inter-regional functional connectivity deficits in schizophre-nia. Hum. Brain Mapp. doi:10.1011/hbm.21379 (Electronic publication ahead ofprint).
Zhou, Y., Liang, M., Tian, L., Wang, K., Hao, Y., Liu, H., Liu, Z., Jiang, T., 2007. Functionaldisintegration in paranoid schizophrenia using resting-state fMRI. Schizophr. Res.97, 194–205.
oimaging and connectomics, NeuroImage (2012), doi:10.1016/