Embed Size (px)
Citation preview

February 15, 2017
Welcome to SchindlerAnnual Results Presentation 2016

Annual results presentation 2016Agenda
Slide 2
Market development
Results 2016
Outlook 2017
Q&A
© Schindler | Annual Results Presentation 2016

Strategic progress New partnerships with GE Digital and Huawei to power digital urban mobility Enhanced market presence with acquisitions in China and Germany Successful new product launches Participation in ALSO 5.6% (status January 31, 2017)
Slide 3
Highlights 2016Growth strategy yielding results
© Schindler | Annual Results Presentation 2016
Operational progress Orders received increased by 4.6% in local currencies Revenue rose by 3.6% in local currencies EBIT margin increased to 11.5% before sale of operations in Japan and restructuring costs Net profit reached CHF 823 million (CHF 766 million before exceptional items)

Global markets in 2016Key developments
Global demand for new installations declined slightly Contraction mainly due to the softening Chinese market Indian real estate market hit in Q4 by demonetization effects Europe, the US and Asian markets w/o China and India with positive growth Brazil still in severe recession, but some signs of bottoming out
© Schindler | Annual Results Presentation 2016 Slide 4
Strong growth in modernization and service markets Growing installed base in emerging markets due to conversions Increasing modernization opportunities driven by ageing urban portfolio Pricing pressure particularly in mature markets

46k 138k
619k803k
46k 138k
586k770k
Stable Stable
–5%
Regional weight of NI market size (value) 2016
19% 17%
64%
Global new installations marketContraction in Asia-Pacific, other regions stable
China: contraction continued
India: demonetization impacted demand short term
Southeast Asia: healthy growth
Europe virtually flat due to adverse developments in Russia and Turkey
North America growth offsetby Brazil
NI market size (units) and growth rate 2015-16
–4%
2015 2016
Americas2015 2016 2015 2016 2015 2016
Europe Asia-Pacific Global
100%
© Schindler | Annual Results Presentation 2016 Slide 5
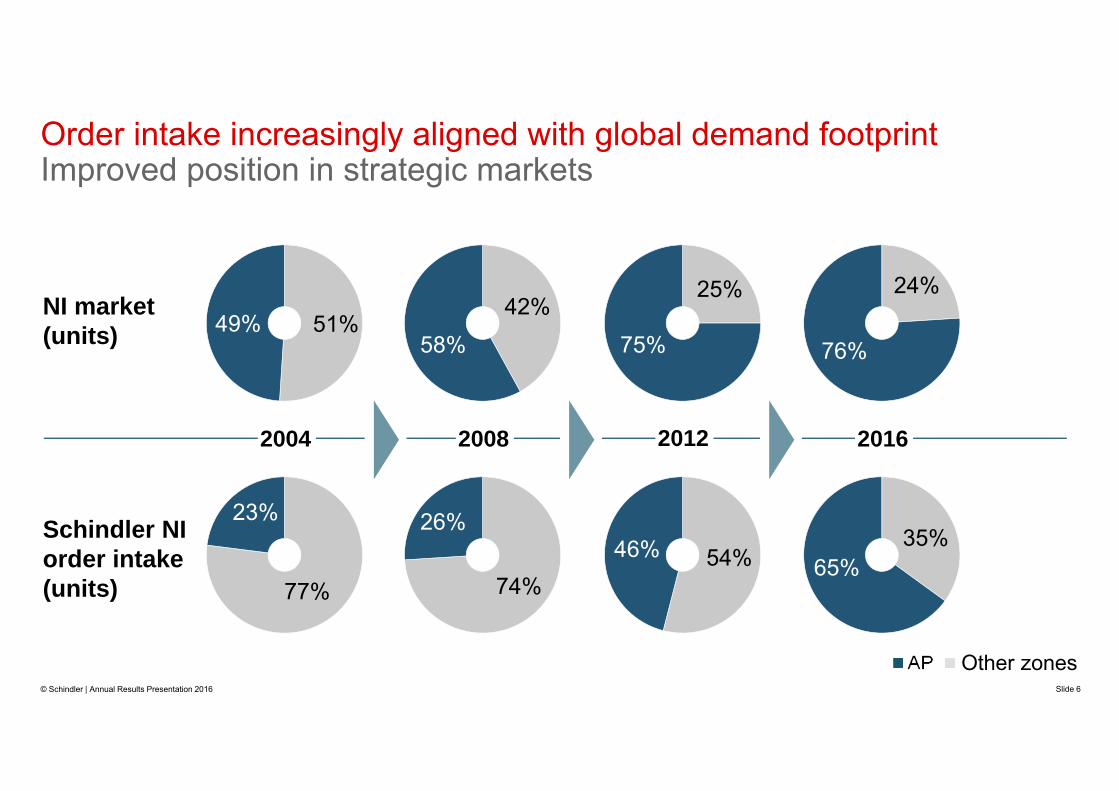
Order intake increasingly aligned with global demand footprintImproved position in strategic markets
NI market(units)
Schindler NI order intake(units)
76%
24%
2004 2008 2016
65%35%
58%42%
26%
74%
23%
77%
49% 51%
Slide 6
Other zones
75%
25%
46% 54%
2012
© Schindler | Annual Results Presentation 2016

Market development New installations still softening, mainly driven by lower tier cities Strong service market growth Delays in down-payments, continued pricing pressure
Schindler performance Growth in all segments (units) driven by excellent acceptance of new products
(Chinese Product Platform and Schindler 7000 new generation) Good order intake in large projects (e.g. public transport) Excellent growth in service business due to conversions Joint venture with Volkslift to enhance market presence in China
© Schindler | Annual Results Presentation 2016 Slide 7
Asia-Pacific: ChinaStill weakening new installations market
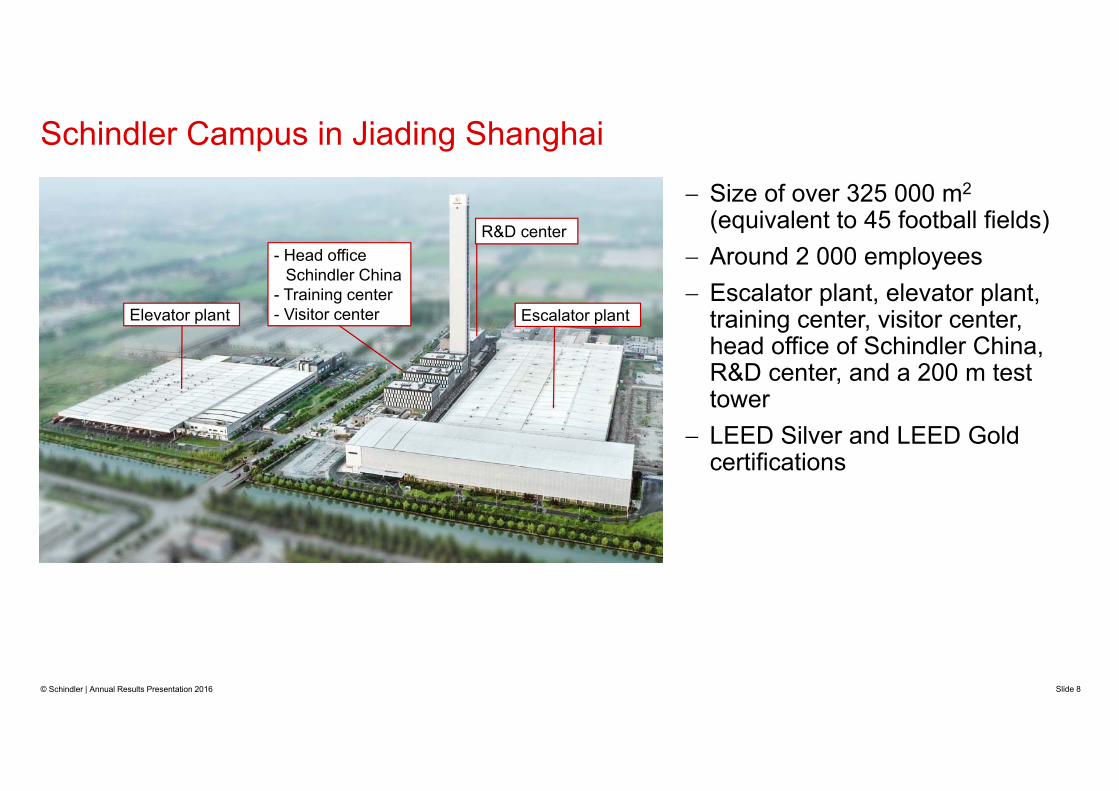
Schindler Campus in Jiading Shanghai
Size of over 325 000 m2
(equivalent to 45 football fields) Around 2 000 employees Escalator plant, elevator plant,
training center, visitor center, head office of Schindler China, R&D center, and a 200 m test tower
LEED Silver and LEED Gold certifications
© Schindler | Annual Results Presentation 2016 Slide 8
R&D center
Escalator plantElevator plant
- Head office Schindler China
- Training center- Visitor center

Asia-Pacific: other marketsGood growth overall
Mixed market development India: demonetization and new regulations in the real estate sector
put pressure on demand in Q4 Southeast Asia: further growth, particularly in residential and infrastructure Middle East: historically low oil and gas prices led to reduced market levels Growing service markets due to conversion of new installations
Schindler performance India: muted development in new installations business due to challenging Q4 Southeast Asia: enhanced product portfolio resulting in good order growth Middle East: growing in a challenging environment Sustained growth in service and modernization
© Schindler | Annual Results Presentation 2016 Slide 9
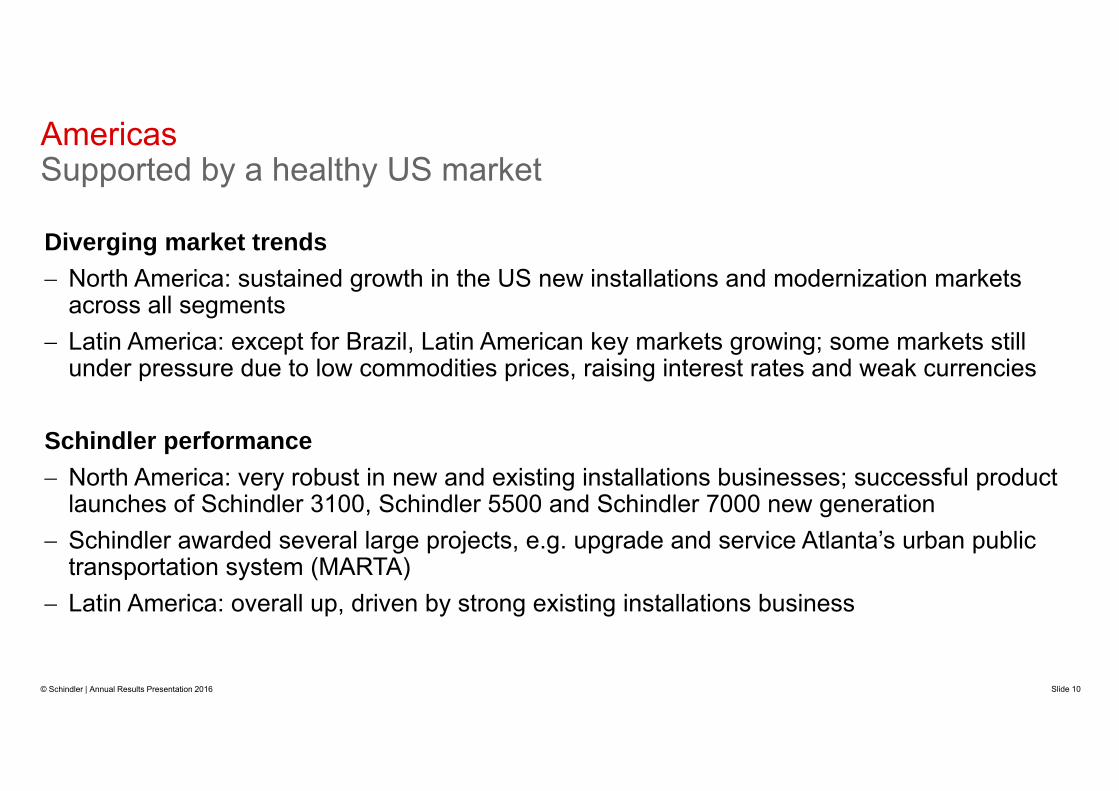
Diverging market trends North America: sustained growth in the US new installations and modernization markets
across all segments Latin America: except for Brazil, Latin American key markets growing; some markets still
under pressure due to low commodities prices, raising interest rates and weak currencies
Schindler performance North America: very robust in new and existing installations businesses; successful product
launches of Schindler 3100, Schindler 5500 and Schindler 7000 new generation Schindler awarded several large projects, e.g. upgrade and service Atlanta’s urban public
transportation system (MARTA) Latin America: overall up, driven by strong existing installations business
AmericasSupported by a healthy US market
© Schindler | Annual Results Presentation 2016 Slide 10

Opportunities in various markets Northern Europe: continued moderate growth Southern Europe: positive demand trend in most countries Russia and Turkey slowed overall growth Increasing modernization opportunities driven by ageing installed base in mature markets
Schindler performance Broad based growth, driven by a large number of countries Growing maintenance and modernization businesses Acquisition of FB Group will further strengthen position in Germany Acquisition of several smaller portfolios enhancing footprint and density
EuropeModest growth in European markets
© Schindler | Annual Results Presentation 2016 Slide 11

Annual results presentation 2016Agenda
Slide 12
Market development
Results 2016
Outlook 2017
Q&A
© Schindler | Annual Results Presentation 2016
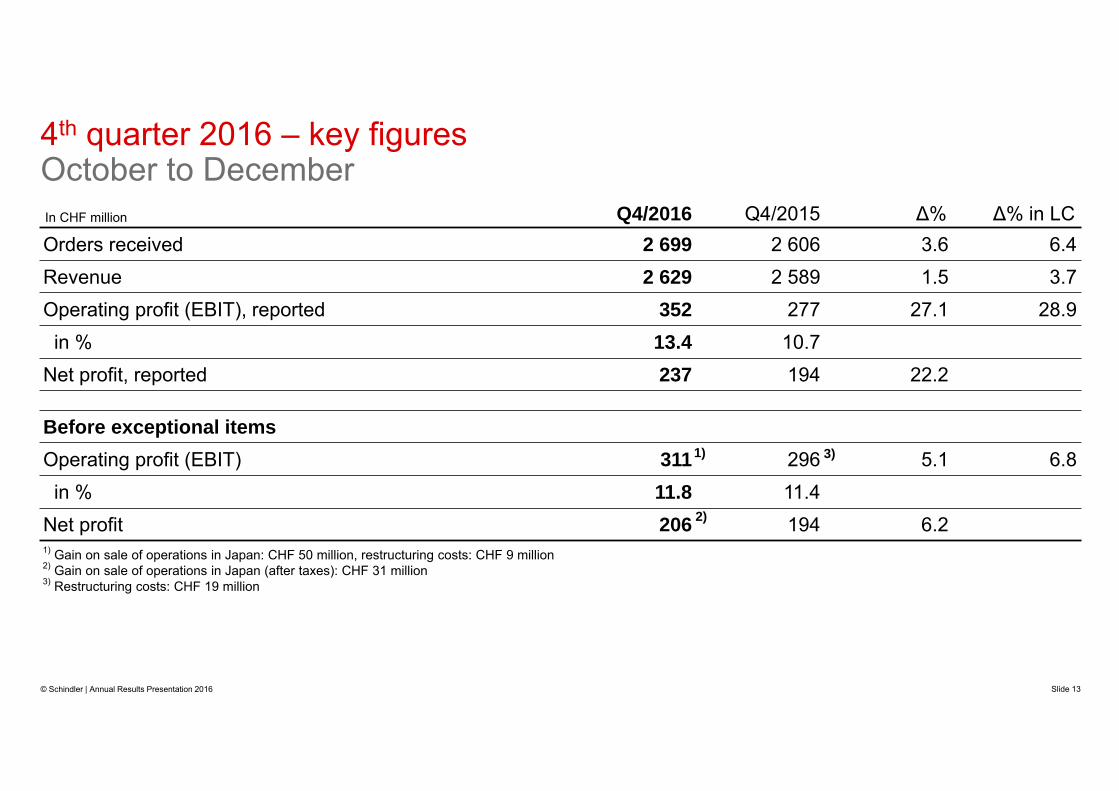
In CHF million Q4/2016 Q4/2015 ∆% ∆% in LCOrders received 2 699 2 606 3.6 6.4Revenue 2 629 2 589 1.5 3.7Operating profit (EBIT), reported 352 277 27.1 28.9in % 13.4 10.7
Net profit, reported 237 194 22.2
Before exceptional itemsOperating profit (EBIT) 311 296 5.1 6.8in % 11.8 11.4
Net profit 206 194 6.2
4th quarter 2016 – key figuresOctober to December
1) Gain on sale of operations in Japan: CHF 50 million, restructuring costs: CHF 9 million2) Gain on sale of operations in Japan (after taxes): CHF 31 million3) Restructuring costs: CHF 19 million
1) 3)
© Schindler | Annual Results Presentation 2016 Slide 13
2)
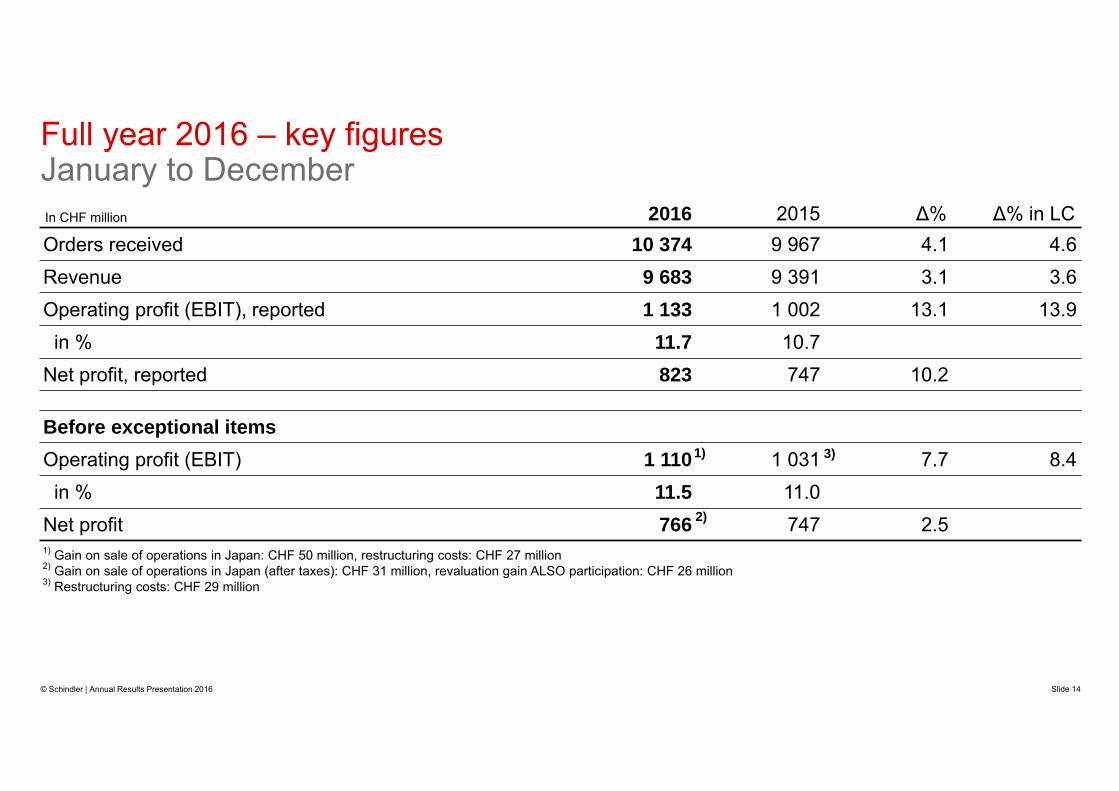
In CHF million 2016 2015 ∆% ∆% in LCOrders received 10 374 9 967 4.1 4.6Revenue 9 683 9 391 3.1 3.6Operating profit (EBIT), reported 1 133 1 002 13.1 13.9in % 11.7 10.7
Net profit, reported 823 747 10.2
Before exceptional itemsOperating profit (EBIT) 1 110 1 031 7.7 8.4in % 11.5 11.0
Net profit 766 747 2.5
Full year 2016 – key figuresJanuary to December
1) Gain on sale of operations in Japan: CHF 50 million, restructuring costs: CHF 27 million2) Gain on sale of operations in Japan (after taxes): CHF 31 million, revaluation gain ALSO participation: CHF 26 million3) Restructuring costs: CHF 29 million
2)
1) 3)
© Schindler | Annual Results Presentation 2016 Slide 14
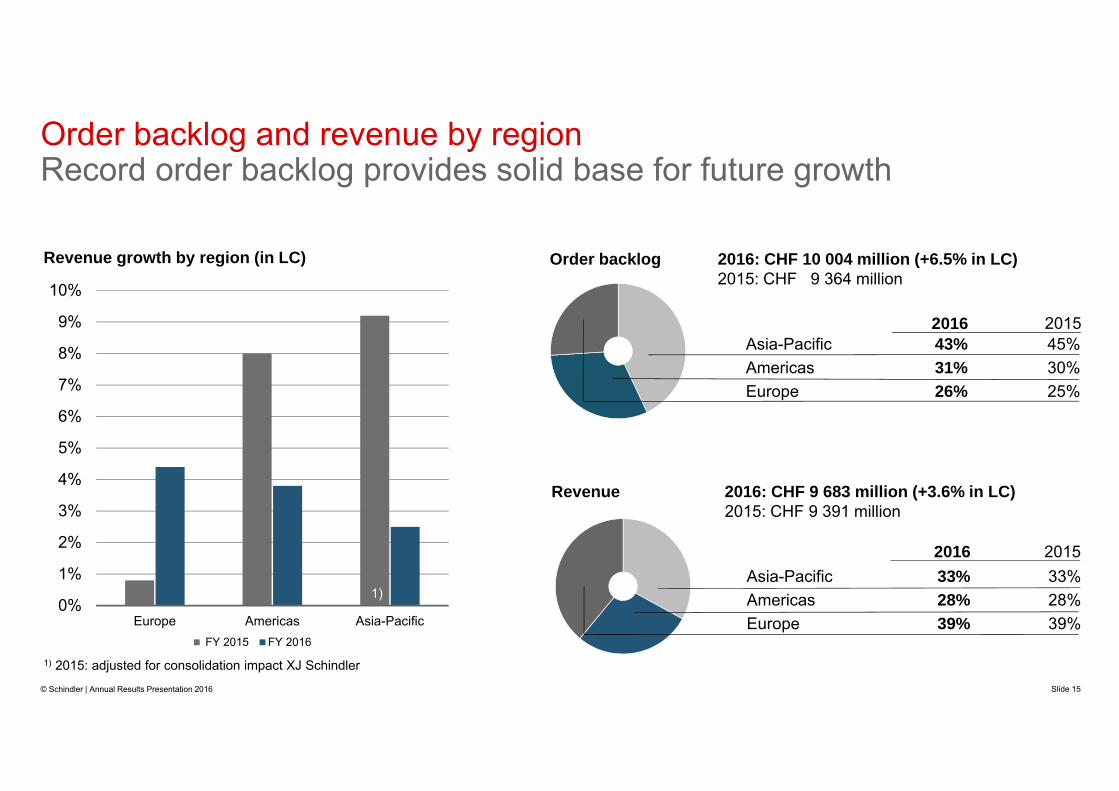
Order backlog and revenue by regionRecord order backlog provides solid base for future growth
Asia-Pacific 43% 45%Americas 31% 30%Europe 26% 25%
2016 2015
Order backlog 2016: CHF 10 004 million (+6.5% in LC)2015: CHF 9 364 million
Revenue 2016: CHF 9 683 million (+3.6% in LC)2015: CHF 9 391 million
Asia-Pacific 33% 33%Americas 28% 28%Europe 39% 39%
2016 2015
0%
1%
2%
3%
4%
5%
6%
7%
8%
9%
10%
Europe Americas Asia-Pacific FY 2015 FY 2016
Revenue growth by region (in LC)
Slide 15
1) 2015: adjusted for consolidation impact XJ Schindler
1)
© Schindler | Annual Results Presentation 2016

In CHF million 2016 2015 ∆% ∆% in LCCash flow from operating activities 929 1 076 –13.7Investments in property, plant, and equipment 189 183 3.3
31.12.2016 31.12.2015
Order backlog 10 004 9 364 6.8 6.5
Number of employees 58 271 56 762 2.7
Full year 2016 – key figures January to December
© Schindler | Annual Results Presentation 2016 Slide 16
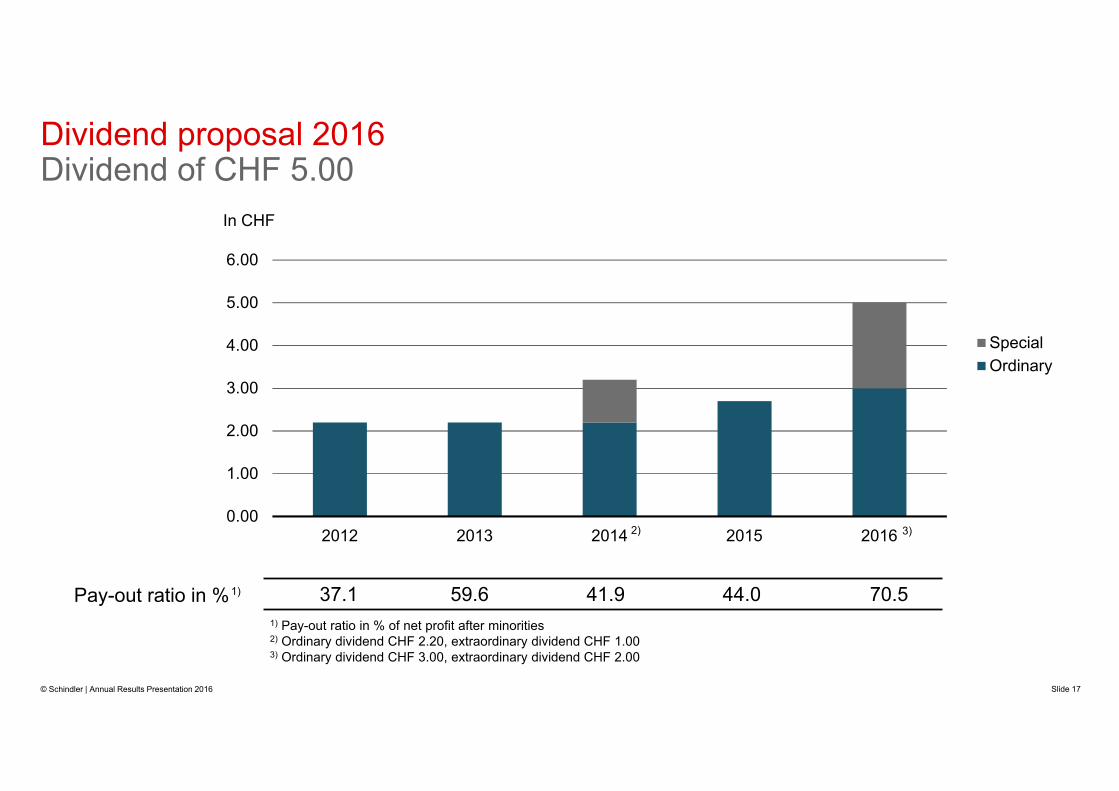
0.00
1.00
2.00
3.00
4.00
5.00
6.00
2012 2013 2014 2015 2016
SpecialOrdinary
Dividend proposal 2016Dividend of CHF 5.00
Slide 17
Pay-out ratio in % 37.1 59.6 41.9 44.0 70.5
In CHF
2)
1) Pay-out ratio in % of net profit after minorities2) Ordinary dividend CHF 2.20, extraordinary dividend CHF 1.003) Ordinary dividend CHF 3.00, extraordinary dividend CHF 2.00
© Schindler | Annual Results Presentation 2016
1)
3)

Annual results presentation 2016Agenda
Slide 18
Market development
Results 2016
Outlook 2017
Q&A
© Schindler | Annual Results Presentation 2016

4.05.1
2016 2030
Megatrends driving demand for Elevators and EscalatorsUrbanization and demographic change will support higher E&E demand
900
2016 2030
Persons aged 60 or above (in millions)
2.6
4.9
2016 2030
Global middle class(billion people)
330480
2016 2030
One-person households (in millions)
© Schindler | Annual Results Presentation 2016 Slide 19
Increasing density leads to more and taller buildings.
Urban population (billion people)
Sources: United Nations; Euromonitor International; Brookings
1400
Buildings are responsible for 40% of the global energy consumption
Increasing demand for energy efficient solutions
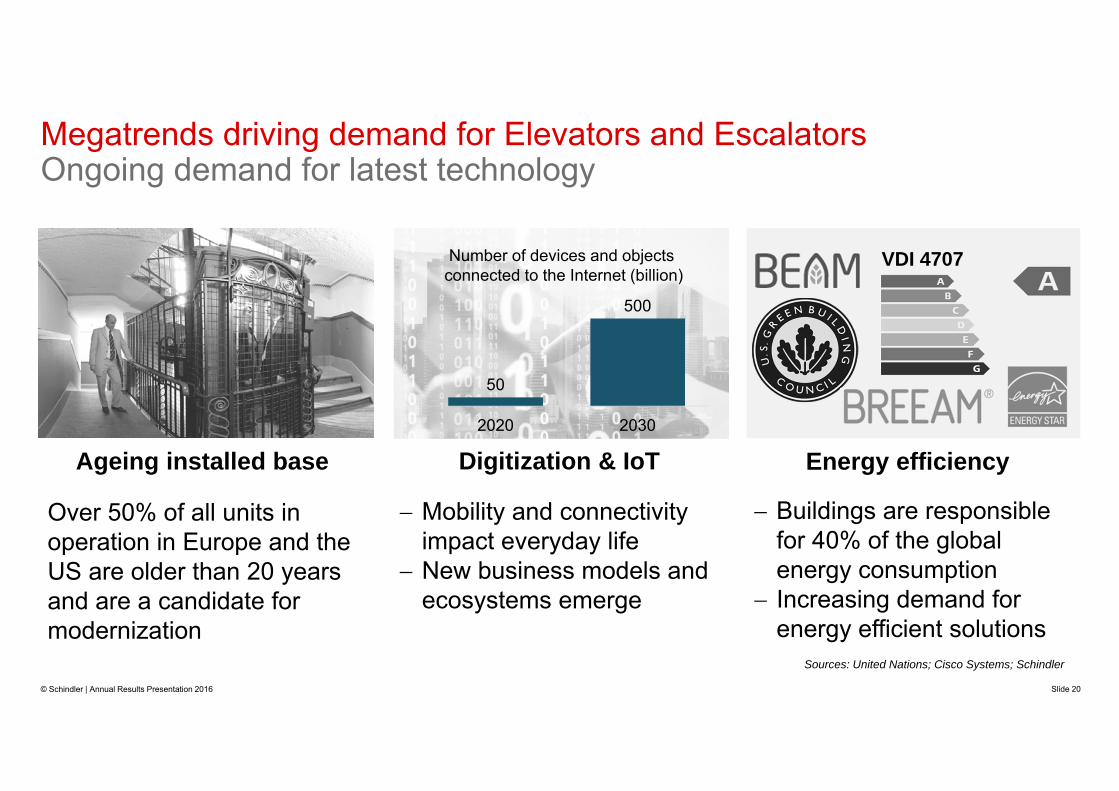
Megatrends driving demand for Elevators and EscalatorsOngoing demand for latest technology
Sources: United Nations; Cisco Systems; Schindler
Energy efficiency
Over 50% of all units in operation in Europe and the US are older than 20 years and are a candidate for modernization
Ageing installed base
Mobility and connectivity impact everyday life
New business models and ecosystems emerge
Digitization & IoT
VDI 4707
50
500
2020 2030
Number of devices and objects connected to the Internet (billion)
© Schindler | Annual Results Presentation 2016 Slide 20
© Schindler | Annual Results Presentation 2016 Slide 21
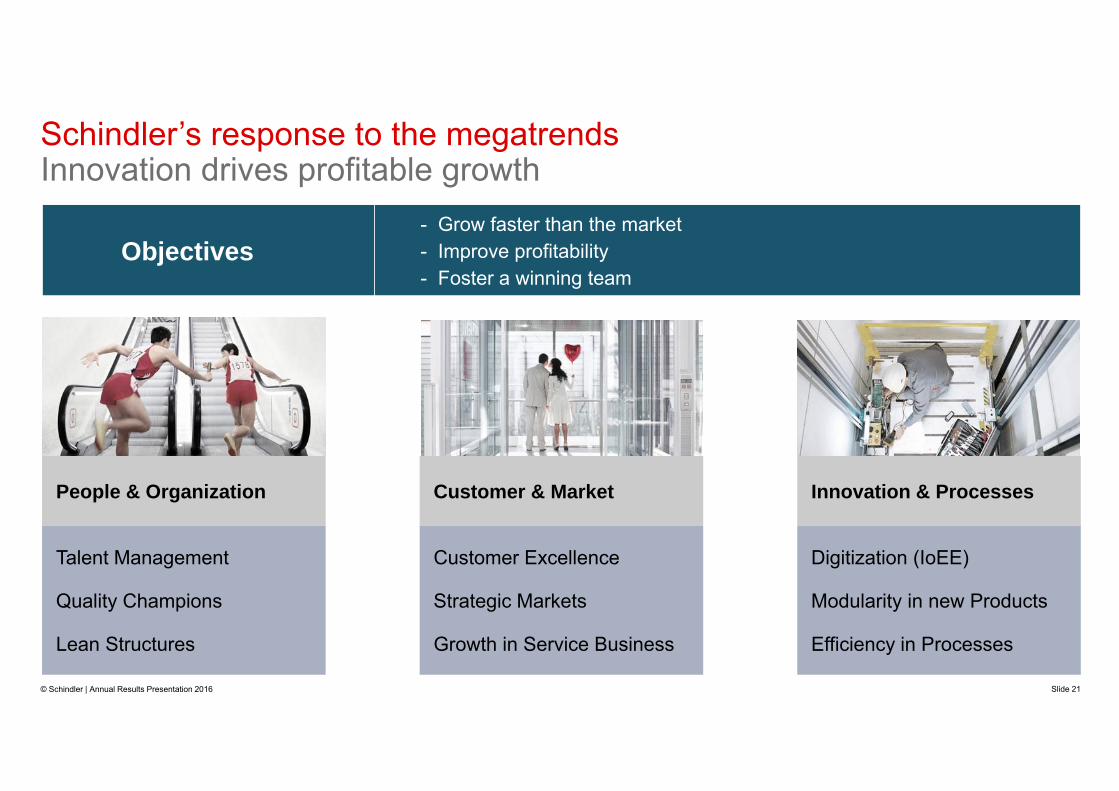
Schindler’s response to the megatrendsInnovation drives profitable growth
Objectives- Grow faster than the market- Improve profitability- Foster a winning team
People & Organization
Talent Management
Quality Champions
Lean Structures
Customer & Market
Customer Excellence
Strategic Markets
Growth in Service Business
Innovation & Processes
Digitization (IoEE)
Modularity in new Products
Efficiency in Processes

Outlook 2017Status as of February 15, 2017
© Schindler | Annual Results Presentation 2016 Slide 22
Long-term growth drivers remain intact
Economic conditions continue to be influenced by political and macroeconomic uncertainty
Global new installations market expected to be flat
Focus on profitable growth unchanged
Revenue expected to increase by 3% to 5% in local currencies
Net profit guidance for 2017 will be provided with the publication of half-year results
Business environment Schindler guidance
Annual results presentation 2016Agenda
Slide 23
Market development
Results 2016
Outlook 2017
Q&A
© Schindler | Annual Results Presentation 2016
The information in the presentation was factually accurate on the date of publication. It remains on our website for historical information purposes only. Schindler assumes no responsibility to update the information to reflect subsequent developments. Readers should not rely upon the information in this presentation as current or accurate after its publication date.
Copyright © Schindler. All rights reserved
Schindler owns and retains all copyrights and other intellectual property rights in this presentation. It may not be reproduced, modified or copied nor used for any commercial purposes (e.g. manufacturing), nor communicated to any third parties without our written consent.
Schindler undertakes all reasonable efforts to ensure that the information in this presentation is accurate, complete and derives from reliable sources. Schindler however, does not represent nor warrant (either expressly or implicitly) accuracy, reliability, timeliness or completeness of such information. Therefore, Schindler is not liable for any errors, consequence of acts or omissions based on the entirety or part of the information available in this presentation.
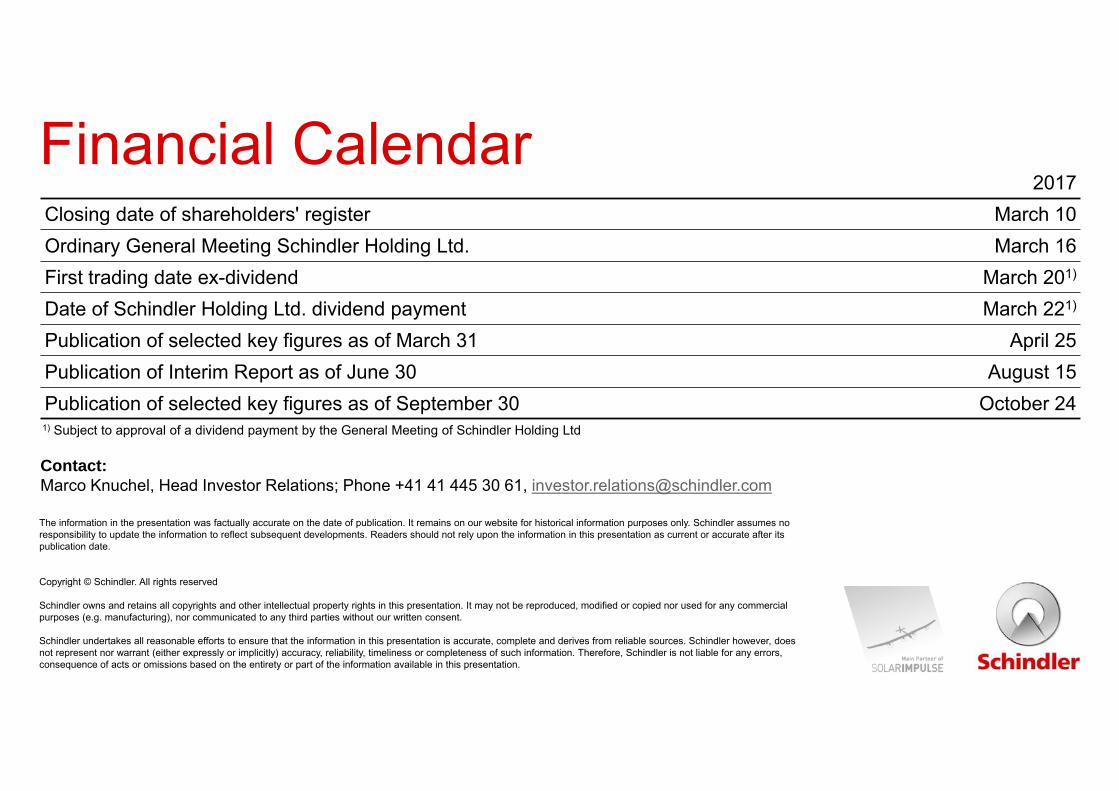
2017Closing date of shareholders' register March 10Ordinary General Meeting Schindler Holding Ltd. March 16First trading date ex-dividend March 201)
Date of Schindler Holding Ltd. dividend payment March 221)
Publication of selected key figures as of March 31 April 25Publication of Interim Report as of June 30 August 15Publication of selected key figures as of September 30 October 24
Financial Calendar
Contact: Marco Knuchel, Head Investor Relations; Phone +41 41 445 30 61, [email protected]
1) Subject to approval of a dividend payment by the General Meeting of Schindler Holding Ltd

Additional Charts
© Schindler | Annual Results Presentation 2016 Slide 25

Source: National Bureau of Statistics of China, January 2017
Floor space started in China Opportunities
China on track to reach 60% target urbanization rate by 2020 $500bn to be invested in high-speed railway over next four years Floor space started grew 11.7% in Q4 and 8.1% in the full year Real estate investment growth reaccelerating Housing inventories in bigger cities have normalized Looming wave of consolidation in real estate sector
Risks
Increasing corporate debt Measures introduced in 20+ cities with cooling effect on the real
estate market Restricted mortgage approval Home prices dropped 8% in Q4 vs Q3 – but still 8% higher y-o-y
Floor space sold in China
China construction dataUpward trend sustained throughout the year
-18.4%
-14.3%-7.7%
-17.7%
19.2%
12.6%
-4.7%
11.7%
-30%-20%-10%0%10%20%30%
0100200300400500600
Q1'15 Q2'15 Q3'15 Q4'15 Q1'16 Q2'16 Q3'16 Q4'16
Floor space started (million sqm) Change (y-o-y)
-9.2%
13.3% 13.5%
4.8%
33.1%25.0% 25.2%
14.4%
-20%-10%0%10%20%30%40%
0100200300400500600
Q1'15 Q2'15 Q3'15 Q4'15 Q1'16 Q2'16 Q3'16 Q4'16
Floor space sold (million sqm) Change (y-o-y)
© Schindler | Annual Results Presentation 2016 Slide 26

0
50
100
150
200
250
300
350
0
5
10
15
20
25
China: inventories at healthy levels in large cities Improvement due to increased apartment sales
Source: Yiju, 2017, based on data in square meters for 63 cities until November 2016
Housing inventory, by city tier (months of sales)Housing inventory, by city tier (2010 = 100)
2010 2011 2012 2013 2014 2015
Tier 1
Tier 2
Tier 3
Tier 1
Tier 2Tier 3
2016 2010 2011 2012 2013 2014 2015 2016
© Schindler | Annual Results Presentation 2016 Slide 27
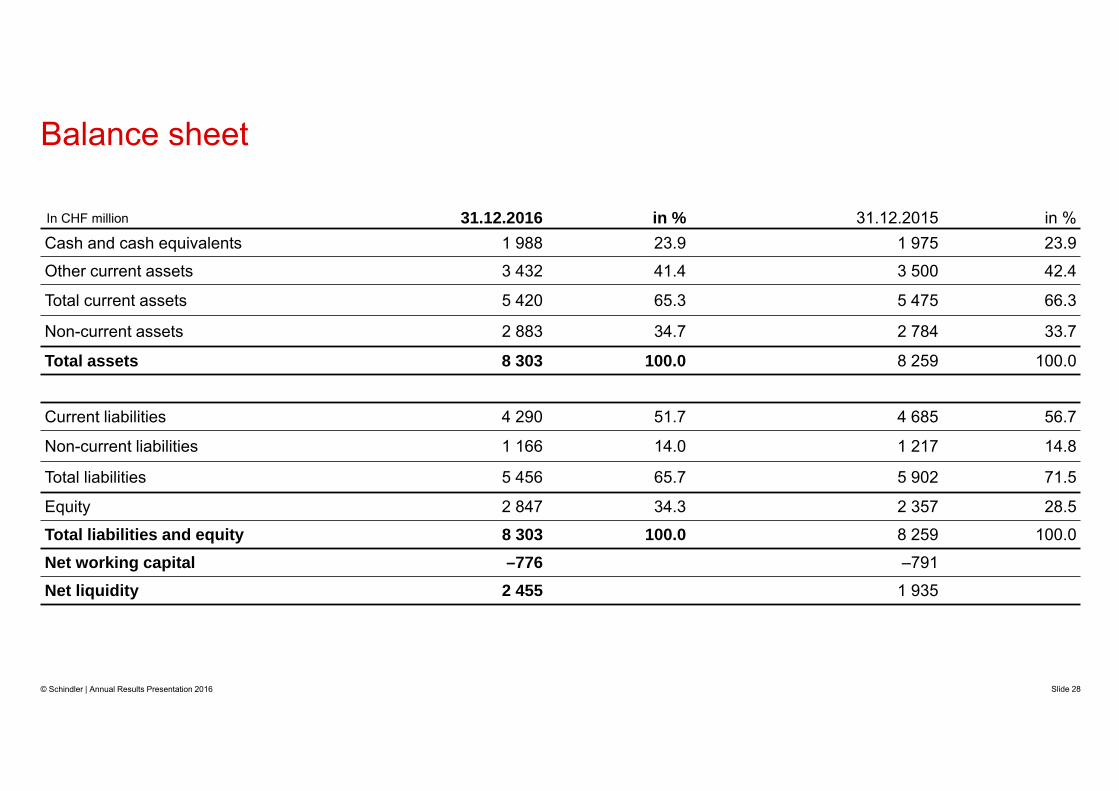
In CHF million 31.12.2016 in % 31.12.2015 in %Cash and cash equivalents 1 988 23.9 1 975 23.9
Other current assets 3 432 41.4 3 500 42.4
Total current assets 5 420 65.3 5 475 66.3
Non-current assets 2 883 34.7 2 784 33.7
Total assets 8 303 100.0 8 259 100.0
Current liabilities 4 290 51.7 4 685 56.7
Non-current liabilities 1 166 14.0 1 217 14.8
Total liabilities 5 456 65.7 5 902 71.5
Equity 2 847 34.3 2 357 28.5
Total liabilities and equity 8 303 100.0 8 259 100.0
Net working capital –776 –791
Net liquidity 2 455 1 935
Balance sheet
© Schindler | Annual Results Presentation 2016 Slide 28
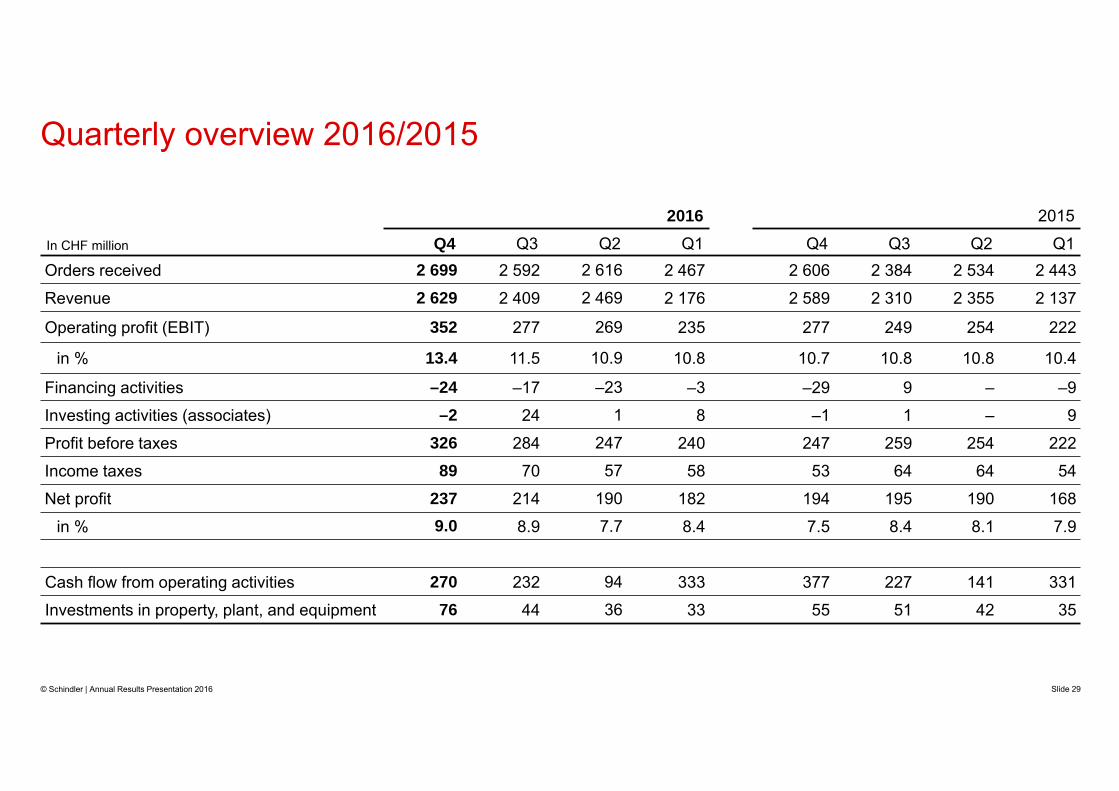
2016 2015
In CHF million Q4 Q3 Q2 Q1 Q4 Q3 Q2 Q1Orders received 2 699 2 592 2 616 2 467 2 606 2 384 2 534 2 443
Revenue 2 629 2 409 2 469 2 176 2 589 2 310 2 355 2 137
Operating profit (EBIT) 352 277 269 235 277 249 254 222
in % 13.4 11.5 10.9 10.8 10.7 10.8 10.8 10.4
Financing activities –24 –17 –23 –3 –29 9 – –9
Investing activities (associates) –2 24 1 8 –1 1 – 9
Profit before taxes 326 284 247 240 247 259 254 222
Income taxes 89 70 57 58 53 64 64 54
Net profit 237 214 190 182 194 195 190 168
in % 9.0 8.9 7.7 8.4 7.5 8.4 8.1 7.9
Cash flow from operating activities 270 232 94 333 377 227 141 331
Investments in property, plant, and equipment 76 44 36 33 55 51 42 35
Quarterly overview 2016/2015
© Schindler | Annual Results Presentation 2016 Slide 29

In CHF million 2016 2015Interest income net 11 9Net income from securities 10 26Net interest on employee benefits, increase in the present value of provisions –21 –21Net losses on foreign exchange –32 –1Revaluation/exchange of 0.375% exchangeable bond 2013 – 2017 –6 –22Other financial expenses –29 –20Total financing activities –67 –29
Financing and investing activitiesCurrency headwinds
© Schindler | Annual Results Presentation 2016 Slide 30
ALSO Revaluation 26 –Others 5 9Total investing activities 31 9

Background 0.375% exchangeable bond 2013 – 2017 (maturity date June 5, 2017) Initial nominal value CHF 218 million Bond can be exchanged into ALSO shares Exchange price ALSO shares CHF 60.24
ALSO exchangeable bondSchindler’s participation at 7.6% as of December 31, 2016
December 31, 2016 December 31, 2015Nominal value bond CHF 59 million CHF 216 millionMarket value bond 148% 114%Carrying amount bond CHF 87 million CHF 246 millionParticipation in ALSO 7.6% 27.9%
© Schindler | Annual Results Presentation 2016 Slide 31
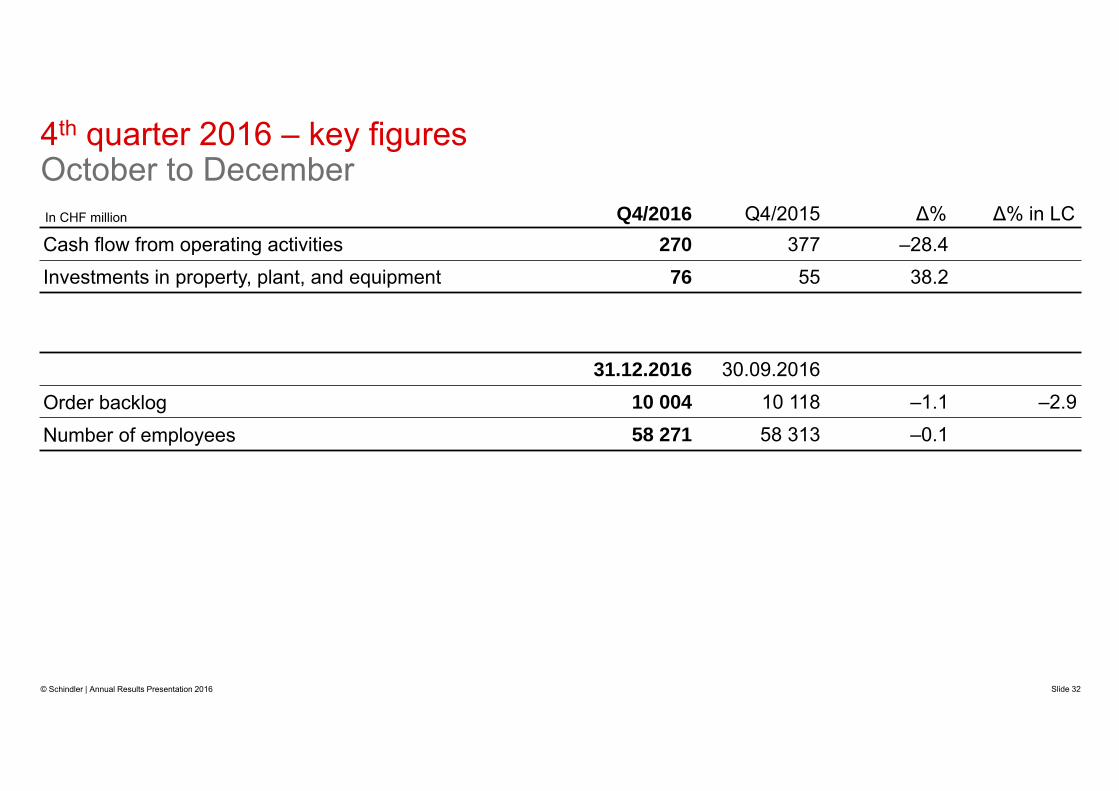
In CHF million Q4/2016 Q4/2015 ∆% ∆% in LCCash flow from operating activities 270 377 –28.4Investments in property, plant, and equipment 76 55 38.2
31.12.2016 30.09.2016
Order backlog 10 004 10 118 –1.1 –2.9
Number of employees 58 271 58 313 –0.1
4th quarter 2016 – key figuresOctober to December
© Schindler | Annual Results Presentation 2016 Slide 32

0
500
1 000
1 500
2 000
2 500
3 000
Q1 Q2 Q3 Q4
2013201420152016
Quarterly development of orders received 2013 – 2016
In CHF million
© Schindler | Annual Results Presentation 2016 Slide 33

0
500
1 000
1 500
2 000
2 500
3 000
Q1 Q2 Q3 Q4
2013201420152016
In CHF million
Quarterly development of revenue 2013 – 2016
© Schindler | Annual Results Presentation 2016 Slide 34