Embed Size (px)
Citation preview
2015.04.02.
1
Scheduling II.
Construction management 2. Adrienn Lepel – BME Department of Construction Technology and Management
01.04.2015.
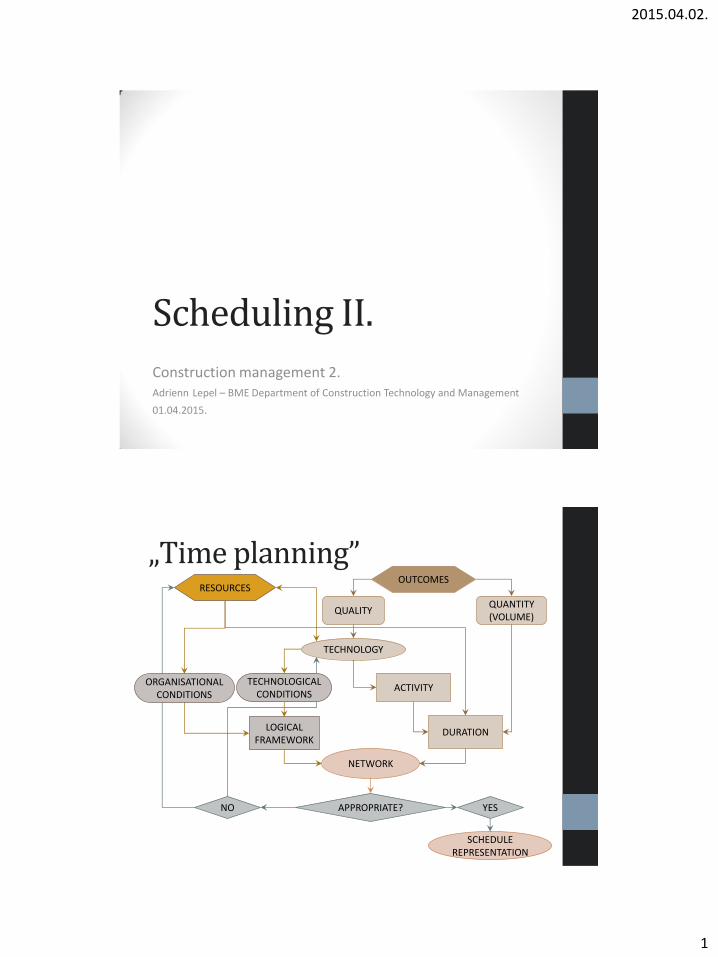
„Time planning”
LOGICAL FRAMEWORK
DURATION
OUTCOMES
QUANTITY (VOLUME)
NETWORK
APPROPRIATE?
SCHEDULE REPRESENTATION
TECHNOLOGY
RESOURCES
YES NO
ACTIVITY
QUALITY
TECHNOLOGICAL CONDITIONS
ORGANISATIONAL CONDITIONS
2015.04.02.
2
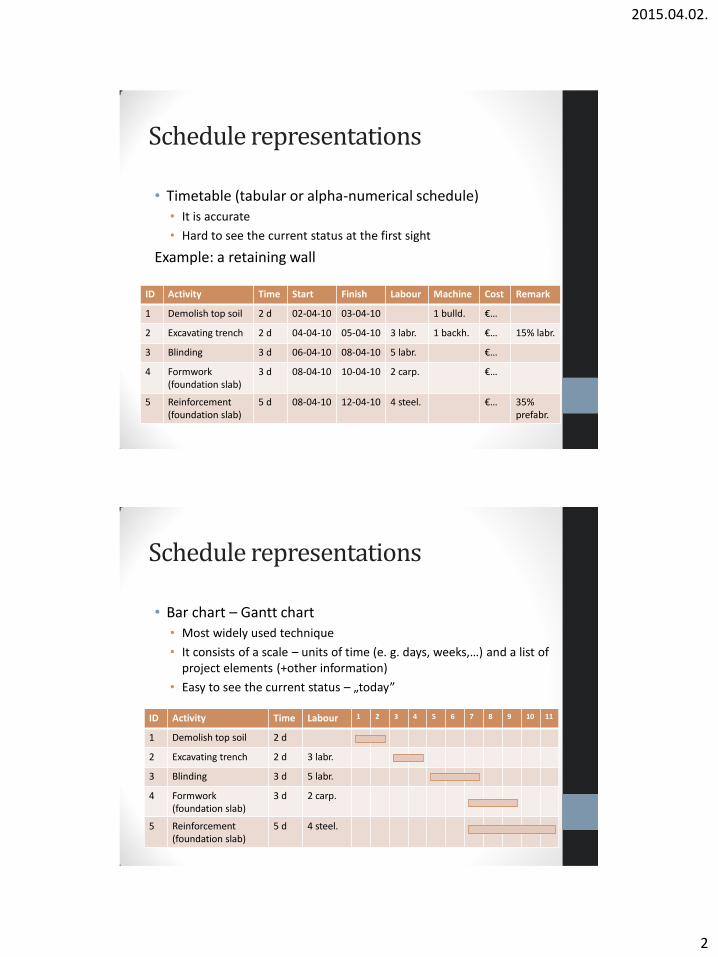
Schedule representations
• Timetable (tabular or alpha-numerical schedule) • It is accurate
• Hard to see the current status at the first sight
Example: a retaining wall
ID Activity Time Start Finish Labour Machine Cost Remark
1 Demolish top soil 2 d 02-04-10 03-04-10 1 bulld. €…
2 Excavating trench 2 d 04-04-10 05-04-10 3 labr. 1 backh. €… 15% labr.
3 Blinding 3 d 06-04-10 08-04-10 5 labr. €…
4 Formwork (foundation slab)
3 d 08-04-10 10-04-10 2 carp. €…
5 Reinforcement (foundation slab)
5 d 08-04-10 12-04-10 4 steel. €… 35% prefabr.
Schedule representations
• Bar chart – Gantt chart • Most widely used technique
• It consists of a scale – units of time (e. g. days, weeks,…) and a list of project elements (+other information)
• Easy to see the current status – „today”
ID Activity Time Labour 1 2 3 4 5 6 7 8 9 10 11
1 Demolish top soil 2 d
2 Excavating trench 2 d 3 labr.
3 Blinding 3 d 5 labr.
4 Formwork (foundation slab)
3 d 2 carp.
5 Reinforcement (foundation slab)
5 d 4 steel.
2015.04.02.
3
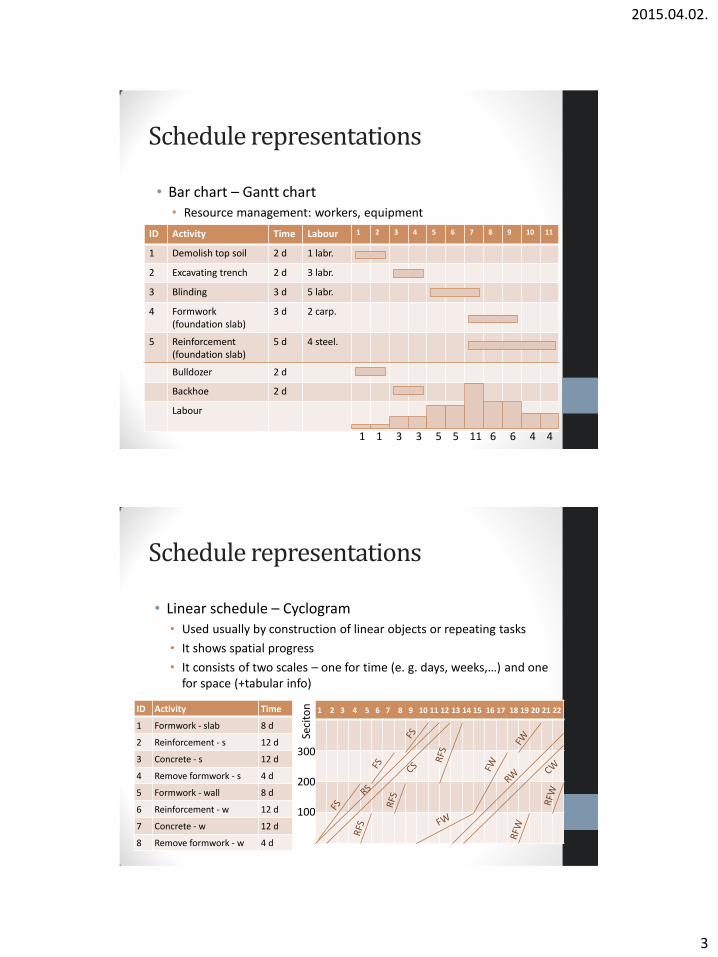
Schedule representations
• Bar chart – Gantt chart • Resource management: workers, equipment
ID Activity Time Labour 1 2 3 4 5 6 7 8 9 10 11
1 Demolish top soil 2 d 1 labr.
2 Excavating trench 2 d 3 labr.
3 Blinding 3 d 5 labr.
4 Formwork (foundation slab)
3 d 2 carp.
5 Reinforcement (foundation slab)
5 d 4 steel.
Bulldozer 2 d
Backhoe 2 d
Labour
1 1 3 3 5 5 11 6 6 4 4
Schedule representations
• Linear schedule – Cyclogram • Used usually by construction of linear objects or repeating tasks
• It shows spatial progress
• It consists of two scales – one for time (e. g. days, weeks,…) and one for space (+tabular info)
ID Activity Time
1 Formwork - slab 8 d
2 Reinforcement - s 12 d
3 Concrete - s 12 d
4 Remove formwork - s 4 d
5 Formwork - wall 8 d
6 Reinforcement - w 12 d
7 Concrete - w 12 d
8 Remove formwork - w 4 d
1 2 3 4 5 6 7 8 9 10 11 12 13 14 15 16 17 18 19 20 21 22
100
200
300
Seci
ton
2015.04.02.
4
Schedule representations
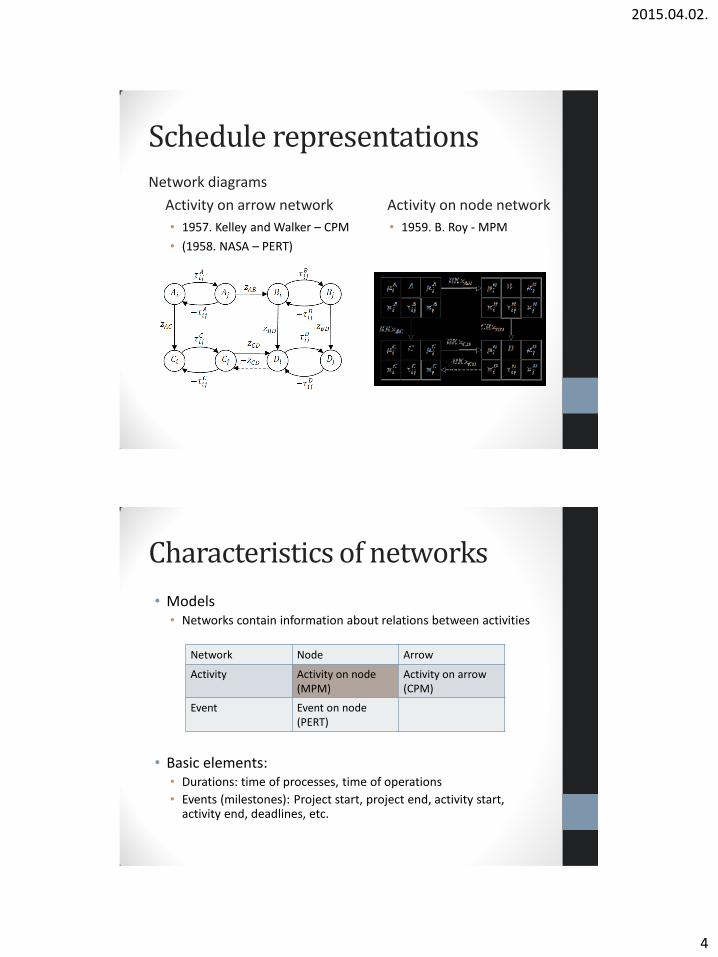
Network diagrams
Activity on arrow network
• 1957. Kelley and Walker – CPM
• (1958. NASA – PERT)
Activity on node network
• 1959. B. Roy - MPM
• Models • Networks contain information about relations between activities
• Basic elements: • Durations: time of processes, time of operations
• Events (milestones): Project start, project end, activity start, activity end, deadlines, etc.
Network Node Arrow
Activity Activity on node (MPM)
Activity on arrow (CPM)
Event Event on node (PERT)
Characteristics of networks
2015.04.02.
5
Characteristics of networks
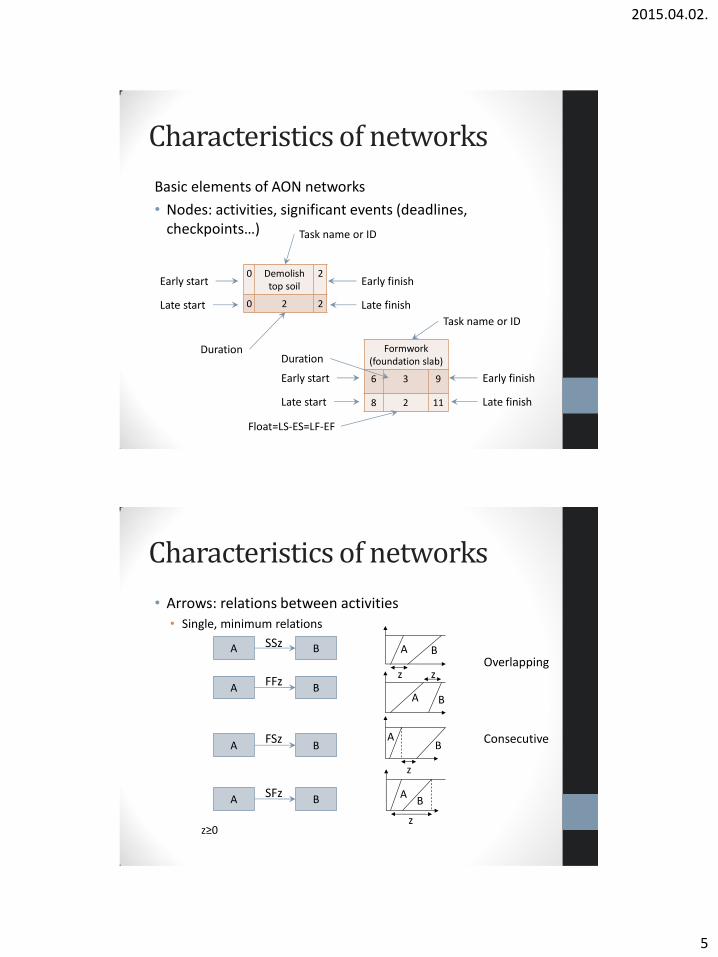
Basic elements of AON networks
• Nodes: activities, significant events (deadlines, checkpoints…)
0 Demolish
top soil 2
0 2 2
Early start
Late start
Early finish
Late finish
Task name or ID
Duration
Early start
Late start
Early finish
Late finish
Task name or ID
Duration Formwork
(foundation slab)
6 3 9
8 2 11
Float=LS-ES=LF-EF
• Arrows: relations between activities • Single, minimum relations
SSz
Overlapping
FFz
FSz Consecutive
SFz
z≥0
A B
A B
A B
A B
A B
z z
A B
A B
z
A B
z
Characteristics of networks
2015.04.02.
6
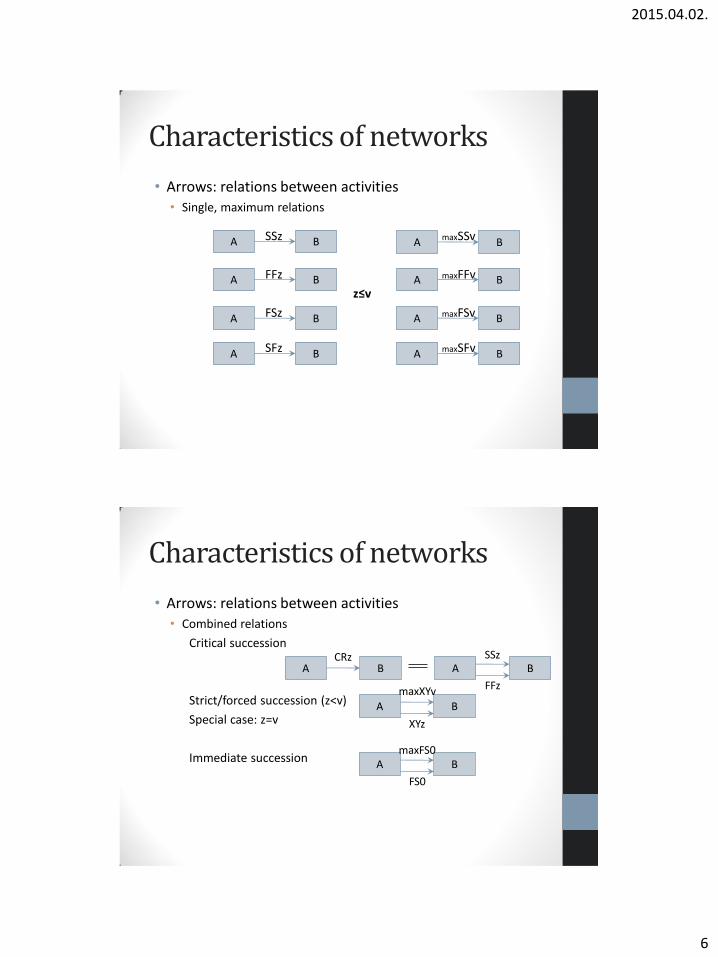
• Arrows: relations between activities • Single, maximum relations
SSz maxSSv
FFz maxFFv
z≤v
FSz maxFSv
SFz maxSFv
A B
A B
A B
A B
A B
A B
A B
A B
Characteristics of networks
Characteristics of networks
• Arrows: relations between activities • Combined relations
Critical succession
Strict/forced succession (z<v)
Special case: z=v
Immediate succession
A B A B
A B
A B
CRz
maxXYv
XYz
SSz
FFz
maxFS0
FS0
2015.04.02.
7
Characteristics of networks
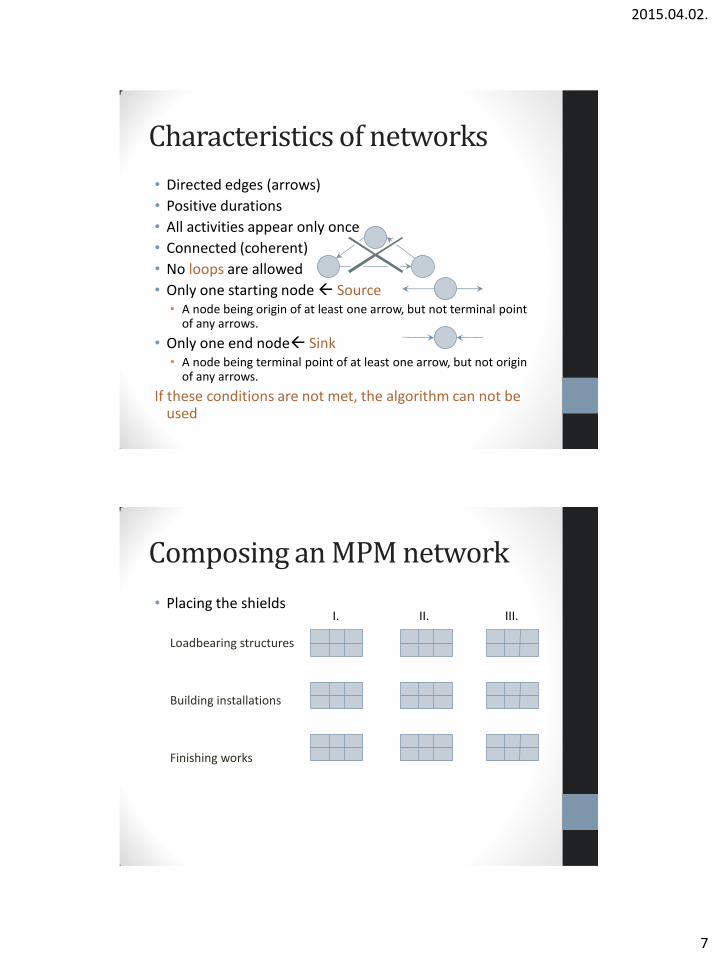
• Directed edges (arrows)
• Positive durations
• All activities appear only once
• Connected (coherent)
• No loops are allowed
• Only one starting node Source • A node being origin of at least one arrow, but not terminal point
of any arrows.
• Only one end node Sink • A node being terminal point of at least one arrow, but not origin
of any arrows.
If these conditions are not met, the algorithm can not be used
Composing an MPM network
• Placing the shields
Loadbearing structures
Building installations
Finishing works
III. II. I.
2015.04.02.
8
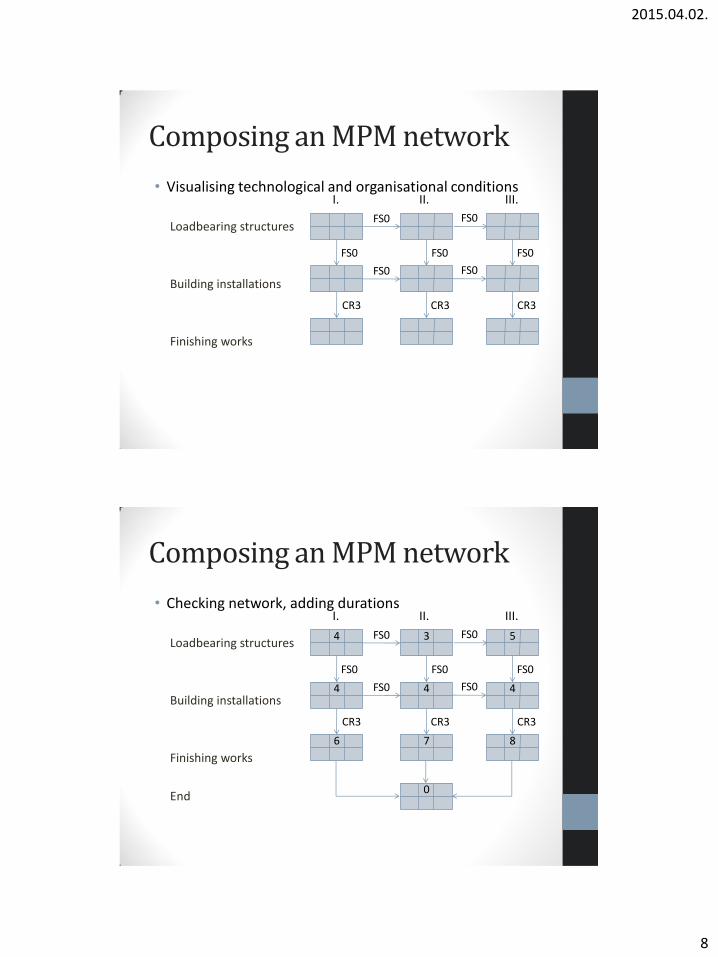
Composing an MPM network
• Visualising technological and organisational conditions
Loadbearing structures
Building installations
Finishing works
FS0
CR3 CR3 CR3
FS0 FS0
FS0 FS0
FS0 FS0
III. II. I.
Composing an MPM network
4
3
5
4
4
4
6
7
8
0
• Checking network, adding durations
Loadbearing structures
Building installations
Finishing works
End
FS0
CR3 CR3 CR3
FS0 FS0
FS0 FS0
FS0 FS0
III. II. I.
2015.04.02.
9
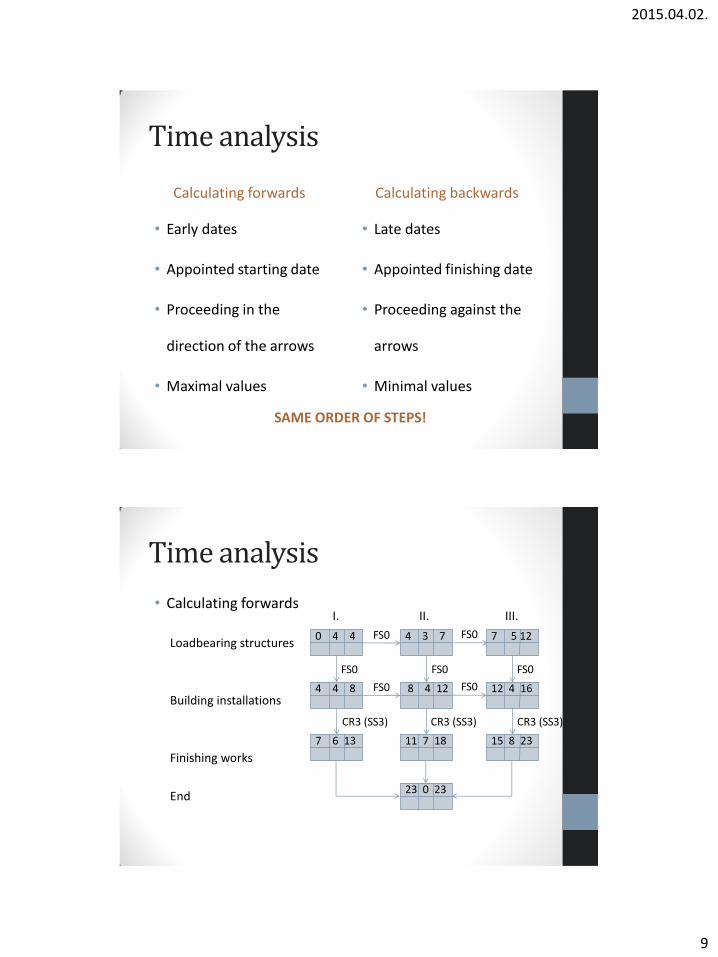
Time analysis
Calculating forwards
• Early dates
• Appointed starting date
• Proceeding in the
direction of the arrows
• Maximal values
Calculating backwards
• Late dates
• Appointed finishing date
• Proceeding against the
arrows
• Minimal values
SAME ORDER OF STEPS!
Time analysis
• Calculating forwards
Loadbearing structures
Building installations
Finishing works
End
0 4 4
4 3 7
7 5 12
4 4 8
8 4 12
12 4 16
7 6 13
11 7 18
15 8 23
23 0 23
FS0
CR3 (SS3) CR3 (SS3) CR3 (SS3)
FS0 FS0
FS0 FS0
FS0 FS0
III. II. I.
2015.04.02.
10
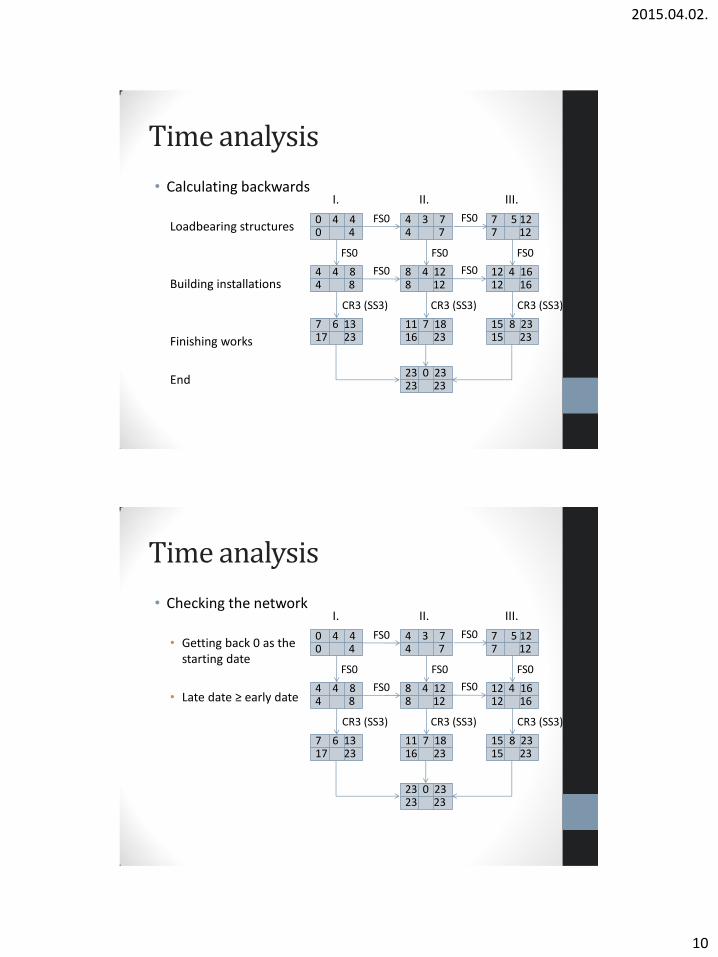
Time analysis
• Calculating backwards
Loadbearing structures
Building installations
Finishing works
End
0 4 4 0 4
4 3 7 4 7
7 5 12 7 12
4 4 8 4 8
8 4 12 8 12
12 4 16 12 16
7 6 13 17 23
11 7 18 16 23
15 8 23 15 23
23 0 23 23 23
FS0
CR3 (SS3) CR3 (SS3) CR3 (SS3)
FS0 FS0
FS0 FS0
FS0 FS0
III. II. I.
Time analysis
• Checking the network
• Getting back 0 as the starting date
• Late date ≥ early date
0 4 4 0 4
4 3 7 4 7
7 5 12 7 12
4 4 8 4 8
8 4 12 8 12
12 4 16 12 16
7 6 13 17 23
11 7 18 16 23
15 8 23 15 23
23 0 23 23 23
FS0
CR3 (SS3) CR3 (SS3) CR3 (SS3)
FS0 FS0
FS0 FS0
FS0 FS0
III. II. I.
2015.04.02.
11
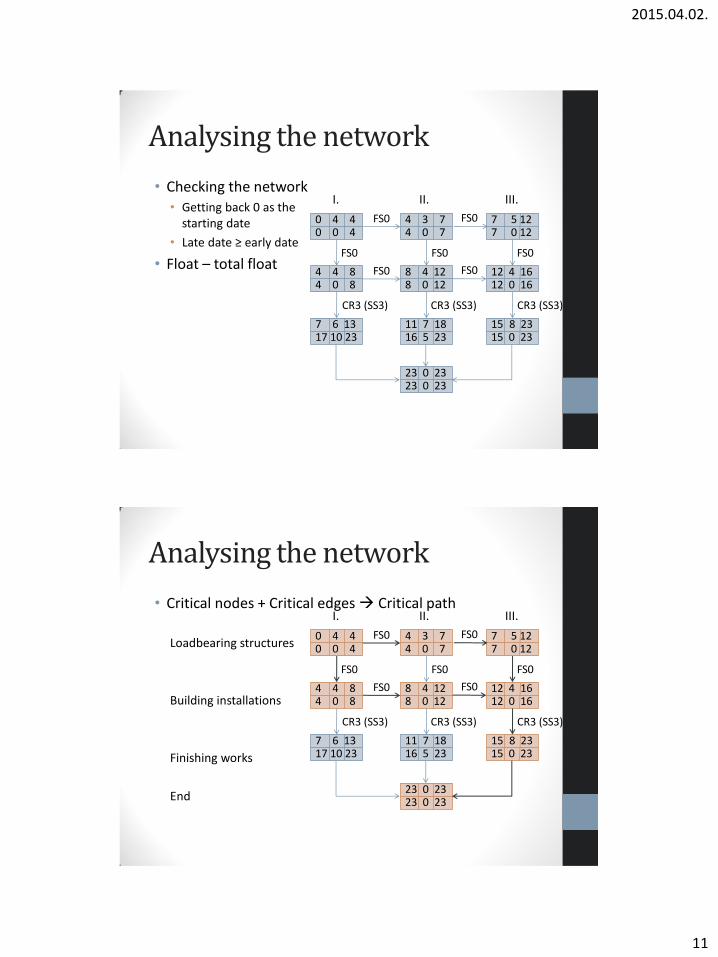
Analysing the network
• Checking the network • Getting back 0 as the
starting date
• Late date ≥ early date
• Float – total float
0 4 4 0 0 4
4 3 7 4 0 7
7 5 12 7 0 12
4 4 8 4 0 8
8 4 12 8 0 12
12 4 16 12 0 16
7 6 13 17 10 23
11 7 18 16 5 23
15 8 23 15 0 23
23 0 23 23 0 23
FS0
CR3 (SS3) CR3 (SS3) CR3 (SS3)
FS0 FS0
FS0 FS0
FS0 FS0
III. II. I.
Analysing the network
• Critical nodes + Critical edges Critical path
Loadbearing structures
Building installations
Finishing works
End
0 4 4 0 0 4
4 3 7 4 0 7
7 5 12 7 0 12
4 4 8 4 0 8
8 4 12 8 0 12
12 4 16 12 0 16
7 6 13 17 10 23
11 7 18 16 5 23
15 8 23 15 0 23
23 0 23 23 0 23
FS0
CR3 (SS3) CR3 (SS3) CR3 (SS3)
FS0 FS0
FS0 FS0
FS0 FS0
III. II. I.
2015.04.02.
12
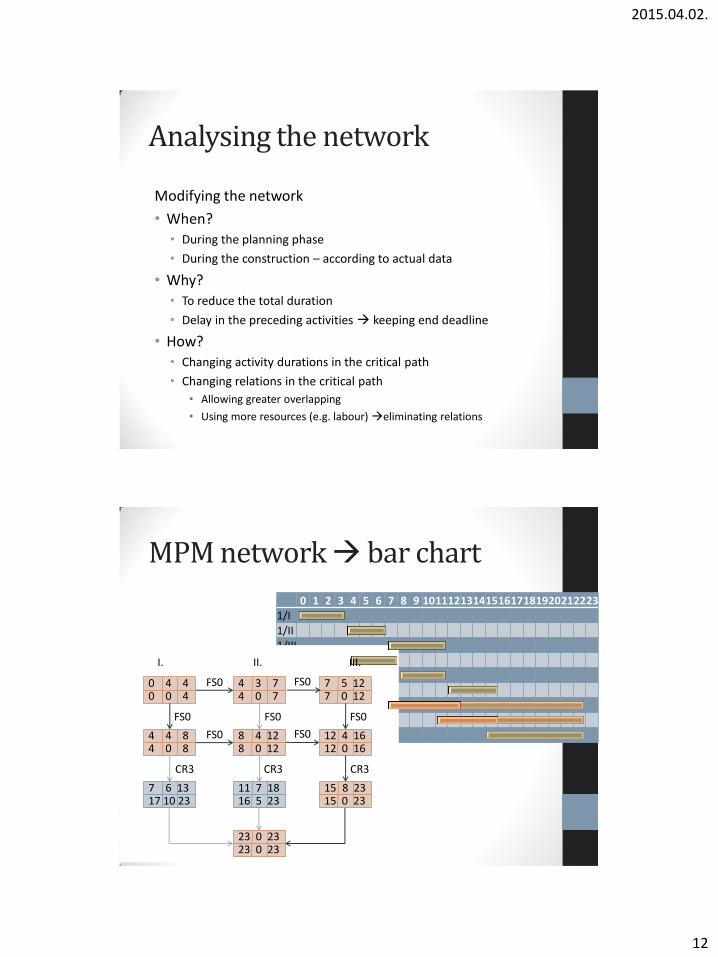
Analysing the network
Modifying the network
• When? • During the planning phase
• During the construction – according to actual data
• Why? • To reduce the total duration
• Delay in the preceding activities keeping end deadline
• How? • Changing activity durations in the critical path
• Changing relations in the critical path
• Allowing greater overlapping
• Using more resources (e.g. labour) eliminating relations
0 1 2 3 4 5 6 7 8 9 10 11 12 13 14 15 16 17 18 19 20 21 22 23
1/I 1/II
1/III 2/I
2/II 2/III
3/I
3/II 3/III
MPM network bar chart
0 4 4 0 0 4
4 3 7 4 0 7
7 5 12 7 0 12
4 4 8 4 0 8
8 4 12 8 0 12
12 4 16 12 0 16
7 6 13 17 10 23
11 7 18 16 5 23
15 8 23 15 0 23
23 0 23 23 0 23
I. II. III.
FS0
CR3 CR3 CR3
FS0 FS0
FS0 FS0
FS0 FS0
2015.04.02.
13
References
• Lepel Adrienn – Basics of construction – Basics of scheduling http://www.ekt.bme.hu/ArchEng/Basics%20of%20scheduling.pdf
• Dr. Vattai Zoltán – Construction management – decision support, Network techniques I-II http://www.ekt.bme.hu/CM-BSC-MSC/CM-BSC-MSC.htm
• http://en.wikipedia.org/wiki/Work_breakdown_structure
• http://en.wikipedia.org/wiki/Project_network
• http://en.wikipedia.org/wiki/PERT
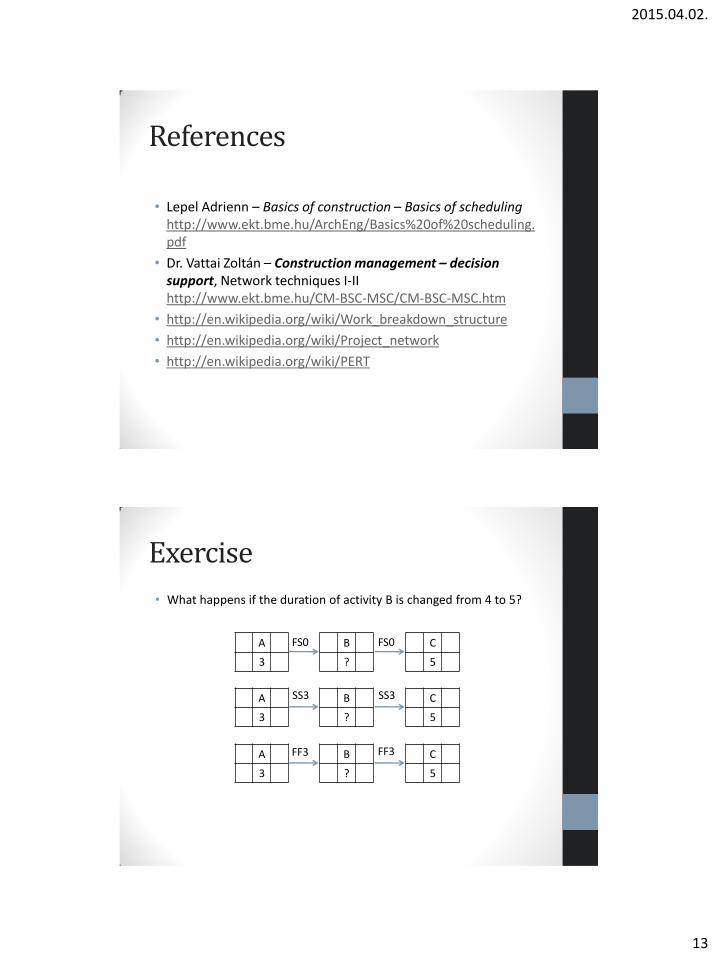
Exercise
• What happens if the duration of activity B is changed from 4 to 5?
A
3
FS0 FS0 B
?
C
5
A
3
B
?
C
5
A
3
B
?
C
5
SS3 SS3
FF3 FF3