Embed Size (px)
Citation preview
Schaffer Corporation Lim
ited
11A N N UA L R E P O RT
www.mindfield.com.au
SC-1-13805
20
11
AN
NU
AL
RE
PO
RT
Schaffer Corporation Limited
Final 2011 dividend record date 09 Sep 11
Final 2011 dividend payment date 23 Sep 11
Despatch of 2011 Annual Report and notice of AGM 12 Oct 11
Annual General Meeting 16 Nov 11
2012 half-year earnings release and dividend announcement Feb 12
Interim 2012 dividend payment date Mar 12
C O R P O R AT E T I M E TA B L E
Annual General Meeting
Schaffer Corporation will hold its Annual General Meeting on Wednesday 16 November 2011 at 11.30am at Pagoda Broadwater Hotel, 112 Melville Parade, Como, Western Australia.
Direct Credit of Dividends
Schaffer Corporation provides shareholders with the option to have dividends paid electronically to a nominated bank, building society or credit union account. Payments are credited electronically on the dividend date and confirmed by a payment advice by mail.
The Company encourages shareholders not already using this facility to contact Computershare Investor Services Pty. Limited, who can arrange for an instruction advice to be sent to shareholders for completion.
Change of Address/provide or update banking details
Shareholders who have changed their address or banking particulars should advise our share registry of their new details:
Computershare Investor Services Pty. LimitedGPO Box D182 Perth WA 6840
Telephone: 1300 557 010Website: www-au.computershare.com
Corporate Directory
Schaffer Corporation LimitedABN 73 008 675 689
The Board of Directors
Executive DirectorsJM Schaffer BCom(Hons), FCPA(Chairman and Managing Director)AK Mayer (Executive Chairman – Howe Automotive Ltd)
Non-Executive DirectorsDE Blain BAMD Perrott AM, BCom, FAIMDJ Schwartz
Group Financial Controller and Company SecretaryJason Cantwell B Bus(Acc), CPA, MBA, CSA(Cert)
Head Office and Registered Office1305 Hay StreetWest Perth WA 6005Telephone: 61 8 9483 1222Facsimile: 61 8 9481 0439Email: [email protected]: www.schaffer.com.au
Share RegistryComputershare Investor Services Pty. LimitedGPO Box D182Perth WA 6840Telephone: 1300 557 010 Facsimile: 61 8 9323 2033
AuditorsErnst and Young11 Mounts Bay RoadPerth WA 6000Telephone: 61 8 9429 2222Facsimile: 61 8 9429 2436
SolicitorsBlake Dawson WaldronLevel 32 Exchange Plaza2 The EsplanadePerth WA 6000Telephone: 61 8 9366 8000Facsimile: 61 8 9366 8111
S H A R E H O L D E R I N F O R M A T I O N
06 10 12
About Schaffer Corporation 1
Managing Director’s Report 2
Review of Operations: Building Materials Property
Financial Statements 13
Independent Audit Report 52
Directors’ Report 53
Shareholder Information 65
Automotive Leather
Schaffer Corporation Limited 2 0 1 1 A N N U A L R E P O RT 65
A B O U T S C H A F F E R C O R P O R A T I O N
A D I V E R S I F I E D A U S T R A L I A N I N D U S T R I A L C O M PA N Y
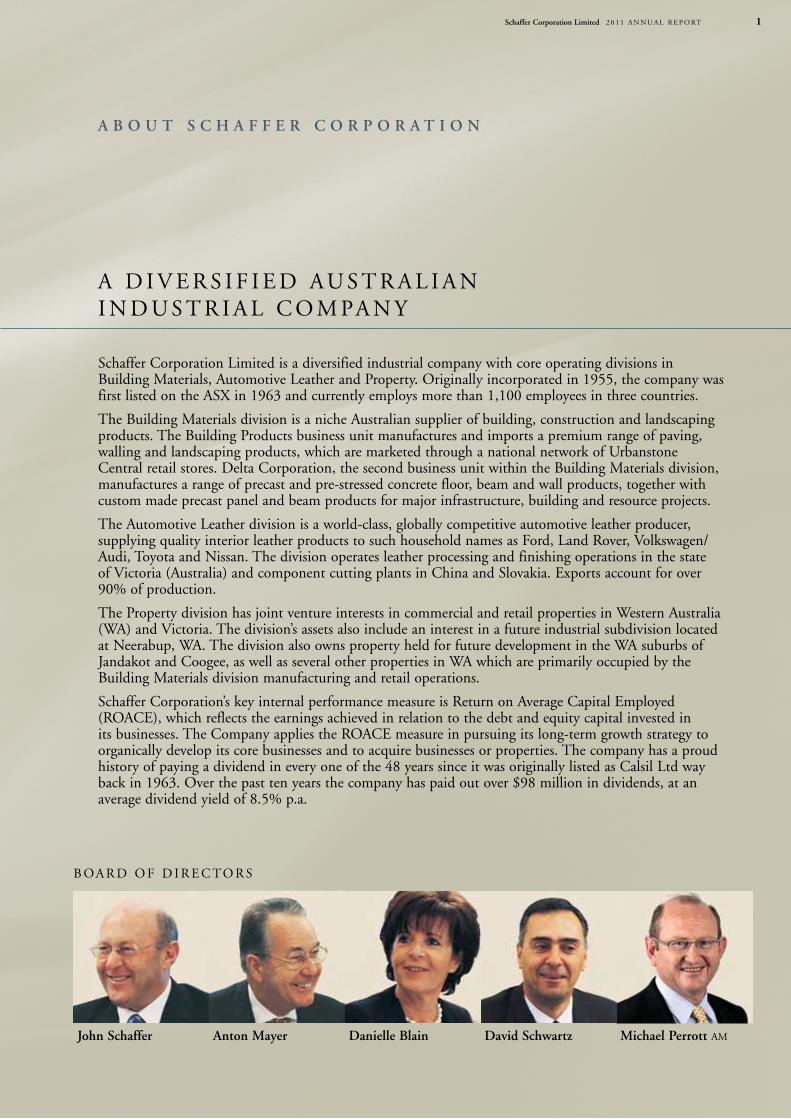
Schaffer Corporation Limited is a diversified industrial company with core operating divisions in Building Materials, Automotive Leather and Property. Originally incorporated in 1955, the company was first listed on the ASX in 1963 and currently employs more than 1,100 employees in three countries.
The Building Materials division is a niche Australian supplier of building, construction and landscaping products. The Building Products business unit manufactures and imports a premium range of paving, walling and landscaping products, which are marketed through a national network of Urbanstone Central retail stores. Delta Corporation, the second business unit within the Building Materials division, manufactures a range of precast and pre-stressed concrete floor, beam and wall products, together with custom made precast panel and beam products for major infrastructure, building and resource projects.
The Automotive Leather division is a world-class, globally competitive automotive leather producer, supplying quality interior leather products to such household names as Ford, Land Rover, Volkswagen/Audi, Toyota and Nissan. The division operates leather processing and finishing operations in the state of Victoria (Australia) and component cutting plants in China and Slovakia. Exports account for over 90% of production.
The Property division has joint venture interests in commercial and retail properties in Western Australia (WA) and Victoria. The division’s assets also include an interest in a future industrial subdivision located at Neerabup, WA. The division also owns property held for future development in the WA suburbs of Jandakot and Coogee, as well as several other properties in WA which are primarily occupied by the Building Materials division manufacturing and retail operations.
Schaffer Corporation’s key internal performance measure is Return on Average Capital Employed (ROACE), which reflects the earnings achieved in relation to the debt and equity capital invested in its businesses. The Company applies the ROACE measure in pursuing its long-term growth strategy to organically develop its core businesses and to acquire businesses or properties. The company has a proud history of paying a dividend in every one of the 48 years since it was originally listed as Calsil Ltd way back in 1963. Over the past ten years the company has paid out over $98 million in dividends, at an average dividend yield of 8.5% p.a.
B OA R D O F D I R E C TO R S
John Schaffer Michael Perrott AMDavid SchwartzDanielle BlainAnton Mayer
1Schaffer Corporation Limited 2 0 1 1 A N N U A L R E P O RT
Schaffer Corporation Limited 2 0 1 1 A N N U A L R E P O RT2
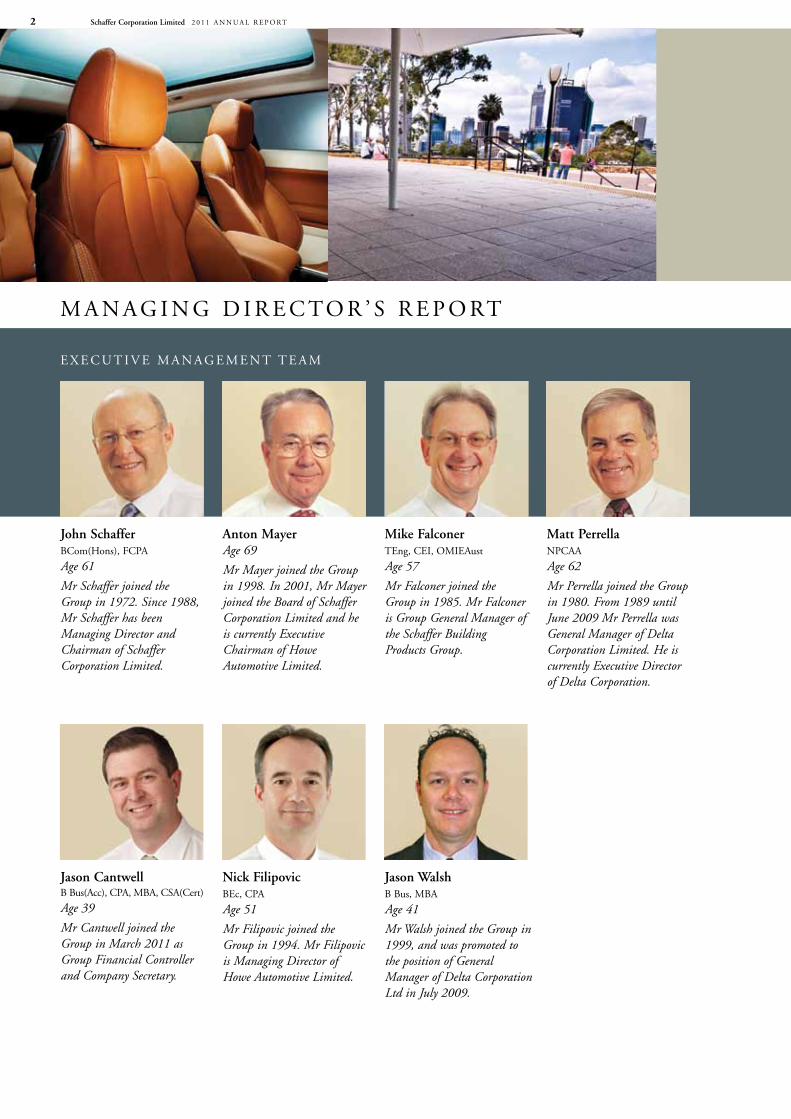
E X E C U T I V E M A N A g E M E N T T E A M
John SchafferBCom(Hons), FCPA
Age 61
Mr Schaffer joined the Group in 1972. Since 1988, Mr Schaffer has been Managing Director and Chairman of Schaffer Corporation Limited.
Anton MayerAge 69
Mr Mayer joined the Group in 1998. In 2001, Mr Mayer joined the Board of Schaffer Corporation Limited and he is currently Executive Chairman of Howe Automotive Limited.
Mike FalconerTEng, CEI, OMIEAust
Age 57
Mr Falconer joined the Group in 1985. Mr Falconer is Group General Manager of the Schaffer Building Products Group.
Matt PerrellaNPCAA
Age 62
Mr Perrella joined the Group in 1980. From 1989 until June 2009 Mr Perrella was General Manager of Delta Corporation Limited. He is currently Executive Director of Delta Corporation.
Jason CantwellB Bus(Acc), CPA, MBA, CSA(Cert)
Age 39
Mr Cantwell joined the Group in March 2011 as Group Financial Controller and Company Secretary.
Nick FilipovicBEc, CPA
Age 51
Mr Filipovic joined the Group in 1994. Mr Filipovic is Managing Director of Howe Automotive Limited.
Jason WalshB Bus, MBA
Age 41
Mr Walsh joined the Group in 1999, and was promoted to the position of General Manager of Delta Corporation Ltd in July 2009.
M A N A g I N g D I R E C TO R ’ S R E P O RT
Schaffer Corporation Limited 2 0 1 1 A N N U A L R E P O RT 3
Financial performance
For the 2011 financial year Schaffer Corporation reported a headline net profit after tax (NPAT) of $4.8 million, representing a 7% increase on the previous year ($4.5 million). The result was boosted by the sale of properties and an improved performance from the Automotive Leather division. The Automotive Leather result is pleasing and is a reflection of the hard strategic decisions being made to improve earnings performance, which included the closure of our Mexican leather cutting operations. However, tough trading conditions including high foreign exchange rates, tight bank credit and low consumer spending had a negative effect on the profitability of the Building Materials division, which includes Building Products and Delta.
The Return on Average Capital Employed (ROACE) achieved during the year of 11% (pcp 8%), remains below our long term average benchmark of 15%. The result was affected by the low ROACE of the Building Products division and whilst our Automotive Leather division result improved, the result is still below our benchmark. However, Delta achieved the 15% benchmark.
Cash Flow & Net Debt
Continuing the trend of the previous financial year, it is pleasing to report a $9.6 million reduction in net debt for the group and in particular, a $10.9 million reduction for debt recourse on assets that are 100% owned by Schaffer Corporation. We retired $17.4 million of debt during 2011and consequently net debt across the group decreased a further 16% to $51.5 million. Schaffer Corporation debt is segregated into three separate and distinct debt “pools” associated with (i) JV investment properties, (ii) the Automotive Leather division and, (iii) Building Materials/Corporate. The debt associated with the JV properties and the Automotive Leather division is primarily non-recourse to other assets of the group.
M A I N TA I N I N g F O C U S .
Schaffer Corporation’s primary focus is on creating long-term shareholder value.
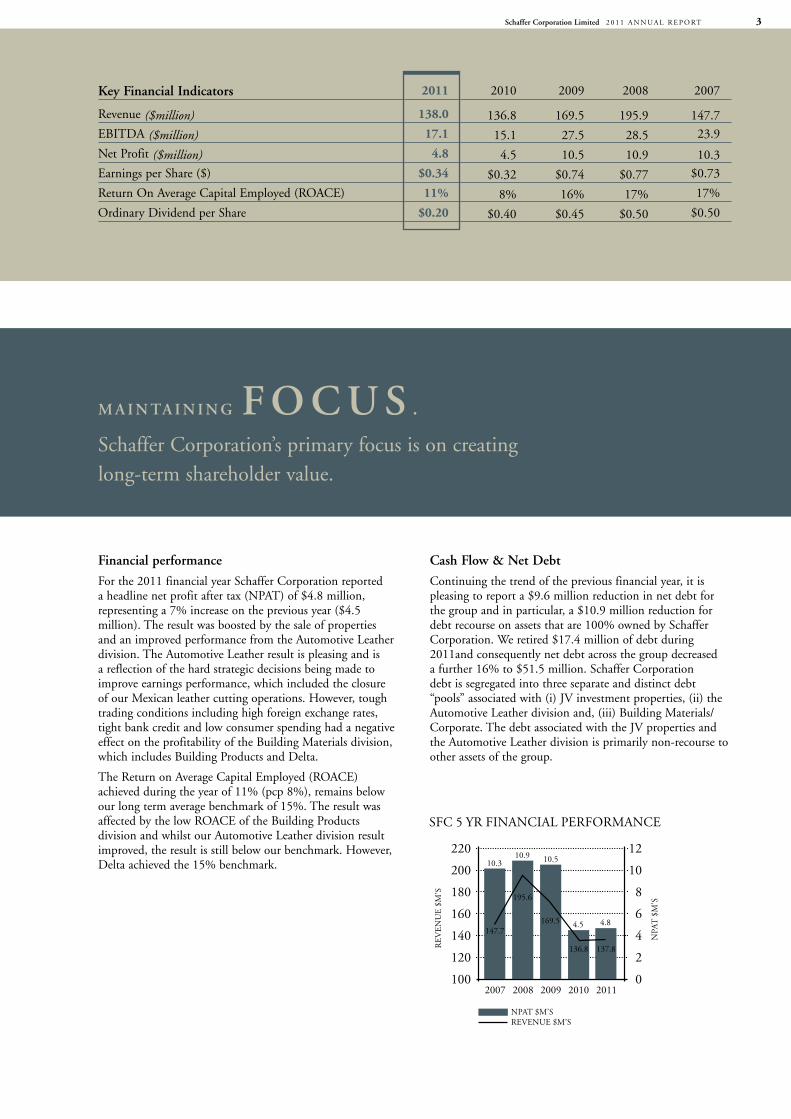
Key Financial Indicators 2011 2010 2009 2008 2007
Revenue ($million) 138.0 136.8 169.5 195.9 147.7
EBITDA ($million) 17.1 15.1 27.5 28.5 23.9
Net Profit ($million) 4.8 4.5 10.5 10.9 10.3
Earnings per Share ($) $0.34 $0.32 $0.74 $0.77 $0.73
Return On Average Capital Employed (ROACE) 11% 8% 16% 17% 17%
Ordinary Dividend per Share $0.20 $0.40 $0.45 $0.50 $0.50
SFC 5 YR FINANCIAL PERFORMANCE
REV
ENU
E $M
’S
NPA
T $
M’S
220
200
180
160
140
120
100
12
10
8
6
4
2
0
10.3
147.7
195.6
NPAT $M’SREVENUE $M’S
2007 2008 2009 2010 2011
10.9
4.5169.5
136.8
4.8
137.8
10.5
Schaffer Corporation Limited 2 0 1 1 A N N U A L R E P O RT4
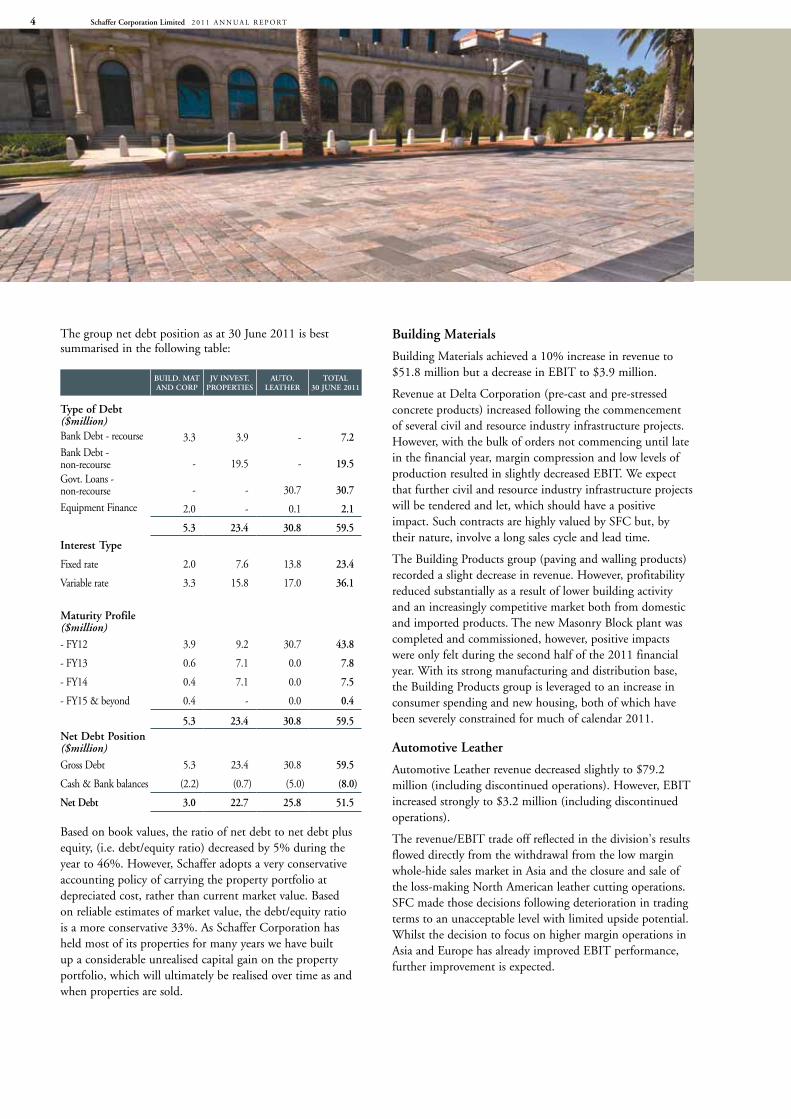
The group net debt position as at 30 June 2011 is best summarised in the following table:
BUILD. MATAND CORP
JV INVEST.PROPERTIES
AUTO.LEATHER
TOTAL30 JUNE 2011
Type of Debt ($million)Bank Debt - recourse 3.3 3.9 - 7.2Bank Debt - non-recourse - 19.5 - 19.5govt. Loans - non-recourse - - 30.7 30.7
Equipment Finance 2.0 - 0.1 2.1
5.3 23.4 30.8 59.5
Interest Type
Fixed rate 2.0 7.6 13.8 23.4
Variable rate 3.3 15.8 17.0 36.1
Maturity Profile ($million)- FY12 3.9 9.2 30.7 43.8
- FY13 0.6 7.1 0.0 7.8
- FY14 0.4 7.1 0.0 7.5
- FY15 & beyond 0.4 - 0.0 0.4
5.3 23.4 30.8 59.5Net Debt Position ($million)gross Debt 5.3 23.4 30.8 59.5
Cash & Bank balances (2.2) (0.7) (5.0) (8.0)
Net Debt 3.0 22.7 25.8 51.5
Based on book values, the ratio of net debt to net debt plus equity, (i.e. debt/equity ratio) decreased by 5% during the year to 46%. However, Schaffer adopts a very conservative accounting policy of carrying the property portfolio at depreciated cost, rather than current market value. Based on reliable estimates of market value, the debt/equity ratio is a more conservative 33%. As Schaffer Corporation has held most of its properties for many years we have built up a considerable unrealised capital gain on the property portfolio, which will ultimately be realised over time as and when properties are sold.
Building Materials
Building Materials achieved a 10% increase in revenue to $51.8 million but a decrease in EBIT to $3.9 million.
Revenue at Delta Corporation (pre-cast and pre-stressed concrete products) increased following the commencement of several civil and resource industry infrastructure projects. However, with the bulk of orders not commencing until late in the financial year, margin compression and low levels of production resulted in slightly decreased EBIT. We expect that further civil and resource industry infrastructure projects will be tendered and let, which should have a positive impact. Such contracts are highly valued by SFC but, by their nature, involve a long sales cycle and lead time.
The Building Products group (paving and walling products) recorded a slight decrease in revenue. However, profitability reduced substantially as a result of lower building activity and an increasingly competitive market both from domestic and imported products. The new Masonry Block plant was completed and commissioned, however, positive impacts were only felt during the second half of the 2011 financial year. With its strong manufacturing and distribution base, the Building Products group is leveraged to an increase in consumer spending and new housing, both of which have been severely constrained for much of calendar 2011.
Automotive Leather
Automotive Leather revenue decreased slightly to $79.2 million (including discontinued operations). However, EBIT increased strongly to $3.2 million (including discontinued operations).
The revenue/EBIT trade off reflected in the division's results flowed directly from the withdrawal from the low margin whole-hide sales market in Asia and the closure and sale of the loss-making North American leather cutting operations. SFC made those decisions following deterioration in trading terms to an unacceptable level with limited upside potential. Whilst the decision to focus on higher margin operations in Asia and Europe has already improved EBIT performance, further improvement is expected.
Schaffer Corporation Limited 2 0 1 1 A N N U A L R E P O RT 5
Property
Property revenue decreased by 13% to $6.8 million and EBIT increased by 51% to $7.2 million.
The decline in revenue is attributable to reduced net rental following previous property sales and a small increase in vacancy rates. The largest contribution to EBIT was $4.4 million from the sale of SFC's interest in the 89 St georges Terrace, Perth property syndicate.
People
People are a critical ingredient to the growth and success of Schaffer Corporation. We have a proud history of loyal service from employees from all over the world, and as an example our executive management team of 7 people has over 145 years of combined seniority with Schaffer. I would like to take this opportunity to thank all of our staff for their hard work and dedication in 2011, which was a very challenging year for all of us.
Health, Safety & Environment
Schaffer Corporation is committed to providing all employees with a safe and healthy working environment, and during the year we continued to work diligently on reviewing and improving the occupational health and safety management systems across the group. We are pleased and encouraged by a further reduction in our overall group LTIFR (lost time injury frequency rate).
Dividends
Schaffer Corporation’s long-standing dividend policy is to pay the majority of earnings as dividends to shareholders. The proportion of earnings paid out as dividends is managed in light of capital expenditure requirements, acquisition activity, liquidity needs and the availability of franking credits.
In the 2011 financial year Schaffer Corporation declared dividends of 20 cents per share (fully franked), representing a payout ratio of 59%. Whilst this ratio aligns with our policy to pay the majority of earnings as dividends, it is intentionally lower than previous years. In making the decisions on dividends, the Board recognises Schaffer Corporation’s reputation as a strong dividend yielding company but the Board is also conscious of the uncertainty of prevailing economic conditions and therefore conservative dividends have been declared.
Outlook
As has been the case for several years, SFC’s operating divisions are operating in challenging environments. The continued volatility in global financial and currency markets and severely restricted credit for commercial property developments across Australia make forecasting future performance difficult.
Nonetheless, the Board remains optimistic that SFC’s financial performance for the first half of the 2012 financial year will exceed the results achieved during the previous corresponding period.
SFC anticipates revenue and EBIT for Building Materials during the first half will be marginally higher than the previous corresponding period. Confirmed order books for Building Products and Delta are increasing and include a new range of masonry products manufactured at a state-of-the-art production facility within the Jandakot factory.
For Automotive Leather, the withdrawal from the whole hide market in Asia and closure and sale of the North American leather cutting operations has already achieved higher overall margins within the division. The consequent reduction in revenue and volumes should be more than offset with new approved program demand from the targeted markets of Europe and China. Accordingly, SFC anticipates revenue and EBIT to be higher than the previous corresponding period.
The Property division is expected to achieve slightly lower revenue in the first half compared with the corresponding prior period due to the previous sales of property and slight increase in vacancies. However, EBIT will benefit from the sale of SFC’s interest in a smaller property at Vulcan Rd, Canning Vale.
I look forward to seeing shareholders at the Annual general Meeting on 16 November 2011, at which time I will provide a further update on the outlook for the current financial year.
JOHN SCHAFFERManaging Director
Schaffer Corporation Limited 2 0 1 1 A N N U A L R E P O RT6
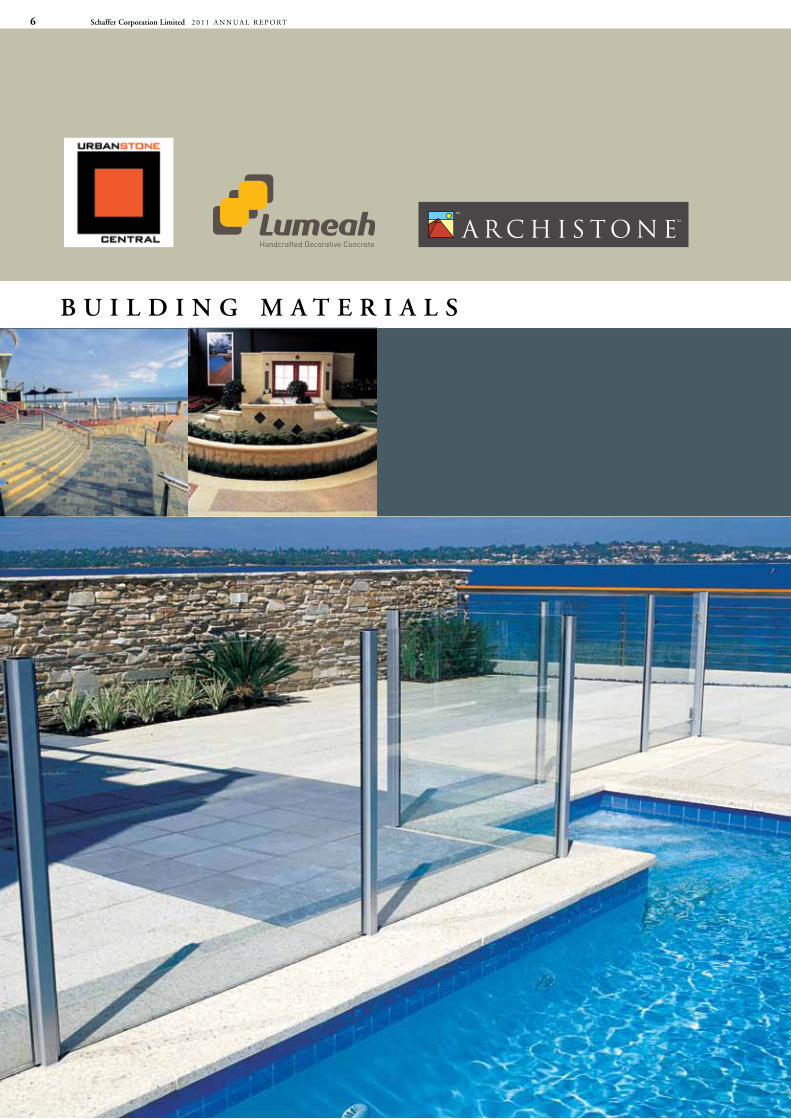
B U I L D I N g M A T E R I A L S
Schaffer Corporation Limited 2 0 1 1 A N N U A L R E P O RT 7
Schaffer Corporation’s Building Materials division consists of Schaffer Building Products which manufactures, imports and retails a wide range of paving, walling and imported stone products, and Delta Corporation which is WA’s pre-eminent manufacturer of pre-cast and pre-stressed concrete products.
Schaffer Building Products
www.urbanstone.com.auwww.urbanstonecentral.com auwww.archistone.com.auwww.limestone-resources.com.au
Our well defined strategy and sales focus enabled us to hold sales volumes during the year, albeit the competitive nature of the current market has eroded margins across the board. The strong Australian dollar has continued to fuel aggressive pricing of imports, and in particular natural stone paving products that have impacted on our paving markets nationally. Thus, our strategy to develop this market segment, and indeed to leverage off of our established branding, has enabled us to secure orders in this competitive market, particularly in the commercial sales arena.
We have continued with our “One-Stop-Shop” concept to the retail and residential markets with an expanded offer of paving, walling, cladding and specialty landscaping products in natural stone and engineered manufactured products. This offer is now being expanded into the commercial market segments where appropriate, as we have excellent opportunities through the relationships we continue to build with architects, government, local government, landscape and architectural designers alike.
We have extended the offer of exposed aggregate paving into the West Australian market through our new generation Lumeah hand crafted concrete paving range. Additionally we have introduced matching step treads and pool surrounds in all finishes to complement the poured concrete paving and give us a competitive advantage in this growing market segment.
Our new Masonry Block manufacturing operation is fully commissioned and our products have been well received in the local West Australian market. We continue to develop the product range from this facility, and believe we will penetrate the existing established markets with products of excellent quality backed by exceptional service. Our new generation coloured, machined and split face architectural block products will be introduced in the coming year and will establish our company as the leading supplier of architectural masonry in the state of Western Australia.
Urbanstone Central continues to establish itself as a superior brand with a national distribution network of “One-Stop-Shop” ideas and design centres. We have expanded this concept over the past year with our new store in Perth’s northern suburbs and a combined warehouse sales and pick up centre scheduled to open in South Australia in September 2011.
Strong order banks in our commercial natural stone imports and masonry block division, together with our sustained retail activity in the residential markets indicate that we will be well positioned to take advantage of any upturn in the market in the months ahead.
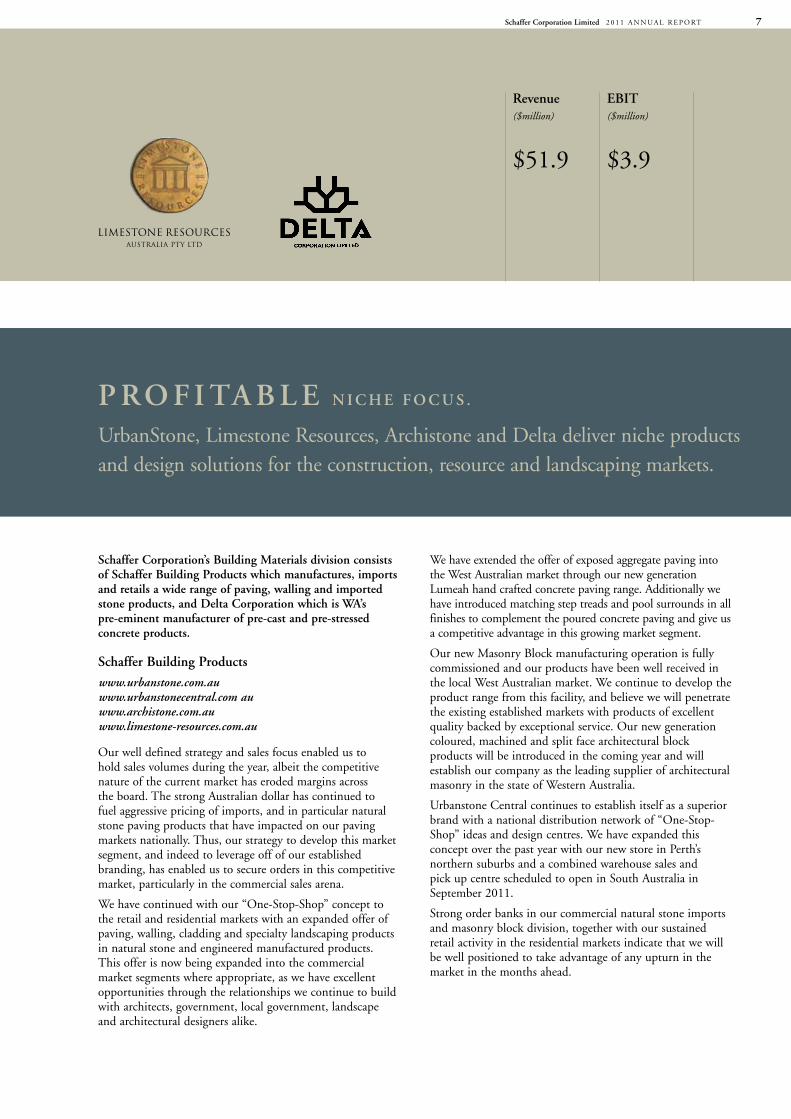
P RO F I TA B L E N I C H E F O C U S .
UrbanStone, Limestone Resources, Archistone and Delta deliver niche products and design solutions for the construction, resource and landscaping markets.
Revenue($million)
$51.9
EBIT($million)
$3.9
Schaffer Corporation Limited 2 0 1 1 A N N U A L R E P O RT8
Some major projects of note are as follows:
WA• TownofCollieCentre• ParliamentPlaceWestPerth-Granite• BunburyTownCentre-Granite• FrasersRestaurantKingsPark-upgradefor
CHOgM 2011SA• VictorHarbourforeshoreredevelopment• MountGambierTownCentre• AdelaideOvalentrancerefurbishment• AdelaideBotanicalGardensandZoo
VIC
• ANZBank–HeadOfficeDocklands• DigitalHarbourbuildingDocklands• DocklandPrecinct–HarbourOneBuilding• BanburyVillageTownCentre
NSW• RoyalSydneyGolfClubswimmingpoolandnew
building surrounds• CranbrookSchoolRoseBay• BankstownRailInterchange• RiverwoodTownCentre
QLD• TownsvilleCityCentrestreetupgrade• RobinaHospital• BallinaShireCouncilTownCentre• JamesCookUniversity-Cairns
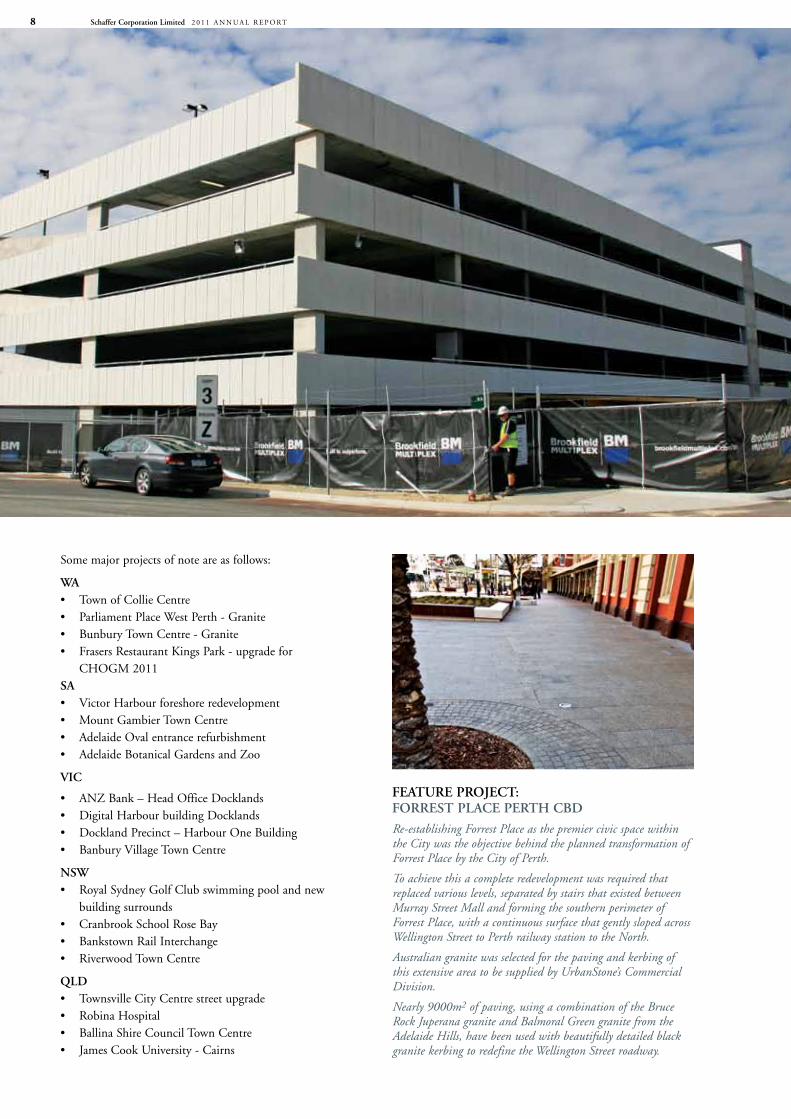
FEATURE PROJECT: FORREST PLACE PERTH CBD
Re-establishing Forrest Place as the premier civic space within the City was the objective behind the planned transformation of Forrest Place by the City of Perth.
To achieve this a complete redevelopment was required that replaced various levels, separated by stairs that existed between Murray Street Mall and forming the southern perimeter of Forrest Place, with a continuous surface that gently sloped across Wellington Street to Perth railway station to the North.
Australian granite was selected for the paving and kerbing of this extensive area to be supplied by UrbanStone’s Commercial Division.
Nearly 9000m2 of paving, using a combination of the Bruce Rock Juperana granite and Balmoral Green granite from the Adelaide Hills, have been used with beautifully detailed black granite kerbing to redefine the Wellington Street roadway.
Schaffer Corporation Limited 2 0 1 1 A N N U A L R E P O RT 9
Paving module sizes vary from 100 x 100 x 40 mm thick paving sets to large format 800 x 400 x 40mm and 300 x 200 x 40 mm pavers.
Once completed, Forrest Place will have been transformed into a vibrant space within the fabric of what is a rapidly changing city, and UrbanStone are proud to be associated with this project through supplying a natural granite product of Australian origin.
Delta Corporation
www.deltacorp.com.au
Delta experienced a stronger level of activity than in the previous year on the back of a buoyant resource and mining sector.
The decision to re-enter the architectural precast market has provided us with a wider range of opportunities than possible in the past. This includes the Fiona Stanley Hospital Project which is a perfect example of high quality architectural precast cladding applications.
During the year we have successfully commissioned our fully automated, state of the art architectural cladding polishing facility. This facility allows us to produce a full range of high quality architectural finishes from off form smooth through to highly polished surfaces. In addition, the new facility can produce polished surfaces to curved facades such as circular columns.
Major projects successfully completed during the year included:
Resource• RioTintoLevelCrossings• GorgonLNGProject–VariousPackages• YandiRGP5–CourseStockpile• MtGibsonBridge• SinoIronOreCapePreston-BargeLoaderFoundations
Infrastructure• ReidHighway&MirrabookaAveInterchange-Beams
& Parapet Panels• ShentonAve&StirlingRdPTABridges-Beams• SimsStreetBridgeEsperance-Beams• JalbarragupRoadBridgeNannup-DeckBeams• ChristmasIslandPowerStation
Commercial• FionaStanleyHospital-VariousProjects• ForrestPlaceRedevelopmentLandscaping• KwinanaLibrary&ResourceCentre• REIWABuildingPerth
The outlook for the coming year is looking positive with a solid order bank which includes a number of sizable projects. In addition, we are well placed to win a number of upcoming infrastructure and resource projects that are due to be awarded in the next few months.
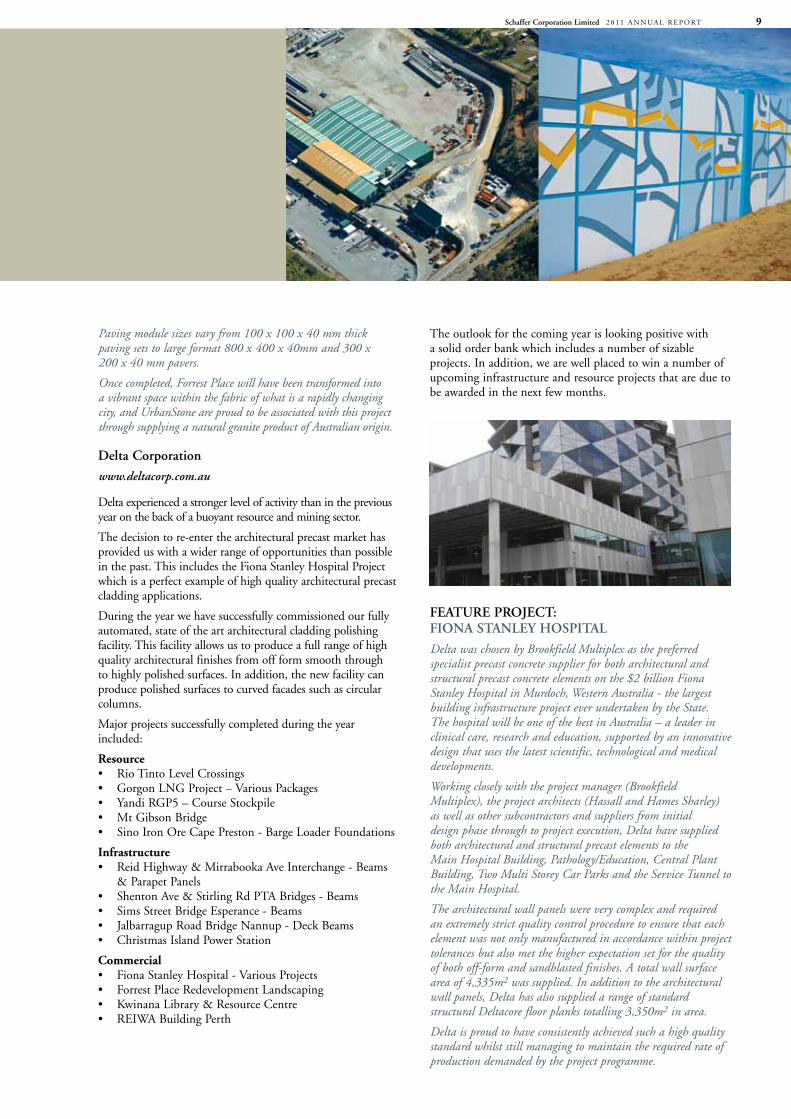
FEATURE PROJECT: FIONA STANLEy HOSPITAL
Delta was chosen by Brookfield Multiplex as the preferred specialist precast concrete supplier for both architectural and structural precast concrete elements on the $2 billion Fiona Stanley Hospital in Murdoch, Western Australia - the largest building infrastructure project ever undertaken by the State. The hospital will be one of the best in Australia – a leader in clinical care, research and education, supported by an innovative design that uses the latest scientific, technological and medical developments.
Working closely with the project manager (Brookfield Multiplex), the project architects (Hassall and Hames Sharley) as well as other subcontractors and suppliers from initial design phase through to project execution, Delta have supplied both architectural and structural precast elements to the Main Hospital Building, Pathology/Education, Central Plant Building, Two Multi Storey Car Parks and the Service Tunnel to the Main Hospital.
The architectural wall panels were very complex and required an extremely strict quality control procedure to ensure that each element was not only manufactured in accordance within project tolerances but also met the higher expectation set for the quality of both off-form and sandblasted finishes. A total wall surface area of 4,335m2 was supplied. In addition to the architectural wall panels, Delta has also supplied a range of standard structural Deltacore floor planks totalling 3,350m2 in area.
Delta is proud to have consistently achieved such a high quality standard whilst still managing to maintain the required rate of production demanded by the project programme.

Schaffer Corporation Limited 2 0 1 1 A N N U A L R E P O RT10
A U T O M O T I V E L E A T H E R
Schaffer Corporation Limited 2 0 1 1 A N N U A L R E P O RT 11
Howe Automotive
www.howe.com.au
Schaffer Corporation owns 83% of Howe Automotive Limited (“Howe”), which supplies high performance leather to the global automotive industry. From leather processing and finishing facilities in Victoria and offshore component cutting plants in China and Slovakia, Howe produces quality automotive leather for a strong and regionally diverse customer base including major motor vehicle manufacturers such as Audi, Volkswagen, Land Rover, Nissan, Toyota, Ford and general Motors.
As has been the case in recent years, the majority of Howe’s product was exported and therefore currency fluctuations are an important factor for Howe as almost all of its revenues are generated in foreign currencies. Those revenues receive a partial hedge from most of our raw materials being purchased in US dollars.
Howe increased its EBIT to $3.2 million (pcp -$0.1 million) by withdrawing from low margin whole-hide sales to Asia and withdrawing from the loss making market in North America. This is a reflection of the strategic decisions being made to reposition Howe in the currently volatile global market. Howe is now refocused on higher margin cut component sales in Europe and Asia.
Howe operates from a low cost base and its global sites provide globally competitive labour costs, a local presence in the key automotive markets, and an ability to respond more efficiently to customer needs. These benefits have provided Howe with the opportunity to secure new supply programs from automotive manufacturers in Asia and Europe.
The outlook for the global automotive industry is improving, particularly with the continued growth of the middle class in the developing world which is creating increased demand
Revenue($million)
$79.3
EBIT($million)
$3.2
for luxury brands and automotive leather. Howe is well positioned as a globally competitive low cost producer with a well established track record for reliability and quality.
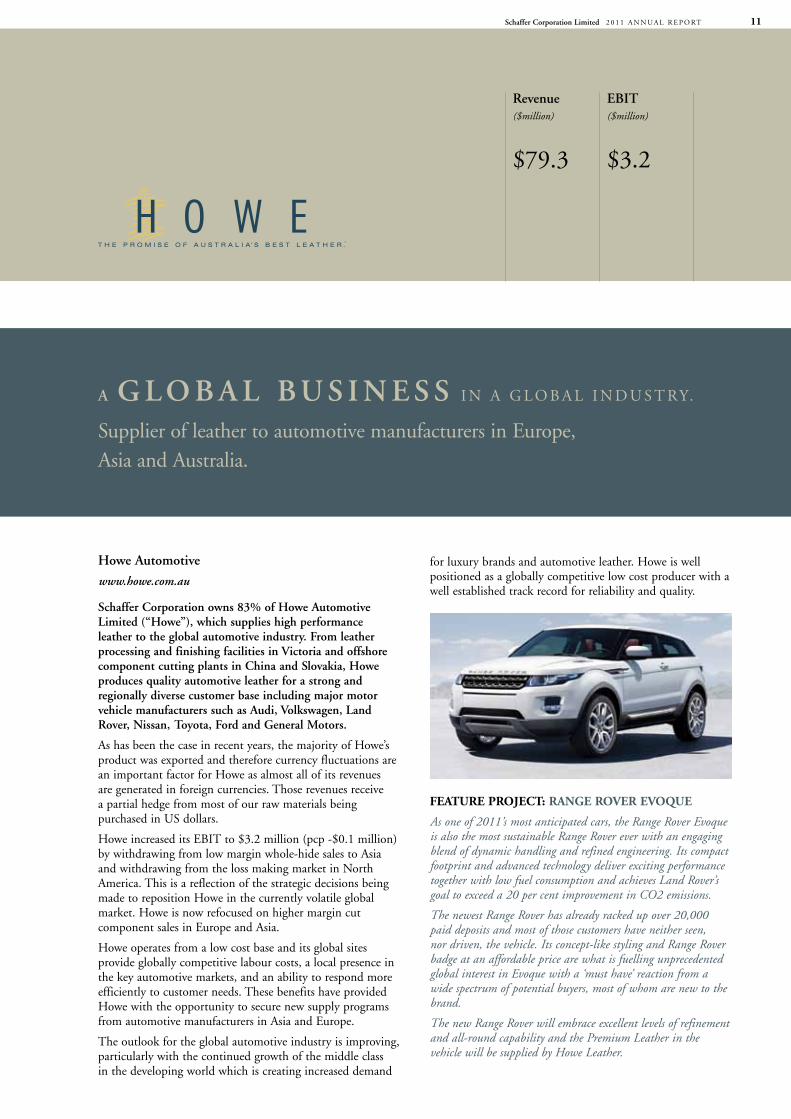
FeatuRe pRojeCt: Range RoveR evoque
As one of 2011’s most anticipated cars, the Range Rover Evoque is also the most sustainable Range Rover ever with an engaging blend of dynamic handling and refined engineering. Its compact footprint and advanced technology deliver exciting performance together with low fuel consumption and achieves Land Rover’s goal to exceed a 20 per cent improvement in CO2 emissions.
The newest Range Rover has already racked up over 20,000 paid deposits and most of those customers have neither seen, nor driven, the vehicle. Its concept-like styling and Range Rover badge at an affordable price are what is fuelling unprecedented global interest in Evoque with a ‘must have’ reaction from a wide spectrum of potential buyers, most of whom are new to the brand.
The new Range Rover will embrace excellent levels of refinement and all-round capability and the Premium Leather in the vehicle will be supplied by Howe Leather.
A g L O B A L B U S I N E S S I N A g L O B A L I N D U S T RY.
Supplier of leather to automotive manufacturers in Europe, Asia and Australia.
Schaffer Corporation Limited 2 0 1 1 A N N U A L R E P O RT12
Investment property
As at 30 June 2011, Schaffer Corporation’s investment property portfolio consisted of five commercial/retail joint venture properties located in Western Australia, plus a joint venture interest in a commercial property located in Melbourne.
PROPERTy NAME/ LOCATION
yEARACQUIRED
SCHAFFER INTEREST
IBM Centre, Hay Street, West Perth WA 1995 22.1%
616StKildaRoad, Melbourne VIC 1997 20.0%
Parks Shopping Centre, Bunbury WA 1999 16.7%
Hometown Shopping Centre, Albany Highway, Cannington WA 1998 25.0%
115 Vulcan Road, Canning Vale WA 2006 20.0%
During the year, Schaffer’s interest in the 89 St georges Terrace, Perth property syndicate was sold generating a pre-tax profit of $4.4 million.
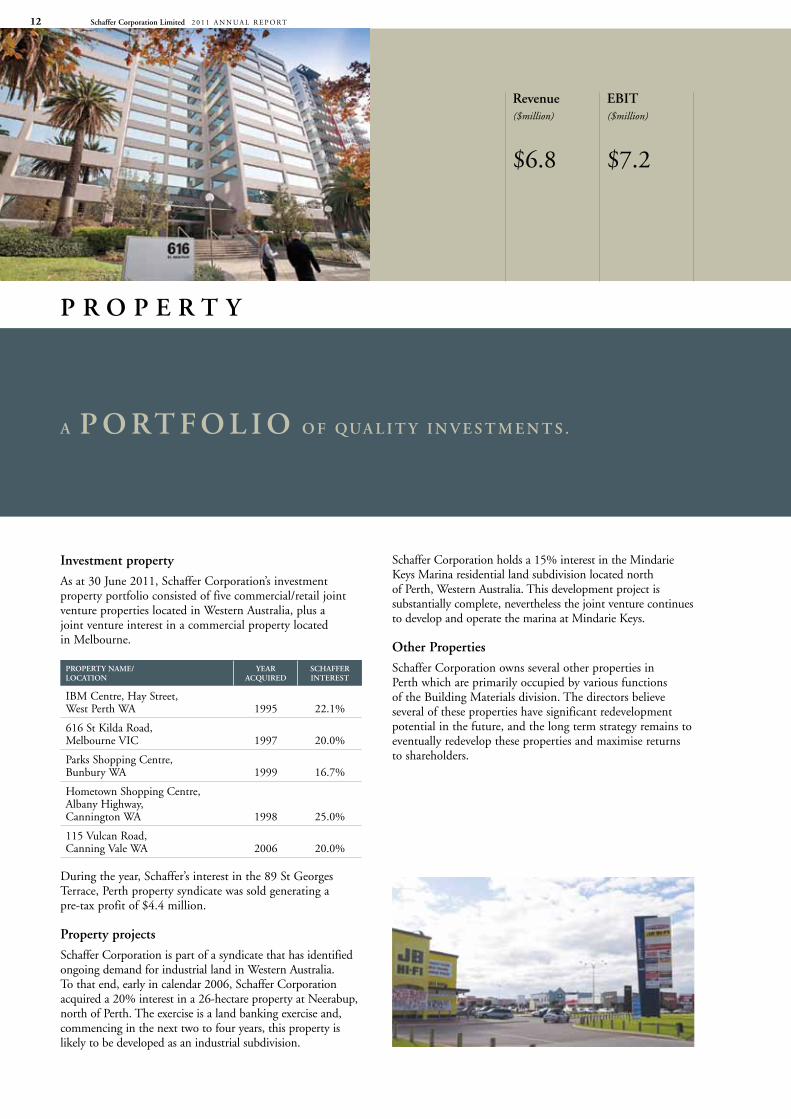
Property projects
Schaffer Corporation is part of a syndicate that has identified ongoing demand for industrial land in Western Australia. To that end, early in calendar 2006, Schaffer Corporation acquired a 20% interest in a 26-hectare property at Neerabup, north of Perth. The exercise is a land banking exercise and, commencing in the next two to four years, this property is likely to be developed as an industrial subdivision.
Schaffer Corporation holds a 15% interest in the Mindarie KeysMarinaresidentiallandsubdivisionlocatednorthof Perth, Western Australia. This development project is substantially complete, nevertheless the joint venture continues todevelopandoperatethemarinaatMindarieKeys.
Other Properties
Schaffer Corporation owns several other properties in Perth which are primarily occupied by various functions of the Building Materials division. The directors believe several of these properties have significant redevelopment potential in the future, and the long term strategy remains to eventually redevelop these properties and maximise returns to shareholders.
A P O RT F O L I O O F QUA L I T y I N V E S T M E N T S .
P R O P E R T y
Revenue($million)
$6.8
EBIT($million)
$7.2
Notes to the CoNsolidated FiNaNCial statemeNtsyear ended 30 June 2011
schaffer Corporation limited 2 0 1 1 A n n u A l R e p o Rt 13
2011 F i N a N C i a l r e p o r t
Consolidated Statement of Comprehensive Income 14Consolidated Statement of Financial position 15Consolidated Statement of Changes in equity 16Consolidated Statement of Cash Flows 17notes to the Consolidated Financial Statements 18Directors’ Declaration 51Independent Auditor’s Report 52Directors’ Report 53Statement of Corporate Governance practices 60ASX Additional Information 64
SCHAFFeR CoRpoRAtIon lIMIteDABn 73 008 675 689
at 30 June 2011
schaffer Corporation limited 2 0 1 1 A n n u A l R e p o Rt14
CoNsolidated statemeNt oF CompreheNsive iNComefor the year ended 30 June 2011
CoNsolidated
2011 2010noteS $’000 $’000
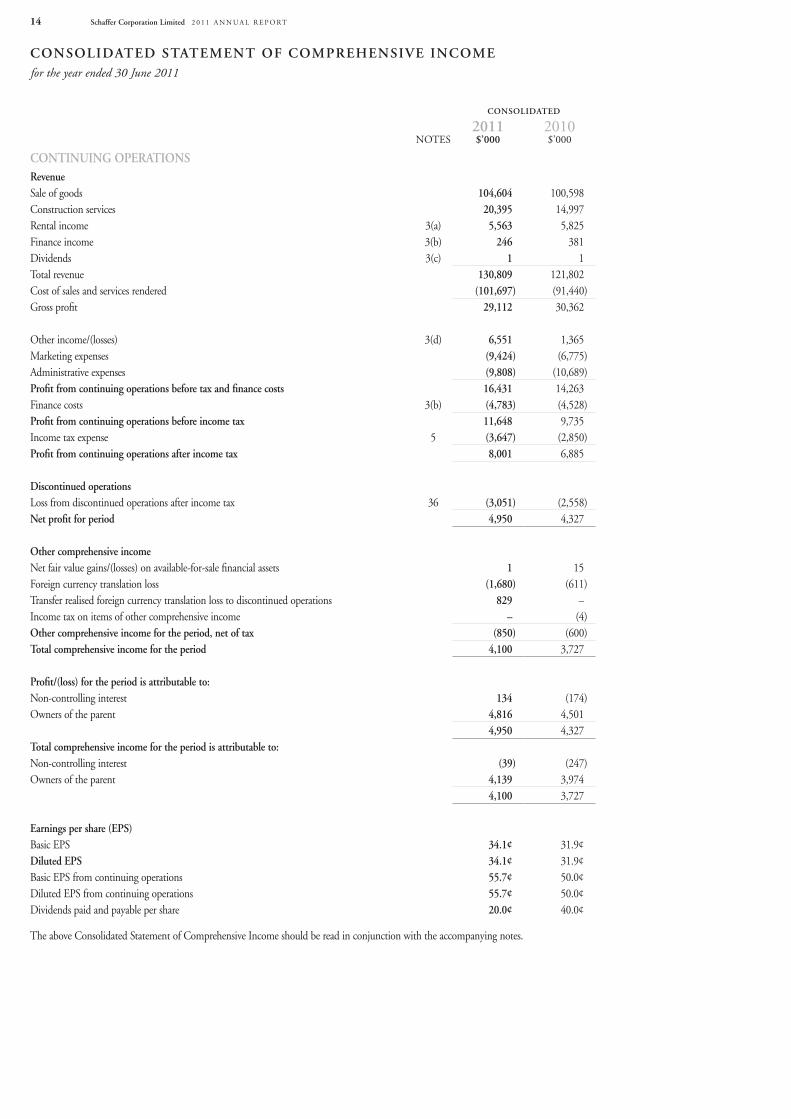
CoNtiNuiNg operatioNsrevenueSale of goods 104,604 100,598Construction services 20,395 14,997Rental income 3(a) 5,563 5,825Finance income 3(b) 246 381Dividends 3(c) 1 1total revenue 130,809 121,802Cost of sales and services rendered (101,697) (91,440)Gross profit 29,112 30,362
other income/(losses) 3(d) 6,551 1,365Marketing expenses (9,424) (6,775)Administrative expenses (9,808) (10,689)profit from continuing operations before tax and finance costs 16,431 14,263Finance costs 3(b) (4,783) (4,528)profit from continuing operations before income tax 11,648 9,735Income tax expense 5 (3,647) (2,850)profit from continuing operations after income tax 8,001 6,885
discontinued operationsloss from discontinued operations after income tax 36 (3,051) (2,558)Net profit for period 4,950 4,327
other comprehensive incomenet fair value gains/(losses) on available-for-sale financial assets 1 15Foreign currency translation loss (1,680) (611)transfer realised foreign currency translation loss to discontinued operations 829 –Income tax on items of other comprehensive income – (4)other comprehensive income for the period, net of tax (850) (600)total comprehensive income for the period 4,100 3,727
profit/(loss) for the period is attributable to:non-controlling interest 134 (174)owners of the parent 4,816 4,501
4,950 4,327total comprehensive income for the period is attributable to:non-controlling interest (39) (247)owners of the parent 4,139 3,974
4,100 3,727
earnings per share (eps) Basic epS 34.1¢ 31.9¢diluted eps 34.1¢ 31.9¢Basic epS from continuing operations 55.7¢ 50.0¢Diluted epS from continuing operations 55.7¢ 50.0¢Dividends paid and payable per share 20.0¢ 40.0¢
the above Consolidated Statement of Comprehensive Income should be read in conjunction with the accompanying notes.
schaffer Corporation limited 2 0 1 1 A n n u A l R e p o Rt 15
CoNsolidated
2011 2010noteS $’000 $’000
assets
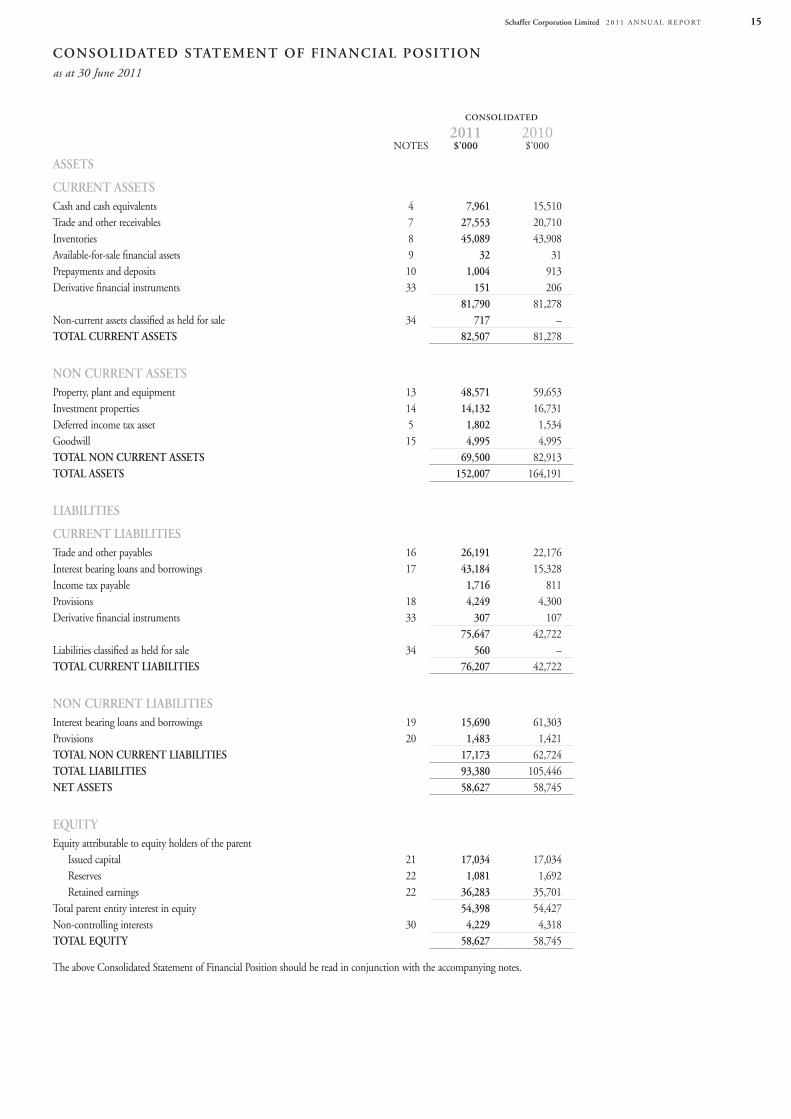
CurreNt assetsCash and cash equivalents 4 7,961 15,510trade and other receivables 7 27,553 20,710Inventories 8 45,089 43,908Available-for-sale financial assets 9 32 31prepayments and deposits 10 1,004 913Derivative financial instruments 33 151 206
81,790 81,278non-current assets classified as held for sale 34 717 –total CurreNt assets 82,507 81,278
NoN CurreNt assetsproperty, plant and equipment 13 48,571 59,653Investment properties 14 14,132 16,731Deferred income tax asset 5 1,802 1,534Goodwill 15 4,995 4,995total NoN CurreNt assets 69,500 82,913total assets 152,007 164,191
liaBilities
CurreNt liaBilitiestrade and other payables 16 26,191 22,176Interest bearing loans and borrowings 17 43,184 15,328Income tax payable 1,716 811provisions 18 4,249 4,300Derivative financial instruments 33 307 107
75,647 42,722liabilities classified as held for sale 34 560 –total CurreNt liaBilities 76,207 42,722
NoN CurreNt liaBilitiesInterest bearing loans and borrowings 19 15,690 61,303provisions 20 1,483 1,421total NoN CurreNt liaBilities 17,173 62,724total liaBilities 93,380 105,446Net assets 58,627 58,745
eQuitYequity attributable to equity holders of the parent Issued capital 21 17,034 17,034 Reserves 22 1,081 1,692 Retained earnings 22 36,283 35,701total parent entity interest in equity 54,398 54,427non-controlling interests 30 4,229 4,318total eQuitY 58,627 58,745
the above Consolidated Statement of Financial position should be read in conjunction with the accompanying notes.
CoNsolidated statemeNt oF FiNaNCial positioNas at 30 June 2011
schaffer Corporation limited 2 0 1 1 A n n u A l R e p o Rt16
AttRIButABle to equIty HolDeRS oF tHe pARent
non-ContRoll-
InG InteReSt
$’000
totAl equIty
$’000
ISSueD CApItAl
$’000
RetAIneD eARnInGS
$’000
ReSeRveS
totAl$’000
ASSet RevAl-
uAtIon$’000
SHARe BASeD
pAyMent epu’S$’000
SHARe BASeD
pAyMent SFC optIonS
$’000
net unReAlISeD
GAInS/(loSSeS)
$’000
FoReIGn CuRRenCy tRAnSlA-
tIon$’000
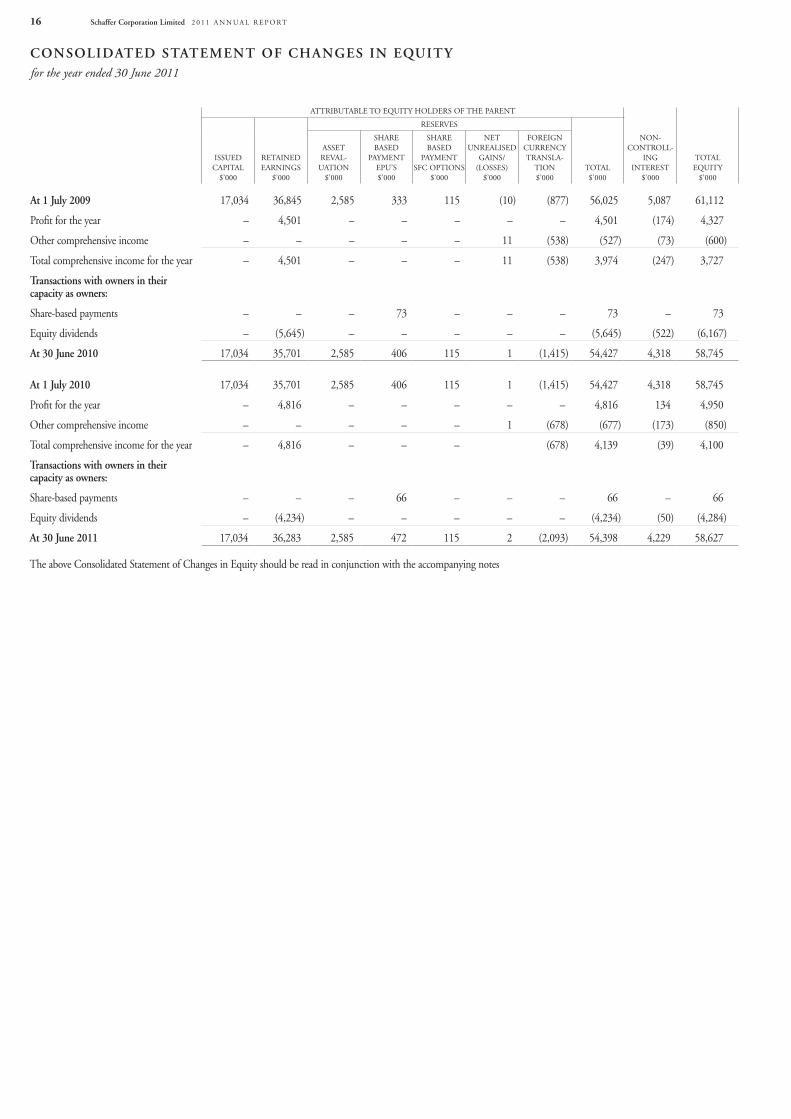
at 1 July 2009 17,034 36,845 2,585 333 115 (10) (877) 56,025 5,087 61,112
profit for the year – 4,501 – – – – – 4,501 (174) 4,327
other comprehensive income – – – – – 11 (538) (527) (73) (600)
total comprehensive income for the year – 4,501 – – – 11 (538) 3,974 (247) 3,727
transactions with owners in their capacity as owners:
Share-based payments – – – 73 – – – 73 – 73
equity dividends – (5,645) – – – – – (5,645) (522) (6,167)
at 30 June 2010 17,034 35,701 2,585 406 115 1 (1,415) 54,427 4,318 58,745
at 1 July 2010 17,034 35,701 2,585 406 115 1 (1,415) 54,427 4,318 58,745
profit for the year – 4,816 – – – – – 4,816 134 4,950
other comprehensive income – – – – – 1 (678) (677) (173) (850)
total comprehensive income for the year – 4,816 – – – (678) 4,139 (39) 4,100
transactions with owners in their capacity as owners:
Share-based payments – – – 66 – – – 66 – 66
equity dividends – (4,234) – – – – – (4,234) (50) (4,284)
at 30 June 2011 17,034 36,283 2,585 472 115 2 (2,093) 54,398 4,229 58,627
the above Consolidated Statement of Changes in equity should be read in conjunction with the accompanying notes
CoNsolidated statemeNt oF ChaNges iN eQuitY for the year ended 30 June 2011
schaffer Corporation limited 2 0 1 1 A n n u A l R e p o Rt 17
CoNsolidated
2011 2010noteS $’000 $’000
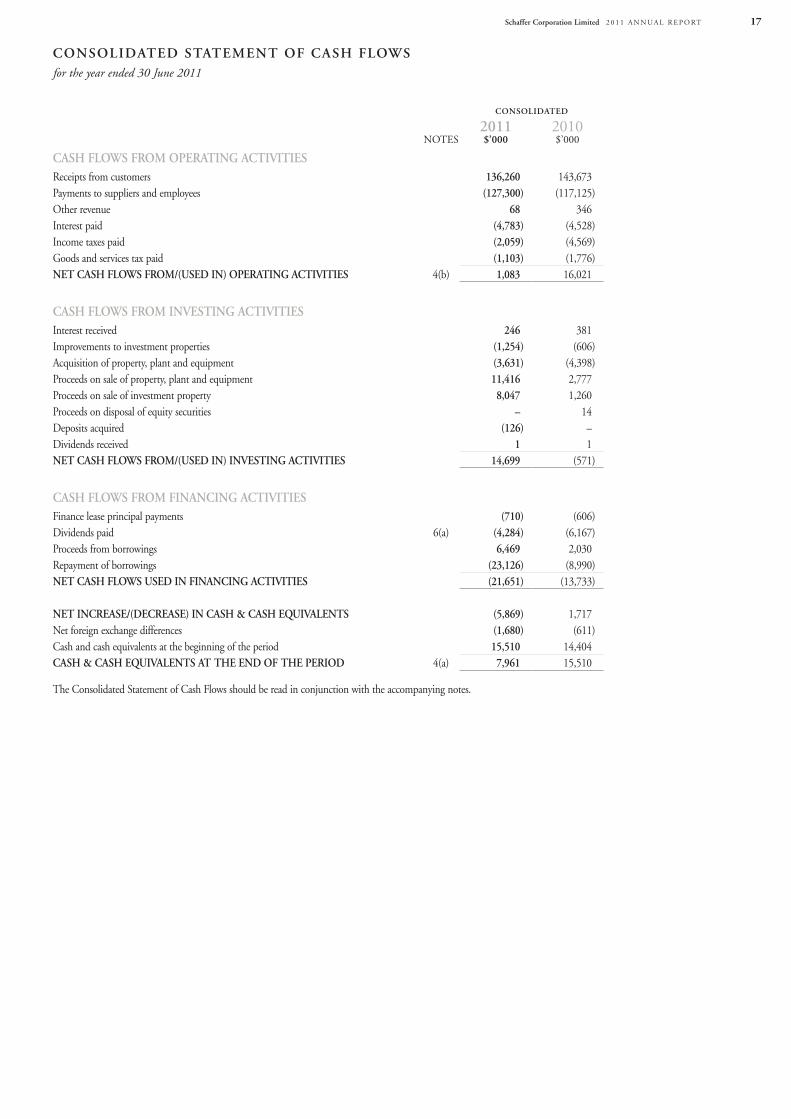
Cash FloWs From operatiNg aCtivitiesReceipts from customers 136,260 143,673payments to suppliers and employees (127,300) (117,125)other revenue 68 346Interest paid (4,783) (4,528)Income taxes paid (2,059) (4,569)Goods and services tax paid (1,103) (1,776)Net Cash FloWs From/(used iN) operatiNg aCtivities 4(b) 1,083 16,021
Cash FloWs From iNvestiNg aCtivitiesInterest received 246 381Improvements to investment properties (1,254) (606)Acquisition of property, plant and equipment (3,631) (4,398)proceeds on sale of property, plant and equipment 11,416 2,777proceeds on sale of investment property 8,047 1,260proceeds on disposal of equity securities – 14Deposits acquired (126) –Dividends received 1 1Net Cash FloWs From/(used iN) iNvestiNg aCtivities 14,699 (571)
Cash FloWs From FiNaNCiNg aCtivitiesFinance lease principal payments (710) (606)Dividends paid 6(a) (4,284) (6,167)proceeds from borrowings 6,469 2,030Repayment of borrowings (23,126) (8,990)Net Cash FloWs used iN FiNaNCiNg aCtivities (21,651) (13,733)
Net iNCrease/(deCrease) iN Cash & Cash eQuivaleNts (5,869) 1,717net foreign exchange differences (1,680) (611)Cash and cash equivalents at the beginning of the period 15,510 14,404Cash & Cash eQuivaleNts at the eNd oF the period 4(a) 7,961 15,510
the Consolidated Statement of Cash Flows should be read in conjunction with the accompanying notes.
CoNsolidated statemeNt oF Cash FloWsfor the year ended 30 June 2011
schaffer Corporation limited 2 0 1 1 A n n u A l R e p o Rt18
Notes to the CoNsolidated FiNaNCial statemeNtsyear ended 30 June 2010
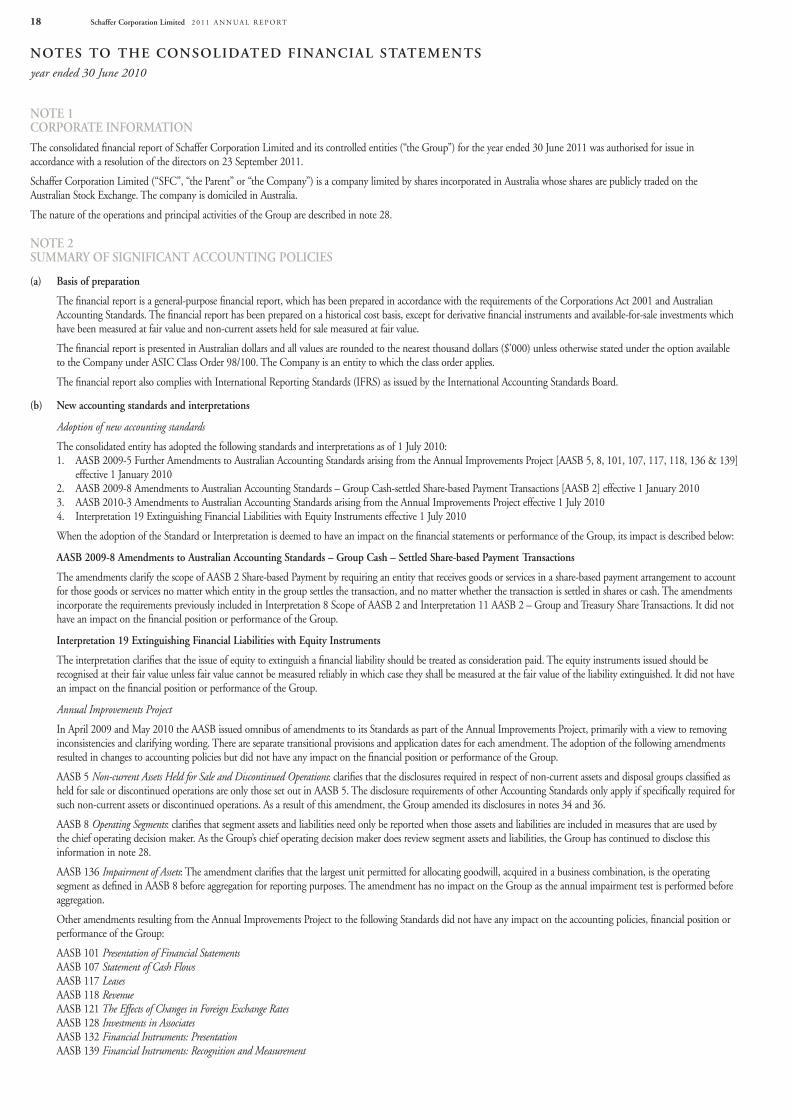
Note 1 Corporate iNFormatioN
the consolidated financial report of Schaffer Corporation limited and its controlled entities (“the Group”) for the year ended 30 June 2011 was authorised for issue in accordance with a resolution of the directors on 23 September 2011.
Schaffer Corporation limited (“SFC”, “the parent” or “the Company”) is a company limited by shares incorporated in Australia whose shares are publicly traded on the Australian Stock exchange. the company is domiciled in Australia.
the nature of the operations and principal activities of the Group are described in note 28.
Note 2 summarY oF sigNiFiCaNt aCCouNtiNg poliCies
(a) Basis of preparation
the financial report is a general-purpose financial report, which has been prepared in accordance with the requirements of the Corporations Act 2001 and Australian Accounting Standards. the financial report has been prepared on a historical cost basis, except for derivative financial instruments and available-for-sale investments which have been measured at fair value and non-current assets held for sale measured at fair value.
the financial report is presented in Australian dollars and all values are rounded to the nearest thousand dollars ($’000) unless otherwise stated under the option available to the Company under ASIC Class order 98/100. the Company is an entity to which the class order applies.
the financial report also complies with International Reporting Standards (IFRS) as issued by the International Accounting Standards Board.
(b) New accounting standards and interpretations
Adoption of new accounting standards
the consolidated entity has adopted the following standards and interpretations as of 1 July 2010:1. AASB 2009-5 Further Amendments to Australian Accounting Standards arising from the Annual Improvements project [AASB 5, 8, 101, 107, 117, 118, 136 & 139]
effective 1 January 20102. AASB 2009-8 Amendments to Australian Accounting Standards – Group Cash-settled Share-based payment transactions [AASB 2] effective 1 January 20103. AASB 2010-3 Amendments to Australian Accounting Standards arising from the Annual Improvements project effective 1 July 20104. Interpretation 19 extinguishing Financial liabilities with equity Instruments effective 1 July 2010
When the adoption of the Standard or Interpretation is deemed to have an impact on the financial statements or performance of the Group, its impact is described below:
aasB 2009-8 amendments to australian accounting standards – group Cash – settled share-based payment transactions
the amendments clarify the scope of AASB 2 Share-based payment by requiring an entity that receives goods or services in a share-based payment arrangement to account for those goods or services no matter which entity in the group settles the transaction, and no matter whether the transaction is settled in shares or cash. the amendments incorporate the requirements previously included in Interpretation 8 Scope of AASB 2 and Interpretation 11 AASB 2 – Group and treasury Share transactions. It did not have an impact on the financial position or performance of the Group.
interpretation 19 extinguishing Financial liabilities with equity instruments
the interpretation clarifies that the issue of equity to extinguish a financial liability should be treated as consideration paid. the equity instruments issued should be recognised at their fair value unless fair value cannot be measured reliably in which case they shall be measured at the fair value of the liability extinguished. It did not have an impact on the financial position or performance of the Group.
Annual Improvements Project
In April 2009 and May 2010 the AASB issued omnibus of amendments to its Standards as part of the Annual Improvements project, primarily with a view to removing inconsistencies and clarifying wording. there are separate transitional provisions and application dates for each amendment. the adoption of the following amendments resulted in changes to accounting policies but did not have any impact on the financial position or performance of the Group.
AASB 5 Non-current Assets Held for Sale and Discontinued Operations: clarifies that the disclosures required in respect of non-current assets and disposal groups classified as held for sale or discontinued operations are only those set out in AASB 5. the disclosure requirements of other Accounting Standards only apply if specifically required for such non-current assets or discontinued operations. As a result of this amendment, the Group amended its disclosures in notes 34 and 36.
AASB 8 Operating Segments: clarifies that segment assets and liabilities need only be reported when those assets and liabilities are included in measures that are used by the chief operating decision maker. As the Group’s chief operating decision maker does review segment assets and liabilities, the Group has continued to disclose this information in note 28.
AASB 136 Impairment of Assets: the amendment clarifies that the largest unit permitted for allocating goodwill, acquired in a business combination, is the operating segment as defined in AASB 8 before aggregation for reporting purposes. the amendment has no impact on the Group as the annual impairment test is performed before aggregation.
other amendments resulting from the Annual Improvements project to the following Standards did not have any impact on the accounting policies, financial position or performance of the Group:
AASB 101 Presentation of Financial StatementsAASB 107 Statement of Cash FlowsAASB 117 LeasesAASB 118 RevenueAASB 121 The Effects of Changes in Foreign Exchange RatesAASB 128 Investments in AssociatesAASB 132 Financial Instruments: PresentationAASB 139 Financial Instruments: Recognition and Measurement
Notes to the CoNsolidated FiNaNCial statemeNtsyear ended 30 June 2011
schaffer Corporation limited 2 0 1 1 A n n u A l R e p o Rt 19
Note 2 summarY oF sigNiFiCaNt aCCouNtiNg poliCies (CoNtiNued)
(b) New accounting standards and interpretations (continued)
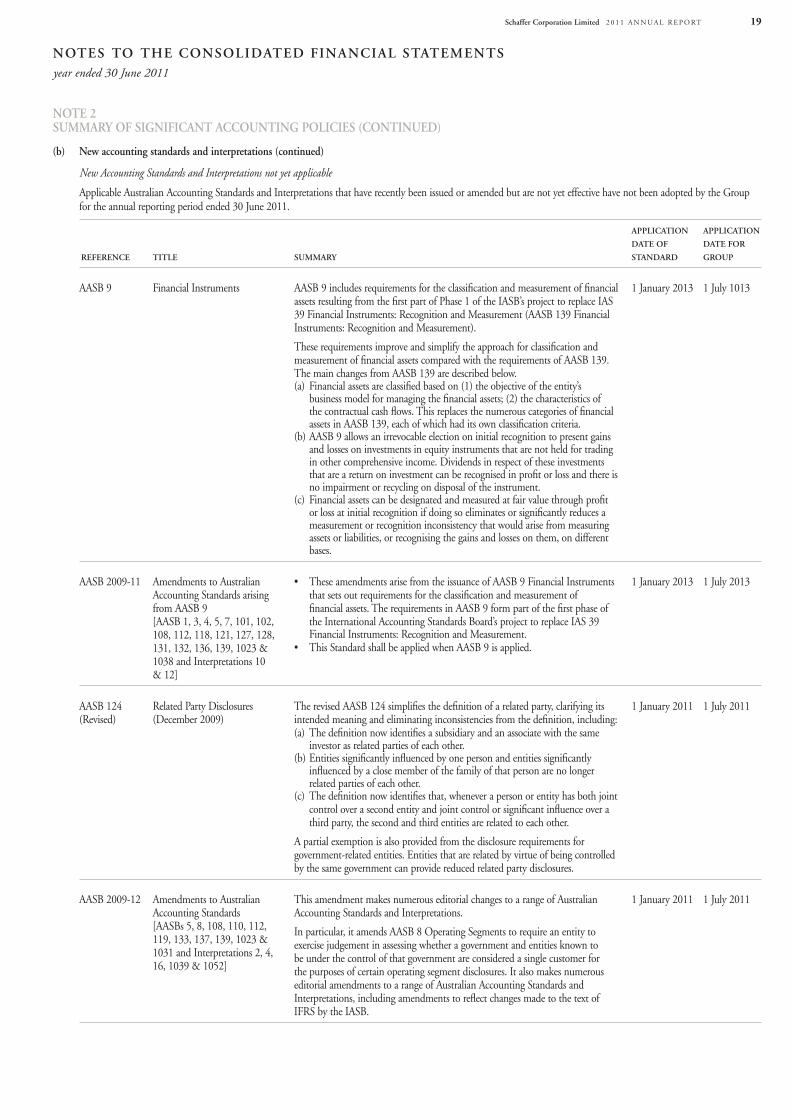
New Accounting Standards and Interpretations not yet applicable
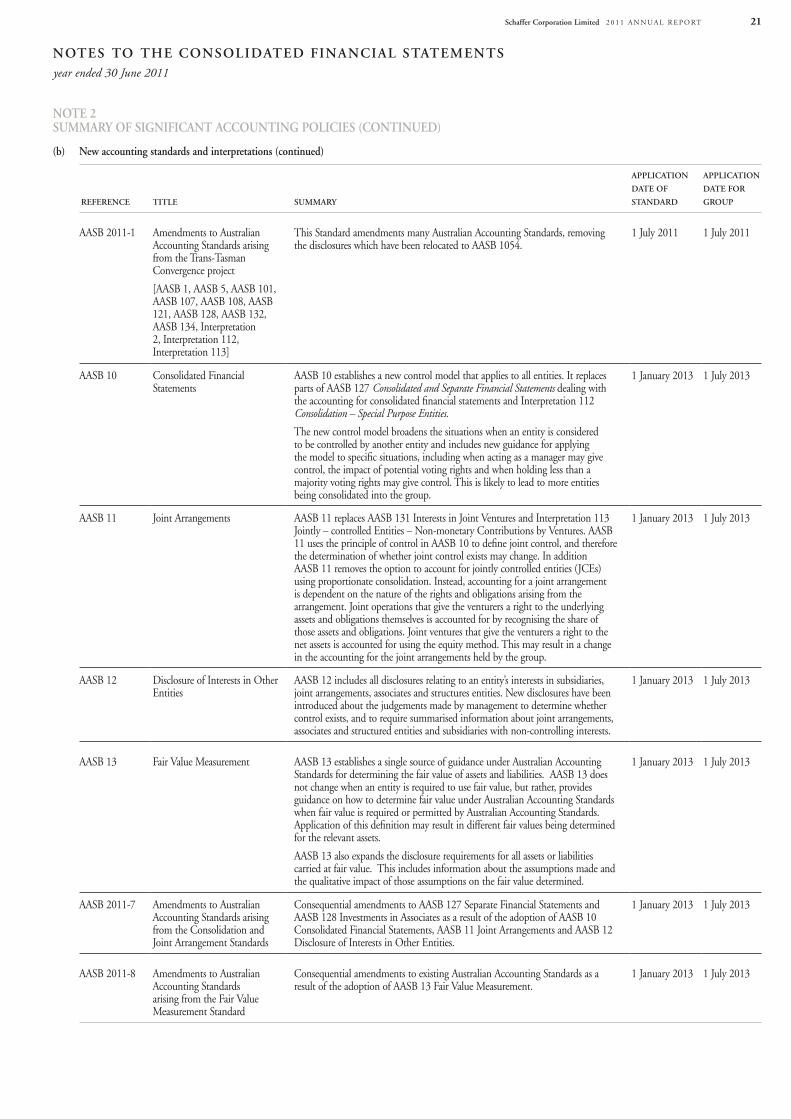
Applicable Australian Accounting Standards and Interpretations that have recently been issued or amended but are not yet effective have not been adopted by the Group for the annual reporting period ended 30 June 2011.
reFereNCe title summarY
appliCatioN
date oF
staNdard
appliCatioN
date For
group
AASB 9 Financial Instruments AASB 9 includes requirements for the classification and measurement of financial assets resulting from the first part of phase 1 of the IASB’s project to replace IAS 39 Financial Instruments: Recognition and Measurement (AASB 139 Financial Instruments: Recognition and Measurement).
these requirements improve and simplify the approach for classification and measurement of financial assets compared with the requirements of AASB 139. the main changes from AASB 139 are described below. (a) Financial assets are classified based on (1) the objective of the entity’s
business model for managing the financial assets; (2) the characteristics of the contractual cash flows. this replaces the numerous categories of financial assets in AASB 139, each of which had its own classification criteria.
(b) AASB 9 allows an irrevocable election on initial recognition to present gains and losses on investments in equity instruments that are not held for trading in other comprehensive income. Dividends in respect of these investments that are a return on investment can be recognised in profit or loss and there is no impairment or recycling on disposal of the instrument.
(c) Financial assets can be designated and measured at fair value through profit or loss at initial recognition if doing so eliminates or significantly reduces a measurement or recognition inconsistency that would arise from measuring assets or liabilities, or recognising the gains and losses on them, on different bases.
1 January 2013 1 July 1013
AASB 2009-11 Amendments to Australian Accounting Standards arising from AASB 9 [AASB 1, 3, 4, 5, 7, 101, 102, 108, 112, 118, 121, 127, 128, 131, 132, 136, 139, 1023 & 1038 and Interpretations 10 & 12]
• TheseamendmentsarisefromtheissuanceofAASB9FinancialInstrumentsthat sets out requirements for the classification and measurement of financial assets. the requirements in AASB 9 form part of the first phase of the International Accounting Standards Board’s project to replace IAS 39 Financial Instruments: Recognition and Measurement.
• ThisStandardshall be applied when AASB 9 is applied.
1 January 2013 1 July 2013
AASB 124 (Revised)
Related party Disclosures (December 2009)
the revised AASB 124 simplifies the definition of a related party, clarifying its intended meaning and eliminating inconsistencies from the definition, including:(a) the definition now identifies a subsidiary and an associate with the same
investor as related parties of each other.(b) entities significantly influenced by one person and entities significantly
influenced by a close member of the family of that person are no longer related parties of each other.
(c) the definition now identifies that, whenever a person or entity has both joint control over a second entity and joint control or significant influence over a third party, the second and third entities are related to each other.
A partial exemption is also provided from the disclosure requirements for government-related entities. entities that are related by virtue of being controlled by the same government can provide reduced related party disclosures.
1 January 2011 1 July 2011
AASB 2009-12 Amendments to Australian Accounting Standards [AASBs 5, 8, 108, 110, 112, 119, 133, 137, 139, 1023 & 1031 and Interpretations 2, 4, 16, 1039 & 1052]
this amendment makes numerous editorial changes to a range of Australian Accounting Standards and Interpretations.
In particular, it amends AASB 8 operating Segments to require an entity to exercise judgement in assessing whether a government and entities known to be under the control of that government are considered a single customer for the purposes of certain operating segment disclosures. It also makes numerous editorial amendments to a range of Australian Accounting Standards and Interpretations, including amendments to reflect changes made to the text of IFRS by the IASB.
1 January 2011 1 July 2011
Notes to the CoNsolidated FiNaNCial statemeNtsyear ended 30 June 2011
schaffer Corporation limited 2 0 1 1 A n n u A l R e p o Rt20
reFereNCe title summarY
appliCatioN
date oF
staNdard
appliCatioN
date For
group
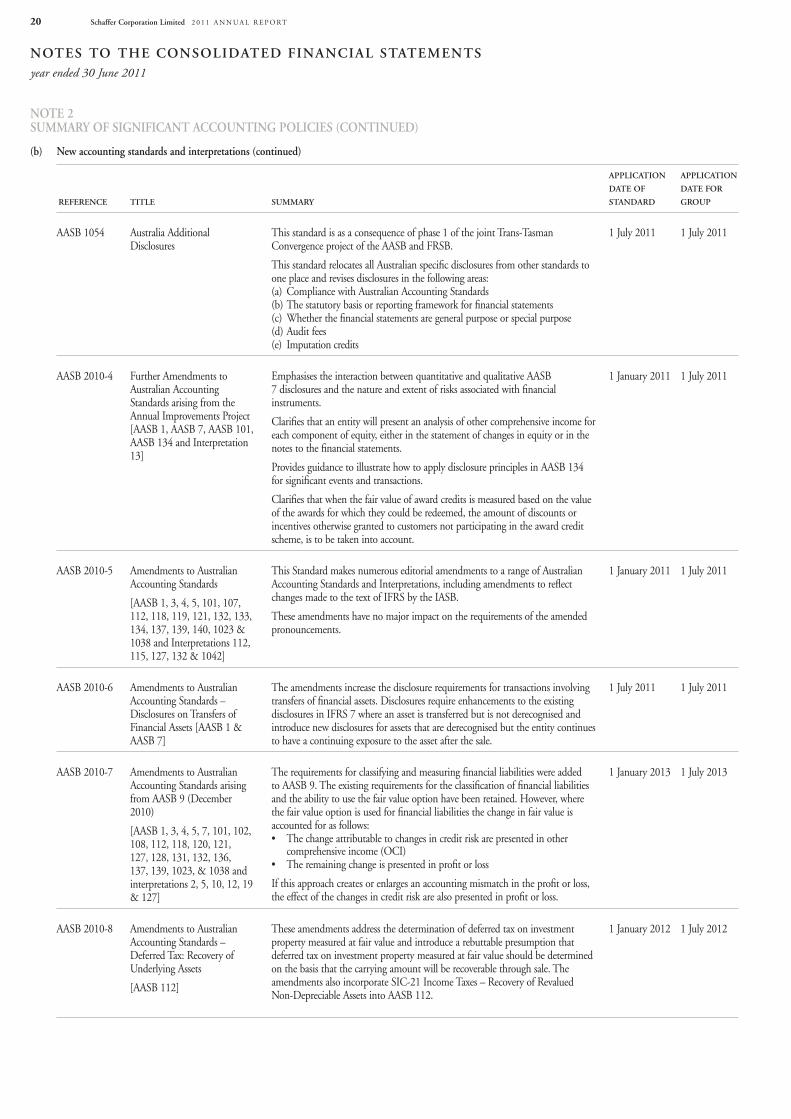
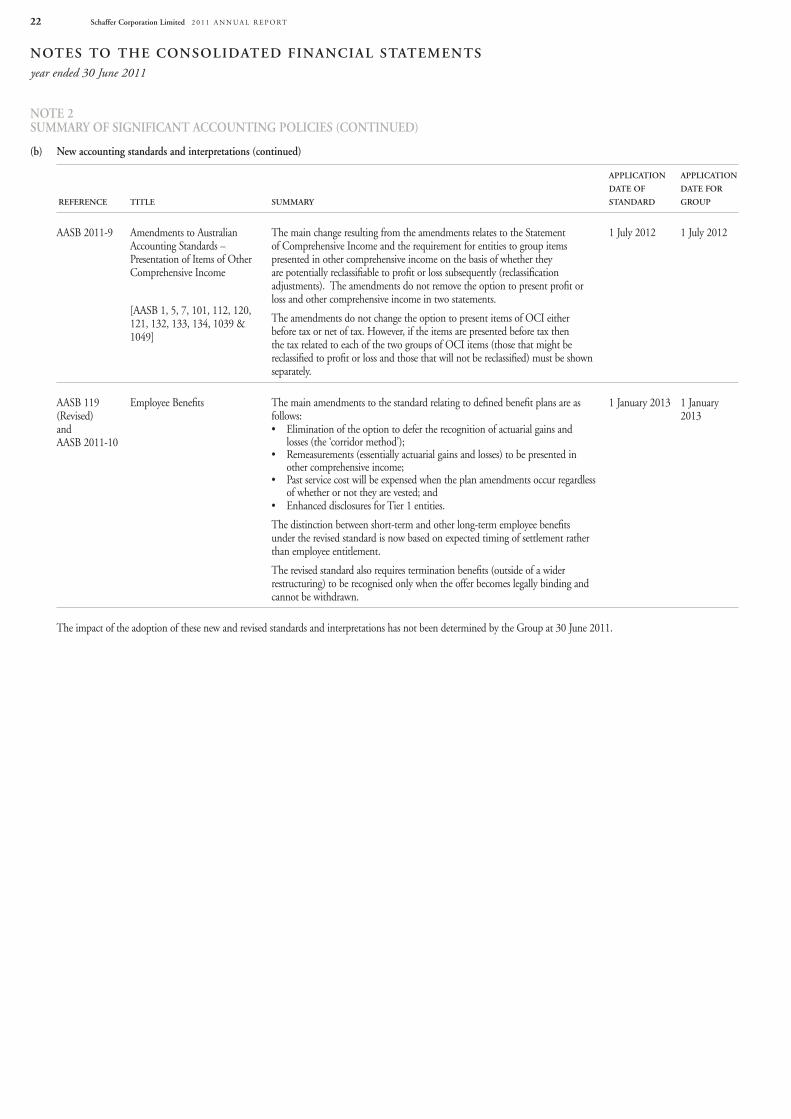
AASB 1054 Australia Additional Disclosures
this standard is as a consequence of phase 1 of the joint trans-tasman Convergence project of the AASB and FRSB.
this standard relocates all Australian specific disclosures from other standards to one place and revises disclosures in the following areas:(a) Compliance with Australian Accounting Standards(b) the statutory basis or reporting framework for financial statements(c) Whether the financial statements are general purpose or special purpose(d) Audit fees(e) Imputation credits
1 July 2011 1 July 2011
AASB 2010-4 Further Amendments to Australian Accounting Standards arising from the Annual Improvements project [AASB 1, AASB 7, AASB 101, AASB 134 and Interpretation 13]
emphasises the interaction between quantitative and qualitative AASB 7 disclosures and the nature and extent of risks associated with financial instruments.
Clarifies that an entity will present an analysis of other comprehensive income for each component of equity, either in the statement of changes in equity or in the notes to the financial statements.
provides guidance to illustrate how to apply disclosure principles in AASB 134 for significant events and transactions.
Clarifies that when the fair value of award credits is measured based on the value of the awards for which they could be redeemed, the amount of discounts or incentives otherwise granted to customers not participating in the award credit scheme, is to be taken into account.
1 January 2011 1 July 2011
AASB 2010-5 Amendments to Australian Accounting Standards
[AASB 1, 3, 4, 5, 101, 107, 112, 118, 119, 121, 132, 133, 134, 137, 139, 140, 1023 & 1038 and Interpretations 112, 115, 127, 132 & 1042]
this Standard makes numerous editorial amendments to a range of Australian Accounting Standards and Interpretations, including amendments to reflect changes made to the text of IFRS by the IASB.
these amendments have no major impact on the requirements of the amended pronouncements.
1 January 2011 1 July 2011
AASB 2010-6 Amendments to Australian Accounting Standards – Disclosures on transfers of Financial Assets [AASB 1 & AASB 7]
the amendments increase the disclosure requirements for transactions involving transfers of financial assets. Disclosures require enhancements to the existing disclosures in IFRS 7 where an asset is transferred but is not derecognised and introduce new disclosures for assets that are derecognised but the entity continues to have a continuing exposure to the asset after the sale.
1 July 2011 1 July 2011
AASB 2010-7 Amendments to Australian Accounting Standards arising from AASB 9 (December 2010)
[AASB 1, 3, 4, 5, 7, 101, 102, 108, 112, 118, 120, 121, 127, 128, 131, 132, 136, 137, 139, 1023, & 1038 and interpretations 2, 5, 10, 12, 19 & 127]
the requirements for classifying and measuring financial liabilities were added to AASB 9. the existing requirements for the classification of financial liabilities and the ability to use the fair value option have been retained. However, where the fair value option is used for financial liabilities the change in fair value is accounted for as follows:• Thechangeattributable to changes in credit risk are presented in other
comprehensive income (oCI)• Theremaining change is presented in profit or loss
If this approach creates or enlarges an accounting mismatch in the profit or loss, the effect of the changes in credit risk are also presented in profit or loss.
1 January 2013 1 July 2013
AASB 2010-8 Amendments to Australian Accounting Standards – Deferred tax: Recovery of underlying Assets
[AASB 112]
these amendments address the determination of deferred tax on investment property measured at fair value and introduce a rebuttable presumption that deferred tax on investment property measured at fair value should be determined on the basis that the carrying amount will be recoverable through sale. the amendments also incorporate SIC-21 Income taxes – Recovery of Revalued non-Depreciable Assets into AASB 112.
1 January 2012 1 July 2012
Note 2 summarY oF sigNiFiCaNt aCCouNtiNg poliCies (CoNtiNued)
(b) New accounting standards and interpretations (continued)
Notes to the CoNsolidated FiNaNCial statemeNtsyear ended 30 June 2011
schaffer Corporation limited 2 0 1 1 A n n u A l R e p o Rt 21
reFereNCe title summarY
appliCatioN
date oF
staNdard
appliCatioN
date For
group
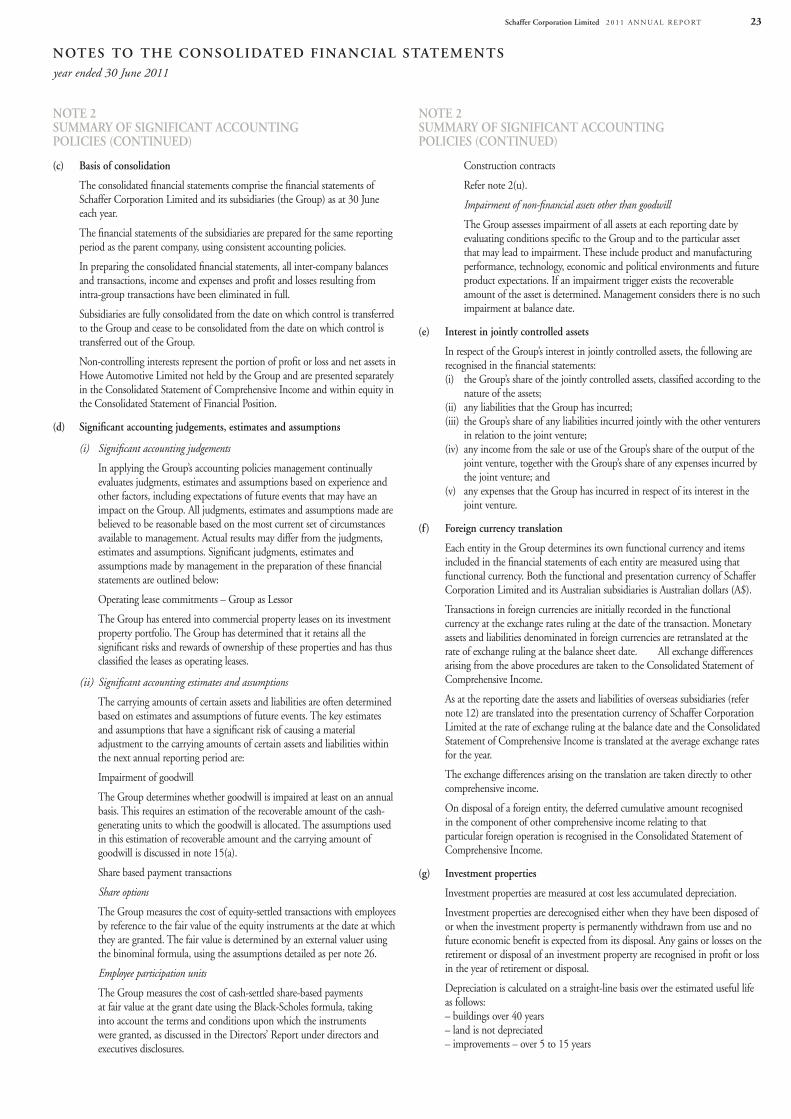
AASB 2011-1 Amendments to Australian Accounting Standards arising from the trans-tasman Convergence project
[AASB 1, AASB 5, AASB 101, AASB 107, AASB 108, AASB 121, AASB 128, AASB 132, AASB 134, Interpretation 2, Interpretation 112, Interpretation 113]
this Standard amendments many Australian Accounting Standards, removing the disclosures which have been relocated to AASB 1054.
1 July 2011 1 July 2011
AASB 10 Consolidated Financial Statements
AASB 10 establishes a new control model that applies to all entities. It replaces parts of AASB 127 Consolidated and Separate Financial Statements dealing with the accounting for consolidated financial statements and Interpretation 112 Consolidation – Special Purpose Entities.
the new control model broadens the situations when an entity is considered to be controlled by another entity and includes new guidance for applying the model to specific situations, including when acting as a manager may give control, the impact of potential voting rights and when holding less than a majority voting rights may give control. this is likely to lead to more entities being consolidated into the group.
1 January 2013 1 July 2013
AASB 11 Joint Arrangements AASB 11 replaces AASB 131 Interests in Joint ventures and Interpretation 113 Jointly – controlled entities – non-monetary Contributions by ventures. AASB 11 uses the principle of control in AASB 10 to define joint control, and therefore the determination of whether joint control exists may change. In addition AASB 11 removes the option to account for jointly controlled entities (JCes) using proportionate consolidation. Instead, accounting for a joint arrangement is dependent on the nature of the rights and obligations arising from the arrangement. Joint operations that give the venturers a right to the underlying assets and obligations themselves is accounted for by recognising the share of those assets and obligations. Joint ventures that give the venturers a right to the net assets is accounted for using the equity method. this may result in a change in the accounting for the joint arrangements held by the group.
1 January 2013 1 July 2013
AASB 12 Disclosure of Interests in other entities
AASB 12 includes all disclosures relating to an entity’s interests in subsidiaries, joint arrangements, associates and structures entities. new disclosures have been introduced about the judgements made by management to determine whether control exists, and to require summarised information about joint arrangements, associates and structured entities and subsidiaries with non-controlling interests.
1 January 2013 1 July 2013
AASB 13 Fair value Measurement AASB 13 establishes a single source of guidance under Australian Accounting Standards for determining the fair value of assets and liabilities. AASB 13 does not change when an entity is required to use fair value, but rather, provides guidance on how to determine fair value under Australian Accounting Standards when fair value is required or permitted by Australian Accounting Standards. Application of this definition may result in different fair values being determined for the relevant assets.
AASB 13 also expands the disclosure requirements for all assets or liabilities carried at fair value. this includes information about the assumptions made and the qualitative impact of those assumptions on the fair value determined.
1 January 2013 1 July 2013
AASB 2011-7 Amendments to Australian Accounting Standards arising from the Consolidation and Joint Arrangement Standards
Consequential amendments to AASB 127 Separate Financial Statements and AASB 128 Investments in Associates as a result of the adoption of AASB 10 Consolidated Financial Statements, AASB 11 Joint Arrangements and AASB 12 Disclosure of Interests in other entities.
1 January 2013 1 July 2013
AASB 2011-8 Amendments to Australian Accounting Standards arising from the Fair value Measurement Standard
Consequential amendments to existing Australian Accounting Standards as a result of the adoption of AASB 13 Fair value Measurement.
1 January 2013 1 July 2013
Note 2 summarY oF sigNiFiCaNt aCCouNtiNg poliCies (CoNtiNued)
(b) New accounting standards and interpretations (continued)
Notes to the CoNsolidated FiNaNCial statemeNtsyear ended 30 June 2011
schaffer Corporation limited 2 0 1 1 A n n u A l R e p o Rt22
reFereNCe title summarY
appliCatioN
date oF
staNdard
appliCatioN
date For
group
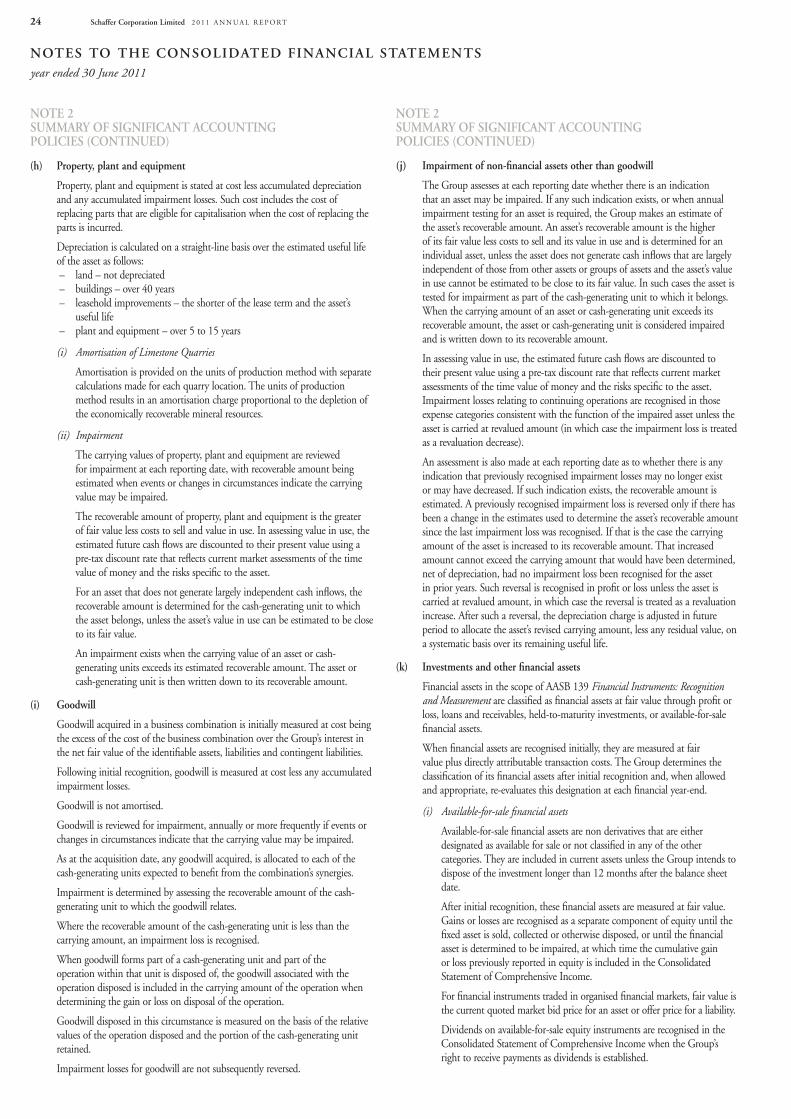
AASB 2011-9 Amendments to Australian Accounting Standards – presentation of Items of other Comprehensive Income
[AASB 1, 5, 7, 101, 112, 120, 121, 132, 133, 134, 1039 & 1049]
the main change resulting from the amendments relates to the Statement of Comprehensive Income and the requirement for entities to group items presented in other comprehensive income on the basis of whether they are potentially reclassifiable to profit or loss subsequently (reclassification adjustments). the amendments do not remove the option to present profit or loss and other comprehensive income in two statements.
the amendments do not change the option to present items of oCI either before tax or net of tax. However, if the items are presented before tax then the tax related to each of the two groups of oCI items (those that might be reclassified to profit or loss and those that will not be reclassified) must be shown separately.
1 July 2012 1 July 2012
AASB 119 (Revised) and AASB 2011-10
employee Benefits the main amendments to the standard relating to defined benefit plans are as follows:• Elimination of the option to defer the recognition of actuarial gains and
losses (the ‘corridor method’);• Remeasurements(essentiallyactuarialgainsandlosses)tobepresentedin
other comprehensive income; • Pastservicecostwillbeexpensedwhentheplanamendmentsoccurregardless
of whether or not they are vested; and• Enhanced disclosures for tier 1 entities.
the distinction between short-term and other long-term employee benefits under the revised standard is now based on expected timing of settlement rather than employee entitlement.
the revised standard also requires termination benefits (outside of a wider restructuring) to be recognised only when the offer becomes legally binding and cannot be withdrawn.
1 January 2013 1 January 2013
the impact of the adoption of these new and revised standards and interpretations has not been determined by the Group at 30 June 2011.
Note 2 summarY oF sigNiFiCaNt aCCouNtiNg poliCies (CoNtiNued)
(b) New accounting standards and interpretations (continued)
Notes to the CoNsolidated FiNaNCial statemeNtsyear ended 30 June 2011
schaffer Corporation limited 2 0 1 1 A n n u A l R e p o Rt 23
Construction contracts
Refer note 2(u).
Impairment of non-financial assets other than goodwill
the Group assesses impairment of all assets at each reporting date by evaluating conditions specific to the Group and to the particular asset that may lead to impairment. these include product and manufacturing performance, technology, economic and political environments and future product expectations. If an impairment trigger exists the recoverable amount of the asset is determined. Management considers there is no such impairment at balance date.
(e) interest in jointly controlled assets
In respect of the Group’s interest in jointly controlled assets, the following are recognised in the financial statements:(i) the Group’s share of the jointly controlled assets, classified according to the
nature of the assets;(ii) any liabilities that the Group has incurred;(iii) the Group’s share of any liabilities incurred jointly with the other venturers
in relation to the joint venture;(iv) any income from the sale or use of the Group’s share of the output of the
joint venture, together with the Group’s share of any expenses incurred by the joint venture; and
(v) any expenses that the Group has incurred in respect of its interest in the joint venture.
(f) Foreign currency translation
each entity in the Group determines its own functional currency and items included in the financial statements of each entity are measured using that functional currency. Both the functional and presentation currency of Schaffer Corporation limited and its Australian subsidiaries is Australian dollars (A$).
transactions in foreign currencies are initially recorded in the functional currency at the exchange rates ruling at the date of the transaction. Monetary assets and liabilities denominated in foreign currencies are retranslated at the rate of exchange ruling at the balance sheet date. All exchange differences arising from the above procedures are taken to the Consolidated Statement of Comprehensive Income.
As at the reporting date the assets and liabilities of overseas subsidiaries (refer note 12) are translated into the presentation currency of Schaffer Corporation limited at the rate of exchange ruling at the balance date and the Consolidated Statement of Comprehensive Income is translated at the average exchange rates for the year.
the exchange differences arising on the translation are taken directly to other comprehensive income.
on disposal of a foreign entity, the deferred cumulative amount recognised in the component of other comprehensive income relating to that particular foreign operation is recognised in the Consolidated Statement of Comprehensive Income.
(g) investment properties
Investment properties are measured at cost less accumulated depreciation.
Investment properties are derecognised either when they have been disposed of or when the investment property is permanently withdrawn from use and no future economic benefit is expected from its disposal. Any gains or losses on the retirement or disposal of an investment property are recognised in profit or loss in the year of retirement or disposal.
Depreciation is calculated on a straight-line basis over the estimated useful life as follows:– buildings over 40 years– land is not depreciated– improvements – over 5 to 15 years
(c) Basis of consolidation
the consolidated financial statements comprise the financial statements of Schaffer Corporation limited and its subsidiaries (the Group) as at 30 June each year.
the financial statements of the subsidiaries are prepared for the same reporting period as the parent company, using consistent accounting policies.
In preparing the consolidated financial statements, all inter-company balances and transactions, income and expenses and profit and losses resulting from intra-group transactions have been eliminated in full.
Subsidiaries are fully consolidated from the date on which control is transferred to the Group and cease to be consolidated from the date on which control is transferred out of the Group.
non-controlling interests represent the portion of profit or loss and net assets in Howe Automotive limited not held by the Group and are presented separately in the Consolidated Statement of Comprehensive Income and within equity in the Consolidated Statement of Financial position.
(d) significant accounting judgements, estimates and assumptions
(i) Significant accounting judgements
In applying the Group’s accounting policies management continually evaluates judgments, estimates and assumptions based on experience and other factors, including expectations of future events that may have an impact on the Group. All judgments, estimates and assumptions made are believed to be reasonable based on the most current set of circumstances available to management. Actual results may differ from the judgments, estimates and assumptions. Significant judgments, estimates and assumptions made by management in the preparation of these financial statements are outlined below:
operating lease commitments – Group as lessor
the Group has entered into commercial property leases on its investment property portfolio. the Group has determined that it retains all the significant risks and rewards of ownership of these properties and has thus classified the leases as operating leases.
(ii) Significant accounting estimates and assumptions
the carrying amounts of certain assets and liabilities are often determined based on estimates and assumptions of future events. the key estimates and assumptions that have a significant risk of causing a material adjustment to the carrying amounts of certain assets and liabilities within the next annual reporting period are:
Impairment of goodwill
the Group determines whether goodwill is impaired at least on an annual basis. this requires an estimation of the recoverable amount of the cash-generating units to which the goodwill is allocated. the assumptions used in this estimation of recoverable amount and the carrying amount of goodwill is discussed in note 15(a).
Share based payment transactions
Share options
the Group measures the cost of equity-settled transactions with employees by reference to the fair value of the equity instruments at the date at which they are granted. the fair value is determined by an external valuer using the binominal formula, using the assumptions detailed as per note 26.
Employee participation units
the Group measures the cost of cash-settled share-based payments at fair value at the grant date using the Black-Scholes formula, taking into account the terms and conditions upon which the instruments were granted, as discussed in the Directors’ Report under directors and executives disclosures.
Note 2 summarY oF sigNiFiCaNt aCCouNtiNg poliCies (CoNtiNued)
Note 2 summarY oF sigNiFiCaNt aCCouNtiNg poliCies (CoNtiNued)
Notes to the CoNsolidated FiNaNCial statemeNtsyear ended 30 June 2011
schaffer Corporation limited 2 0 1 1 A n n u A l R e p o Rt24
(j) impairment of non-financial assets other than goodwill
the Group assesses at each reporting date whether there is an indication that an asset may be impaired. If any such indication exists, or when annual impairment testing for an asset is required, the Group makes an estimate of the asset’s recoverable amount. An asset’s recoverable amount is the higher of its fair value less costs to sell and its value in use and is determined for an individual asset, unless the asset does not generate cash inflows that are largely independent of those from other assets or groups of assets and the asset’s value in use cannot be estimated to be close to its fair value. In such cases the asset is tested for impairment as part of the cash-generating unit to which it belongs. When the carrying amount of an asset or cash-generating unit exceeds its recoverable amount, the asset or cash-generating unit is considered impaired and is written down to its recoverable amount.
In assessing value in use, the estimated future cash flows are discounted to their present value using a pre-tax discount rate that reflects current market assessments of the time value of money and the risks specific to the asset. Impairment losses relating to continuing operations are recognised in those expense categories consistent with the function of the impaired asset unless the asset is carried at revalued amount (in which case the impairment loss is treated as a revaluation decrease).
An assessment is also made at each reporting date as to whether there is any indication that previously recognised impairment losses may no longer exist or may have decreased. If such indication exists, the recoverable amount is estimated. A previously recognised impairment loss is reversed only if there has been a change in the estimates used to determine the asset’s recoverable amount since the last impairment loss was recognised. If that is the case the carrying amount of the asset is increased to its recoverable amount. that increased amount cannot exceed the carrying amount that would have been determined, net of depreciation, had no impairment loss been recognised for the asset in prior years. Such reversal is recognised in profit or loss unless the asset is carried at revalued amount, in which case the reversal is treated as a revaluation increase. After such a reversal, the depreciation charge is adjusted in future period to allocate the asset’s revised carrying amount, less any residual value, on a systematic basis over its remaining useful life.
(k) investments and other financial assets
Financial assets in the scope of AASB 139 Financial Instruments: Recognition and Measurement are classified as financial assets at fair value through profit or loss, loans and receivables, held-to-maturity investments, or available-for-sale financial assets.
When financial assets are recognised initially, they are measured at fair value plus directly attributable transaction costs. the Group determines the classification of its financial assets after initial recognition and, when allowed and appropriate, re-evaluates this designation at each financial year-end.
(i) Available-for-sale financial assets
Available-for-sale financial assets are non derivatives that are either designated as available for sale or not classified in any of the other categories. they are included in current assets unless the Group intends to dispose of the investment longer than 12 months after the balance sheet date.
After initial recognition, these financial assets are measured at fair value. Gains or losses are recognised as a separate component of equity until the fixed asset is sold, collected or otherwise disposed, or until the financial asset is determined to be impaired, at which time the cumulative gain or loss previously reported in equity is included in the Consolidated Statement of Comprehensive Income.
For financial instruments traded in organised financial markets, fair value is the current quoted market bid price for an asset or offer price for a liability.
Dividends on available-for-sale equity instruments are recognised in the Consolidated Statement of Comprehensive Income when the Group’s right to receive payments as dividends is established.
(h) property, plant and equipment
property, plant and equipment is stated at cost less accumulated depreciation and any accumulated impairment losses. Such cost includes the cost of replacing parts that are eligible for capitalisation when the cost of replacing the parts is incurred.
Depreciation is calculated on a straight-line basis over the estimated useful life of the asset as follows: – land – not depreciated – buildings – over 40 years – leasehold improvements – the shorter of the lease term and the asset’s
useful life – plant and equipment – over 5 to 15 years
(i) Amortisation of Limestone Quarries
Amortisation is provided on the units of production method with separate calculations made for each quarry location. the units of production method results in an amortisation charge proportional to the depletion of the economically recoverable mineral resources.
(ii) Impairment
the carrying values of property, plant and equipment are reviewed for impairment at each reporting date, with recoverable amount being estimated when events or changes in circumstances indicate the carrying value may be impaired.
the recoverable amount of property, plant and equipment is the greater of fair value less costs to sell and value in use. In assessing value in use, the estimated future cash flows are discounted to their present value using a pre-tax discount rate that reflects current market assessments of the time value of money and the risks specific to the asset.
For an asset that does not generate largely independent cash inflows, the recoverable amount is determined for the cash-generating unit to which the asset belongs, unless the asset’s value in use can be estimated to be close to its fair value.
An impairment exists when the carrying value of an asset or cash-generating units exceeds its estimated recoverable amount. the asset or cash-generating unit is then written down to its recoverable amount.
(i) goodwill
Goodwill acquired in a business combination is initially measured at cost being the excess of the cost of the business combination over the Group’s interest in the net fair value of the identifiable assets, liabilities and contingent liabilities.
Following initial recognition, goodwill is measured at cost less any accumulated impairment losses.
Goodwill is not amortised.
Goodwill is reviewed for impairment, annually or more frequently if events or changes in circumstances indicate that the carrying value may be impaired.
As at the acquisition date, any goodwill acquired, is allocated to each of the cash-generating units expected to benefit from the combination’s synergies.
Impairment is determined by assessing the recoverable amount of the cash-generating unit to which the goodwill relates.
Where the recoverable amount of the cash-generating unit is less than the carrying amount, an impairment loss is recognised.
When goodwill forms part of a cash-generating unit and part of the operation within that unit is disposed of, the goodwill associated with the operation disposed is included in the carrying amount of the operation when determining the gain or loss on disposal of the operation.
Goodwill disposed in this circumstance is measured on the basis of the relative values of the operation disposed and the portion of the cash-generating unit retained.
Impairment losses for goodwill are not subsequently reversed.
Note 2 summarY oF sigNiFiCaNt aCCouNtiNg poliCies (CoNtiNued)
Note 2 summarY oF sigNiFiCaNt aCCouNtiNg poliCies (CoNtiNued)
Notes to the CoNsolidated FiNaNCial statemeNtsyear ended 30 June 2011
schaffer Corporation limited 2 0 1 1 A n n u A l R e p o Rt 25
(n) Cash and cash equivalents
For the purposes of the Consolidated Statement of Cash Flows and Consolidated Statement of Financial position, cash and cash equivalents includes cash on hand and in banks, and money market investments readily convertible to cash within two workings days. the carrying amount approximates fair value because of their short term to maturity.
(o) interest-bearing loans and borrowings
All loans and borrowings are initially recognised at the fair value of the consideration received less directly attributable transaction costs.
After initial recognition, interest-bearing loans and borrowings are subsequently measured at amortised cost using the effective interest method.
Gains and losses are recognised in profit or loss when the liabilities are derecognised.
(p) provisions
provisions are recognised when the Group has a present obligation (legal or constructive) as a result of a past event, it is probable that an outflow of resources embodying economic benefits will be required to settle the obligation and a reliable estimate can be made of the amount of the obligation.
Where the Group expects some or all of a provision to be reimbursed, for example under an insurance contract, the reimbursement is recognised as a separate asset but only when the reimbursement is virtually certain. the expense relating to any provision is presented in the Statement of Comprehensive Income net of any reimbursement.
If the effect of the time value of money is material, provisions are determined by discounting the expected future cash flows at a pre-tax rate that reflects current market assessments of the time value of money and, where appropriate, the risks specific to the liability.
Where discounting is used, the increase in the provision due to the passage of time is recognised as a finance cost.
Restructure provisions
provisions relating to restructures are recognised when:• the Group has a detailed formal plan for the restructuring; and• has raised a valid expectation in those affected that it will carry out the
restructuring by starting to implement it or by announcing its main features to those affected.
(q) employee entitlements
provision is made for employee entitlement benefits accumulated as a result of employees rendering services up to the reporting date. these benefits include wages and salaries, annual leave and long service leave. liabilities arising in respect of wages and salaries, annual leave and any other employee entitlements expected to be settled within twelve months of the reporting date are measured at the amounts expected to be settled. All other employee entitlement liabilities are measured at the present value of the estimated future cash outflows to be made in respect of services provided by employees up to the reporting date. In determining the present value of future cash outflows, the interest rates attaching to national government bonds securities which have terms to maturity approximating the terms of the related liability are used. employee entitlements, expenses and revenues arising in respect of the following categories:• Wages and salaries, non monetary benefits, annual leave, long service leave
and other leave entitlements; • Othertypesofemployeeentitlements;
are charged against profits on a net basis in their respective categories.
Contributions to defined contribution superannuation plans are expensed when incurred.
purchases and sales of financial assets that require delivery of assets within the time frame generally established by regulation or convention in the market place are recognised on the trade date i.e. the date that the Group commits to purchase the asset.
(ii) Loans and receivables
loans and receivables are non-derivative financial assets with fixed or determinable payments that are not quoted in an active market. Such assets are carried at amortised cost using the effective interest method. Gains and losses are recognised in profit or loss when the loans and receivables are derecognised or impaired, as well as through the amortisation process.
(l) inventories
Inventories are valued at the lower of cost and net realisable value except contract work in progress.
Costs incurred in bringing each product to its present location and condition, are accounted for as follows:
Raw materials – purchase cost on a first-in, first-out basis.
Finished goods – cost of direct materials and labour and a proportion of manufacturing overheads based on normal operating capacity but excluding borrowing costs. Costs are assigned on the first-in first-out basis.
net realisable value is the estimated selling price in the ordinary course of business, less estimated costs of completion and the estimated costs necessary to make the sale.
Contract work in progress
Contract work in progress for the construction of precast concrete elements within the Building Materials segment is stated at cost plus profit recognised to date calculated in accordance with the percentage of completion method, less a provision for foreseeable losses and progress payments received to date.
A contract is not considered complete until the defects liability period has expired and monies withheld have been received. Any expected losses on a contract are recognised immediately in the period the loss becomes foreseeable. that is, when it becomes probable that total contract costs will exceed total contract revenues.
Cost includes all variable and fixed costs directly related to specific construction contracts, those costs related to contract activity in general which can be allocated to specific contracts on a reasonable basis and other costs specifically chargeable under the contract. Also included are costs expected to be incurred under penalty clauses and rectification provisions.
the gross amount due from customers for contract work for all contracts in progress for which costs incurred plus recognised profits (less recognised losses) exceed progress billings, is generally presented as an asset. progress billings not yet paid by customers and retention are included within the “trade and other Receivables” balance.
the gross amount due to customers for contract work for all contracts in progress for which progress billings exceed costs incurred plus recognised profits (less recognised losses) are presented as current liabilities.
(m) trade and other receivables
trade receivables, which generally have 30-90 day terms, are recognised and carried at original invoice amount less an allowance for any uncollectible amounts. the carrying amount approximates fair value.
Collectability of trade receivables is reviewed on an ongoing basis at an operating unit level. Individual debts that are known to be uncollectable are written off when identified. An impairment provision is recognised when there is objective evidence that the Group will not be able to collect the receivable. Financial difficulties of the debtor or default payments are considered objective evidence of impairment. the amount of the impairment loss is the receivable carrying amount.
Note 2 summarY oF sigNiFiCaNt aCCouNtiNg poliCies (CoNtiNued)
Note 2 summarY oF sigNiFiCaNt aCCouNtiNg poliCies (CoNtiNued)
Notes to the CoNsolidated FiNaNCial statemeNtsyear ended 30 June 2011
schaffer Corporation limited 2 0 1 1 A n n u A l R e p o Rt26
An epu provides an employee with a right on termination of employment under certain conditions and in certain other circumstances to receive a cash payment from Howe Automotive limited. Schaffer Corporation limited has the option to compel the employee to use the whole or part of that cash payment to subscribe for Schaffer Corporation limited shares.
the cost of these equity-settled transactions with employees is measured by reference to the fair value at the date at which they are granted. the fair value is determined by an external valuer using a binominal model.
In valuing equity-settled transactions, no account is taken of any performance conditions, other than conditions linked to the price of the shares of Schaffer Corporation limited (“market conditions”).
the cost of equity-settled transactions is recognised, together with a corresponding increase in equity, over the period in which the performance conditions are fulfilled, ending on the date on which the relevant employees become fully entitled to the award (“vesting date”).
the cumulative expense recognised for equity-settled transactions at each reporting date until vesting date reflects (i) the extent to which the vesting period has expired and (ii) the Group’s best estimate of the number of equity instruments that will ultimately vest. no adjustment is made for the likelihood of market performance conditions being met as the effect of these conditions is included in the determination of fair value at grant date. the Consolidated Statement of Comprehensive Income charge or credit for a period represents the movement in cumulative expense recognised as at the beginning and end of that period.
If the terms of an equity-settled award are modified, as a minimum an expense is recognised as if the terms had not been modified. An additional expense is recognised for any modification that increases the total fair value of the share-based payment arrangement, or is otherwise beneficial to the employee, as measured at the date of modification.
If an equity-settled award is cancelled, it is treated as if it had vested on the date of cancellation, and any expense not yet recognised for the award is recognised immediately. However, if a new award is substituted for the cancelled award and designated as a replacement award on the date that it is granted, the cancelled and new award are treated as if they were a modification of the original award, as described in the previous paragraph.
(t) leases
the determination of whether an arrangement is or contains a lease is based on the substance of the arrangement and requires an assessment of whether the fulfilment of the arrangements is dependent on the use of a specific asset or assets and the arrangement conveys a right to use the asset.
(i) Group as Lessee
Finance leases, which transfer to the Group substantially all the risks and benefits incidental to ownership of the leased item, are capitalised at the inception of the lease at the fair value of the leased property or, if lower, at the present value of the minimum lease payments.
lease payments are apportioned between the finance charges and reduction of the lease liability so as to achieve a constant rate of interest on the remaining balance of the liability. Finance charges are recognised as an expense in profit or loss.
Capitalised leased assets are depreciated over the shorter of the estimated useful life of the asset or the lease term.
operating lease payments are recognised as an expense in the Consolidated Statement of Comprehensive Income on a straight-line basis over the lease term.
(ii) Group as Lessor
leases where the Group retains substantially all the risks and benefits of ownership of the asset are classified as operating leases. Initial direct costs incurred in negotiating an operating lease are added to the carrying amount of the leased asset and recognised over the lease term on the same basis as the rental income.
(r) executive share option arrangement
the directors of Schaffer Corporation limited may grant in their absolute discretion, without payment, share options to employees under an employee share scheme approved by shareholders at the annual general meeting in november 1999. each option is convertible into one ordinary share of Schaffer Corporation limited on payment of the exercise price, after a vesting period, but prior to the expiry date.
the exercise price is determined at the grant date at the absolute discretion of the directors but not less than the greater of:(1) the weighted average of the last sale price on the Australian Stock
exchange limited of the shares in the Company for each of the five trading days on which a sale of the Company’s shares was effected immediately preceding the date on which any options are issued to any participant; and
(2) 20 cents.
the options hold no voting or dividend rights, and are not transferable. Schaffer Corporation limited does not provide any loans or guarantees to enable executives to finance the exercise of their options. When an executive ceases to be employed by the entity any unexercised options automatically lapse and are forfeited.
the cost of these equity-settled transactions with employees is measured by reference to the fair value at the date at which they are granted. the fair value is determined by an external valuer using a Black-Scholes model.
In valuing equity-settled transactions, no account is taken of any performance conditions, other than conditions linked to the price of the shares of Schaffer Corporation limited (“market conditions”).
the cost of equity-settled transactions is recognised, together with a corresponding increase in equity, over the period in which the performance conditions are fulfilled, ending on the date on which the relevant employees become fully entitled to the award (“vesting date”).
the cumulative expense recognised for equity-settled transactions at each reporting date until vesting date reflects (i) the extent to which the vesting period has expired and (ii) the Group’s best estimate of the number of equity instruments that will ultimately vest. no adjustment is made for the likelihood of market performance conditions being met as the effect of these conditions is included in the determination of fair value at grant date. the Consolidated Statement of Comprehensive Income charge or credit for a period represents the movement in cumulative expense recognised as at the beginning and end of that period.
no expense is recognised for awards that do not ultimately vest, except for awards where vesting is only conditional upon a market condition.
If the terms of an equity-settled award are modified, as a minimum an expense is recognised as if the terms had not been modified. In addition, an expense is recognised for any modification that increases the total fair value of the share-based payment arrangement, or is otherwise beneficial to the employee, as measured at the date of modification.
If an equity-settled award is cancelled, it is treated as if it had vested on the date of cancellation, and any expense not yet recognised for the award is recognised immediately. However, if a new award is substituted for the cancelled award and designated as a replacement award on the date that it is granted, the cancelled and new award are treated as if they were a modification of the original award, as described in the previous paragraph.
the dilutive effect, if any, of outstanding options is reflected as additional share dilution in the computation of earnings per share (see note 31).
(s) employee participation units
A controlled entity Howe Automotive limited (HA) may grant employee participation units (epus) in accordance with its employee Incentive plan adopted by HA shareholders on 20 December 2001. For conditions refer to note 26.
Note 2 summarY oF sigNiFiCaNt aCCouNtiNg poliCies (CoNtiNued)
Note 2 summarY oF sigNiFiCaNt aCCouNtiNg poliCies (CoNtiNued)
Notes to the CoNsolidated FiNaNCial statemeNtsyear ended 30 June 2011
schaffer Corporation limited 2 0 1 1 A n n u A l R e p o Rt 27
Deferred income tax assets are recognised for all deductible temporary differences, carry-forward of unused tax assets and unused tax losses, to the extent that it is probable that taxable profit will be available against which the deductible temporary differences, and the carry-forward of unused tax credits and unused tax losses can be utilised except:• wherethedeferredincometaxassetrelatingtothedeductibletemporary
differences arises from the initial recognition of an asset or liability in a transaction that is not a business combination and, at the time of the transaction, affects neither the accounting profit nor taxable profit or loss; or
• wherethedeductibletemporarydifferencesisassociatedwithinvestmentsin subsidiaries, or interests in joint ventures, in which case a deferred tax asset is only recognised to the extent that it is probable that the temporary differences will reverse in the foreseeable future and taxable profit will be available against which the temporary difference can be utilised.
the carrying amount of deferred income tax assets is reviewed at each balance date and reduced to the extent that it is no longer probable that sufficient taxable profit will be available to allow all or part of the deferred income tax asset to be utilised.
unrecognised deferred income tax assets are reassessed at each balance date and are recognised to the extent that it has become probable that future taxable profit will allow the deferred tax asset to be recovered.
Deferred income tax assets and liabilities are measured at the tax rates that are expected to apply to the year when the asset is realised or the liability is settled, based on tax rates (and tax laws) that have been enacted or substantively enacted at the balance date.
Income taxes relating to items recognised directly in equity are recognised in equity and not in the profit or loss.
Deferred tax assets and deferred tax liabilities are offset only if a legally enforceable right exists to set off current tax assets against current tax liabilities and the deferred tax assets and liabilities relate to the same taxable entity and the same taxation authority.
the Company and all its wholly-owned Australian resident subsidiaries are part of a tax consolidated group. the Company, being the head entity in a tax consolidated group, assumes the current tax liability and any deferred tax assets arising from tax losses and other unused tax credits of the subsidiaries in the tax consolidated group. Deferred tax balances of the subsidiaries in the tax consolidated group are not assumed by the parent entity.
the Group allocates the tax balances for the period using a method that is systematic, rational and consistent with the broad principles of AASB 112, the group allocation approach, and a tax funding arrangement is in place to reimburse the parent entity for any liabilities of the subsidiaries it assumes and conversely, for the parent entity to reimburse the subsidiaries for any recognised tax losses it assumes.
(w) other taxesRevenues, expenses and assets are recognised net of the amount of GSt except:• where the GSt incurred on a purchase of goods and services is not
recoverable from the taxation authority, in which case the GSt is recognised as part of the cost of acquisition of the asset or as part of the expense item as applicable; and
• receivables and payables are stated with the amount of GSt included.
the net amount of GSt recoverable from, or payable to, the taxation authority is included as part of receivables or payables in the Consolidated Statement of Financial position.
Cash flows are included in the Consolidated Statement of Cash Flows on a gross basis and the GSt component of cash flows arising from investing and financing activities, which is recoverable from, or payable to, the taxation authority are classified as operating cash flows.
Commitments and contingencies are disclosed net of the amount of GSt recoverable from, or payable to, the taxation authority.
(u) revenue recognition
Revenue is recognised and measured at the fair value of the consideration received or receivable to the extent it is probable that the economic benefits will flow to the Group and the revenue can be reliably measured. the following specific recognition criteria must also be met before revenue is recognised:
Sale of Goods
Revenue is recognised when the significant risks and rewards of ownership of the goods have passed to the buyer and can be measured reliably. Risks and rewards are considered passed to the buyer at the time control of the goods has passed to the customer.
Interest income
Revenue is recognised as the interest accrues (using the effective interest method, which is the rate that exactly discounts estimated future cash receipts through the expected life of the financial instrument to the net carrying amount of the financial asset.)
Dividends
Revenue is recognised when the shareholders’ right to receive the payment is established.
Rental income
Rental income arising on investment properties is accounted for on a straight-line basis over the lease term. Contingent rental income is recognised as income in the periods in which it is earned.
Sale of land
Revenue on the sale of land is brought to account when the sale is unconditional.
Construction contracts
For construction contracts, revenues and expenses are recognised on an individual contract basis using the percentage of completion method. once the outcome of a construction contract can be estimated reliably based on a review of the terms and conditions applicable to each individual contract, contract revenues and expenses are recognised in the Consolidated Statement of Comprehensive Income in proportion to the stage of completion of the contract. the stage of completion is measured by reference to actual costs incurred to date as a percentage of estimated total costs for each contract. the Group has determined that the outcome of its construction contracts can usually be reliably estimated at the commencement of the contract. Where the outcome of a contract cannot be reliably determined, contract costs are expensed as incurred. Where it is probable that the costs will be recovered, revenue is recognised to the extent of costs incurred. Where it is probable that a loss will arise from a construction contract, the excess of total expected costs over revenue is recognised as an expense immediately.
(v) income tax
Current tax assets and liabilities for the current and prior periods are measured at the amount expected to be recovered from or paid to the taxation authorities. the tax rates and tax laws used to compute the amount are those that are enacted or substantively enacted by the balance date.
Deferred income tax is provided on all temporary differences at the balance date between the tax bases of assets and liabilities and their carrying amounts for financial reporting purposes.
Deferred income tax liabilities are recognised for all taxable temporary differences except:• wherethedeferredincometaxliabilityarisesfromtheinitialrecognition
of goodwill or of an asset or liability in a transaction that is not a business combination and that at the time of the transaction, affects neither the accounting profit nor taxable profit or loss; or
• wheretaxabletemporarydifferencesassociatedwithinvestmentsinsubsidiaries, associates and interests in joint ventures, and the timing of the reversal of the temporary differences can be controlled and it is probable that the temporary differences will not reverse in the foreseeable future.
Note 2 summarY oF sigNiFiCaNt aCCouNtiNg poliCies (CoNtiNued)
Note 2 summarY oF sigNiFiCaNt aCCouNtiNg poliCies (CoNtiNued)
Notes to the CoNsolidated FiNaNCial statemeNtsyear ended 30 June 2011
schaffer Corporation limited 2 0 1 1 A n n u A l R e p o Rt28
(x) derivative financial instruments
the Group uses derivative financial instruments such as forward currency contracts and interest rate swaps to manage its risks associated with foreign currency and interest rate fluctuations. Such derivative financial instruments are initially recognised at fair value on the date on which a derivative contract is entered into and are subsequently remeasured to fair value. Derivatives are carried as assets when their fair value is positive and as liabilities when their fair value is negative.
the Group has determined that these derivatives do not qualify for hedge accounting and as such, any gains or losses arising from changes in fair value are taken directly to the Consolidated Statement of Comprehensive Income.
Forward exchange contracts
the fair value of forward currency contracts is calculated by reference to current forward exchange rates for contracts with similar maturity profiles.
Interest rate swaps
the fair value of interest rate swap contracts is determined by reference to market values for similar instruments.
(y) Contributed equity
ordinary shares are classified as equity. Incremental costs directly attributable to the issue of new shares or options are shown in equity as a deduction, net of tax, from the proceeds.
(z) earnings per share
Basic earnings per share is calculated as net profit attributable to members of the parent adjusted to exclude costs of servicing equity (other than dividends) and preference share dividends, divided by the weighted average number of ordinary shares outstanding during the period, adjusted for any bonus element. Diluted earnings per share, is calculated as net profit attributable to members adjusted for:• costsofservicingequity(otherthandividends)andpreferenceshare
dividends;• theaftertaxeffectofdividendsandinterestassociatedwithdilutive
potential ordinary shares that have been recognised as expenses; and• othernon-discretionarychangesinrevenuesorexpensesduringtheperiod
that would result from the dilution of potential ordinary shares;
divided by the weighted average number of ordinary shares outstanding during the period and dilutive potential ordinary shares, adjusted for any bonus element.
(aa) Borrowing costs
Borrowing costs directly attributable to the acquisition, construction or production of a qualifying asset (i.e. an asset that necessarily takes a substantial period of time to get ready for its intended use or sale) are capitalised as part of the cost of that asset. All other borrowing costs are expensed in the period they occur. Borrowing costs consist of interest and other costs that an entity incurs in connection with the borrowing of funds.
(ab) trade and other payables
trade payables and other payables are carried at amortised costs and represent liabilities for goods and services provided to the Group prior to the end of the financial year that are unpaid and arise when the Group become obliged to make future payments in respect of the purchase of these goods and services. the carrying amount approximates fair value.
(ac) research costs
Research costs are expensed as incurred.
(ad) Business combinations
Subsequent to 1 July 2010
Business combinations are accounted for using the acquisition method. the consideration transferred in a business combination shall be measured at fair
Note 2 summarY oF sigNiFiCaNt aCCouNtiNg poliCies (CoNtiNued)
value, which shall be calculated as the sum of the acquisition date fair values of the assets transferred by the acquirer, the liabilities incurred by the acquirer to former owners of the acquire, the equity issued by the acquirer, and the amount of any non-controlling interest in the acquiree. For each business combination, the acquirer measures the non-controlling interest in the acquiree either at fair value or at the proportionate share of the acquiree’s identifiable net assets. Acquisition-related costs are expensed as incurred.
When the Group acquires a business, it assesses the financial assets and liabilities assumed for appropriate classification and designation in accordance with the contractual terms, economic conditions, the Group’s operating or accounting policies and other pertinent conditions as at the acquisition date. this includes the separation of embedded derivatives in host contracts by the acquiree.
If the business combination is achieved in stages, the acquisition date fair value of the acquirer’s previously held equity interest in the acquiree is remeasured at fair value as at the acquisition date through profit or loss.
Any contingent consideration to be transferred by the acquirer will be recognised at fair value at the acquisition date. Subsequent changes to the fair value of the contingent consideration which is deemed to be an asset or liability will be recognised in accordance with AASB 139 either in profit or loss or in other comprehensive income. If the contingent consideration is classified as equity, it shall not be remeasured.
the excess of the cost of the business combination over the net fair value of the Group’s share of the identifiable net assets acquired is recognised as goodwill. If the cost of acquisition is less than the Group’s share of the net fair value of the identifiable net assets of the subsidiary, the difference is recognised as a gain in the Consolidated Statement of Comprehensive Income, but only after a reassessment of the identification and measurement of the net assets acquired.
Prior to July 2010
Business combinations were accounted for using the purchase method. transaction costs directly attributable to the acquisition formed part of the acquisition costs. the non-controlling interest (formerly known as minority interest) was measured at the proportionate share of the acquiree’s identifiable net assets.
(ae) discontinued operations
A discontinued operation is a component of the entity that has been disposed of or is classified as held for sale and that represents a separate major line of business or geographical area of operations, is part of a single coordinated plan to dispose of such a line of business or area of operations, or is a subsidiary acquired exclusively with a view to resale. the results of discontinued operations are presently separately on the face of the statement of comprehensive income and the assets and liabilities are presented separately on the face of the statement of financial position.
Note 2 summarY oF sigNiFiCaNt aCCouNtiNg poliCies (CoNtiNued)
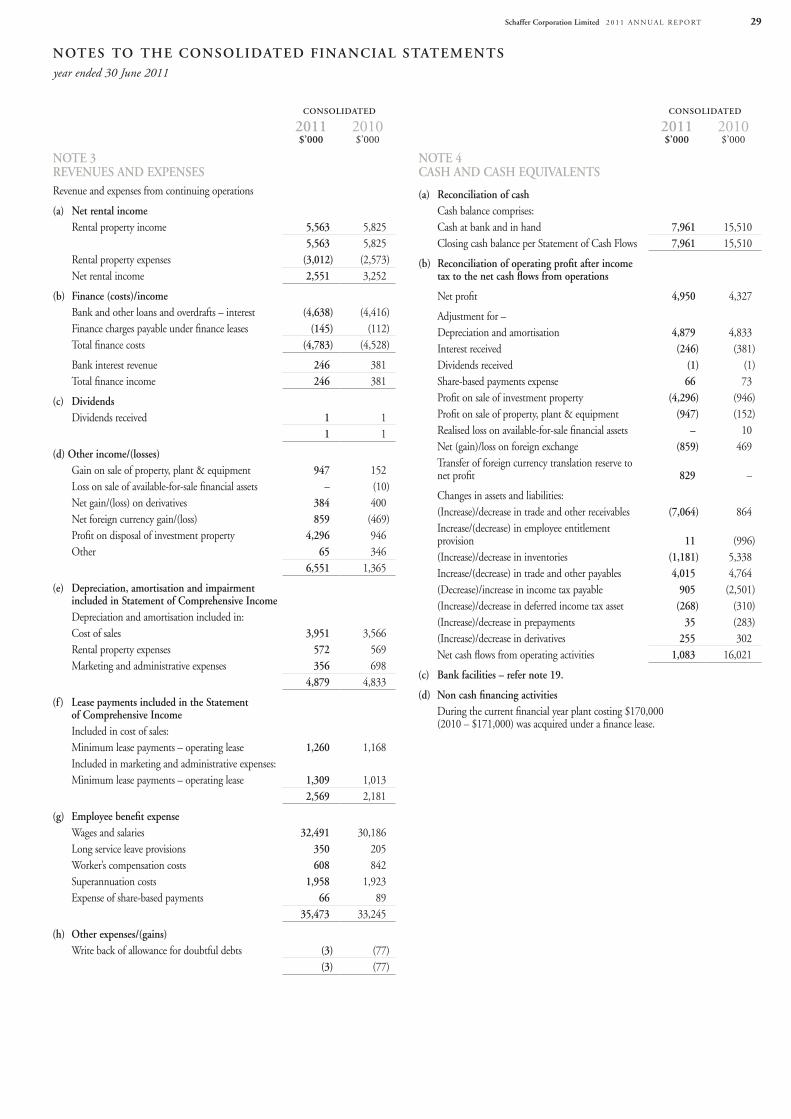
Notes to the CoNsolidated FiNaNCial statemeNtsyear ended 30 June 2011
schaffer Corporation limited 2 0 1 1 A n n u A l R e p o Rt 29
CoNsolidated
2011 2010$’000 $’000
Note 4 Cash aNd Cash eQuivaleNts
(a) reconciliation of cashCash balance comprises:Cash at bank and in hand 7,961 15,510Closing cash balance per Statement of Cash Flows 7,961 15,510
(b) reconciliation of operating profit after income tax to the net cash flows from operations
net profit 4,950 4,327
Adjustment for – Depreciation and amortisation 4,879 4,833Interest received (246) (381)Dividends received (1) (1)Share-based payments expense 66 73profit on sale of investment property (4,296) (946)profit on sale of property, plant & equipment (947) (152)Realised loss on available-for-sale financial assets – 10net (gain)/loss on foreign exchange (859) 469transfer of foreign currency translation reserve to net profit 829 –
Changes in assets and liabilities:(Increase)/decrease in trade and other receivables (7,064) 864Increase/(decrease) in employee entitlement provision 11 (996)(Increase)/decrease in inventories (1,181) 5,338Increase/(decrease) in trade and other payables 4,015 4,764(Decrease)/increase in income tax payable 905 (2,501)(Increase)/decrease in deferred income tax asset (268) (310)(Increase)/decrease in prepayments 35 (283)(Increase)/decrease in derivatives 255 302net cash flows from operating activities 1,083 16,021
(c) Bank facilities – refer note 19.
(d) Non cash financing activitiesDuring the current financial year plant costing $170,000 (2010 – $171,000) was acquired under a finance lease.
CoNsolidated
2011 2010$’000 $’000
Note 3 reveNues aNd eXpeNsesRevenue and expenses from continuing operations
(a) Net rental incomeRental property income 5,563 5,825
5,563 5,825Rental property expenses (3,012) (2,573)net rental income 2,551 3,252
(b) Finance (costs)/incomeBank and other loans and overdrafts – interest (4,638) (4,416)Finance charges payable under finance leases (145) (112)total finance costs (4,783) (4,528)
Bank interest revenue 246 381total finance income 246 381
(c) dividendsDividends received 1 1
1 1
(d) other income/(losses)Gain on sale of property, plant & equipment 947 152loss on sale of available-for-sale financial assets – (10)net gain/(loss) on derivatives 384 400net foreign currency gain/(loss) 859 (469)profit on disposal of investment property 4,296 946other 65 346
6,551 1,365
(e) depreciation, amortisation and impairment included in statement of Comprehensive incomeDepreciation and amortisation included in:Cost of sales 3,951 3,566Rental property expenses 572 569Marketing and administrative expenses 356 698
4,879 4,833
(f) lease payments included in the statement of Comprehensive incomeIncluded in cost of sales:Minimum lease payments – operating lease 1,260 1,168Included in marketing and administrative expenses:Minimum lease payments – operating lease 1,309 1,013
2,569 2,181
(g) employee benefit expenseWages and salaries 32,491 30,186long service leave provisions 350 205Worker’s compensation costs 608 842Superannuation costs 1,958 1,923expense of share-based payments 66 89
35,473 33,245
(h) other expenses/(gains)Write back of allowance for doubtful debts (3) (77)
(3) (77)
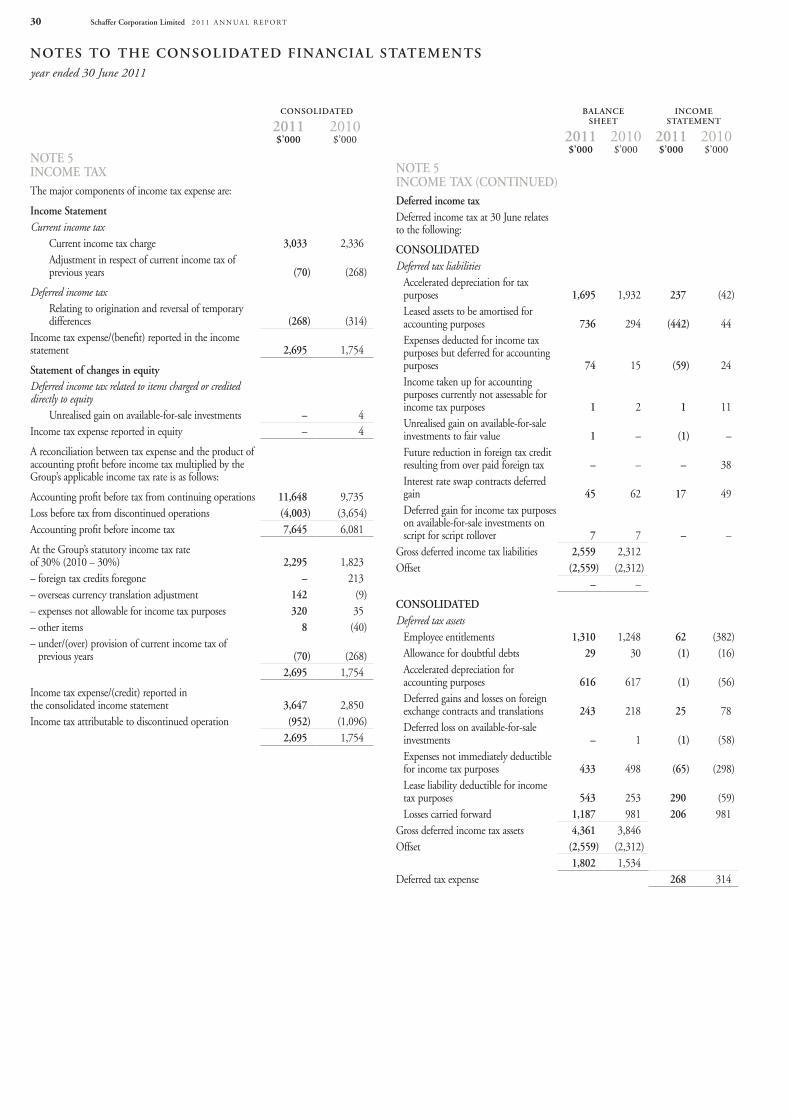
Notes to the CoNsolidated FiNaNCial statemeNtsyear ended 30 June 2011
schaffer Corporation limited 2 0 1 1 A n n u A l R e p o Rt30
BalaNCe sheet
iNCome statemeNt
2011 2010 2011 2010$’000 $’000 $’000 $’000
Note 5 iNCome taX (CoNtiNued)deferred income taxDeferred income tax at 30 June relates to the following:
CoNsolidatedDeferred tax liabilities
Accelerated depreciation for tax purposes 1,695 1,932 237 (42)leased assets to be amortised for accounting purposes 736 294 (442) 44expenses deducted for income tax purposes but deferred for accounting purposes 74 15 (59) 24Income taken up for accounting purposes currently not assessable for income tax purposes 1 2 1 11unrealised gain on available-for-sale investments to fair value 1 – (1) –Future reduction in foreign tax credit resulting from over paid foreign tax – – – 38Interest rate swap contracts deferred gain 45 62 17 49Deferred gain for income tax purposes on available-for-sale investments on script for script rollover 7 7 – –
Gross deferred income tax liabilities 2,559 2,312offset (2,559) (2,312)
– –
CoNsolidatedDeferred tax assets
employee entitlements 1,310 1,248 62 (382)Allowance for doubtful debts 29 30 (1) (16)Accelerated depreciation for accounting purposes 616 617 (1) (56)Deferred gains and losses on foreign exchange contracts and translations 243 218 25 78Deferred loss on available-for-sale investments – 1 (1) (58)expenses not immediately deductible for income tax purposes 433 498 (65) (298)lease liability deductible for income tax purposes 543 253 290 (59)losses carried forward 1,187 981 206 981
Gross deferred income tax assets 4,361 3,846offset (2,559) (2,312)
1,802 1,534Deferred tax expense 268 314
CoNsolidated
2011 2010$’000 $’000
Note 5 iNCome taXthe major components of income tax expense are:
income statementCurrent income tax
Current income tax charge 3,033 2,336Adjustment in respect of current income tax of previous years (70) (268)
Deferred income taxRelating to origination and reversal of temporary differences (268) (314)
Income tax expense/(benefit) reported in the income statement 2,695 1,754
statement of changes in equityDeferred income tax related to items charged or credited directly to equity
unrealised gain on available-for-sale investments – 4Income tax expense reported in equity – 4
A reconciliation between tax expense and the product of accounting profit before income tax multiplied by the Group’s applicable income tax rate is as follows:
Accounting profit before tax from continuing operations 11,648 9,735loss before tax from discontinued operations (4,003) (3,654)Accounting profit before income tax 7,645 6,081
At the Group’s statutory income tax rate of 30% (2010 – 30%) 2,295 1,823– foreign tax credits foregone – 213– overseas currency translation adjustment 142 (9)– expenses not allowable for income tax purposes 320 35– other items 8 (40)– under/(over) provision of current income tax of
previous years (70) (268)2,695 1,754
Income tax expense/(credit) reported in the consolidated income statement 3,647 2,850Income tax attributable to discontinued operation (952) (1,096)
2,695 1,754
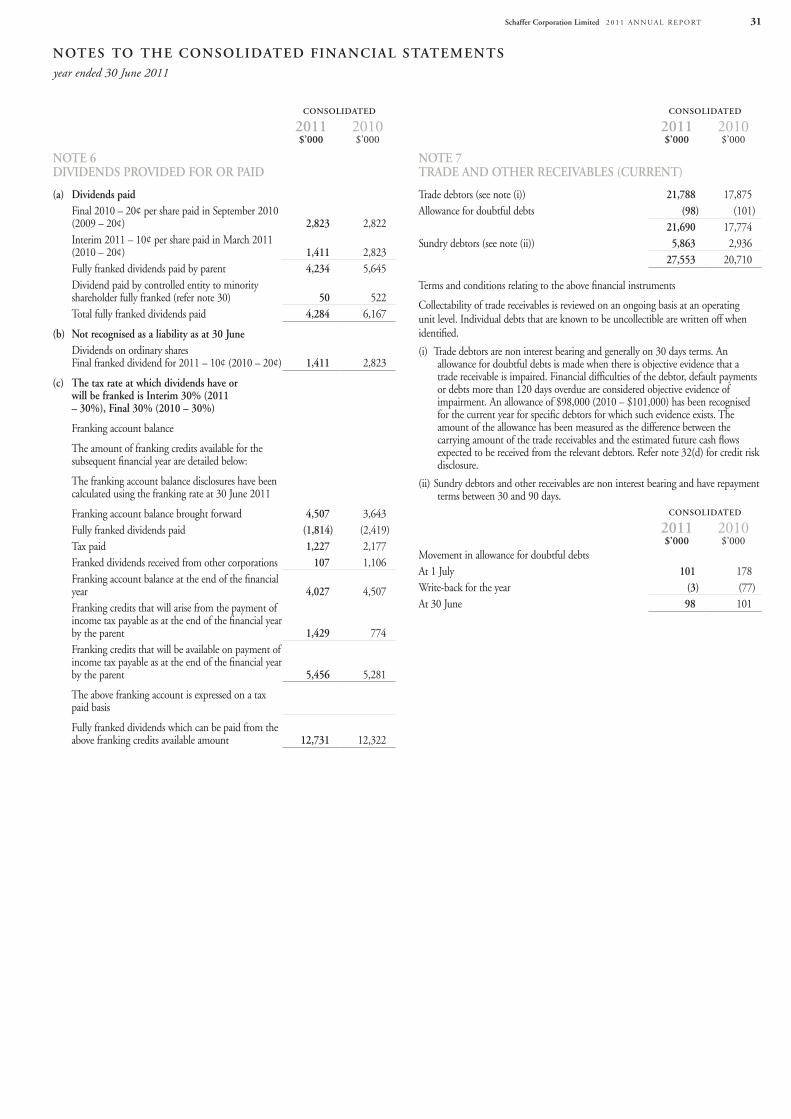
Notes to the CoNsolidated FiNaNCial statemeNtsyear ended 30 June 2011
schaffer Corporation limited 2 0 1 1 A n n u A l R e p o Rt 31
CoNsolidated
2011 2010$’000 $’000
Note 6 divideNds provided For or paid
(a) dividends paid Final 2010 – 20¢ per share paid in September 2010 (2009 – 20¢) 2,823 2,822Interim 2011 – 10¢ per share paid in March 2011 (2010 – 20¢) 1,411 2,823Fully franked dividends paid by parent 4,234 5,645Dividend paid by controlled entity to minority shareholder fully franked (refer note 30) 50 522total fully franked dividends paid 4,284 6,167
(b) Not recognised as a liability as at 30 JuneDividends on ordinary shares Final franked dividend for 2011 – 10¢ (2010 – 20¢) 1,411 2,823
(c) the tax rate at which dividends have or will be franked is interim 30% (2011 – 30%), Final 30% (2010 – 30%)
Franking account balance
the amount of franking credits available for the subsequent financial year are detailed below:
the franking account balance disclosures have been calculated using the franking rate at 30 June 2011
Franking account balance brought forward 4,507 3,643Fully franked dividends paid (1,814) (2,419)tax paid 1,227 2,177Franked dividends received from other corporations 107 1,106Franking account balance at the end of the financial year 4,027 4,507Franking credits that will arise from the payment of income tax payable as at the end of the financial year by the parent 1,429 774Franking credits that will be available on payment of income tax payable as at the end of the financial year by the parent 5,456 5,281
the above franking account is expressed on a tax paid basis
Fully franked dividends which can be paid from the above franking credits available amount 12,731 12,322
CoNsolidated
2011 2010$’000 $’000
Note 7 trade aNd other reCeivaBles (CurreNt)
trade debtors (see note (i)) 21,788 17,875Allowance for doubtful debts (98) (101)
21,690 17,774Sundry debtors (see note (ii)) 5,863 2,936
27,553 20,710
terms and conditions relating to the above financial instruments
Collectability of trade receivables is reviewed on an ongoing basis at an operating unit level. Individual debts that are known to be uncollectible are written off when identified.
(i) trade debtors are non interest bearing and generally on 30 days terms. An allowance for doubtful debts is made when there is objective evidence that a trade receivable is impaired. Financial difficulties of the debtor, default payments or debts more than 120 days overdue are considered objective evidence of impairment. An allowance of $98,000 (2010 – $101,000) has been recognised for the current year for specific debtors for which such evidence exists. the amount of the allowance has been measured as the difference between the carrying amount of the trade receivables and the estimated future cash flows expected to be received from the relevant debtors. Refer note 32(d) for credit risk disclosure.
(ii) Sundry debtors and other receivables are non interest bearing and have repayment terms between 30 and 90 days.
CoNsolidated
2011 2010$’000 $’000
Movement in allowance for doubtful debtsAt 1 July 101 178Write-back for the year (3) (77)At 30 June 98 101
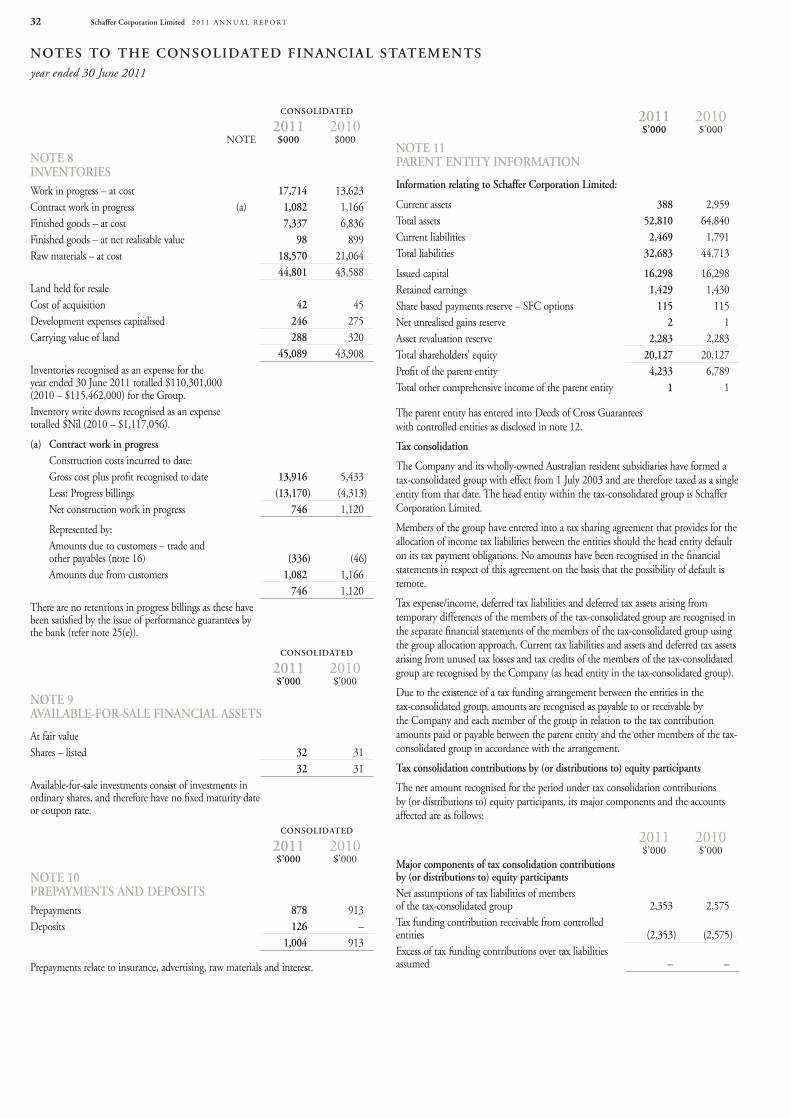
Notes to the CoNsolidated FiNaNCial statemeNtsyear ended 30 June 2011
schaffer Corporation limited 2 0 1 1 A n n u A l R e p o Rt32
CoNsolidated
2011 2010note $000 $000
Note 8 iNveNtoriesWork in progress – at cost 17,714 13,623Contract work in progress (a) 1,082 1,166Finished goods – at cost 7,337 6,836Finished goods – at net realisable value 98 899Raw materials – at cost 18,570 21,064
44,801 43,588land held for resaleCost of acquisition 42 45Development expenses capitalised 246 275Carrying value of land 288 320
45,089 43,908Inventories recognised as an expense for the year ended 30 June 2011 totalled $110,301,000 (2010 – $115,462,000) for the Group.Inventory write downs recognised as an expense totalled $nil (2010 – $1,117,056).
(a) Contract work in progressConstruction costs incurred to date:Gross cost plus profit recognised to date 13,916 5,433less: progress billings (13,170) (4,313)net construction work in progress 746 1,120
Represented by:Amounts due to customers – trade and other payables (note 16) (336) (46)Amounts due from customers 1,082 1,166
746 1,120there are no retentions in progress billings as these have been satisfied by the issue of performance guarantees by the bank (refer note 25(e)).
CoNsolidated
2011 2010$’000 $’000
Note 9 availaBle-For-sale FiNaNCial assets
At fair valueShares – listed 32 31
32 31Available-for-sale investments consist of investments in ordinary shares, and therefore have no fixed maturity date or coupon rate.
CoNsolidated
2011 2010$’000 $’000
Note 10 prepaYmeNts aNd depositsprepayments 878 913Deposits 126 –
1,004 913
prepayments relate to insurance, advertising, raw materials and interest.
2011 2010$’000 $’000
Note 11 pareNt eNtitY iNFormatioN
information relating to schaffer Corporation limited:
Current assets 388 2,959total assets 52,810 64,840Current liabilities 2,469 1,791total liabilities 32,683 44,713
Issued capital 16,298 16,298Retained earnings 1,429 1,430Share based payments reserve – SFC options 115 115net unrealised gains reserve 2 1Asset revaluation reserve 2,283 2,283total shareholders’ equity 20,127 20,127profit of the parent entity 4,233 6,789total other comprehensive income of the parent entity 1 1
the parent entity has entered into Deeds of Cross Guarantees with controlled entities as disclosed in note 12.
tax consolidation
the Company and its wholly-owned Australian resident subsidiaries have formed a tax-consolidated group with effect from 1 July 2003 and are therefore taxed as a single entity from that date. the head entity within the tax-consolidated group is Schaffer Corporation limited.
Members of the group have entered into a tax sharing agreement that provides for the allocation of income tax liabilities between the entities should the head entity default on its tax payment obligations. no amounts have been recognised in the financial statements in respect of this agreement on the basis that the possibility of default is remote.
tax expense/income, deferred tax liabilities and deferred tax assets arising from temporary differences of the members of the tax-consolidated group are recognised in the separate financial statements of the members of the tax-consolidated group using the group allocation approach. Current tax liabilities and assets and deferred tax assets arising from unused tax losses and tax credits of the members of the tax-consolidated group are recognised by the Company (as head entity in the tax-consolidated group).
Due to the existence of a tax funding arrangement between the entities in the tax-consolidated group, amounts are recognised as payable to or receivable by the Company and each member of the group in relation to the tax contribution amounts paid or payable between the parent entity and the other members of the tax-consolidated group in accordance with the arrangement.
tax consolidation contributions by (or distributions to) equity participants
the net amount recognised for the period under tax consolidation contributions by (or distributions to) equity participants, its major components and the accounts affected are as follows:
2011 2010$’000 $’000
major components of tax consolidation contributions by (or distributions to) equity participantsnet assumptions of tax liabilities of members of the tax-consolidated group 2,353 2,575tax funding contribution receivable from controlled entities (2,353) (2,575)excess of tax funding contributions over tax liabilities assumed – –
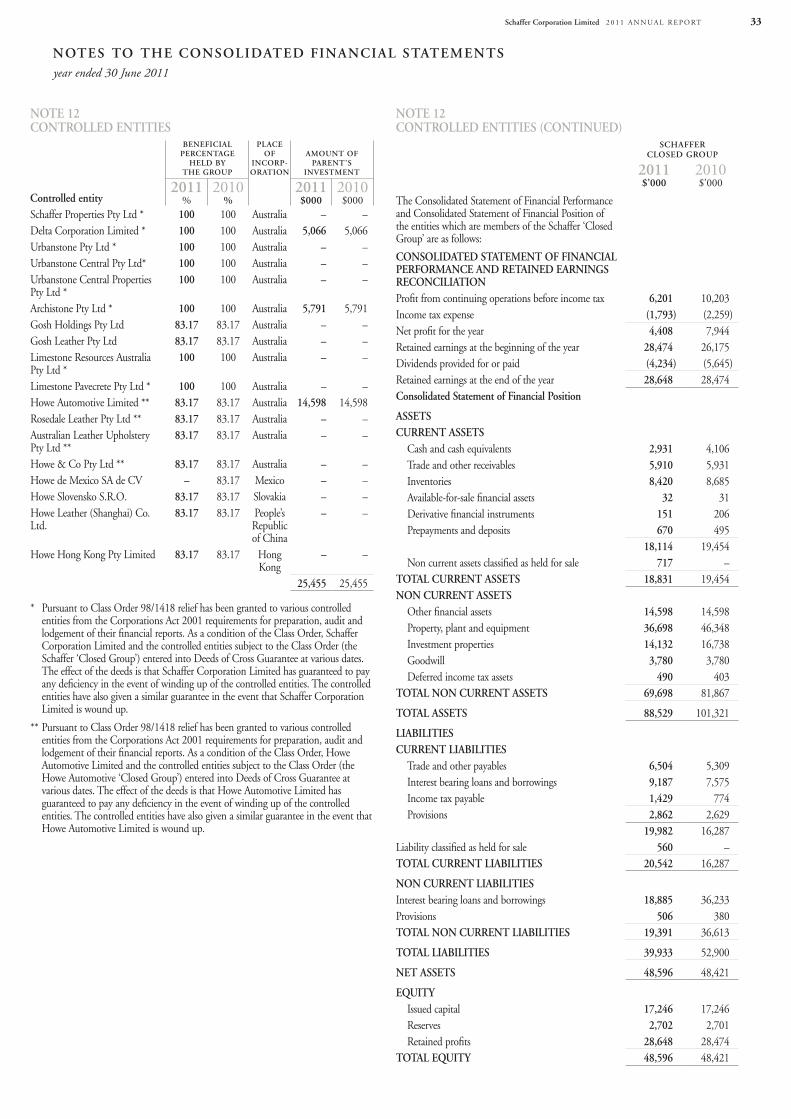
Notes to the CoNsolidated FiNaNCial statemeNtsyear ended 30 June 2011
schaffer Corporation limited 2 0 1 1 A n n u A l R e p o Rt 33
Note 12 CoNtrolled eNtities
Controlled entity
BeNeFiCial perCeNtage
held BY the group
plaCe oF
iNCorp- oratioN
amouNt oF pareNt’s
iNvestmeNt
2011 2010 2011 2010% % $000 $000
Schaffer properties pty ltd * 100 100 Australia – –Delta Corporation limited * 100 100 Australia 5,066 5,066urbanstone pty ltd * 100 100 Australia – –urbanstone Central pty ltd* 100 100 Australia – –urbanstone Central properties pty ltd *
100 100 Australia – –
Archistone pty ltd * 100 100 Australia 5,791 5,791Gosh Holdings pty ltd 83.17 83.17 Australia – –Gosh leather pty ltd 83.17 83.17 Australia – –limestone Resources Australia pty ltd *
100 100 Australia – –
limestone pavecrete pty ltd * 100 100 Australia – –Howe Automotive limited ** 83.17 83.17 Australia 14,598 14,598Rosedale leather pty ltd ** 83.17 83.17 Australia – –Australian leather upholstery pty ltd **
83.17 83.17 Australia – –
Howe & Co pty ltd ** 83.17 83.17 Australia – –Howe de Mexico SA de Cv – 83.17 Mexico – –Howe Slovensko S.R.o. 83.17 83.17 Slovakia – –Howe leather (Shanghai) Co. ltd.
83.17 83.17 people’s Republic of China
– –
Howe Hong Kong pty limited 83.17 83.17 Hong Kong
– –
25,455 25,455
* pursuant to Class order 98/1418 relief has been granted to various controlled entities from the Corporations Act 2001 requirements for preparation, audit and lodgement of their financial reports. As a condition of the Class order, Schaffer Corporation limited and the controlled entities subject to the Class order (the Schaffer ‘Closed Group’) entered into Deeds of Cross Guarantee at various dates. the effect of the deeds is that Schaffer Corporation limited has guaranteed to pay any deficiency in the event of winding up of the controlled entities. the controlled entities have also given a similar guarantee in the event that Schaffer Corporation limited is wound up.
** pursuant to Class order 98/1418 relief has been granted to various controlled entities from the Corporations Act 2001 requirements for preparation, audit and lodgement of their financial reports. As a condition of the Class order, Howe Automotive limited and the controlled entities subject to the Class order (the Howe Automotive ‘Closed Group’) entered into Deeds of Cross Guarantee at various dates. the effect of the deeds is that Howe Automotive limited has guaranteed to pay any deficiency in the event of winding up of the controlled entities. the controlled entities have also given a similar guarantee in the event that Howe Automotive limited is wound up.
Note 12 CoNtrolled eNtities (CoNtiNued)
sChaFFerClosed group
2011 2010$’000 $’000
the Consolidated Statement of Financial performance and Consolidated Statement of Financial position of the entities which are members of the Schaffer ‘Closed Group’ are as follows:
CoNsolidated statemeNt oF FiNaNCial perFormaNCe aNd retaiNed earNiNgs reCoNCiliatioNprofit from continuing operations before income tax 6,201 10,203Income tax expense (1,793) (2,259)net profit for the year 4,408 7,944Retained earnings at the beginning of the year 28,474 26,175Dividends provided for or paid (4,234) (5,645)Retained earnings at the end of the year 28,648 28,474Consolidated statement of Financial position
assetsCurreNt assets
Cash and cash equivalents 2,931 4,106trade and other receivables 5,910 5,931Inventories 8,420 8,685Available-for-sale financial assets 32 31Derivative financial instruments 151 206prepayments and deposits 670 495
18,114 19,454non current assets classified as held for sale 717 –
total CurreNt assets 18,831 19,454NoN CurreNt assets
other financial assets 14,598 14,598property, plant and equipment 36,698 46,348Investment properties 14,132 16,738Goodwill 3,780 3,780Deferred income tax assets 490 403
total NoN CurreNt assets 69,698 81,867
total assets 88,529 101,321
liaBilitiesCurreNt liaBilities
trade and other payables 6,504 5,309Interest bearing loans and borrowings 9,187 7,575Income tax payable 1,429 774provisions 2,862 2,629
19,982 16,287liability classified as held for sale 560 –total CurreNt liaBilities 20,542 16,287
NoN CurreNt liaBilitiesInterest bearing loans and borrowings 18,885 36,233provisions 506 380total NoN CurreNt liaBilities 19,391 36,613
total liaBilities 39,933 52,900
Net assets 48,596 48,421
eQuitYIssued capital 17,246 17,246Reserves 2,702 2,701Retained profits 28,648 28,474
total eQuitY 48,596 48,421
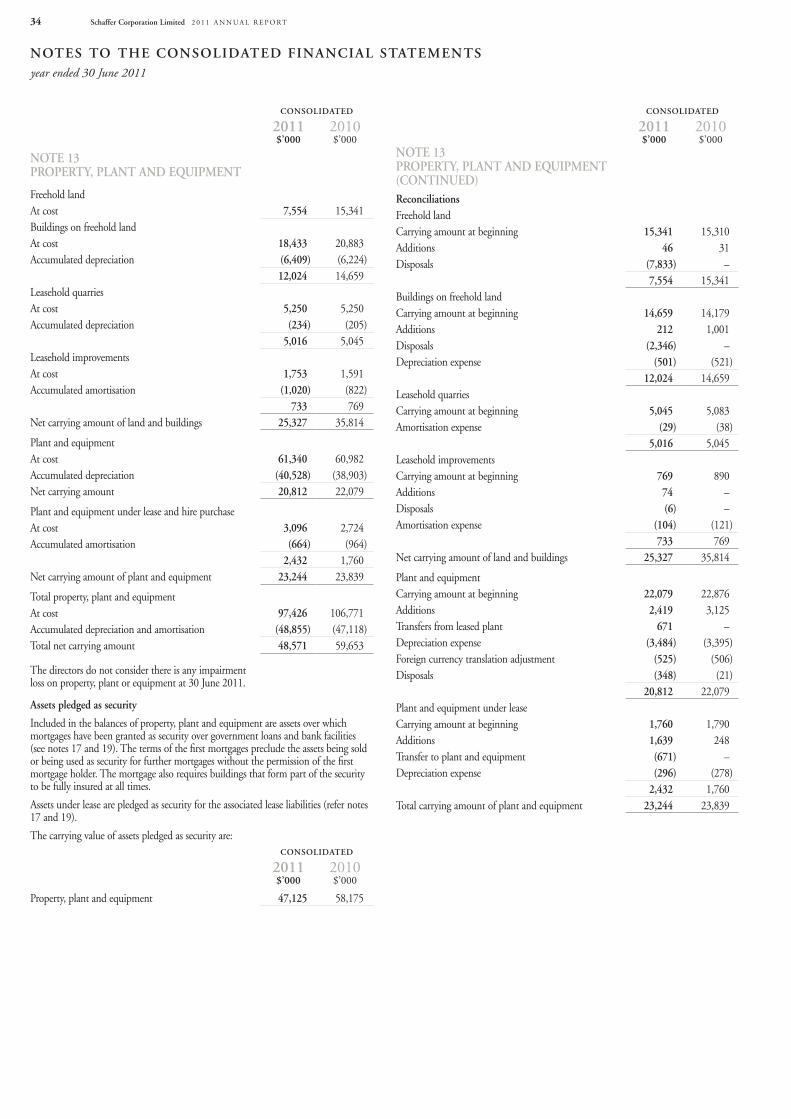
Notes to the CoNsolidated FiNaNCial statemeNtsyear ended 30 June 2011
schaffer Corporation limited 2 0 1 1 A n n u A l R e p o Rt34
CoNsolidated
2011 2010$’000 $’000
Note 13 propertY, plaNt aNd eQuipmeNt
Freehold landAt cost 7,554 15,341Buildings on freehold landAt cost 18,433 20,883Accumulated depreciation (6,409) (6,224)
12,024 14,659leasehold quarriesAt cost 5,250 5,250Accumulated depreciation (234) (205)
5,016 5,045leasehold improvementsAt cost 1,753 1,591Accumulated amortisation (1,020) (822)
733 769net carrying amount of land and buildings 25,327 35,814
plant and equipmentAt cost 61,340 60,982Accumulated depreciation (40,528) (38,903)net carrying amount 20,812 22,079
plant and equipment under lease and hire purchaseAt cost 3,096 2,724Accumulated amortisation (664) (964)
2,432 1,760net carrying amount of plant and equipment 23,244 23,839
total property, plant and equipmentAt cost 97,426 106,771Accumulated depreciation and amortisation (48,855) (47,118)total net carrying amount 48,571 59,653
the directors do not consider there is any impairment loss on property, plant or equipment at 30 June 2011.
assets pledged as security
Included in the balances of property, plant and equipment are assets over which mortgages have been granted as security over government loans and bank facilities (see notes 17 and 19). the terms of the first mortgages preclude the assets being sold or being used as security for further mortgages without the permission of the first mortgage holder. the mortgage also requires buildings that form part of the security to be fully insured at all times.
Assets under lease are pledged as security for the associated lease liabilities (refer notes 17 and 19).
the carrying value of assets pledged as security are:CoNsolidated
2011 2010$’000 $’000
property, plant and equipment 47,125 58,175
CoNsolidated
2011 2010$’000 $’000
Note 13 propertY, plaNt aNd eQuipmeNt (CoNtiNued)reconciliationsFreehold landCarrying amount at beginning 15,341 15,310Additions 46 31Disposals (7,833) –
7,554 15,341Buildings on freehold landCarrying amount at beginning 14,659 14,179Additions 212 1,001Disposals (2,346) –Depreciation expense (501) (521)
12,024 14,659leasehold quarriesCarrying amount at beginning 5,045 5,083Amortisation expense (29) (38)
5,016 5,045leasehold improvementsCarrying amount at beginning 769 890Additions 74 –Disposals (6) –Amortisation expense (104) (121)
733 769net carrying amount of land and buildings 25,327 35,814
plant and equipmentCarrying amount at beginning 22,079 22,876Additions 2,419 3,125transfers from leased plant 671 –Depreciation expense (3,484) (3,395)Foreign currency translation adjustment (525) (506)Disposals (348) (21)
20,812 22,079plant and equipment under leaseCarrying amount at beginning 1,760 1,790Additions 1,639 248transfer to plant and equipment (671) –Depreciation expense (296) (278)
2,432 1,760total carrying amount of plant and equipment 23,244 23,839
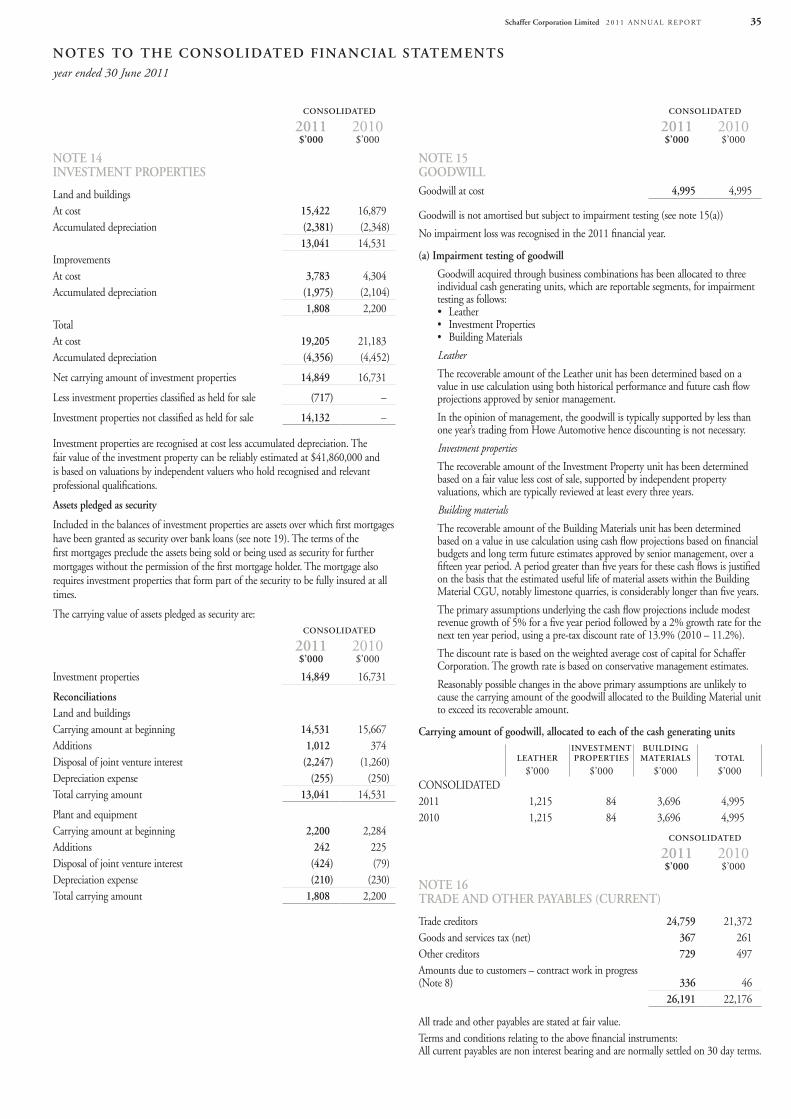
Notes to the CoNsolidated FiNaNCial statemeNtsyear ended 30 June 2011
schaffer Corporation limited 2 0 1 1 A n n u A l R e p o Rt 35
CoNsolidated
2011 2010$’000 $’000
Note 14 iNvestmeNt properties
land and buildingsAt cost 15,422 16,879Accumulated depreciation (2,381) (2,348)
13,041 14,531ImprovementsAt cost 3,783 4,304Accumulated depreciation (1,975) (2,104)
1,808 2,200total At cost 19,205 21,183Accumulated depreciation (4,356) (4,452)
net carrying amount of investment properties 14,849 16,731
less investment properties classified as held for sale (717) –
Investment properties not classified as held for sale 14,132 –
Investment properties are recognised at cost less accumulated depreciation. the fair value of the investment property can be reliably estimated at $41,860,000 and is based on valuations by independent valuers who hold recognised and relevant professional qualifications.
assets pledged as security
Included in the balances of investment properties are assets over which first mortgages have been granted as security over bank loans (see note 19). the terms of the first mortgages preclude the assets being sold or being used as security for further mortgages without the permission of the first mortgage holder. the mortgage also requires investment properties that form part of the security to be fully insured at all times.
the carrying value of assets pledged as security are:CoNsolidated
2011 2010$’000 $’000
Investment properties 14,849 16,731
reconciliationsland and buildingsCarrying amount at beginning 14,531 15,667Additions 1,012 374Disposal of joint venture interest (2,247) (1,260)Depreciation expense (255) (250)total carrying amount 13,041 14,531
plant and equipmentCarrying amount at beginning 2,200 2,284Additions 242 225Disposal of joint venture interest (424) (79)Depreciation expense (210) (230)total carrying amount 1,808 2,200
CoNsolidated
2011 2010$’000 $’000
Note 15 goodWillGoodwill at cost 4,995 4,995
Goodwill is not amortised but subject to impairment testing (see note 15(a))
no impairment loss was recognised in the 2011 financial year.
(a) impairment testing of goodwill
Goodwill acquired through business combinations has been allocated to three individual cash generating units, which are reportable segments, for impairment testing as follows:• leather• InvestmentProperties• BuildingMaterials
Leather
the recoverable amount of the leather unit has been determined based on a value in use calculation using both historical performance and future cash flow projections approved by senior management.
In the opinion of management, the goodwill is typically supported by less than one year’s trading from Howe Automotive hence discounting is not necessary.
Investment properties
the recoverable amount of the Investment property unit has been determined based on a fair value less cost of sale, supported by independent property valuations, which are typically reviewed at least every three years.
Building materials
the recoverable amount of the Building Materials unit has been determined based on a value in use calculation using cash flow projections based on financial budgets and long term future estimates approved by senior management, over a fifteen year period. A period greater than five years for these cash flows is justified on the basis that the estimated useful life of material assets within the Building Material CGu, notably limestone quarries, is considerably longer than five years.
the primary assumptions underlying the cash flow projections include modest revenue growth of 5% for a five year period followed by a 2% growth rate for the next ten year period, using a pre-tax discount rate of 13.9% (2010 – 11.2%).
the discount rate is based on the weighted average cost of capital for Schaffer Corporation. the growth rate is based on conservative management estimates.
Reasonably possible changes in the above primary assumptions are unlikely to cause the carrying amount of the goodwill allocated to the Building Material unit to exceed its recoverable amount.
Carrying amount of goodwill, allocated to each of the cash generating units
leatheriNvestmeNtproperties
BuildiNgmaterials total
$’000 $’000 $’000 $’000ConSolIDAteD2011 1,215 84 3,696 4,9952010 1,215 84 3,696 4,995
CoNsolidated
2011 2010$’000 $’000
Note 16 trade aNd other paYaBles (CurreNt)
trade creditors 24,759 21,372Goods and services tax (net) 367 261other creditors 729 497Amounts due to customers – contract work in progress (note 8) 336 46
26,191 22,176
All trade and other payables are stated at fair value.terms and conditions relating to the above financial instruments: All current payables are non interest bearing and are normally settled on 30 day terms.
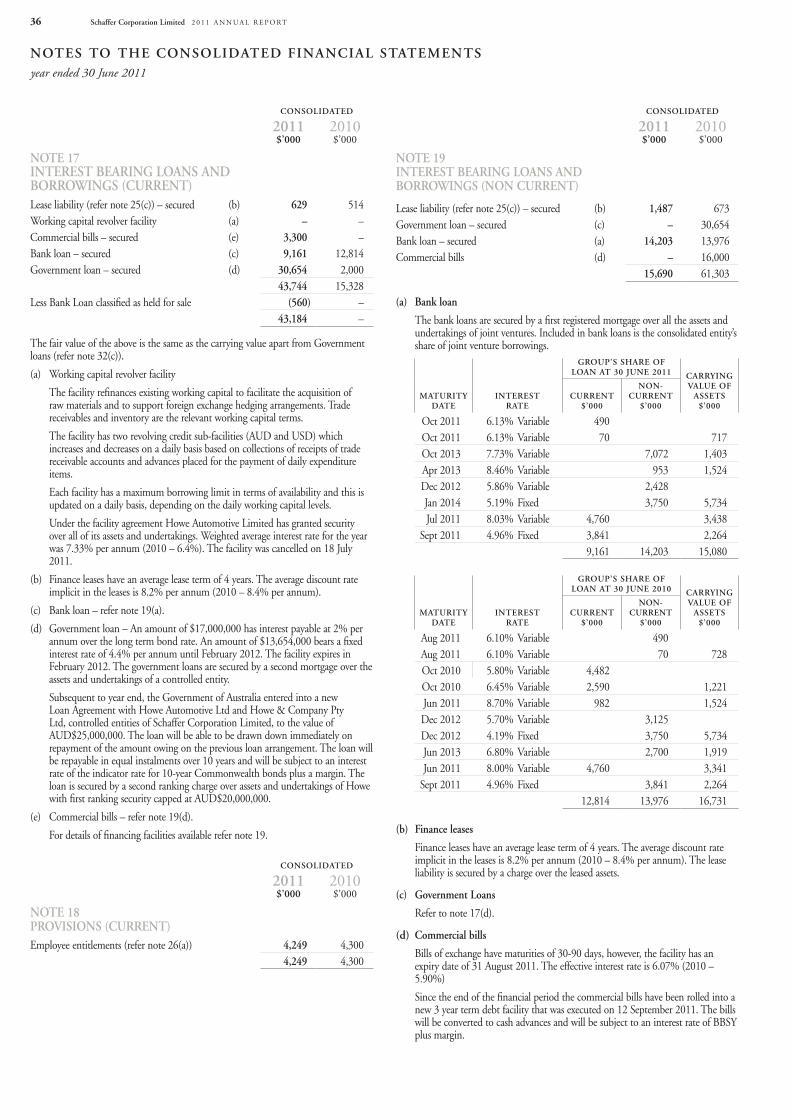
Notes to the CoNsolidated FiNaNCial statemeNtsyear ended 30 June 2011
schaffer Corporation limited 2 0 1 1 A n n u A l R e p o Rt36
CoNsolidated
2011 2010$’000 $’000
Note 17 iNterest BeariNg loaNs aNd BorroWiNgs (CurreNt)lease liability (refer note 25(c)) – secured (b) 629 514Working capital revolver facility (a) – –Commercial bills – secured (e) 3,300 –Bank loan – secured (c) 9,161 12,814Government loan – secured (d) 30,654 2,000
43,744 15,328less Bank loan classified as held for sale (560) –
43,184 –
the fair value of the above is the same as the carrying value apart from Government loans (refer note 32(c)).
(a) Working capital revolver facility
the facility refinances existing working capital to facilitate the acquisition of raw materials and to support foreign exchange hedging arrangements. trade receivables and inventory are the relevant working capital terms.
the facility has two revolving credit sub-facilities (AuD and uSD) which increases and decreases on a daily basis based on collections of receipts of trade receivable accounts and advances placed for the payment of daily expenditure items.
each facility has a maximum borrowing limit in terms of availability and this is updated on a daily basis, depending on the daily working capital levels.
under the facility agreement Howe Automotive limited has granted security over all of its assets and undertakings. Weighted average interest rate for the year was 7.33% per annum (2010 – 6.4%). the facility was cancelled on 18 July 2011.
(b) Finance leases have an average lease term of 4 years. the average discount rate implicit in the leases is 8.2% per annum (2010 – 8.4% per annum).
(c) Bank loan – refer note 19(a).
(d) Government loan – An amount of $17,000,000 has interest payable at 2% per annum over the long term bond rate. An amount of $13,654,000 bears a fixed interest rate of 4.4% per annum until February 2012. the facility expires in February 2012. the government loans are secured by a second mortgage over the assets and undertakings of a controlled entity.
Subsequent to year end, the Government of Australia entered into a new loan Agreement with Howe Automotive ltd and Howe & Company pty ltd, controlled entities of Schaffer Corporation limited, to the value of AuD$25,000,000. the loan will be able to be drawn down immediately on repayment of the amount owing on the previous loan arrangement. the loan will be repayable in equal instalments over 10 years and will be subject to an interest rate of the indicator rate for 10-year Commonwealth bonds plus a margin. the loan is secured by a second ranking charge over assets and undertakings of Howe with first ranking security capped at AuD$20,000,000.
(e) Commercial bills – refer note 19(d).
For details of financing facilities available refer note 19.
CoNsolidated
2011 2010$’000 $’000
Note 18 provisioNs (CurreNt)employee entitlements (refer note 26(a)) 4,249 4,300
4,249 4,300
CoNsolidated
2011 2010$’000 $’000
Note 19 iNterest BeariNg loaNs aNd BorroWiNgs (NoN CurreNt)
lease liability (refer note 25(c)) – secured (b) 1,487 673Government loan – secured (c) – 30,654Bank loan – secured (a) 14,203 13,976Commercial bills (d) – 16,000
15,690 61,303
(a) Bank loan
the bank loans are secured by a first registered mortgage over all the assets and undertakings of joint ventures. Included in bank loans is the consolidated entity’s share of joint venture borrowings.
maturitYdate
iNterestrate
group’s share oF loaN at 30 JuNe 2011 CarrYiNg
value oF assets
$’000CurreNt
$’000
NoN-CurreNt
$’000
oct 2011 6.13% variable 490oct 2011 6.13% variable 70 717oct 2013 7.73% variable 7,072 1,403Apr 2013 8.46% variable 953 1,524Dec 2012 5.86% variable 2,428Jan 2014 5.19% Fixed 3,750 5,734Jul 2011 8.03% variable 4,760 3,438
Sept 2011 4.96% Fixed 3,841 2,2649,161 14,203 15,080
maturitYdate
iNterestrate
group’s share oF loaN at 30 JuNe 2010 CarrYiNg
value oF assets
$’000CurreNt
$’000
NoN-CurreNt
$’000
Aug 2011 6.10% variable 490Aug 2011 6.10% variable 70 728oct 2010 5.80% variable 4,482oct 2010 6.45% variable 2,590 1,221Jun 2011 8.70% variable 982 1,524Dec 2012 5.70% variable 3,125Dec 2012 4.19% Fixed 3,750 5,734Jun 2013 6.80% variable 2,700 1,919Jun 2011 8.00% variable 4,760 3,341
Sept 2011 4.96% Fixed 3,841 2,26412,814 13,976 16,731
(b) Finance leases
Finance leases have an average lease term of 4 years. the average discount rate implicit in the leases is 8.2% per annum (2010 – 8.4% per annum). the lease liability is secured by a charge over the leased assets.
(c) government loans
Refer to note 17(d).
(d) Commercial bills
Bills of exchange have maturities of 30-90 days, however, the facility has an expiry date of 31 August 2011. the effective interest rate is 6.07% (2010 – 5.90%)
Since the end of the financial period the commercial bills have been rolled into a new 3 year term debt facility that was executed on 12 September 2011. the bills will be converted to cash advances and will be subject to an interest rate of BBSy plus margin.
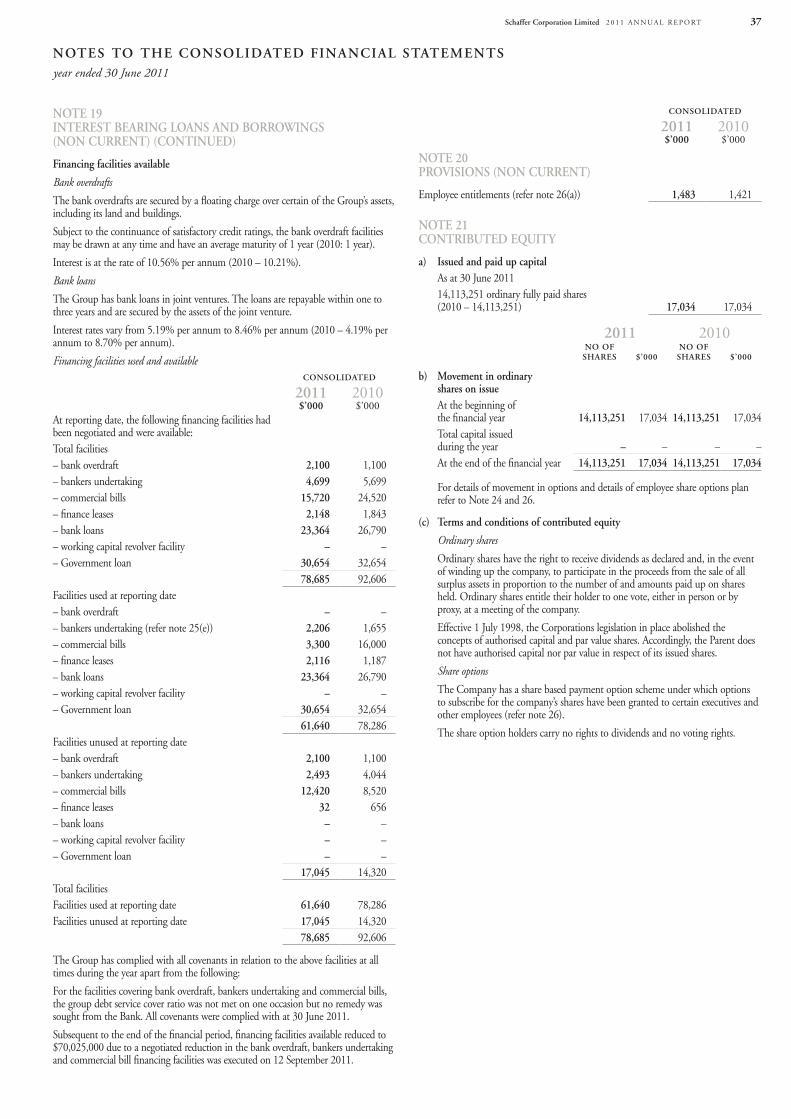
Notes to the CoNsolidated FiNaNCial statemeNtsyear ended 30 June 2011
schaffer Corporation limited 2 0 1 1 A n n u A l R e p o Rt 37
Note 19 iNterest BeariNg loaNs aNd BorroWiNgs (NoN CurreNt) (CoNtiNued)
Financing facilities available
Bank overdrafts
the bank overdrafts are secured by a floating charge over certain of the Group’s assets, including its land and buildings.
Subject to the continuance of satisfactory credit ratings, the bank overdraft facilities may be drawn at any time and have an average maturity of 1 year (2010: 1 year).
Interest is at the rate of 10.56% per annum (2010 – 10.21%).
Bank loans
the Group has bank loans in joint ventures. the loans are repayable within one to three years and are secured by the assets of the joint venture.
Interest rates vary from 5.19% per annum to 8.46% per annum (2010 – 4.19% per annum to 8.70% per annum).
Financing facilities used and availableCoNsolidated
2011 2010$’000 $’000
At reporting date, the following financing facilities had been negotiated and were available:total facilities– bank overdraft 2,100 1,100– bankers undertaking 4,699 5,699– commercial bills 15,720 24,520– finance leases 2,148 1,843– bank loans 23,364 26,790– working capital revolver facility – –– Government loan 30,654 32,654
78,685 92,606Facilities used at reporting date– bank overdraft – –– bankers undertaking (refer note 25(e)) 2,206 1,655– commercial bills 3,300 16,000– finance leases 2,116 1,187– bank loans 23,364 26,790– working capital revolver facility – –– Government loan 30,654 32,654
61,640 78,286Facilities unused at reporting date– bank overdraft 2,100 1,100– bankers undertaking 2,493 4,044– commercial bills 12,420 8,520– finance leases 32 656– bank loans – –– working capital revolver facility – –– Government loan – –
17,045 14,320total facilitiesFacilities used at reporting date 61,640 78,286Facilities unused at reporting date 17,045 14,320
78,685 92,606
the Group has complied with all covenants in relation to the above facilities at all times during the year apart from the following:
For the facilities covering bank overdraft, bankers undertaking and commercial bills, the group debt service cover ratio was not met on one occasion but no remedy was sought from the Bank. All covenants were complied with at 30 June 2011.
Subsequent to the end of the financial period, financing facilities available reduced to $70,025,000 due to a negotiated reduction in the bank overdraft, bankers undertaking and commercial bill financing facilities was executed on 12 September 2011.
CoNsolidated
2011 2010$’000 $’000
Note 20 provisioNs (NoN CurreNt)
employee entitlements (refer note 26(a)) 1,483 1,421
Note 21 CoNtriButed eQuitY
a) issued and paid up capitalAs at 30 June 201114,113,251 ordinary fully paid shares (2010 – 14,113,251) 17,034 17,034
2011 2010No oF
shares $’000No oF
shares $’000
b) movement in ordinary shares on issueAt the beginning of the financial year 14,113,251 17,034 14,113,251 17,034total capital issued during the year – – – –At the end of the financial year 14,113,251 17,034 14,113,251 17,034
For details of movement in options and details of employee share options plan refer to note 24 and 26.
(c) terms and conditions of contributed equity
Ordinary shares
ordinary shares have the right to receive dividends as declared and, in the event of winding up the company, to participate in the proceeds from the sale of all surplus assets in proportion to the number of and amounts paid up on shares held. ordinary shares entitle their holder to one vote, either in person or by proxy, at a meeting of the company.
effective 1 July 1998, the Corporations legislation in place abolished the concepts of authorised capital and par value shares. Accordingly, the parent does not have authorised capital nor par value in respect of its issued shares.
Share options
the Company has a share based payment option scheme under which options to subscribe for the company’s shares have been granted to certain executives and other employees (refer note 26).
the share option holders carry no rights to dividends and no voting rights.
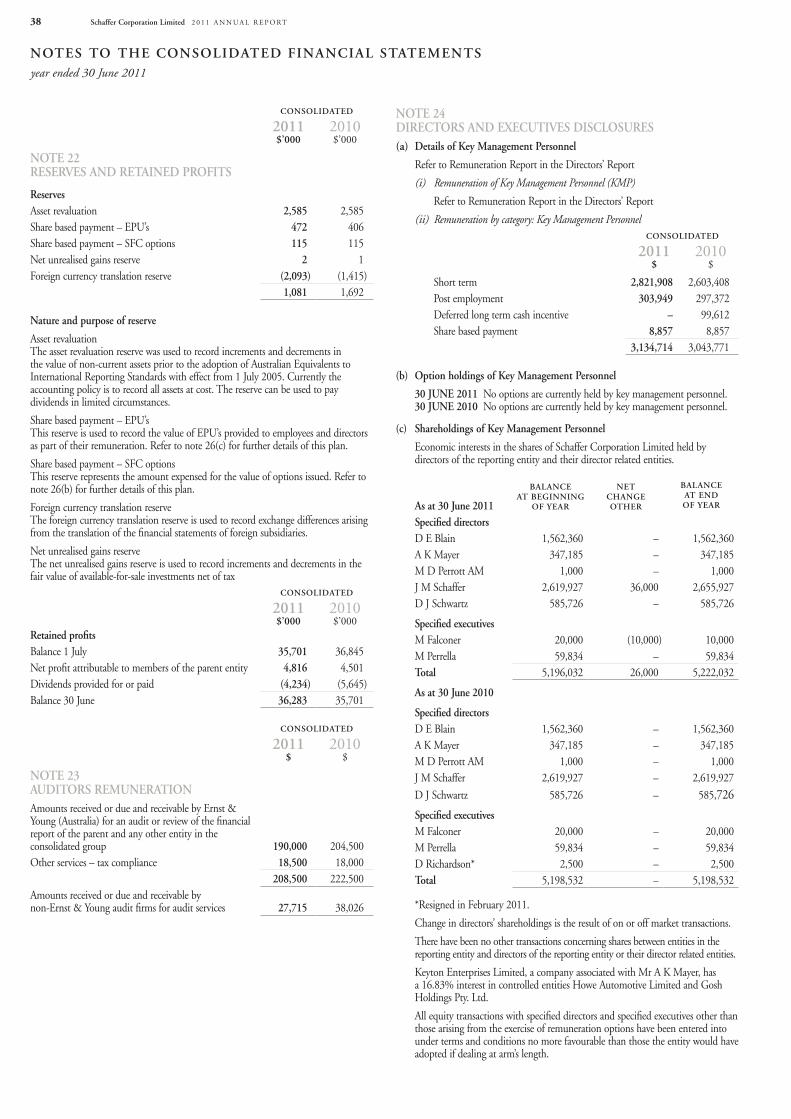
Notes to the CoNsolidated FiNaNCial statemeNtsyear ended 30 June 2011
schaffer Corporation limited 2 0 1 1 A n n u A l R e p o Rt38
CoNsolidated
2011 2010$’000 $’000
Note 22 reserves aNd retaiNed proFits
reservesAsset revaluation 2,585 2,585Share based payment – epu’s 472 406Share based payment – SFC options 115 115net unrealised gains reserve 2 1Foreign currency translation reserve (2,093) (1,415)
1,081 1,692
Nature and purpose of reserve
Asset revaluation the asset revaluation reserve was used to record increments and decrements in the value of non-current assets prior to the adoption of Australian equivalents to International Reporting Standards with effect from 1 July 2005. Currently the accounting policy is to record all assets at cost. the reserve can be used to pay dividends in limited circumstances.
Share based payment – epu’s this reserve is used to record the value of epu’s provided to employees and directors as part of their remuneration. Refer to note 26(c) for further details of this plan.
Share based payment – SFC options this reserve represents the amount expensed for the value of options issued. Refer to note 26(b) for further details of this plan.
Foreign currency translation reserve the foreign currency translation reserve is used to record exchange differences arising from the translation of the financial statements of foreign subsidiaries.
net unrealised gains reserve the net unrealised gains reserve is used to record increments and decrements in the fair value of available-for-sale investments net of tax
CoNsolidated
2011 2010$’000 $’000
retained profitsBalance 1 July 35,701 36,845net profit attributable to members of the parent entity 4,816 4,501Dividends provided for or paid (4,234) (5,645)Balance 30 June 36,283 35,701
CoNsolidated
2011 2010$ $
Note 23 auditors remuNeratioNAmounts received or due and receivable by ernst & young (Australia) for an audit or review of the financial report of the parent and any other entity in the consolidated group 190,000 204,500other services – tax compliance 18,500 18,000
208,500 222,500Amounts received or due and receivable by non-ernst & young audit firms for audit services 27,715 38,026
Note 24 direCtors aNd eXeCutives disClosures(a) details of Key management personnel
Refer to Remuneration Report in the Directors’ Report
(i) Remuneration of Key Management Personnel (KMP)
Refer to Remuneration Report in the Directors’ Report
(ii) Remuneration by category: Key Management PersonnelCoNsolidated
2011 2010$ $
Short term 2,821,908 2,603,408post employment 303,949 297,372Deferred long term cash incentive – 99,612Share based payment 8,857 8,857
3,134,714 3,043,771
(b) option holdings of Key management personnel
30 JuNe 2011 no options are currently held by key management personnel. 30 JuNe 2010 no options are currently held by key management personnel.
(c) shareholdings of Key management personnel
economic interests in the shares of Schaffer Corporation limited held by directors of the reporting entity and their director related entities.
as at 30 June 2011
BalaNCe at BegiNNiNg
oF Year
Net ChaNge other
BalaNCe at eNd oF Year
specified directorsD e Blain 1,562,360 – 1,562,360A K Mayer 347,185 – 347,185M D perrott AM 1,000 – 1,000J M Schaffer 2,619,927 36,000 2,655,927D J Schwartz 585,726 – 585,726
specified executivesM Falconer 20,000 (10,000) 10,000M perrella 59,834 – 59,834total 5,196,032 26,000 5,222,032
as at 30 June 2010
specified directorsD e Blain 1,562,360 – 1,562,360A K Mayer 347,185 – 347,185M D perrott AM 1,000 – 1,000J M Schaffer 2,619,927 – 2,619,927
D J Schwartz 585,726 – 585,726
specified executivesM Falconer 20,000 – 20,000M perrella 59,834 – 59,834D Richardson* 2,500 – 2,500total 5,198,532 – 5,198,532
*Resigned in February 2011.
Change in directors’ shareholdings is the result of on or off market transactions.
there have been no other transactions concerning shares between entities in the reporting entity and directors of the reporting entity or their director related entities.
Keyton enterprises limited, a company associated with Mr A K Mayer, has a 16.83% interest in controlled entities Howe Automotive limited and Gosh Holdings pty. ltd.
All equity transactions with specified directors and specified executives other than those arising from the exercise of remuneration options have been entered into under terms and conditions no more favourable than those the entity would have adopted if dealing at arm’s length.
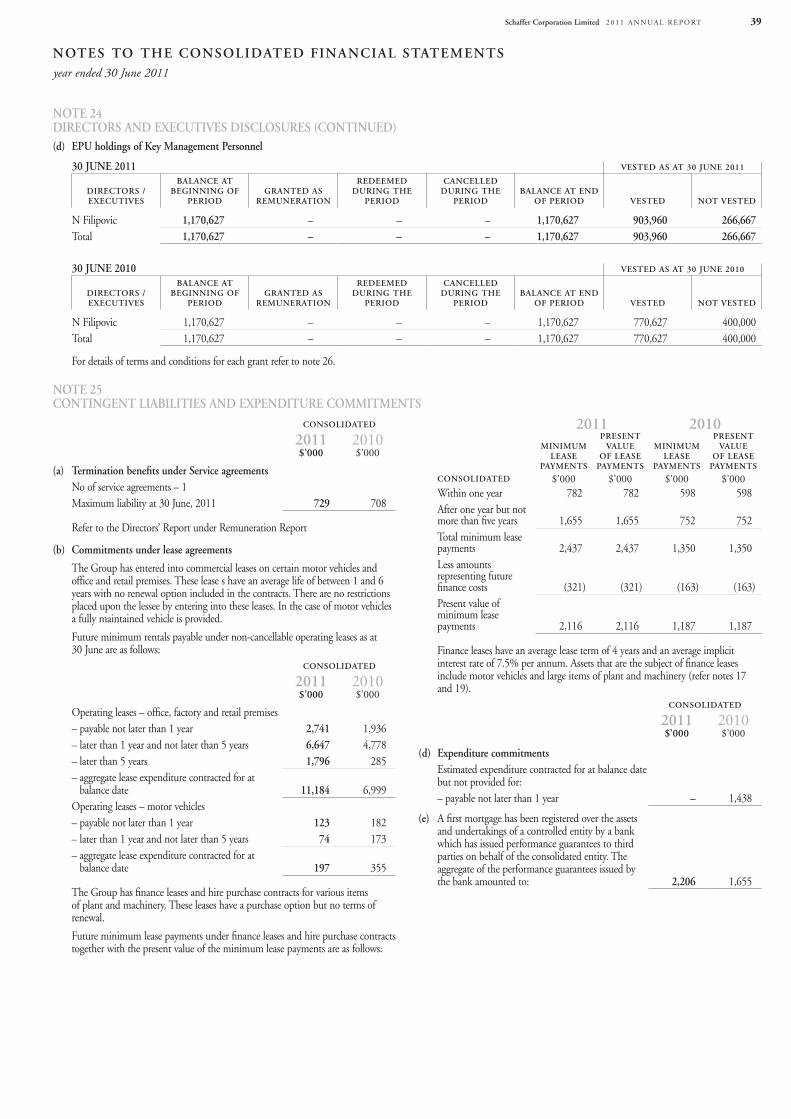
Notes to the CoNsolidated FiNaNCial statemeNtsyear ended 30 June 2011
schaffer Corporation limited 2 0 1 1 A n n u A l R e p o Rt 39
Note 24 direCtors aNd eXeCutives disClosures (CoNtiNued)(d) epu holdings of Key management personnel
30 JuNe 2011 vested as at 30 JuNe 2011
direCtors / eXeCutives
BalaNCe at BegiNNiNg oF
periodgraNted as
remuNeratioN
redeemed duriNg the
period
CaNCelled duriNg the
period BalaNCe at eNd
oF period vested Not vested
n Filipovic 1,170,627 – – – 1,170,627 903,960 266,667total 1,170,627 – – – 1,170,627 903,960 266,667
30 JuNe 2010 vested as at 30 JuNe 2010
direCtors / eXeCutives
BalaNCe at BegiNNiNg oF
periodgraNted as
remuNeratioN
redeemed duriNg the
period
CaNCelled duriNg the
period BalaNCe at eNd
oF period vested Not vested
n Filipovic 1,170,627 – – – 1,170,627 770,627 400,000total 1,170,627 – – – 1,170,627 770,627 400,000
For details of terms and conditions for each grant refer to note 26.
Note 25 CoNtiNgeNt liaBilities aNd eXpeNditure CommitmeNts
CoNsolidated
2011 2010$’000 $’000
(a) termination benefits under service agreementsno of service agreements – 1Maximum liability at 30 June, 2011 729 708
Refer to the Directors’ Report under Remuneration Report
(b) Commitments under lease agreements
the Group has entered into commercial leases on certain motor vehicles and office and retail premises. these lease s have an average life of between 1 and 6 years with no renewal option included in the contracts. there are no restrictions placed upon the lessee by entering into these leases. In the case of motor vehicles a fully maintained vehicle is provided.
Future minimum rentals payable under non-cancellable operating leases as at 30 June are as follows:
CoNsolidated
2011 2010$’000 $’000
operating leases – office, factory and retail premises– payable not later than 1 year 2,741 1,936– later than 1 year and not later than 5 years 6,647 4,778– later than 5 years 1,796 285– aggregate lease expenditure contracted for at
balance date 11,184 6,999operating leases – motor vehicles– payable not later than 1 year 123 182– later than 1 year and not later than 5 years 74 173– aggregate lease expenditure contracted for at
balance date 197 355
the Group has finance leases and hire purchase contracts for various items of plant and machinery. these leases have a purchase option but no terms of renewal.
Future minimum lease payments under finance leases and hire purchase contracts together with the present value of the minimum lease payments are as follows:
2011 2010miNimum
lease paYmeNts
preseNt value
oF lease paYmeNts
miNimum lease
paYmeNts
preseNt value
oF lease paYmeNts
CoNsolidated $’000 $’000 $’000 $’000Within one year 782 782 598 598After one year but not more than five years 1,655 1,655 752 752total minimum lease payments 2,437 2,437 1,350 1,350less amounts representing future finance costs (321) (321) (163) (163)present value of minimum lease payments 2,116 2,116 1,187 1,187
Finance leases have an average lease term of 4 years and an average implicit interest rate of 7.5% per annum. Assets that are the subject of finance leases include motor vehicles and large items of plant and machinery (refer notes 17 and 19).
CoNsolidated
2011 2010$’000 $’000
(d) expenditure commitmentsestimated expenditure contracted for at balance date but not provided for:– payable not later than 1 year – 1,438
(e) A first mortgage has been registered over the assets and undertakings of a controlled entity by a bank which has issued performance guarantees to third parties on behalf of the consolidated entity. the aggregate of the performance guarantees issued by the bank amounted to: 2,206 1,655
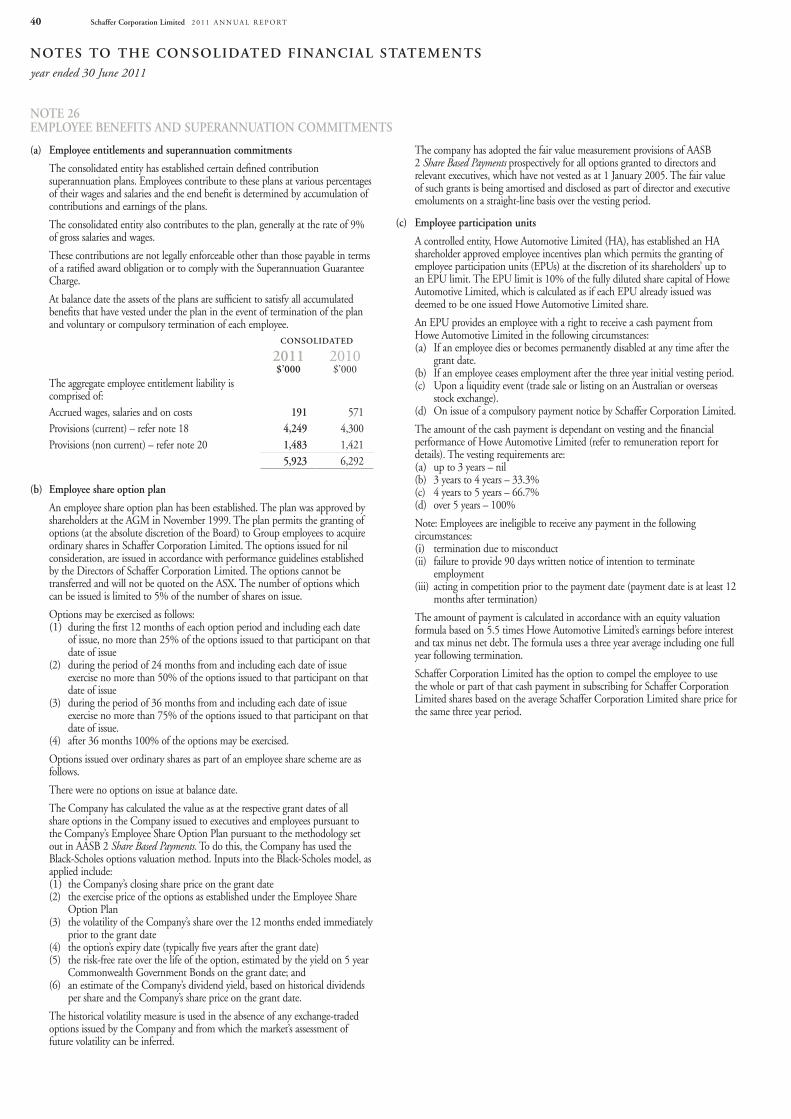
Notes to the CoNsolidated FiNaNCial statemeNtsyear ended 30 June 2011
schaffer Corporation limited 2 0 1 1 A n n u A l R e p o Rt40
Note 26 emploYee BeNeFits aNd superaNNuatioN CommitmeNts
(a) employee entitlements and superannuation commitments
the consolidated entity has established certain defined contribution superannuation plans. employees contribute to these plans at various percentages of their wages and salaries and the end benefit is determined by accumulation of contributions and earnings of the plans.
the consolidated entity also contributes to the plan, generally at the rate of 9% of gross salaries and wages.
these contributions are not legally enforceable other than those payable in terms of a ratified award obligation or to comply with the Superannuation Guarantee Charge.
At balance date the assets of the plans are sufficient to satisfy all accumulated benefits that have vested under the plan in the event of termination of the plan and voluntary or compulsory termination of each employee.
CoNsolidated
2011 2010$’000 $’000
the aggregate employee entitlement liability is comprised of:Accrued wages, salaries and on costs 191 571provisions (current) – refer note 18 4,249 4,300provisions (non current) – refer note 20 1,483 1,421
5,923 6,292
(b) employee share option plan
An employee share option plan has been established. the plan was approved by shareholders at the AGM in november 1999. the plan permits the granting of options (at the absolute discretion of the Board) to Group employees to acquire ordinary shares in Schaffer Corporation limited. the options issued for nil consideration, are issued in accordance with performance guidelines established by the Directors of Schaffer Corporation limited. the options cannot be transferred and will not be quoted on the ASX. the number of options which can be issued is limited to 5% of the number of shares on issue.
options may be exercised as follows:(1) during the first 12 months of each option period and including each date
of issue, no more than 25% of the options issued to that participant on that date of issue
(2) during the period of 24 months from and including each date of issue exercise no more than 50% of the options issued to that participant on that date of issue
(3) during the period of 36 months from and including each date of issue exercise no more than 75% of the options issued to that participant on that date of issue.
(4) after 36 months 100% of the options may be exercised.
options issued over ordinary shares as part of an employee share scheme are as follows.
there were no options on issue at balance date.
the Company has calculated the value as at the respective grant dates of all share options in the Company issued to executives and employees pursuant to the Company’s employee Share option plan pursuant to the methodology set out in AASB 2 Share Based Payments. to do this, the Company has used the Black-Scholes options valuation method. Inputs into the Black-Scholes model, as applied include:(1) the Company’s closing share price on the grant date(2) the exercise price of the options as established under the employee Share
option plan(3) the volatility of the Company’s share over the 12 months ended immediately
prior to the grant date(4) the option’s expiry date (typically five years after the grant date)(5) the risk-free rate over the life of the option, estimated by the yield on 5 year
Commonwealth Government Bonds on the grant date; and(6) an estimate of the Company’s dividend yield, based on historical dividends
per share and the Company’s share price on the grant date.
the historical volatility measure is used in the absence of any exchange-traded options issued by the Company and from which the market’s assessment of future volatility can be inferred.
the company has adopted the fair value measurement provisions of AASB 2 Share Based Payments prospectively for all options granted to directors and relevant executives, which have not vested as at 1 January 2005. the fair value of such grants is being amortised and disclosed as part of director and executive emoluments on a straight-line basis over the vesting period.
(c) employee participation units
A controlled entity, Howe Automotive limited (HA), has established an HA shareholder approved employee incentives plan which permits the granting of employee participation units (epus) at the discretion of its shareholders’ up to an epu limit. the epu limit is 10% of the fully diluted share capital of Howe Automotive limited, which is calculated as if each epu already issued was deemed to be one issued Howe Automotive limited share.
An epu provides an employee with a right to receive a cash payment from Howe Automotive limited in the following circumstances:(a) If an employee dies or becomes permanently disabled at any time after the
grant date.(b) If an employee ceases employment after the three year initial vesting period.(c) upon a liquidity event (trade sale or listing on an Australian or overseas
stock exchange).(d) on issue of a compulsory payment notice by Schaffer Corporation limited.
the amount of the cash payment is dependant on vesting and the financial performance of Howe Automotive limited (refer to remuneration report for details). the vesting requirements are:(a) up to 3 years – nil(b) 3 years to 4 years – 33.3%(c) 4 years to 5 years – 66.7%(d) over 5 years – 100%
note: employees are ineligible to receive any payment in the following circumstances:(i) termination due to misconduct(ii) failure to provide 90 days written notice of intention to terminate
employment(iii) acting in competition prior to the payment date (payment date is at least 12
months after termination)
the amount of payment is calculated in accordance with an equity valuation formula based on 5.5 times Howe Automotive limited’s earnings before interest and tax minus net debt. the formula uses a three year average including one full year following termination.
Schaffer Corporation limited has the option to compel the employee to use the whole or part of that cash payment in subscribing for Schaffer Corporation limited shares based on the average Schaffer Corporation limited share price for the same three year period.
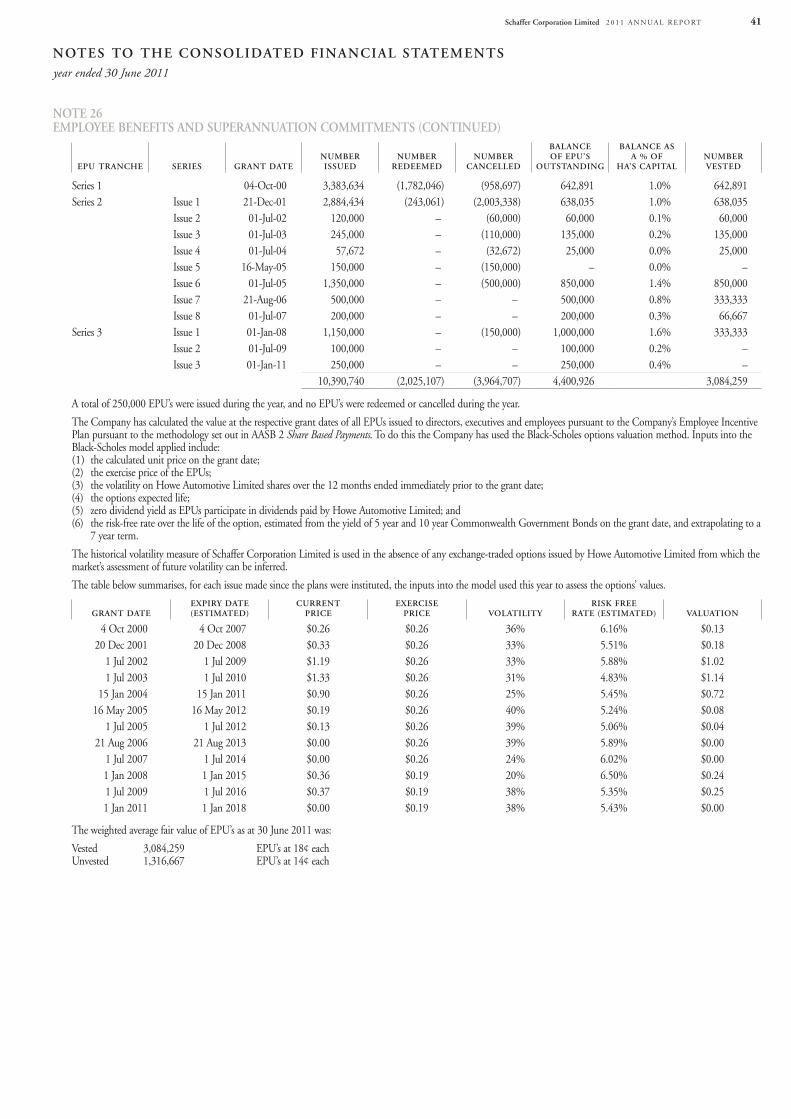
Notes to the CoNsolidated FiNaNCial statemeNtsyear ended 30 June 2011
schaffer Corporation limited 2 0 1 1 A n n u A l R e p o Rt 41
Note 26 emploYee BeNeFits aNd superaNNuatioN CommitmeNts (CoNtiNued)
epu traNChe series graNt dateNumBerissued
NumBer redeemed
NumBer CaNCelled
BalaNCe oF epu’s
outstaNdiNg
BalaNCe as a % oF
ha’s CapitalNumBer vested
Series 1 04-oct-00 3,383,634 (1,782,046) (958,697) 642,891 1.0% 642,891Series 2 Issue 1 21-Dec-01 2,884,434 (243,061) (2,003,338) 638,035 1.0% 638,035
Issue 2 01-Jul-02 120,000 – (60,000) 60,000 0.1% 60,000Issue 3 01-Jul-03 245,000 – (110,000) 135,000 0.2% 135,000Issue 4 01-Jul-04 57,672 – (32,672) 25,000 0.0% 25,000Issue 5 16-May-05 150,000 – (150,000) – 0.0% –Issue 6 01-Jul-05 1,350,000 – (500,000) 850,000 1.4% 850,000Issue 7 21-Aug-06 500,000 – – 500,000 0.8% 333,333Issue 8 01-Jul-07 200,000 – – 200,000 0.3% 66,667
Series 3 Issue 1 01-Jan-08 1,150,000 – (150,000) 1,000,000 1.6% 333,333Issue 2 01-Jul-09 100,000 – – 100,000 0.2% –Issue 3 01-Jan-11 250,000 – – 250,000 0.4% –
10,390,740 (2,025,107) (3,964,707) 4,400,926 3,084,259
A total of 250,000 epu’s were issued during the year, and no epu’s were redeemed or cancelled during the year.
the Company has calculated the value at the respective grant dates of all epus issued to directors, executives and employees pursuant to the Company’s employee Incentive plan pursuant to the methodology set out in AASB 2 Share Based Payments. to do this the Company has used the Black-Scholes options valuation method. Inputs into the Black-Scholes model applied include:(1) the calculated unit price on the grant date;(2) the exercise price of the epus;(3) the volatility on Howe Automotive limited shares over the 12 months ended immediately prior to the grant date;(4) the options expected life;(5) zero dividend yield as epus participate in dividends paid by Howe Automotive limited; and(6) the risk-free rate over the life of the option, estimated from the yield of 5 year and 10 year Commonwealth Government Bonds on the grant date, and extrapolating to a
7 year term.
the historical volatility measure of Schaffer Corporation limited is used in the absence of any exchange-traded options issued by Howe Automotive limited from which the market’s assessment of future volatility can be inferred.
the table below summarises, for each issue made since the plans were instituted, the inputs into the model used this year to assess the options’ values.
graNt dateeXpirY date (estimated)
CurreNtpriCe
eXerCise priCe volatilitY
risK Freerate (estimated) valuatioN
4 oct 2000 4 oct 2007 $0.26 $0.26 36% 6.16% $0.1320 Dec 2001 20 Dec 2008 $0.33 $0.26 33% 5.51% $0.18
1 Jul 2002 1 Jul 2009 $1.19 $0.26 33% 5.88% $1.021 Jul 2003 1 Jul 2010 $1.33 $0.26 31% 4.83% $1.14
15 Jan 2004 15 Jan 2011 $0.90 $0.26 25% 5.45% $0.7216 May 2005 16 May 2012 $0.19 $0.26 40% 5.24% $0.08
1 Jul 2005 1 Jul 2012 $0.13 $0.26 39% 5.06% $0.0421 Aug 2006 21 Aug 2013 $0.00 $0.26 39% 5.89% $0.00
1 Jul 2007 1 Jul 2014 $0.00 $0.26 24% 6.02% $0.001 Jan 2008 1 Jan 2015 $0.36 $0.19 20% 6.50% $0.241 Jul 2009 1 Jul 2016 $0.37 $0.19 38% 5.35% $0.251 Jan 2011 1 Jan 2018 $0.00 $0.19 38% 5.43% $0.00
the weighted average fair value of epu’s as at 30 June 2011 was:
vested 3,084,259 epu’s at 18¢ each unvested 1,316,667 epu’s at 14¢ each
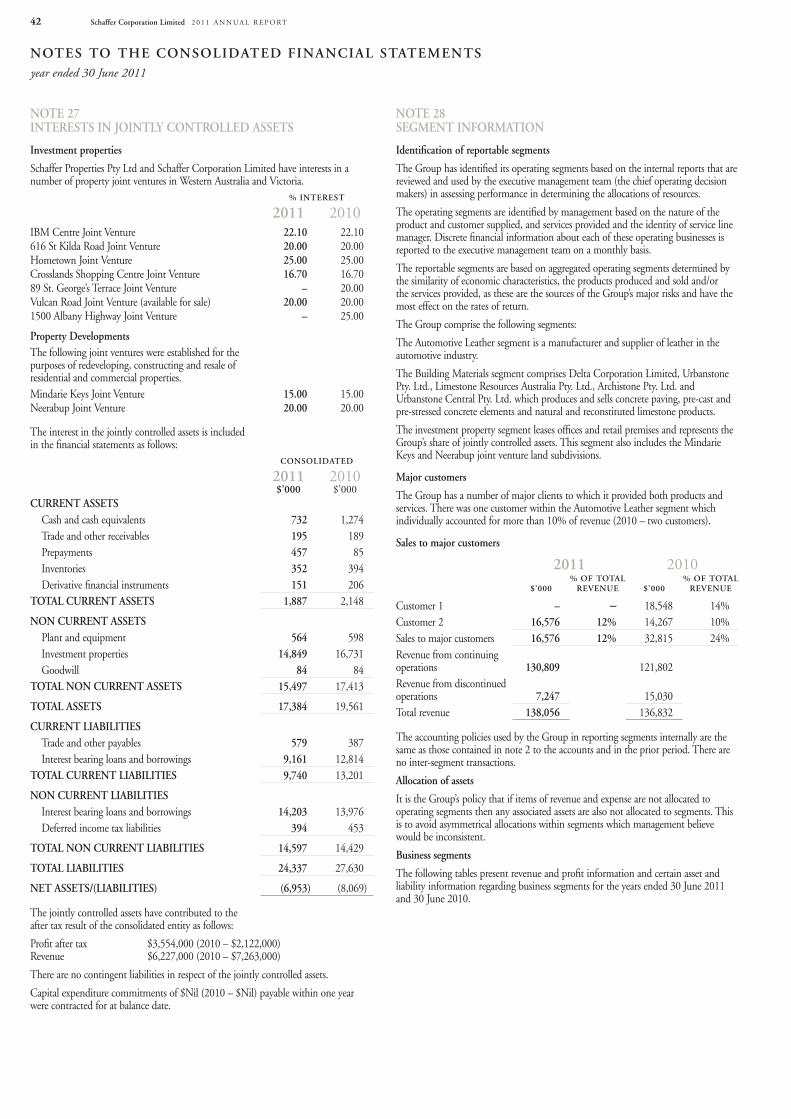
Notes to the CoNsolidated FiNaNCial statemeNtsyear ended 30 June 2011
schaffer Corporation limited 2 0 1 1 A n n u A l R e p o Rt42
Note 27 iNterests iN JoiNtlY CoNtrolled assets
investment properties
Schaffer properties pty ltd and Schaffer Corporation limited have interests in a number of property joint ventures in Western Australia and victoria.
% iNterest
2011 2010IBM Centre Joint venture616 St Kilda Road Joint ventureHometown Joint ventureCrosslands Shopping Centre Joint venture89 St. George’s terrace Joint venturevulcan Road Joint venture (available for sale)1500 Albany Highway Joint venture
22.1020.0025.0016.70
–20.00
–
22.1020.0025.0016.7020.0020.0025.00
property developmentsthe following joint ventures were established for the purposes of redeveloping, constructing and resale of residential and commercial properties.Mindarie Keys Joint ventureneerabup Joint venture
15.0020.00
15.0020.00
the interest in the jointly controlled assets is included in the financial statements as follows:
CoNsolidated
2011 2010$’000 $’000
CurreNt assetsCash and cash equivalents 732 1,274trade and other receivables 195 189prepayments 457 85Inventories 352 394Derivative financial instruments 151 206
total CurreNt assets 1,887 2,148
NoN CurreNt assetsplant and equipment 564 598Investment properties 14,849 16,731Goodwill 84 84
total NoN CurreNt assets 15,497 17,413
total assets 17,384 19,561
CurreNt liaBilitiestrade and other payables 579 387Interest bearing loans and borrowings 9,161 12,814
total CurreNt liaBilities 9,740 13,201
NoN CurreNt liaBilitiesInterest bearing loans and borrowings 14,203 13,976Deferred income tax liabilities 394 453
total NoN CurreNt liaBilities 14,597 14,429
total liaBilities 24,337 27,630
Net assets/(liaBilities) (6,953) (8,069)
the jointly controlled assets have contributed to the after tax result of the consolidated entity as follows:
profit after tax $3,554,000 (2010 – $2,122,000) Revenue $6,227,000 (2010 – $7,263,000)
there are no contingent liabilities in respect of the jointly controlled assets.
Capital expenditure commitments of $nil (2010 – $nil) payable within one year were contracted for at balance date.
Note 28 segmeNt iNFormatioN
identification of reportable segments
the Group has identified its operating segments based on the internal reports that are reviewed and used by the executive management team (the chief operating decision makers) in assessing performance in determining the allocations of resources.
the operating segments are identified by management based on the nature of the product and customer supplied, and services provided and the identity of service line manager. Discrete financial information about each of these operating businesses is reported to the executive management team on a monthly basis.
the reportable segments are based on aggregated operating segments determined by the similarity of economic characteristics, the products produced and sold and/or the services provided, as these are the sources of the Group’s major risks and have the most effect on the rates of return.
the Group comprise the following segments:
the Automotive leather segment is a manufacturer and supplier of leather in the automotive industry.
the Building Materials segment comprises Delta Corporation limited, urbanstone pty. ltd., limestone Resources Australia pty. ltd., Archistone pty. ltd. and urbanstone Central pty. ltd. which produces and sells concrete paving, pre-cast and pre-stressed concrete elements and natural and reconstituted limestone products.
the investment property segment leases offices and retail premises and represents the Group’s share of jointly controlled assets. this segment also includes the Mindarie Keys and neerabup joint venture land subdivisions.
major customers
the Group has a number of major clients to which it provided both products and services. there was one customer within the Automotive leather segment which individually accounted for more than 10% of revenue (2010 – two customers).
sales to major customers
2011 2010$’000
% oF totalreveNue $’000
% oF total reveNue
Customer 1 – – 18,548 14%Customer 2 16,576 12% 14,267 10%Sales to major customers 16,576 12% 32,815 24%Revenue from continuing operations 130,809 121,802Revenue from discontinued operations 7,247 15,030total revenue 138,056 136,832
the accounting policies used by the Group in reporting segments internally are the same as those contained in note 2 to the accounts and in the prior period. there are no inter-segment transactions.
allocation of assets
It is the Group’s policy that if items of revenue and expense are not allocated to operating segments then any associated assets are also not allocated to segments. this is to avoid asymmetrical allocations within segments which management believe would be inconsistent.
Business segments
the following tables present revenue and profit information and certain asset and liability information regarding business segments for the years ended 30 June 2011 and 30 June 2010.
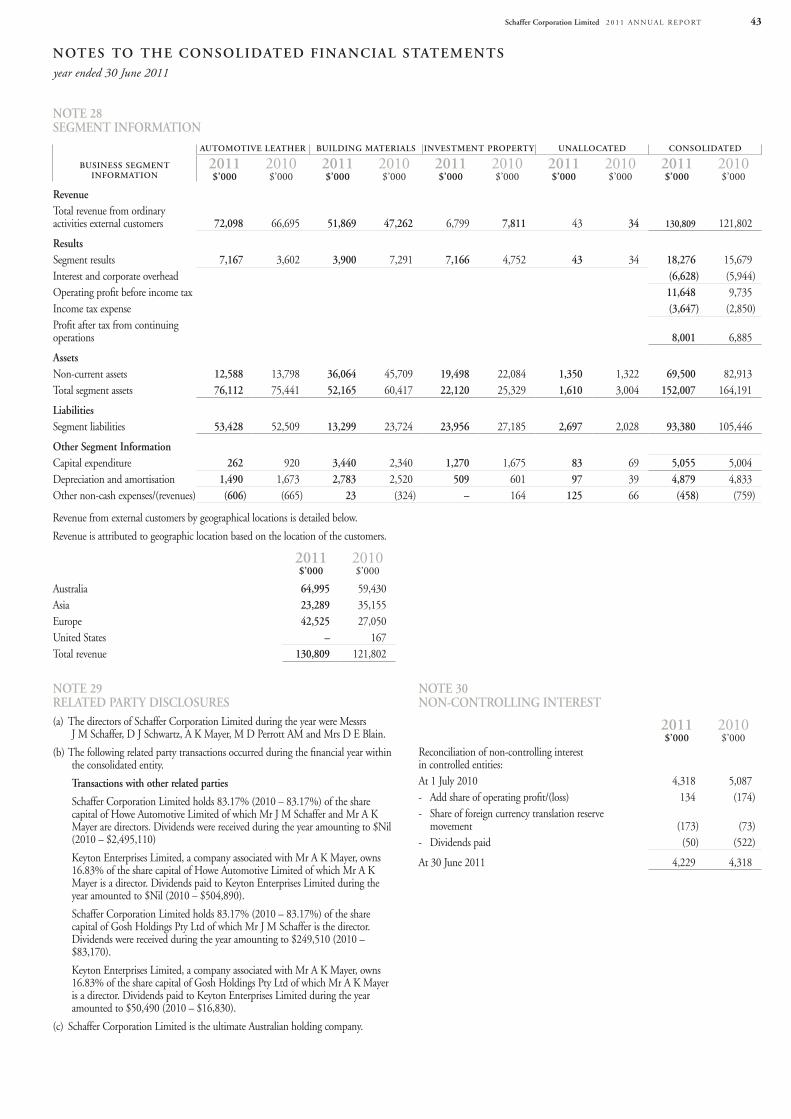
Notes to the CoNsolidated FiNaNCial statemeNtsyear ended 30 June 2011
schaffer Corporation limited 2 0 1 1 A n n u A l R e p o Rt 43
Note 28 segmeNt iNFormatioN
BusiNess segmeNtiNFormatioN
automotive leather BuildiNg materials iNvestmeNt propertY uNalloCated CoNsolidated
2011 2010 2011 2010 2011 2010 2011 2010 2011 2010$’000 $’000 $’000 $’000 $’000 $’000 $’000 $’000 $’000 $’000
revenuetotal revenue from ordinary activities external customers 72,098 66,695 51,869 47,262 6,799 7,811 43 34 130,809 121,802
resultsSegment results 7,167 3,602 3,900 7,291 7,166 4,752 43 34 18,276 15,679Interest and corporate overhead (6,628) (5,944)operating profit before income tax 11,648 9,735Income tax expense (3,647) (2,850)profit after tax from continuing operations 8,001 6,885
assetsnon-current assets 12,588 13,798 36,064 45,709 19,498 22,084 1,350 1,322 69,500 82,913total segment assets 76,112 75,441 52,165 60,417 22,120 25,329 1,610 3,004 152,007 164,191
liabilitiesSegment liabilities 53,428 52,509 13,299 23,724 23,956 27,185 2,697 2,028 93,380 105,446
other segment informationCapital expenditure 262 920 3,440 2,340 1,270 1,675 83 69 5,055 5,004Depreciation and amortisation 1,490 1,673 2,783 2,520 509 601 97 39 4,879 4,833other non-cash expenses/(revenues) (606) (665) 23 (324) – 164 125 66 (458) (759)
Revenue from external customers by geographical locations is detailed below.
Revenue is attributed to geographic location based on the location of the customers.
2011 2010$’000 $’000
Australia 64,995 59,430Asia 23,289 35,155europe 42,525 27,050united States – 167total revenue 130,809 121,802
Note 29 related partY disClosures(a) the directors of Schaffer Corporation limited during the year were Messrs
J M Schaffer, D J Schwartz, A K Mayer, M D perrott AM and Mrs D e Blain.
(b) the following related party transactions occurred during the financial year within the consolidated entity.
transactions with other related parties
Schaffer Corporation limited holds 83.17% (2010 – 83.17%) of the share capital of Howe Automotive limited of which Mr J M Schaffer and Mr A K Mayer are directors. Dividends were received during the year amounting to $nil (2010 – $2,495,110)
Keyton enterprises limited, a company associated with Mr A K Mayer, owns 16.83% of the share capital of Howe Automotive limited of which Mr A K Mayer is a director. Dividends paid to Keyton enterprises limited during the year amounted to $nil (2010 – $504,890).
Schaffer Corporation limited holds 83.17% (2010 – 83.17%) of the share capital of Gosh Holdings pty ltd of which Mr J M Schaffer is the director. Dividends were received during the year amounting to $249,510 (2010 – $83,170).
Keyton enterprises limited, a company associated with Mr A K Mayer, owns 16.83% of the share capital of Gosh Holdings pty ltd of which Mr A K Mayer is a director. Dividends paid to Keyton enterprises limited during the year amounted to $50,490 (2010 – $16,830).
(c) Schaffer Corporation limited is the ultimate Australian holding company.
Note 30 NoN-CoNtrolliNg iNterest
2011 2010$’000 $’000
Reconciliation of non-controlling interest in controlled entities:At 1 July 2010 4,318 5,087- Add share of operating profit/(loss) 134 (174)- Share of foreign currency translation reserve
movement (173) (73)- Dividends paid (50) (522)
At 30 June 2011 4,229 4,318
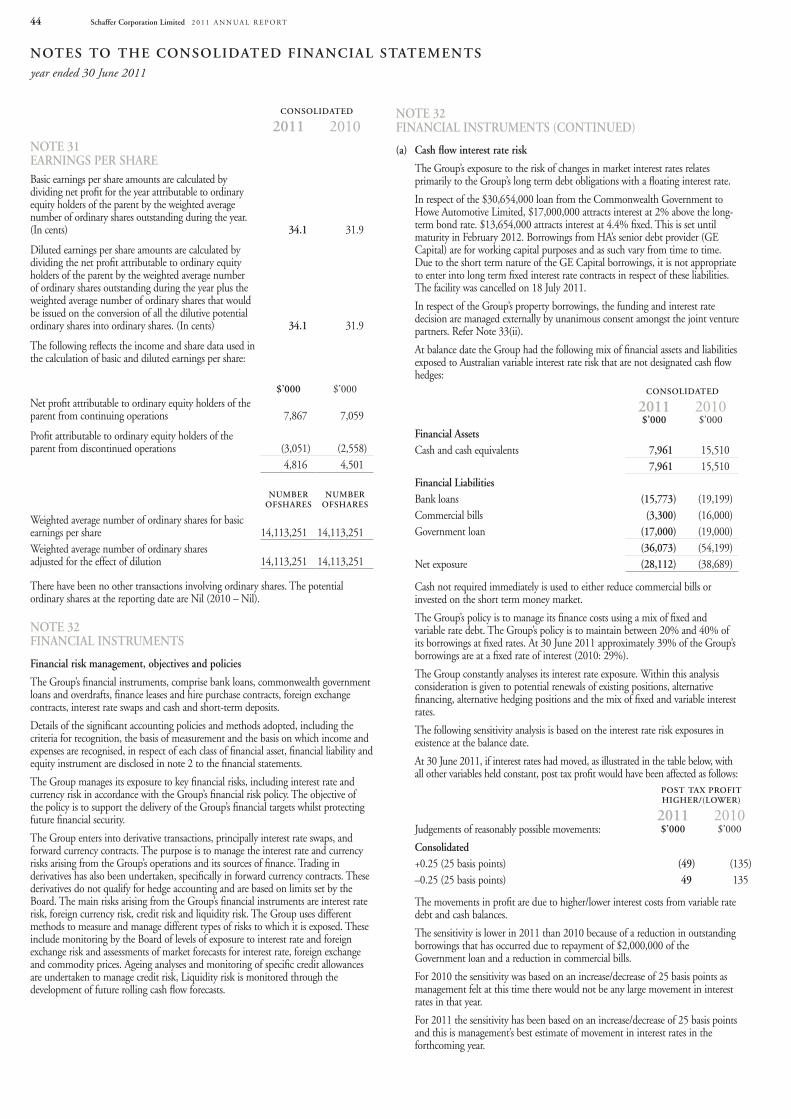
Notes to the CoNsolidated FiNaNCial statemeNtsyear ended 30 June 2011
schaffer Corporation limited 2 0 1 1 A n n u A l R e p o Rt44
CoNsolidated
2011 2010Note 31 earNiNgs per shareBasic earnings per share amounts are calculated by dividing net profit for the year attributable to ordinary equity holders of the parent by the weighted average number of ordinary shares outstanding during the year. (In cents) 34.1 31.9
Diluted earnings per share amounts are calculated by dividing the net profit attributable to ordinary equity holders of the parent by the weighted average number of ordinary shares outstanding during the year plus the weighted average number of ordinary shares that would be issued on the conversion of all the dilutive potential ordinary shares into ordinary shares. (In cents) 34.1 31.9
the following reflects the income and share data used in the calculation of basic and diluted earnings per share:
$’000 $’000net profit attributable to ordinary equity holders of the parent from continuing operations 7,867 7,059
profit attributable to ordinary equity holders of the parent from discontinued operations (3,051) (2,558)
4,816 4,501
NumBer oFshares
NumBer oFshares
Weighted average number of ordinary shares for basic earnings per share 14,113,251 14,113,251Weighted average number of ordinary shares adjusted for the effect of dilution 14,113,251 14,113,251
there have been no other transactions involving ordinary shares. the potential ordinary shares at the reporting date are nil (2010 – nil).
Note 32 FiNaNCial iNstrumeNts
Financial risk management, objectives and policies
the Group’s financial instruments, comprise bank loans, commonwealth government loans and overdrafts, finance leases and hire purchase contracts, foreign exchange contracts, interest rate swaps and cash and short-term deposits.
Details of the significant accounting policies and methods adopted, including the criteria for recognition, the basis of measurement and the basis on which income and expenses are recognised, in respect of each class of financial asset, financial liability and equity instrument are disclosed in note 2 to the financial statements.
the Group manages its exposure to key financial risks, including interest rate and currency risk in accordance with the Group’s financial risk policy. the objective of the policy is to support the delivery of the Group’s financial targets whilst protecting future financial security.
the Group enters into derivative transactions, principally interest rate swaps, and forward currency contracts. the purpose is to manage the interest rate and currency risks arising from the Group’s operations and its sources of finance. trading in derivatives has also been undertaken, specifically in forward currency contracts. these derivatives do not qualify for hedge accounting and are based on limits set by the Board. the main risks arising from the Group’s financial instruments are interest rate risk, foreign currency risk, credit risk and liquidity risk. the Group uses different methods to measure and manage different types of risks to which it is exposed. these include monitoring by the Board of levels of exposure to interest rate and foreign exchange risk and assessments of market forecasts for interest rate, foreign exchange and commodity prices. Ageing analyses and monitoring of specific credit allowances are undertaken to manage credit risk, liquidity risk is monitored through the development of future rolling cash flow forecasts.
Note 32 FiNaNCial iNstrumeNts (CoNtiNued)
(a) Cash flow interest rate risk
the Group’s exposure to the risk of changes in market interest rates relates primarily to the Group’s long term debt obligations with a floating interest rate.
In respect of the $30,654,000 loan from the Commonwealth Government to Howe Automotive limited, $17,000,000 attracts interest at 2% above the long-term bond rate. $13,654,000 attracts interest at 4.4% fixed. this is set until maturity in February 2012. Borrowings from HA’s senior debt provider (Ge Capital) are for working capital purposes and as such vary from time to time. Due to the short term nature of the Ge Capital borrowings, it is not appropriate to enter into long term fixed interest rate contracts in respect of these liabilities.the facility was cancelled on 18 July 2011.
In respect of the Group’s property borrowings, the funding and interest rate decision are managed externally by unanimous consent amongst the joint venture partners. Refer note 33(ii).
At balance date the Group had the following mix of financial assets and liabilities exposed to Australian variable interest rate risk that are not designated cash flow hedges:
CoNsolidated
2011 2010$’000 $’000
Financial assetsCash and cash equivalents 7,961 15,510
7,961 15,510Financial liabilities Bank loans (15,773) (19,199)Commercial bills (3,300) (16,000)Government loan (17,000) (19,000)
(36,073) (54,199)net exposure (28,112) (38,689)
Cash not required immediately is used to either reduce commercial bills or invested on the short term money market.
the Group’s policy is to manage its finance costs using a mix of fixed and variable rate debt. the Group’s policy is to maintain between 20% and 40% of its borrowings at fixed rates. At 30 June 2011 approximately 39% of the Group’s borrowings are at a fixed rate of interest (2010: 29%).
the Group constantly analyses its interest rate exposure. Within this analysis consideration is given to potential renewals of existing positions, alternative financing, alternative hedging positions and the mix of fixed and variable interest rates.
the following sensitivity analysis is based on the interest rate risk exposures in existence at the balance date.
At 30 June 2011, if interest rates had moved, as illustrated in the table below, with all other variables held constant, post tax profit would have been affected as follows:
post taX proFithigher/(loWer)
2011 2010Judgements of reasonably possible movements: $’000 $’000
Consolidated+0.25 (25 basis points) (49) (135)–0.25 (25 basis points) 49 135
the movements in profit are due to higher/lower interest costs from variable rate debt and cash balances.
the sensitivity is lower in 2011 than 2010 because of a reduction in outstanding borrowings that has occurred due to repayment of $2,000,000 of the Government loan and a reduction in commercial bills.
For 2010 the sensitivity was based on an increase/decrease of 25 basis points as management felt at this time there would not be any large movement in interest rates in that year.
For 2011 the sensitivity has been based on an increase/decrease of 25 basis points and this is management’s best estimate of movement in interest rates in the forthcoming year.
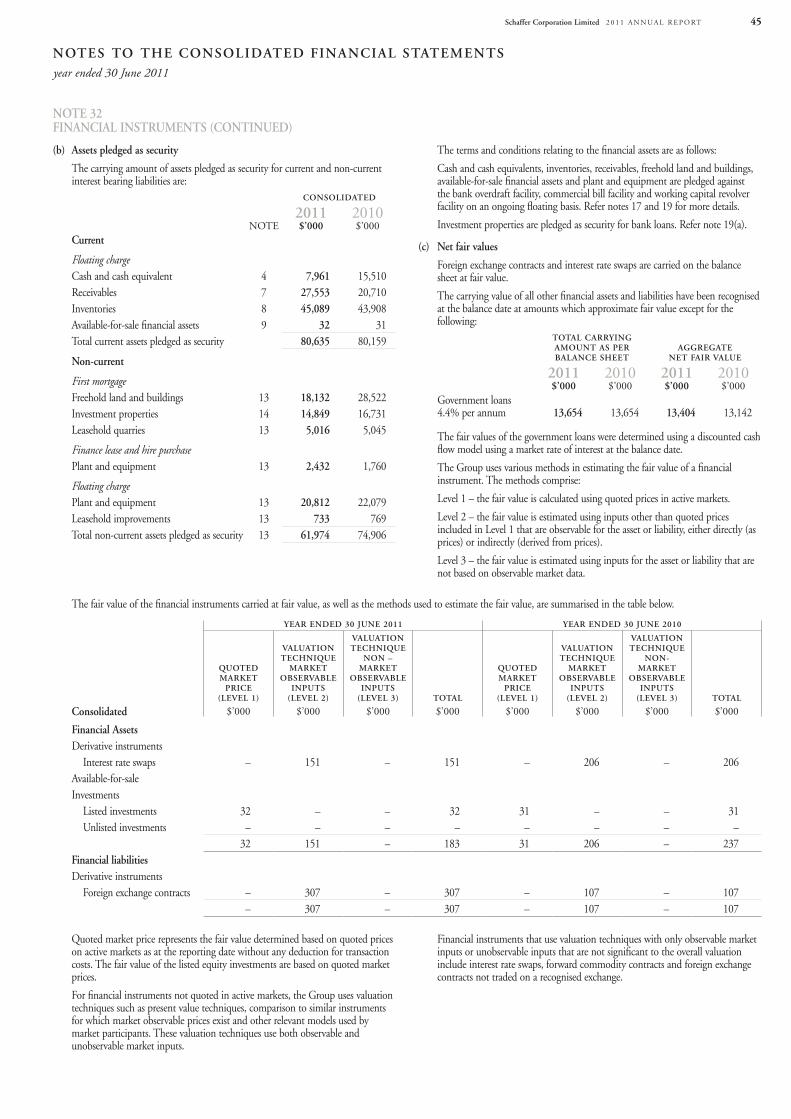
Notes to the CoNsolidated FiNaNCial statemeNtsyear ended 30 June 2011
schaffer Corporation limited 2 0 1 1 A n n u A l R e p o Rt 45
Note 32 FiNaNCial iNstrumeNts (CoNtiNued)
(b) assets pledged as security
the carrying amount of assets pledged as security for current and non-current interest bearing liabilities are:
CoNsolidated
2011 2010note $’000 $’000
Current
Floating chargeCash and cash equivalent 4 7,961 15,510Receivables 7 27,553 20,710Inventories 8 45,089 43,908Available-for-sale financial assets 9 32 31total current assets pledged as security 80,635 80,159
Non-current
First mortgage Freehold land and buildings 13 18,132 28,522Investment properties 14 14,849 16,731leasehold quarries 13 5,016 5,045
Finance lease and hire purchaseplant and equipment 13 2,432 1,760
Floating chargeplant and equipment 13 20,812 22,079leasehold improvements 13 733 769total non-current assets pledged as security 13 61,974 74,906
the terms and conditions relating to the financial assets are as follows:
Cash and cash equivalents, inventories, receivables, freehold land and buildings, available-for-sale financial assets and plant and equipment are pledged against the bank overdraft facility, commercial bill facility and working capital revolver facility on an ongoing floating basis. Refer notes 17 and 19 for more details.
Investment properties are pledged as security for bank loans. Refer note 19(a).
(c) Net fair values
Foreign exchange contracts and interest rate swaps are carried on the balance sheet at fair value.
the carrying value of all other financial assets and liabilities have been recognised at the balance date at amounts which approximate fair value except for the following:
total CarrYiNg amouNt as per BalaNCe sheet
aggregateNet Fair value
2011 2010 2011 2010$’000 $’000 $’000 $’000
Government loans 4.4% per annum 13,654 13,654 13,404 13,142
the fair values of the government loans were determined using a discounted cash flow model using a market rate of interest at the balance date.
the Group uses various methods in estimating the fair value of a financial instrument. the methods comprise:
level 1 – the fair value is calculated using quoted prices in active markets.
level 2 – the fair value is estimated using inputs other than quoted prices included in level 1 that are observable for the asset or liability, either directly (as prices) or indirectly (derived from prices).
level 3 – the fair value is estimated using inputs for the asset or liability that are not based on observable market data.
the fair value of the financial instruments carried at fair value, as well as the methods used to estimate the fair value, are summarised in the table below.
Year eNded 30 JuNe 2011 Year eNded 30 JuNe 2010
Quoted marKet
priCe (level 1)
valuatioN teChNiQue
marKet oBservaBle
iNputs (level 2)
valuatioN teChNiQue
NoN – marKet
oBservaBle iNputs
(level 3) total
Quoted marKet
priCe (level 1)
valuatioN teChNiQue
marKet oBservaBle
iNputs (level 2)
valuatioN teChNiQue
NoN-marKet
oBservaBle iNputs
(level 3) total
Consolidated $’000 $’000 $’000 $’000 $’000 $’000 $’000 $’000
Financial assetsDerivative instruments
Interest rate swaps – 151 – 151 – 206 – 206Available-for-saleInvestments
listed investments 32 – – 32 31 – – 31unlisted investments – – – – – – – –
32 151 – 183 31 206 – 237Financial liabilitiesDerivative instruments
Foreign exchange contracts – 307 – 307 – 107 – 107– 307 – 307 – 107 – 107
quoted market price represents the fair value determined based on quoted prices on active markets as at the reporting date without any deduction for transaction costs. the fair value of the listed equity investments are based on quoted market prices.
For financial instruments not quoted in active markets, the Group uses valuation techniques such as present value techniques, comparison to similar instruments for which market observable prices exist and other relevant models used by market participants. these valuation techniques use both observable and unobservable market inputs.
Financial instruments that use valuation techniques with only observable market inputs or unobservable inputs that are not significant to the overall valuation include interest rate swaps, forward commodity contracts and foreign exchange contracts not traded on a recognised exchange.
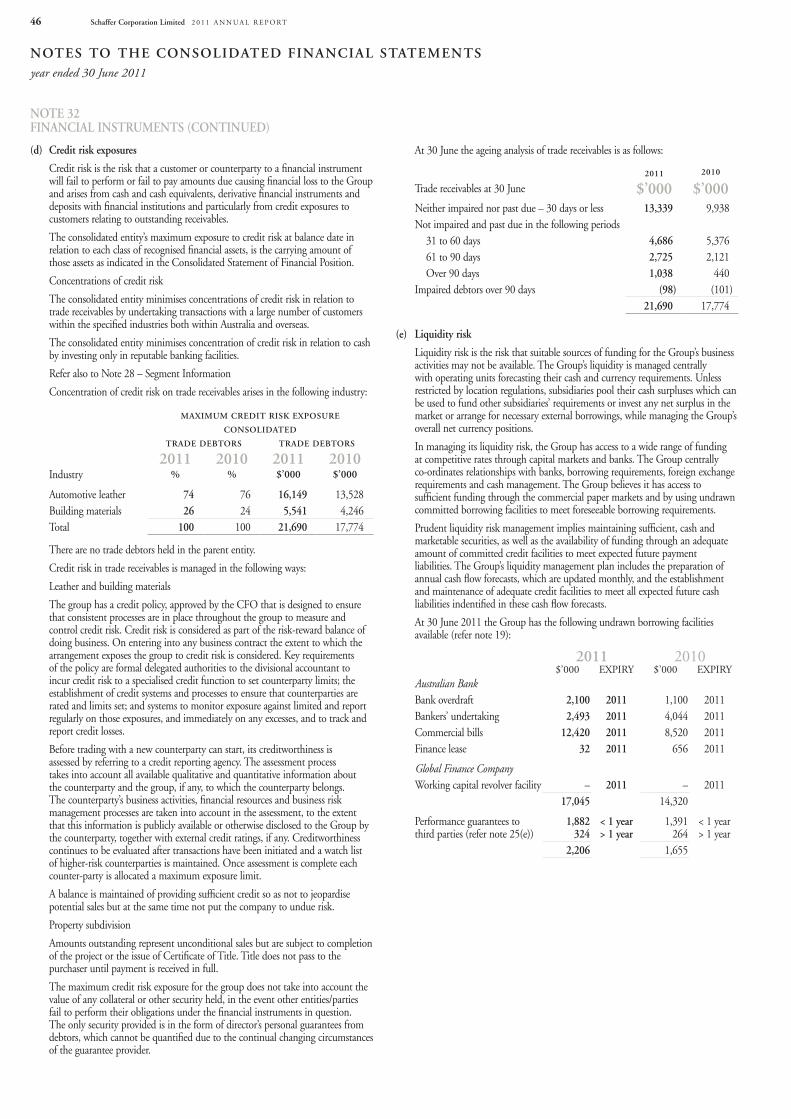
Notes to the CoNsolidated FiNaNCial statemeNtsyear ended 30 June 2011
schaffer Corporation limited 2 0 1 1 A n n u A l R e p o Rt46
Note 32 FiNaNCial iNstrumeNts (CoNtiNued)
(d) Credit risk exposures
Credit risk is the risk that a customer or counterparty to a financial instrument will fail to perform or fail to pay amounts due causing financial loss to the Group and arises from cash and cash equivalents, derivative financial instruments and deposits with financial institutions and particularly from credit exposures to customers relating to outstanding receivables.
the consolidated entity’s maximum exposure to credit risk at balance date in relation to each class of recognised financial assets, is the carrying amount of those assets as indicated in the Consolidated Statement of Financial position.
Concentrations of credit risk
the consolidated entity minimises concentrations of credit risk in relation to trade receivables by undertaking transactions with a large number of customers within the specified industries both within Australia and overseas.
the consolidated entity minimises concentration of credit risk in relation to cash by investing only in reputable banking facilities.
Refer also to note 28 – Segment Information
Concentration of credit risk on trade receivables arises in the following industry:
maXimum Credit risK eXposure
CoNsolidated
trade deBtors trade deBtors
2011 2010 2011 2010Industry % % $’000 $’000
Automotive leather 74 76 16,149 13,528Building materials 26 24 5,541 4,246total 100 100 21,690 17,774
there are no trade debtors held in the parent entity.
Credit risk in trade receivables is managed in the following ways:
leather and building materials
the group has a credit policy, approved by the CFo that is designed to ensure that consistent processes are in place throughout the group to measure and control credit risk. Credit risk is considered as part of the risk-reward balance of doing business. on entering into any business contract the extent to which the arrangement exposes the group to credit risk is considered. Key requirements of the policy are formal delegated authorities to the divisional accountant to incur credit risk to a specialised credit function to set counterparty limits; the establishment of credit systems and processes to ensure that counterparties are rated and limits set; and systems to monitor exposure against limited and report regularly on those exposures, and immediately on any excesses, and to track and report credit losses.
Before trading with a new counterparty can start, its creditworthiness is assessed by referring to a credit reporting agency. the assessment process takes into account all available qualitative and quantitative information about the counterparty and the group, if any, to which the counterparty belongs. the counterparty’s business activities, financial resources and business risk management processes are taken into account in the assessment, to the extent that this information is publicly available or otherwise disclosed to the Group by the counterparty, together with external credit ratings, if any. Creditworthiness continues to be evaluated after transactions have been initiated and a watch list of higher-risk counterparties is maintained. once assessment is complete each counter-party is allocated a maximum exposure limit.
A balance is maintained of providing sufficient credit so as not to jeopardise potential sales but at the same time not put the company to undue risk.
property subdivision
Amounts outstanding represent unconditional sales but are subject to completion of the project or the issue of Certificate of title. title does not pass to the purchaser until payment is received in full.
the maximum credit risk exposure for the group does not take into account the value of any collateral or other security held, in the event other entities/parties fail to perform their obligations under the financial instruments in question. the only security provided is in the form of director’s personal guarantees from debtors, which cannot be quantified due to the continual changing circumstances of the guarantee provider.
At 30 June the ageing analysis of trade receivables is as follows:
2011 2010
trade receivables at 30 June $’000 $’000neither impaired nor past due – 30 days or less 13,339 9,938not impaired and past due in the following periods
31 to 60 days 4,686 5,37661 to 90 days 2,725 2,121over 90 days 1,038 440
Impaired debtors over 90 days (98) (101)21,690 17,774
(e) liquidity risk
liquidity risk is the risk that suitable sources of funding for the Group’s business activities may not be available. the Group’s liquidity is managed centrally with operating units forecasting their cash and currency requirements. unless restricted by location regulations, subsidiaries pool their cash surpluses which can be used to fund other subsidiaries’ requirements or invest any net surplus in the market or arrange for necessary external borrowings, while managing the Group’s overall net currency positions.
In managing its liquidity risk, the Group has access to a wide range of funding at competitive rates through capital markets and banks. the Group centrally co-ordinates relationships with banks, borrowing requirements, foreign exchange requirements and cash management. the Group believes it has access to sufficient funding through the commercial paper markets and by using undrawn committed borrowing facilities to meet foreseeable borrowing requirements.
prudent liquidity risk management implies maintaining sufficient, cash and marketable securities, as well as the availability of funding through an adequate amount of committed credit facilities to meet expected future payment liabilities. the Group’s liquidity management plan includes the preparation of annual cash flow forecasts, which are updated monthly, and the establishment and maintenance of adequate credit facilities to meet all expected future cash liabilities indentified in these cash flow forecasts.
At 30 June 2011 the Group has the following undrawn borrowing facilities available (refer note 19):
2011 2010$’000 eXpIRy $’000 eXpIRy
Australian BankBank overdraft 2,100 2011 1,100 2011Bankers’ undertaking 2,493 2011 4,044 2011Commercial bills 12,420 2011 8,520 2011Finance lease 32 2011 656 2011
Global Finance CompanyWorking capital revolver facility – 2011 – 2011
17,045 14,320
performance guarantees to third parties (refer note 25(e))
1,882324
< 1 year> 1 year
1,391264
< 1 year> 1 year
2,206 1,655
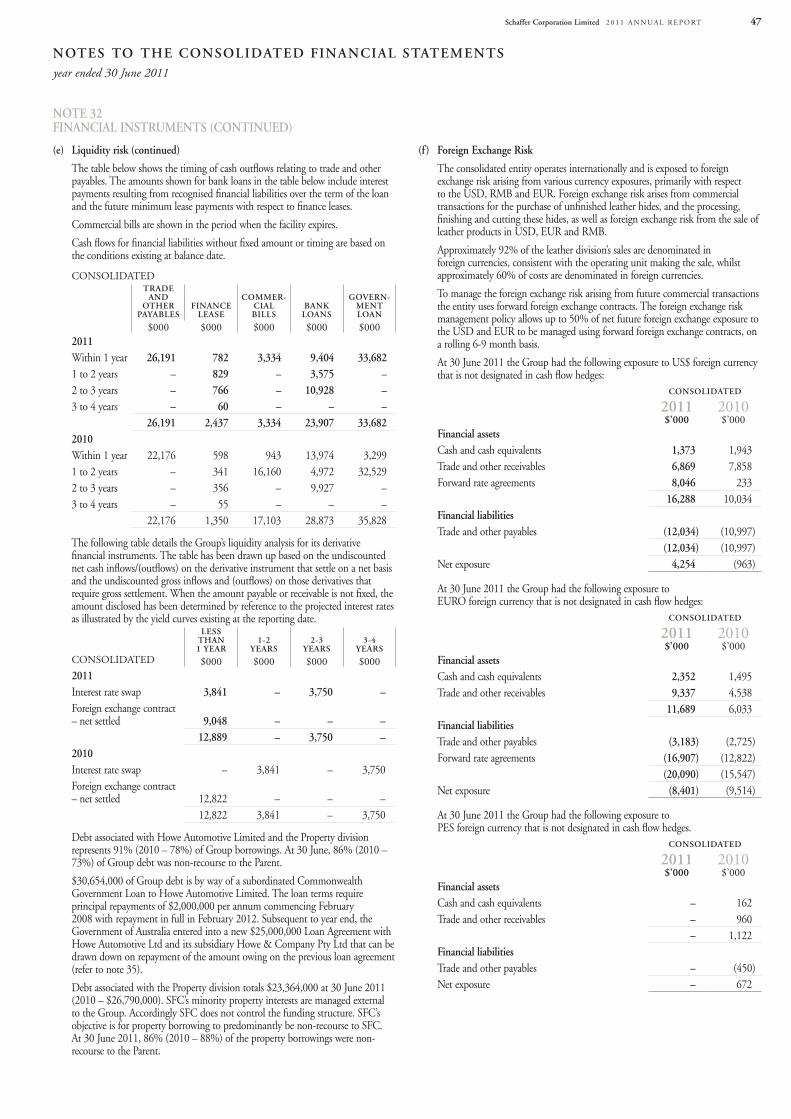
Notes to the CoNsolidated FiNaNCial statemeNtsyear ended 30 June 2011
schaffer Corporation limited 2 0 1 1 A n n u A l R e p o Rt 47
Note 32 FiNaNCial iNstrumeNts (CoNtiNued)
(e) liquidity risk (continued)
the table below shows the timing of cash outflows relating to trade and other payables. the amounts shown for bank loans in the table below include interest payments resulting from recognised financial liabilities over the term of the loan and the future minimum lease payments with respect to finance leases.
Commercial bills are shown in the period when the facility expires.
Cash flows for financial liabilities without fixed amount or timing are based on the conditions existing at balance date.
ConSolIDAteDtrade
aNd other
paYaBlesFiNaNCe
lease
Commer-Cial Bills
BaNKloaNs
goverN-meNtloaN
$000 $000 $000 $000 $0002011Within 1 year 26,191 782 3,334 9,404 33,6821 to 2 years – 829 – 3,575 –2 to 3 years – 766 – 10,928 –3 to 4 years – 60 – – –
26,191 2,437 3,334 23,907 33,6822010Within 1 year 22,176 598 943 13,974 3,2991 to 2 years – 341 16,160 4,972 32,5292 to 3 years – 356 – 9,927 –3 to 4 years – 55 – – –
22,176 1,350 17,103 28,873 35,828
the following table details the Group’s liquidity analysis for its derivative financial instruments. the table has been drawn up based on the undiscounted net cash inflows/(outflows) on the derivative instrument that settle on a net basis and the undiscounted gross inflows and (outflows) on those derivatives that require gross settlement. When the amount payable or receivable is not fixed, the amount disclosed has been determined by reference to the projected interest rates as illustrated by the yield curves existing at the reporting date.
ConSolIDAteD
less thaN 1 Year
1-2 Years
2-3 Years
3-4 Years
$000 $000 $000 $0002011Interest rate swap 3,841 – 3,750 –Foreign exchange contract – net settled 9,048 – – –
12,889 – 3,750 –2010Interest rate swap – 3,841 – 3,750Foreign exchange contract – net settled 12,822 – – –
12,822 3,841 – 3,750
Debt associated with Howe Automotive limited and the property division represents 91% (2010 – 78%) of Group borrowings. At 30 June, 86% (2010 – 73%) of Group debt was non-recourse to the parent.
$30,654,000 of Group debt is by way of a subordinated Commonwealth Government loan to Howe Automotive limited. the loan terms require principal repayments of $2,000,000 per annum commencing February 2008 with repayment in full in February 2012. Subsequent to year end, the Government of Australia entered into a new $25,000,000 loan Agreement with Howe Automotive ltd and its subsidiary Howe & Company pty ltd that can be drawn down on repayment of the amount owing on the previous loan agreement (refer to note 35).
Debt associated with the property division totals $23,364,000 at 30 June 2011 (2010 – $26,790,000). SFC’s minority property interests are managed external to the Group. Accordingly SFC does not control the funding structure. SFC’s objective is for property borrowing to predominantly be non-recourse to SFC. At 30 June 2011, 86% (2010 – 88%) of the property borrowings were non-recourse to the parent.
(f) Foreign exchange risk
the consolidated entity operates internationally and is exposed to foreign exchange risk arising from various currency exposures, primarily with respect to the uSD, RMB and euR. Foreign exchange risk arises from commercial transactions for the purchase of unfinished leather hides, and the processing, finishing and cutting these hides, as well as foreign exchange risk from the sale of leather products in uSD, euR and RMB.
Approximately 92% of the leather division’s sales are denominated in foreign currencies, consistent with the operating unit making the sale, whilst approximately 60% of costs are denominated in foreign currencies.
to manage the foreign exchange risk arising from future commercial transactions the entity uses forward foreign exchange contracts. the foreign exchange risk management policy allows up to 50% of net future foreign exchange exposure to the uSD and euR to be managed using forward foreign exchange contracts, on a rolling 6-9 month basis.
At 30 June 2011 the Group had the following exposure to uS$ foreign currency that is not designated in cash flow hedges:
CoNsolidated
2011 2010$’000 $’000
Financial assetsCash and cash equivalents 1,373 1,943trade and other receivables 6,869 7,858Forward rate agreements 8,046 233
16,288 10,034Financial liabilitiestrade and other payables (12,034) (10,997)
(12,034) (10,997)net exposure 4,254 (963)
At 30 June 2011 the Group had the following exposure to euRo foreign currency that is not designated in cash flow hedges:
CoNsolidated
2011 2010$’000 $’000
Financial assetsCash and cash equivalents 2,352 1,495trade and other receivables 9,337 4,538
11,689 6,033Financial liabilitiestrade and other payables (3,183) (2,725)Forward rate agreements (16,907) (12,822)
(20,090) (15,547)net exposure (8,401) (9,514)
At 30 June 2011 the Group had the following exposure to peS foreign currency that is not designated in cash flow hedges.
CoNsolidated
2011 2010$’000 $’000
Financial assetsCash and cash equivalents – 162trade and other receivables – 960
– 1,122Financial liabilitiestrade and other payables – (450)net exposure – 672
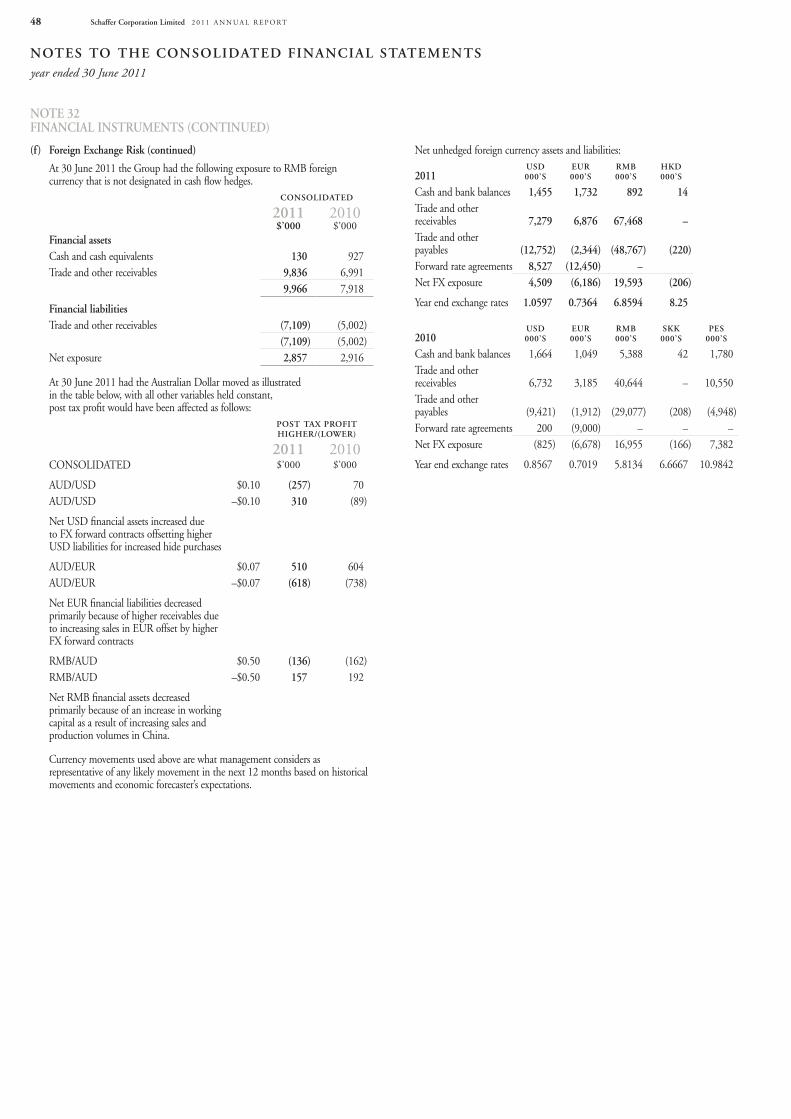
Notes to the CoNsolidated FiNaNCial statemeNtsyear ended 30 June 2011
schaffer Corporation limited 2 0 1 1 A n n u A l R e p o Rt48
Note 32 FiNaNCial iNstrumeNts (CoNtiNued)
(f) Foreign exchange risk (continued)
At 30 June 2011 the Group had the following exposure to RMB foreign currency that is not designated in cash flow hedges.
CoNsolidated
2011 2010$’000 $’000
Financial assetsCash and cash equivalents 130 927trade and other receivables 9,836 6,991
9,966 7,918
Financial liabilitiestrade and other receivables (7,109) (5,002)
(7,109) (5,002)net exposure 2,857 2,916
At 30 June 2011 had the Australian Dollar moved as illustrated in the table below, with all other variables held constant, post tax profit would have been affected as follows:
post taX proFithigher/(loWer)
2011 2010ConSolIDAteD $’000 $’000
AuD/uSD $0.10 (257) 70AuD/uSD –$0.10 310 (89)
net uSD financial assets increased due to FX forward contracts offsetting higher uSD liabilities for increased hide purchases
AuD/euR $0.07 510 604AuD/euR –$0.07 (618) (738)
net euR financial liabilities decreased primarily because of higher receivables due to increasing sales in euR offset by higher FX forward contracts
RMB/AuD $0.50 (136) (162)RMB/AuD –$0.50 157 192
net RMB financial assets decreased primarily because of an increase in working capital as a result of increasing sales and production volumes in China.
Currency movements used above are what management considers as representative of any likely movement in the next 12 months based on historical movements and economic forecaster’s expectations.
net unhedged foreign currency assets and liabilities:
2011usd000’s
eur000’s
rmB000’s
hKd000’s
Cash and bank balances 1,455 1,732 892 14trade and other receivables 7,279 6,876 67,468 –trade and other payables (12,752) (2,344) (48,767) (220)Forward rate agreements 8,527 (12,450) –net FX exposure 4,509 (6,186) 19,593 (206)
year end exchange rates 1.0597 0.7364 6.8594 8.25
2010usd000’s
eur000’s
rmB000’s
sKK000’s
pes000’s
Cash and bank balances 1,664 1,049 5,388 42 1,780trade and other receivables 6,732 3,185 40,644 – 10,550trade and other payables (9,421) (1,912) (29,077) (208) (4,948)Forward rate agreements 200 (9,000) – – –net FX exposure (825) (6,678) 16,955 (166) 7,382
year end exchange rates 0.8567 0.7019 5.8134 6.6667 10.9842
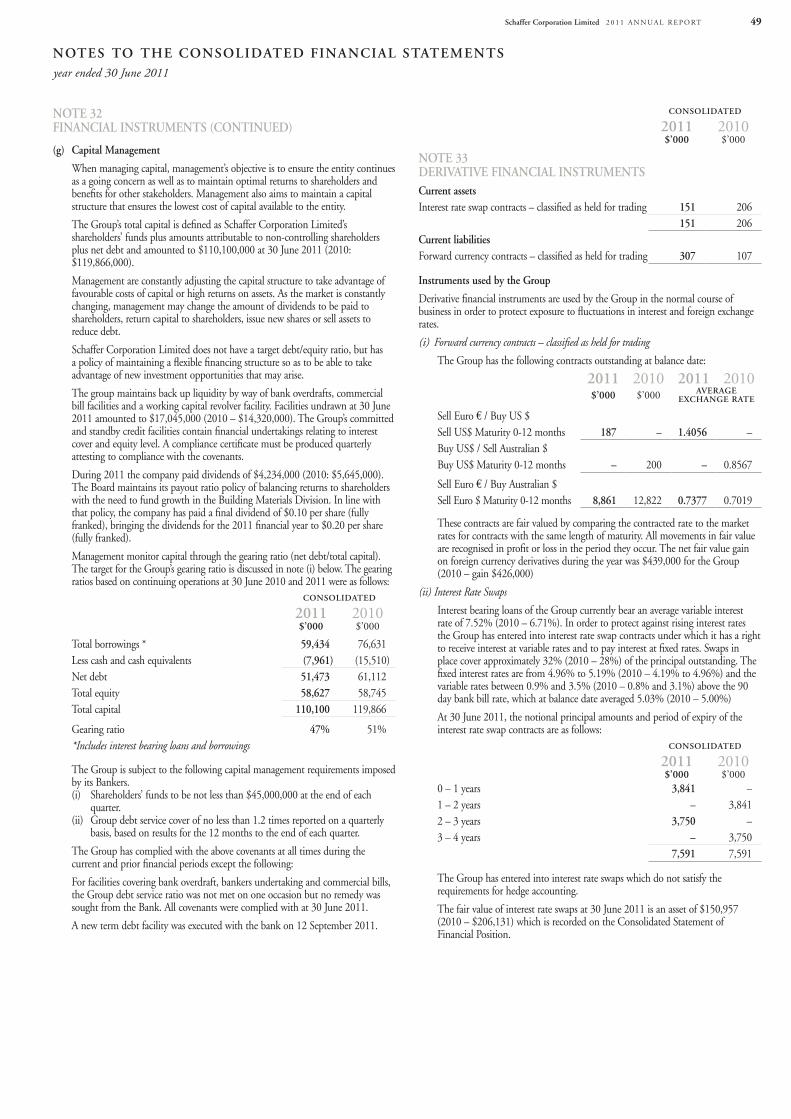
Notes to the CoNsolidated FiNaNCial statemeNtsyear ended 30 June 2011
schaffer Corporation limited 2 0 1 1 A n n u A l R e p o Rt 49
Note 32 FiNaNCial iNstrumeNts (CoNtiNued)
(g) Capital management
When managing capital, management’s objective is to ensure the entity continues as a going concern as well as to maintain optimal returns to shareholders and benefits for other stakeholders. Management also aims to maintain a capital structure that ensures the lowest cost of capital available to the entity.
the Group’s total capital is defined as Schaffer Corporation limited’s shareholders’ funds plus amounts attributable to non-controlling shareholders plus net debt and amounted to $110,100,000 at 30 June 2011 (2010: $119,866,000).
Management are constantly adjusting the capital structure to take advantage of favourable costs of capital or high returns on assets. As the market is constantly changing, management may change the amount of dividends to be paid to shareholders, return capital to shareholders, issue new shares or sell assets to reduce debt.
Schaffer Corporation limited does not have a target debt/equity ratio, but has a policy of maintaining a flexible financing structure so as to be able to take advantage of new investment opportunities that may arise.
the group maintains back up liquidity by way of bank overdrafts, commercial bill facilities and a working capital revolver facility. Facilities undrawn at 30 June 2011 amounted to $17,045,000 (2010 – $14,320,000). the Group’s committed and standby credit facilities contain financial undertakings relating to interest cover and equity level. A compliance certificate must be produced quarterly attesting to compliance with the covenants.
During 2011 the company paid dividends of $4,234,000 (2010: $5,645,000). the Board maintains its payout ratio policy of balancing returns to shareholders with the need to fund growth in the Building Materials Division. In line with that policy, the company has paid a final dividend of $0.10 per share (fully franked), bringing the dividends for the 2011 financial year to $0.20 per share (fully franked).
Management monitor capital through the gearing ratio (net debt/total capital). the target for the Group’s gearing ratio is discussed in note (i) below. the gearing ratios based on continuing operations at 30 June 2010 and 2011 were as follows:
CoNsolidated
2011 2010$’000 $’000
total borrowings * 59,434 76,631less cash and cash equivalents (7,961) (15,510)net debt 51,473 61,112total equity 58,627 58,745total capital 110,100 119,866
Gearing ratio 47% 51%*Includes interest bearing loans and borrowings
the Group is subject to the following capital management requirements imposed by its Bankers.(i) Shareholders’ funds to be not less than $45,000,000 at the end of each
quarter.(ii) Group debt service cover of no less than 1.2 times reported on a quarterly
basis, based on results for the 12 months to the end of each quarter.
the Group has complied with the above covenants at all times during the current and prior financial periods except the following:
For facilities covering bank overdraft, bankers undertaking and commercial bills, the Group debt service ratio was not met on one occasion but no remedy was sought from the Bank. All covenants were complied with at 30 June 2011.
A new term debt facility was executed with the bank on 12 September 2011.
CoNsolidated
2011 2010$’000 $’000
Note 33 derivative FiNaNCial iNstrumeNtsCurrent assetsInterest rate swap contracts – classified as held for trading 151 206
151 206Current liabilitiesForward currency contracts – classified as held for trading 307 107
instruments used by the group
Derivative financial instruments are used by the Group in the normal course of business in order to protect exposure to fluctuations in interest and foreign exchange rates.
(i) Forward currency contracts – classified as held for trading
the Group has the following contracts outstanding at balance date:
2011 2010 2011 2010$’000 $’000 average
eXChaNge rate
Sell euro € / Buy uS $Sell uS$ Maturity 0-12 months 187 – 1.4056 –Buy uS$ / Sell Australian $Buy uS$ Maturity 0-12 months – 200 – 0.8567
Sell euro € / Buy Australian $Sell euro $ Maturity 0-12 months 8,861 12,822 0.7377 0.7019
these contracts are fair valued by comparing the contracted rate to the market rates for contracts with the same length of maturity. All movements in fair value are recognised in profit or loss in the period they occur. the net fair value gain on foreign currency derivatives during the year was $439,000 for the Group (2010 – gain $426,000)
(ii) Interest Rate Swaps
Interest bearing loans of the Group currently bear an average variable interest rate of 7.52% (2010 – 6.71%). In order to protect against rising interest rates the Group has entered into interest rate swap contracts under which it has a right to receive interest at variable rates and to pay interest at fixed rates. Swaps in place cover approximately 32% (2010 – 28%) of the principal outstanding. the fixed interest rates are from 4.96% to 5.19% (2010 – 4.19% to 4.96%) and the variable rates between 0.9% and 3.5% (2010 – 0.8% and 3.1%) above the 90 day bank bill rate, which at balance date averaged 5.03% (2010 – 5.00%)
At 30 June 2011, the notional principal amounts and period of expiry of the interest rate swap contracts are as follows:
CoNsolidated
2011 2010$’000 $’000
0 – 1 years 3,841 –1 – 2 years – 3,8412 – 3 years 3,750 –3 – 4 years – 3,750
7,591 7,591
the Group has entered into interest rate swaps which do not satisfy the requirements for hedge accounting.
the fair value of interest rate swaps at 30 June 2011 is an asset of $150,957 (2010 – $206,131) which is recorded on the Consolidated Statement of Financial position.
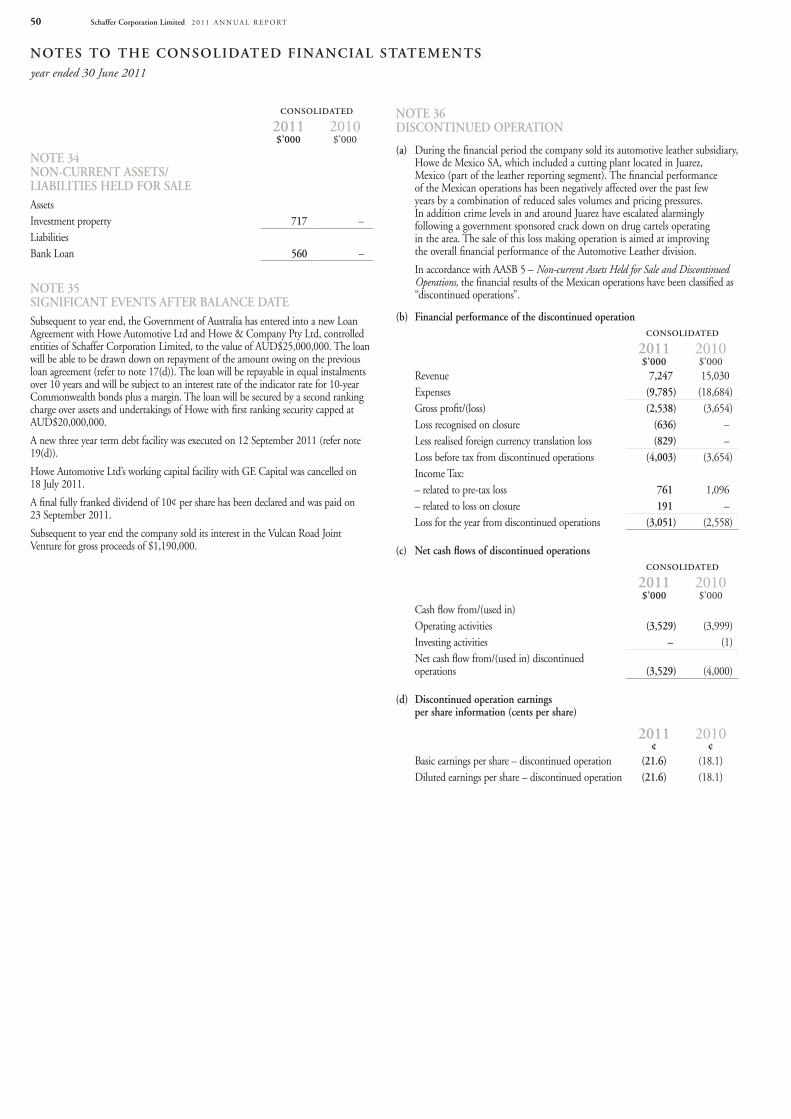
Notes to the CoNsolidated FiNaNCial statemeNtsyear ended 30 June 2011
schaffer Corporation limited 2 0 1 1 A n n u A l R e p o Rt50
CoNsolidated
2011 2010$’000 $’000
Note 34 NoN-CurreNt assets/liaBilities held For saleAssets Investment property 717 –liabilitiesBank loan 560 –
Note 35 sigNiFiCaNt eveNts aFter BalaNCe dateSubsequent to year end, the Government of Australia has entered into a new loan Agreement with Howe Automotive ltd and Howe & Company pty ltd, controlled entities of Schaffer Corporation limited, to the value of AuD$25,000,000. the loan will be able to be drawn down on repayment of the amount owing on the previous loan agreement (refer to note 17(d)). the loan will be repayable in equal instalments over 10 years and will be subject to an interest rate of the indicator rate for 10-year Commonwealth bonds plus a margin. the loan will be secured by a second ranking charge over assets and undertakings of Howe with first ranking security capped at AuD$20,000,000.
A new three year term debt facility was executed on 12 September 2011 (refer note 19(d)).
Howe Automotive ltd’s working capital facility with Ge Capital was cancelled on 18 July 2011.
A final fully franked dividend of 10¢ per share has been declared and was paid on 23 September 2011.
Subsequent to year end the company sold its interest in the vulcan Road Joint venture for gross proceeds of $1,190,000.
Note 36 disCoNtiNued operatioN
(a) During the financial period the company sold its automotive leather subsidiary, Howe de Mexico SA, which included a cutting plant located in Juarez, Mexico (part of the leather reporting segment). the financial performance of the Mexican operations has been negatively affected over the past few years by a combination of reduced sales volumes and pricing pressures. In addition crime levels in and around Juarez have escalated alarmingly following a government sponsored crack down on drug cartels operating in the area. the sale of this loss making operation is aimed at improving the overall financial performance of the Automotive leather division.
In accordance with AASB 5 – Non-current Assets Held for Sale and Discontinued Operations, the financial results of the Mexican operations have been classified as “discontinued operations”.
(b) Financial performance of the discontinued operationCoNsolidated
2011 2010$’000 $’000
Revenue 7,247 15,030expenses (9,785) (18,684)Gross profit/(loss) (2,538) (3,654)loss recognised on closure (636) –less realised foreign currency translation loss (829) –loss before tax from discontinued operations (4,003) (3,654)Income tax:– related to pre-tax loss 761 1,096– related to loss on closure 191 –loss for the year from discontinued operations (3,051) (2,558)
(c) Net cash flows of discontinued operationsCoNsolidated
2011 2010$’000 $’000
Cash flow from/(used in)operating activities (3,529) (3,999)Investing activities – (1)net cash flow from/(used in) discontinued operations (3,529) (4,000)
(d) discontinued operation earnings per share information (cents per share)
2011 2010¢ ¢
Basic earnings per share – discontinued operation (21.6) (18.1)Diluted earnings per share – discontinued operation (21.6) (18.1)
schaffer Corporation limited 2 0 1 1 A n n u A l R e p o Rt 51
In accordance with a resolution of the directors of Schaffer Corporation limited, we state that:
In the opinion of the directors:
a) the financial statements and notes of the consolidated entity are in accordance with the Corporation’s Act 2001, including:
(i) giving a true and fair view of the consolidated entity’s financial position as at 30 June 2011 and of its performance for the year ended on that date; and
(ii) complying with Accounting Standards (including the Australian Accounting Interpretations) and the Corporations Regulations 2001; and
b) the financial statements and notes also comply with International Financial Reporting Standards as disclosed in note 2.
c) there are reasonable grounds to believe that the consolidated entity will be able to pay its debts as and when they become due and payable;
d) this declaration has been made after receiving the declarations required to be made to the directors in accordance with section 295A of the Corporations Act 2001 for the financial period ended 30 June 2011.
e) As at the date of this declaration, there are reasonable grounds to believe that the members of the Closed Group identified in note 12 will be able to meet any obligation or liabilities to which they are or may become subject to, by virtue of the Deed of Cross Guarantee.
on behalf of the Board
J m schaffer Chairman and Managing Director
perth, 23 September 2011
direCtors’ deClaratioNyear ended 30 June 2011
Schaffer Corporation Limited 2 0 1 1 A n n u A l R e p o Rt52
Opinion
In our opinion:
a. the financial report of Schaffer Corporation limited is in accordance with the Corporations Act 2001, including:
i giving a true and fair view of the consolidated entity’s financial position as at 30 June 2011 and of its performance for the year ended on that date; and
ii complying with Australian Accounting Standards and the Corporations Regulations 2001; and
b. the financial report also complies with International Financial Reporting Standards as disclosed in note 2.
Report on the Remuneration Report
We have audited the Remuneration Report included in pages 54 to 58 of the annual report for the year ended 30 June 2011. the directors of the company are responsible for the preparation and presentation of the Remuneration Report in accordance with section 300A of the Corporations Act 2001. our responsibility is to express an opinion on the Remuneration Report, based on our audit conducted in accordance with Australian Auditing Standards.
Opinion
In our opinion, the Remuneration Report of Schaffer Corporation limited for the year ended 30 June 2011, complies with section 300A of the Corporations Act 2001.
Ernst & Young
Gavin Buckingham partner perth 23 September 2011
liability limited by a scheme approvedunder professional Standards legislation
IndEpEndEnt AudItor’S rEport to thE MEMBErS of SChAffEr CorporAtIon LIMItEd
Report on the financial report
We have audited the accompanying financial report of Schaffer Corporation limited which comprises the consolidated statement of financial position as at 30 June 2011, the consolidated statement of comprehensive income, the consolidated statement of changes in equity and the consolidated statement of cash flows for the year then ended, notes comprising a summary of significant accounting policies and other explanatory information, and the directors’ declaration of the consolidated entity comprising the company and the entities it controlled at the year’s end or from time to time during the financial year.
Directors’ responsibility for the financial report
the directors of the company are responsible for the preparation of the financial report that gives a true and fair view in accordance with Australian Accounting Standards and the Corporations Act 2001 and for such internal controls as the directors determine are necessary to enable the preparation of the financial report that is free from material misstatement, whether due to fraud or error. In note 2, the directors also state, in accordance with Accounting Standard AASB 101 Presentation of Financial Statements, that the financial statements comply with International Financial Reporting Standards.
Auditor’s responsibility
our responsibility is to express an opinion on the financial report based on our audit. We conducted our audit in accordance with Australian Auditing Standards. those standards require that we comply with relevant ethical requirements relating to audit engagements and plan and perform the audit to obtain reasonable assurance about whether the financial report is free from material misstatement.
An audit involves performing procedures to obtain audit evidence about the amounts and disclosures in the financial report. the procedures selected depend on the auditor’s judgment, including the assessment of the risks of material misstatement of the financial report, whether due to fraud or error. In making those risk assessments, the auditor considers internal controls relevant to the entity’s preparation and fair presentation of the financial report in order to design audit procedures that are appropriate in the circumstances, but not for the purpose of expressing an opinion on the effectiveness of the entity’s internal controls. An audit also includes evaluating the appropriateness of accounting policies used and the reasonableness of accounting estimates made by the directors, as well as evaluating the overall presentation of the financial report.
We believe that the audit evidence we have obtained is sufficient and appropriate to provide a basis for our audit opinion.
Independence
In conducting our audit we have complied with the independence requirements of the Corporations Act 2001. We have given to the directors of the company a written Auditor’s Independence Declaration, a copy of which is included in the directors’ report.
schaffer Corporation limited 2 0 1 1 A n n u A l R e p o Rt 53
atteNdaNCe at audit Committee meetiNgsDuring the year, two audit committee meetings were held. Mr D J Schwartz, Mr M D perrott AM and Mrs D e Blain attended both meetings. All the above committee members are also directors of the company.
atteNdaNCe at NomiNatioN aNd remuNeratioN Committee meetiNgsthe SFC Board established the nomination and Remuneration Committee on 23 February 2005. the members of this Board sub-committee are Mrs D e Blain, Mr M D perrott AM and Mr D J Schwartz. the nomination and Remuneration Committee held one meeting during the year with all members being in attendance.
iNterests iN the shares oF the CompaNY aNd related Bodies CorporateAt the date of this report the economic interest of the Directors in the shares of the Company were:
sChaFFer CorporatioN limited
ordiNarY shares
optioNs over ordiNarY shares
J M Schaffer D e BlainA K MayerM D perrott AM D J Schwartz
2,655,9271,562,360
347,1851,000
585,726
–––––
priNCipal aCtivitiesthe principal activities of the entities within the consolidated entity, in the course of the financial year were automotive leather, paving, concrete and limestone product manufacture and property leasing.
resultsthe consolidated entity’s operating profit after tax for the financial year was a profit of $4,950,000. (2010 – $4,327,000).
operatiNg aNd FiNaNCial revieWplease refer to Managing Director’s report for details.
sigNiFiCaNt ChaNges iN the state oF aFFairsIn the opinion of the directors of the consolidated entity there has not arisen during the financial year, or in the interval between the end of the financial year and the date of this report, any matter or circumstance that has significantly affected or may significantly affect the operations of the consolidated entity, the results of those operations of the state of affairs of the consolidated entity in subsequent financial years.
your directors submit their report for the year ended 30 June 2011 made in accordance with a resolution of the directors.
direCtorsDetails of the directors of the company during the financial year and up to the date of this report are:
J M SCHAFFeRB Com (Hons) FCpAManaging Directorexecutive Director since 6/9/72
Mr John Schaffer joined the company in 1972. Mr Schaffer has held the position of Managing Director since 1988.
D e BlAIn, BAnon executive DirectorAppointed 5/6/87
Mrs Danielle Blain joined the company in 1987. Mrs Blain served as Managing Director of Gosh leather pty ltd from 1993 to 2001.
D J SCHWARtZnon executive DirectorAppointed 29/6/99
Mr David Schwartz joined the Board as a non-executive director in June 1999. He has over 20 years experience in manufacturing and distribution businesses. During the past three years Mr Schwartz has served as a director of the following listed companies:Clime Investment Management ltd 1 oct 99 – currentADG Global Supply ltd 1 May 08 – current
A K MAyeRexecutive DirectorAppointed 21/11/01
Mr Anton Mayer is the executive Chairman of Howe Automotive limited. Mr Mayer has over 35 years of international leather experience, broad business skills and a global business perspective.
M D peRRott AM non executive DirectorAppointed 23/2/05
Mr Michael perrott AM joined the Board as a non-executive director in February 2005. Mr perrott AM has over 35 years experience in the construction and contracting industry. During the past three years Mr perrott AM has also served as a director of the following other listed companies:port Bouvard ltd 12 Mar 98 – 23 Apr 09GMe Resources ltd 21 nov 96 – currentportman ltd 30 Jun 97 – 31 Dec 08vDM Group ltd 2 Jul 09 – current
Directors were in office for the entire period unless otherwise stated.
CompaNY seCretarYJASon M CAntWell (BBus (Acc) CpA MBA CSA (Cert))
Mr Jason Cantwell joined the company in 2011 and during the past 19 years has had significant experience in senior financial management roles within both private and publicly listed companies. Mr Cantwell is a Member of CpA Australia and a Certificated Member of Chartered Secretaries Australia.
atteNdaNCe at Board meetiNgsDuring the year eight directors meetings were held. the number of meetings attended by each director is as follows:
meetiNgs eligiBleto atteNd
meetiNgs atteNded
J M Schaffer D e BlainD J SchwartzA K MayerM D perrott AM
88888
87878
In accordance with the Articles of Association:
Mr M D perrott AM retires by rotation and being eligible, offers himself for re-election.
direCtors’ reportyear ended 30 June 2011
schaffer Corporation limited 2 0 1 1 A n n u A l R e p o Rt54
direCtors’ reportyear ended 30 June 2011
divideNdsthe following dividends have been paid or declared by the company since the commencement of the financial year.
Dividends paid for the year ended 30 June 2011:
$’000on ordinary shares
- 20¢ per share final, paid on 24 September 2010 - 10¢ per share interim, paid on 26 March 2011
2,8231,4114,234
Dividends paid for the year ended 30 June 2010
on ordinary shares - 20¢ per share final, paid on 24 September 2009 - 20¢ per share interim, paid on 26 March 2010
2,8222,8235,645
not recognised as a liability as at 30 June 2011Final franked dividend for 2011 – 10¢ (2010 – 20¢) 1,411
revieW oF operatioNsthe consolidated entity’s revenue from continuing operations increased by 7% from $121,802,000 to $130,809,000 this year. this resulted in a pre tax operating profit from continuing operations of $11,648,000 compared to $9,375,000 for last year. the consolidated entity’s net profit after tax, after non-controlling interests, increased by 7% from $4,501,000 to $4,816,000.
liKelY developmeNts aNd eXpeCted resultsother than the discussion of the Company’s operations and outlook already set out from pages 1-12 of this Annual Report, the Directors have no comment to make on likely developments in the operations of the consolidated entity and the expected results of those operations in subsequent financial years.
eNviroNmeNtal regulatioN aNd perFormaNCeSchaffer Corporation limited is subject to a range of environmental regulations. During the financial year Schaffer Corporation limited met all reporting requirements under any relevant legislation. there were no incidents which required reporting. the Company aims to continually improve its environmental performance.
sigNiFiCaNt eveNts aFter BalaNCe dateSubsequent to year end, the Government of Australia has entered into a new loan Agreement with Howe Automotive ltd and Howe & Company pty ltd, controlled entities of Schaffer Corporation limited, to the value of AuD$25,000,000. the loan will be able to be drawn down on repayment of the amount owing on the previous loan agreement (refer to note 17(d)). the loan will be repayable in equal instalments over 10 years and will be subject to an interest rate of the indicator rate for 10-year Commonwealth bonds plus a margin. the loan will be secured by a second ranking charge over assets and undertakings of Howe with first ranking security capped at AuD$20,000,000.
A new three year term debt facility was executed on 12 September 2011 (refer note 19(d)).
Howe Automotive ltd’s working capital facility with Ge Capital was cancelled on 18 July 2011.
A final fully franked dividend of 10¢ per share has been declared and was paid on 23 September 2011.
Subsequent to year end the company sold its interest in the vulcan Road Joint venture for gross proceeds of $1,190,000.
iNdemNiFiCatioN aNd iNsuraNCe oF direCtorsDuring or since the financial year the company has agreed to indemnify directors against a liability for costs and expenses incurred in defending proceedings brought against them for a liability incurred in their role as directors of the company other than in respect of any wilful misconduct. the total amount of insurance contract premiums paid is not disclosed due to a confidentially clause within the insurance policy.
remuNeratioN report (audited)this remuneration report outlines the director and executive remuneration arrangements of the Company and the Group in accordance with the requirements of the Corporations Act 2001 and its Regulations. For the purposes of this report, key management personnel (KMp) of the Group are defined as those persons having authority and responsibility for planning, directing and controlling the major activities of the Company and the Group, directly or indirectly, including any director (whether executive or otherwise) of the parent company, and includes the five executives in the parent and the Group receiving the highest remuneration.
details of Key management personnel (including the five highest paid executives for the Company and the group)
DirectorsJ M Schaffer Managing DirectorD e Blain Director (non-executive)A K Mayer Director (executive)D J Schwartz Director (non-executive)M D perrott AM Director (non-executive)
ExecutivesM Falconer Group General Manager, Schaffer Building products Business unitn Filipovic Managing Director, Howe & Company pty. ltd.D Richardson Chief Financial officer and Company Secretary, Schaffer Corporation limited (Resigned 23 February 2011)M perrella executive Director, Delta Corporation limitedJ Walsh General Manager, Delta Corporation limitedJ Cantwell Group Financial Controller and Company Secretary (Appointed 8
March 2011)
this report outlines the remuneration arrangements in place for directors and executives of the Schaffer Corporation limited group of companies (“SFC”).
remuneration philosophy
SFC’s remuneration policy is directed at attracting, motivating and retaining quality directors and executives. SFC’s key internal performance measures at the business unit and consolidated levels are earnings before interest and tax (“eBIt”) and return on capital employed (“RoCe”). eBIt and RoCe have been chosen by the Group as measures of executive performance because they align the interests of management with those of all SFC shareholders.
remuneration Committee
the SFC Board operates a nomination and Remuneration Sub-Committee to support and advise the SFC Board in fulfilling its responsibility to shareholders to ensure that the company has remuneration policies and practices which enable it to attract and retain directors and executives who will best contribute towards achieving positive outcomes for shareholders. the committee determines the remuneration and other conditions of service of the chief executive officer and executive directors, if any. the committee makes recommendations to the board on the remuneration of non-executive directors within the aggregate approved by shareholders in general meeting from time to time. the committee considers individual performance, company performance, internal relativity and fairness in setting levels of remuneration and may seek appropriate independent external advice to assist in its decision making. the structure of non-executive director and executive remuneration are separate and distinct.
schaffer Corporation limited 2 0 1 1 A n n u A l R e p o Rt 55
direCtors’ reportyear ended 30 June 2011
seNior maNager aNd eXeCutive direCtor remuNeratioN
objective
SFC’s remuneration policy aims to remunerate executives with a level and mix of remuneration commensurate with their position and responsibilities within the Group.
structure
the remuneration of SFC’s senior executive consists of fixed remuneration and variable remuneration (annual and long term incentives). the company aims to reward executives for Company, business unit and individual performance, align executive remuneration with the interests of shareholders, link rewards with the strategic goals such as profitability or return on capital employed and ensure that total remuneration is effective in retaining and motivating senior executives and executive directors.
Fixed remuneration
this includes base salary and the statutory Superannuation Guarantee Contribution (“SGC”) which comprises the cash component, and other non-cash benefits such as a motor vehicle. Where non-cash benefits are elected, it is intended that the cost to the company is not greater than the cost that would otherwise have been incurred had that portion of the salary been provided as cash. the Schaffer Corporation limited Superannuation Fund is available to executives for superannuation contributions and life insurance. premiums for life insurance are deducted from member accounts. executives can elect to have the company contribute superannuation beyond the statutory SGC level by way of a salary sacrifice in lieu of cash salary. Fixed remuneration is reviewed annually by the nomination and Remuneration Committee in respect of each executive director. the fixed remuneration of executives is reviewed annually by the SFC Managing Director in the case of the Building Materials and Corporate divisions and by the Howe Automotive limited (HA) Managing Director in the case of the Automotive leather division. the review process considers companywide, business unit and individual performance in the context of any annual change during the preceding twelve month period to the wages cost index as published by the Australian Bureau of Statistics. For the year beginning 1 July 2010, an increase of 3% was applied for Senior executives.
variable remuneration – short term incentive
the Group has performance-based incentive plans in place at each of its operations in which management and the labour force participate. the level of remuneration payable to participating executives is linked to the financial performance of their business. executives are provided with cash incentives provided profitability thresholds are met. A summary of the annual incentive schemes for the Building Materials, Automotive leather and Corporate divisions is provided below:
Building Materials Division – Management Bonus Incentive Scheme
the Company operates a Management Bonus Incentive Scheme (MBIS) for the management group of the Building Materials division. prior to the commencement of each financial year the Building Materials division management submits an annual budget for consideration by SFC’s Managing Director and the SFC Board. upon approval of the budget by the Board, a cash bonus (as a percentage of each participants fixed remuneration) is payable on a tiered basis provided actual eBIt profitability thresholds are met/exceeded as at 31 December and 30 June balance dates. the MBIS payment for eBIt performance is subject to reviewed/audited financial statements of each business unit and is payable at the discretion of the Managing Director in the following period. the 2011 bonus was approved on 26 July 2011 (2010 – 24 August 2010). A bonus is forfeited for a financial year where an employee has ceased employment prior to the end of the financial year. Actual eBIt performance versus Budgeted eBIt performance has been chosen as the relevant performance condition as this performance measure is readily monitored and available and eBIt performance aligns the interest of management with those of shareholders. the scheme may be discontinued at any time by the SFC Managing Director without prior notice.
Automotive Leather Division – Profit Participation Scheme
HA operates a profit participation scheme for the staff and management of the Automotive leather division. prior to the commencement of each financial year the division management submits an annual budget for consideration and approval by HA’s Managing Director and the SFC Board. A cash bonus of 10% of actual eBIt (adjusted for a notional charge on capital employed within the business) becomes payable provided actual eBIt exceeds budgeted eBIt and a satisfactory return on capital employed (“RoCe”) has been achieved as at 30 June balance date. the profit participation bonus is subject to audited financials of each business unit and approval by SFC’s Managing Director and CFo. Actual eBIt performance versus
Budgeted eBIt performance and a threshold RoCe have been chosen as the relevant performance conditions as these performance measures are readily monitored and available and eBIt and RoCe performance aligns the interest of management with those of shareholders. the scheme has been designed to incentivise a wide range of the Automotive leather division workforce from top executive management to factory floor personnel.
Corporate – Short Term Incentive (STI) Plan
Schaffer Corporation has implemented a formal Short term Incentive (StI) plan for the Group Managing Director and Chief Financial officer (CFo) approved by the nomination and Remuneration Committee. these executives can earn a cash bonus with a value of up to 30% of their base annual remuneration, based on actual performance against defined objectives. 60% of any StI award is based on financial performance against at the annual budget, however no StI bonus is payable if the annual net profit after tax (npAt) is less than the prior year. the members of the nomination and Remuneration Committee have the discretion to adjust the npAt for StI purposes to eliminate the financial impact of “one off” abnormal issues which may positively or negatively affect npAt (e.g. investment property sales). 40% of any StI award is based on performance against pre-agreed KpI’s which are critical to the company’s future success. StI awards for the 2010/11 year were approved by the nominations and Remunerations Committee on 23 August 2011. the Managing Director received an StI award of 30% of the maximum possible award (2010 – 25%), and the CFo award was forfeited due to resignation during the year (2010 – 33%).
variable remuneration – long term incentive
SFC’s senior executives (other than Mr Schaffer and Mr Mayer) participate in SFC’s employee Share option plan (“eSop”). HA operates the employee performance unit (“epu”) plan for its executives. the SFC eSop and HA epu plans have long-term vesting provisions and are designed to align the interests of the participating executives with those of all SFC shareholders. As such long term incentive grants are typically made to executives who are able to influence the generation of shareholder wealth and thus have a direct impact on the Company’s performance. A summary of the long-term incentive schemes for the Corporate, Building Materials and Automotive leather divisions is provided below:
SFC Employee Share Option Plan (“ESOP”)
An employee share option plan has been established. the plan was approved by shareholders at the AGM in november 1999. the plan permits the granting of options (at the absolute discretion of the Board) to Group employees to acquire ordinary shares in Schaffer Corporation limited. the options issued for nil consideration, are issued in accordance with performance guidelines established by the Directors of Schaffer Corporation limited. the options cannot be transferred and will not be quoted on the ASX. the number of options which can be issued is limited to 5% of the number of shares on issue. At the date of this report there were no eSop options on issue.
options may be exercised as follows:(1) during the first 12 months of each option period and including each date of issue,
no more than 25% of the options issued to that participant on that date of issue;(2) during the period of 24 months from and including each date of issue exercise no
more than 50% of the options issued to that participant on that date of issue; and
(3) during the period of 36 months from and including each date of issue exercise no more than 75% of the options issued to that participant on that date of issue.
After 36 months 100% of the options may be exercised.
While eSop contains vesting conditions, the exercising of eSop options is not dependent on a performance condition because: eSop options have been issued with an exercise price at or above the share price on the issue date; eSop options do not participate in dividends; and are not transferable or saleable. Accordingly, eSop options only provide an economic benefit to the recipient in the event the share price (which adjusts for dividends paid) significantly exceeds the exercise price (which is not adjusted for dividends paid) over the option vesting period thereby aligning the interests of management with those of all shareholders.
there are currently no share options on issue, and no options under this scheme have been granted since 15 July 2003.
HA Employee Participation Units Plan
HA operates an employee incentives plan which permits the granting of employee participation units (epus) at the discretion of its shareholders’ up to an epu limit. the epu limit is 10% of the fully diluted share capital of Howe Automotive limited, which is calculated as if each epu already issued was deemed to be one issued Howe Automotive limited share. HA dividends are applied on a fully diluted basis to the unpaid portion of each epu’s until the unpaid portion is reduced to nil. once fully paid up, each epu participates in HA dividend payments on a fully diluted basis.
schaffer Corporation limited 2 0 1 1 A n n u A l R e p o Rt56
direCtors’ reportyear ended 30 June 2011
An epu provides an employee with a right to receive a cash payment from Howe Automotive limited in the following circumstances:(a) If an employee dies or becomes permanently disabled at any time after the grant
date.(b) If an employee ceases employment after the three year initial vesting period.(c) upon a liquidity event (trade sale or listing on an Australian or overseas stock
exchange).(d) on issue of a compulsory payment notice by Schaffer Corporation limited.
the amount of the cash payment is dependant on vesting and the financial performance of Howe Automotive limited. the vesting requirements are:(a) up to 3 years – nil(b) 3 years to 4 years – 33.3%(c) 4 years to 5 years – 66.7%(d) over 5 years – 100%
note: employees are ineligible to receive any payment in the following circumstances:(i) termination due to misconduct(ii) failure to provide 90 days written notice of intention to terminate employment(iii) acting in competition prior to the payment date (payment date is at least 12
months after termination)
the amount of payment is calculated in accordance with an equity valuation formula based on 5.5 times Howe Automotive limited’s earnings before interest and tax minus net debt. the formula uses a three year average including one full year following termination. this formula is designed to incentivise epu holders in respect of building the long term value of Howe Automotive limited and provides a fair and readily calculable means for valuing that long term interest. Schaffer Corporation limited has the option to compel the employee to use the whole or part of that cash payment in subscribing for Schaffer Corporation limited shares based on the average Schaffer Corporation limited share price for the same three year period.
there is no policy on key management personnel and executives hedging their exposure to securities issued on remuneration.
Schaffer Building Products – Long Term Incentive (LTI) Scheme
Schaffer Building products business unit, part of the Building Materials Division has established a deferred long term Incentive plan. eligible executives may earn a deferred cash bonus of up to 30% of their base annual remuneration, for each year over a five year vesting period. An ltI award is only earned provided the business unit achieves a pre-determined return on average capital employed during each year of the vesting period. In the event the performance hurdle is not achieved during each year of the vesting period, the ltI award is to be pro-rated based on the number of years during which the performance hurdle was achieved. However if the average return on capital over the full vesting period exceeds the performance hurdle, eligible executives will be entitled to the maximum ltI award. eligible executives must remain as an employee throughout the vesting period to be eligible for a ltI award. Any employee who voluntarily resigns or is dismissed for cause prior to the vesting date forfeits all entitlements under the ltI scheme. ltI awards are paid in cash within sixty days of the conclusion of the vesting period.
Currently only the General Manager of the Schaffer Building products business unit has been invited to participate in the ltI scheme. During the year ended 30 June 2011, the pre-determined performance hurdle was not achieved.
the following table details the proportion of fixed remuneration and variable remuneration paid for the year ended 30 June 2011 as detailed in this report:
2010/11 remuNeratioN struCture
% FiXed % variaBle
specified directorsJ M Schaffer 91% 9%A K Mayer 100% 0%D e Blain 100% 0%D J Schwartz 100% 0%M D perrott AM 100% 0%
specified executivesM Falconer 100% 0%n Filipovic 100% 0%J Walsh 76% 24%M perrella 75% 25%D Richardson 100% 0%J Cantwell 100% 0%
Non-executive director remuneration
SFC’s non-executive directors receive fees for their services (including statutory superannuation) and the reimbursement of reasonable expenses. the Constitution and the ASX listing Rules specify that the aggregate remuneration of non-executive directors shall be determined from time to time by a general meeting. An amount not exceeding that amount is then divided between the non-executive directors as agreed. the latest determination was at the Annual General Meeting held 19 november 2003 when shareholders approved an aggregate remuneration limit of $250,000 per annum. the amount of aggregate remuneration sought to be approved by shareholders and the manner in which it is to be apportioned amongst the non-executive directors is reviewed annually. this limit is not currently fully utilised. the fee pool is payable only to non-executive directors. the amount payable to non-executive directors is set by the Board after having taken regard to the size of the Company and Board, the responsibilities, demands and accountabilities faced by those directors in discharging their duties and after seeking external advice to ensure the fees are in line with market standards. All three non-executive directors are members of the Audit Committee and the nomination and Remuneration Committee and the fixed annual fee received by non-executive directors is inclusive of these sub-committee commitments. It is current SFC policy that non-executive directors do not receive shares, options or other securities and are not eligible to participate in SFC’s employee Share option plan. payment of fees (including statutory superannuation) and the reimbursement of reasonable expenses are the only remuneration payable to Mrs Blain, Mr Schwartz and Mr perrott AM.
It is not a requirement of the Constitution of the Company that directors hold shares in the Company. non-executive directors appointed prior to July 2003 are entitled to a retirement benefit equivalent to one year’s annual director’s fees. the retirement benefit was reduced from three year’s to one year’s annual director’s fees in July 2003 (a three year retirement benefit was in place at the time each director accepted their appointment to the Board). SFC considers the reduced benefit modest and appropriate given the benefit which historically existed. It is SFC’s policy that no retirement benefit apply to new directors appointed after July 2003.
relatioNship oF CompaNY perFormaNCe to shareholder Wealthtotal shareholder return
total shareholder return (“tSR”) is a well accepted and understood measure of performance. SFC calculates tSR as follows:
Movement in Share price (including bonus issues) plus Dividends paid plus Dividend Imputation Credits
the chart below itemises the constituents to SFC’s tSR by year for each of the past five years. SFC’s average tSR for the past five years is 0.6%
taX ratesept 07
30%sept 08
30%sept 09
30%sept 10
30%sept 11
30%
Share price ($) 9.00 7.04 5.45 4.85 3.26Bonus Issue ($) - - - - -ord Divs ($) 0.50 0.50 0.45 0.40 0.20Special Divs ($) - - - - -Imputation Credit ($) 0.21 0.21 0.19 0.17 0.09tsr 3.56 -1.25 -0.95 -0.03 -1.30tsr% 58% -14% -13% -1% -27%
At the date of this report, on an aggregate dollars paid basis, SFC paid to shareholders $2.8 million fully franked dividends in respect of 2010/11 and a total of $28.9 million has been paid in fully franked ordinary and special dividends over the past 5 years.
earnings per share (“eps”)
SFC’s average epS over the past five years has been 58.0¢.
Year eNded
JuNe 2007
JuNe 2008
JuNe 2009
JuNe 2010
JuNe 2011
epS (¢) 72.7 77.3 74.1 31.9 34.1
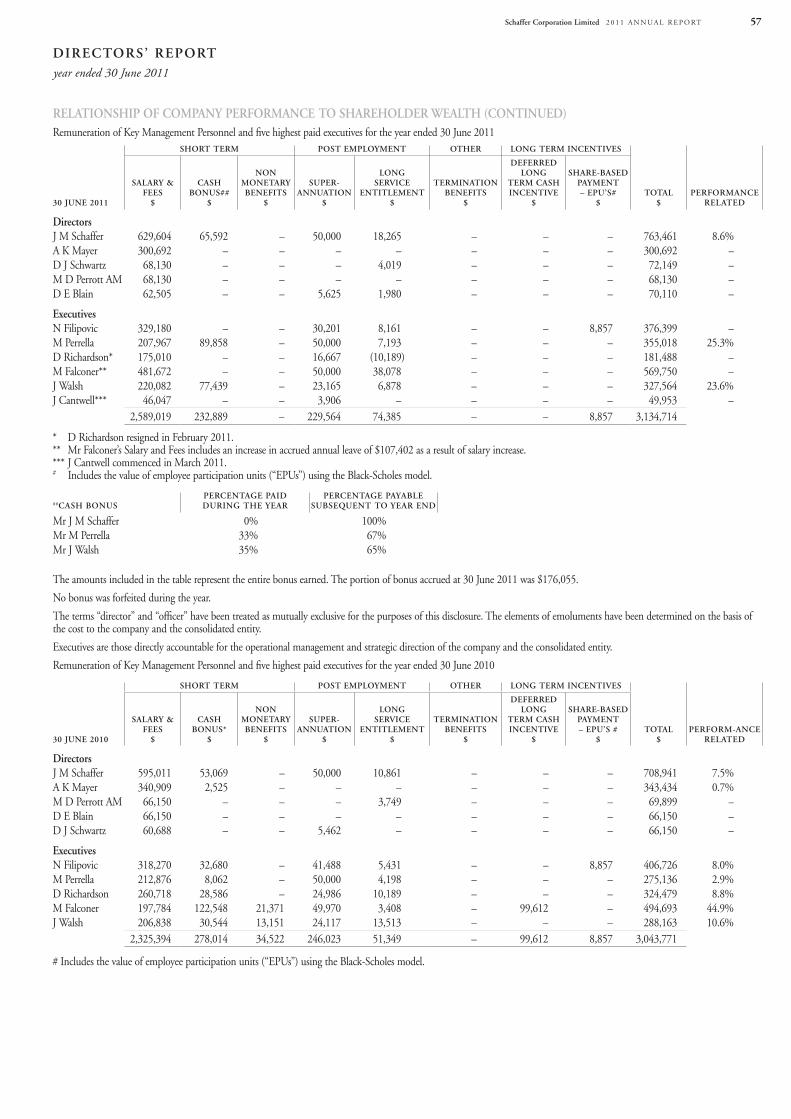
schaffer Corporation limited 2 0 1 1 A n n u A l R e p o Rt 57
direCtors’ reportyear ended 30 June 2011
relatioNship oF CompaNY perFormaNCe to shareholder Wealth (CoNtiNued)Remuneration of Key Management personnel and five highest paid executives for the year ended 30 June 2011
short term post emploYmeNt other loNg term iNCeNtives
total$
perFormaNCerelated30 JuNe 2011
salarY & Fees
$
CashBoNus##
$
NoN moNetarY BeNeFits
$
super-aNNuatioN
$
loNgserviCe
eNtitlemeNt$
termiNatioNBeNeFits
$
deFerred loNg
term Cash iNCeNtive
$
share-Based paYmeNt– epu’s#
$
directorsJ M Schaffer 629,604 65,592 – 50,000 18,265 – – – 763,461 8.6%A K Mayer 300,692 – – – – – – – 300,692 –D J Schwartz 68,130 – – – 4,019 – – – 72,149 –M D perrott AM 68,130 – – – – – – – 68,130 –D e Blain 62,505 – – 5,625 1,980 – – – 70,110 –
executivesn Filipovic 329,180 – – 30,201 8,161 – – 8,857 376,399 –M perrella 207,967 89,858 – 50,000 7,193 – – – 355,018 25.3%D Richardson* 175,010 – – 16,667 (10,189) – – – 181,488 –M Falconer** 481,672 – – 50,000 38,078 – – – 569,750 –J Walsh 220,082 77,439 – 23,165 6,878 – – – 327,564 23.6%J Cantwell*** 46,047 – – 3,906 – – – – 49,953 –
2,589,019 232,889 – 229,564 74,385 – – 8,857 3,134,714
* D Richardson resigned in February 2011.** Mr Falconer’s Salary and Fees includes an increase in accrued annual leave of $107,402 as a result of salary increase.*** J Cantwell commenced in March 2011.# Includes the value of employee participation units (“epus”) using the Black-Scholes model.
##Cash BoNusperCeNtage paid duriNg the Year
perCeNtage paYaBle suBseQueNt to Year eNd
Mr J M Schaffer 0% 100%Mr M perrella 33% 67%Mr J Walsh 35% 65%
the amounts included in the table represent the entire bonus earned. the portion of bonus accrued at 30 June 2011 was $176,055.
no bonus was forfeited during the year.
the terms “director” and “officer” have been treated as mutually exclusive for the purposes of this disclosure. the elements of emoluments have been determined on the basis of the cost to the company and the consolidated entity.
executives are those directly accountable for the operational management and strategic direction of the company and the consolidated entity.
Remuneration of Key Management personnel and five highest paid executives for the year ended 30 June 2010
short term post emploYmeNt other loNg term iNCeNtives
total$
perForm-aNCerelated30 JuNe 2010
salarY & Fees
$
CashBoNus*
$
NoN moNetarY BeNeFits
$
super-aNNuatioN
$
loNgserviCe
eNtitlemeNt$
termiNatioNBeNeFits
$
deFerred loNg
term Cash iNCeNtive
$
share-Based paYmeNt– epu’s #
$
directorsJ M Schaffer 595,011 53,069 – 50,000 10,861 – – – 708,941 7.5%A K Mayer 340,909 2,525 – – – – – – 343,434 0.7%M D perrott AM 66,150 – – – 3,749 – – – 69,899 –D e Blain 66,150 – – – – – – – 66,150 –D J Schwartz 60,688 – – 5,462 – – – – 66,150 –
executivesn Filipovic 318,270 32,680 – 41,488 5,431 – – 8,857 406,726 8.0%M perrella 212,876 8,062 – 50,000 4,198 – – – 275,136 2.9%D Richardson 260,718 28,586 – 24,986 10,189 – – – 324,479 8.8%M Falconer 197,784 122,548 21,371 49,970 3,408 – 99,612 – 494,693 44.9%J Walsh 206,838 30,544 13,151 24,117 13,513 – – – 288,163 10.6%
2,325,394 278,014 34,522 246,023 51,349 – 99,612 8,857 3,043,771
# Includes the value of employee participation units (“epus”) using the Black-Scholes model.
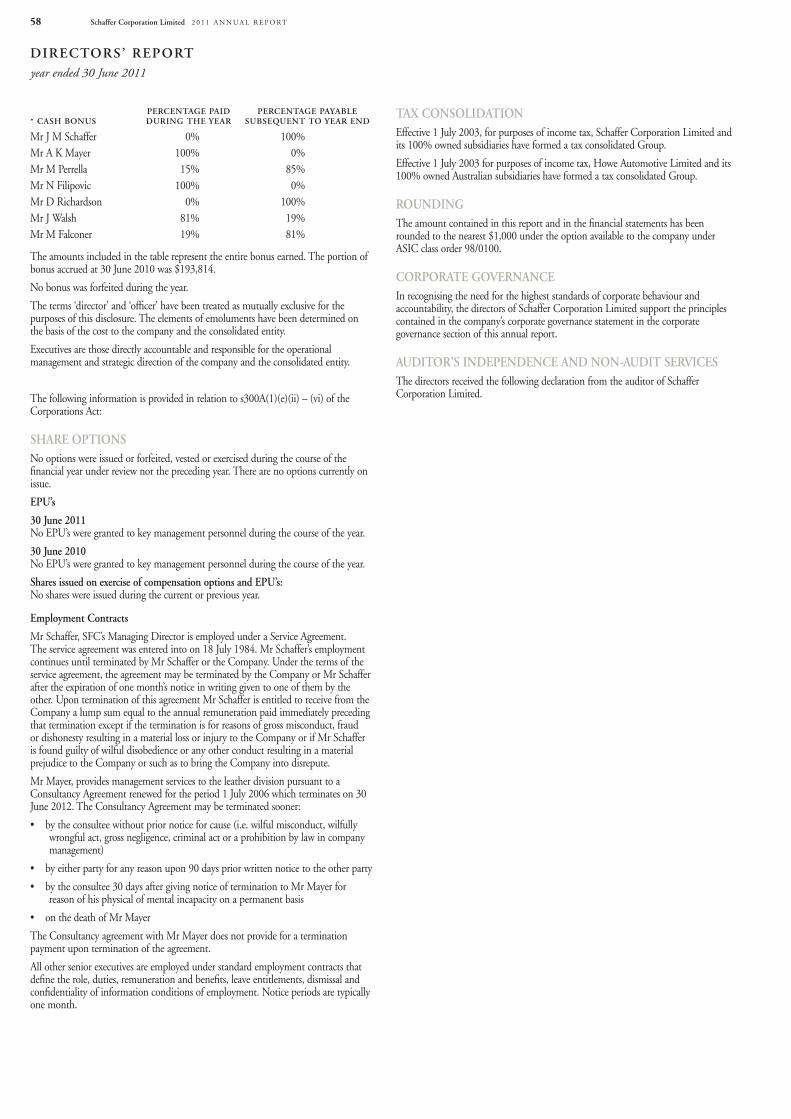
schaffer Corporation limited 2 0 1 1 A n n u A l R e p o Rt58
direCtors’ reportyear ended 30 June 2011
* Cash BoNusperCeNtage paid duriNg the Year
perCeNtage paYaBle suBseQueNt to Year eNd
Mr J M Schaffer 0% 100%Mr A K Mayer 100% 0%Mr M perrella 15% 85%Mr n Filipovic 100% 0%Mr D Richardson 0% 100%Mr J Walsh 81% 19%Mr M Falconer 19% 81%
the amounts included in the table represent the entire bonus earned. the portion of bonus accrued at 30 June 2010 was $193,814.
no bonus was forfeited during the year.
the terms ‘director’ and ‘officer’ have been treated as mutually exclusive for the purposes of this disclosure. the elements of emoluments have been determined on the basis of the cost to the company and the consolidated entity.
executives are those directly accountable and responsible for the operational management and strategic direction of the company and the consolidated entity.
the following information is provided in relation to s300A(1)(e)(ii) – (vi) of the Corporations Act:
share optioNsno options were issued or forfeited, vested or exercised during the course of the financial year under review nor the preceding year. there are no options currently on issue.
epu’s
30 June 2011 no epu’s were granted to key management personnel during the course of the year.
30 June 2010 no epu’s were granted to key management personnel during the course of the year.
shares issued on exercise of compensation options and epu’s: no shares were issued during the current or previous year.
employment Contracts
Mr Schaffer, SFC’s Managing Director is employed under a Service Agreement. the service agreement was entered into on 18 July 1984. Mr Schaffer’s employment continues until terminated by Mr Schaffer or the Company. under the terms of the service agreement, the agreement may be terminated by the Company or Mr Schaffer after the expiration of one month’s notice in writing given to one of them by the other. upon termination of this agreement Mr Schaffer is entitled to receive from the Company a lump sum equal to the annual remuneration paid immediately preceding that termination except if the termination is for reasons of gross misconduct, fraud or dishonesty resulting in a material loss or injury to the Company or if Mr Schaffer is found guilty of wilful disobedience or any other conduct resulting in a material prejudice to the Company or such as to bring the Company into disrepute.
Mr Mayer, provides management services to the leather division pursuant to a Consultancy Agreement renewed for the period 1 July 2006 which terminates on 30 June 2012. the Consultancy Agreement may be terminated sooner:
• bytheconsulteewithoutpriornoticeforcause(i.e.wilfulmisconduct,wilfullywrongful act, gross negligence, criminal act or a prohibition by law in company management)
• byeitherpartyforanyreasonupon90dayspriorwrittennoticetotheotherparty
• bytheconsultee30daysaftergivingnoticeofterminationtoMrMayerforreason of his physical of mental incapacity on a permanent basis
• onthedeathofMrMayer
the Consultancy agreement with Mr Mayer does not provide for a termination payment upon termination of the agreement.
All other senior executives are employed under standard employment contracts that define the role, duties, remuneration and benefits, leave entitlements, dismissal and confidentiality of information conditions of employment. notice periods are typically one month.
taX CoNsolidatioNeffective 1 July 2003, for purposes of income tax, Schaffer Corporation limited and its 100% owned subsidiaries have formed a tax consolidated Group.
effective 1 July 2003 for purposes of income tax, Howe Automotive limited and its 100% owned Australian subsidiaries have formed a tax consolidated Group.
rouNdiNgthe amount contained in this report and in the financial statements has been rounded to the nearest $1,000 under the option available to the company under ASIC class order 98/0100.
Corporate goverNaNCeIn recognising the need for the highest standards of corporate behaviour and accountability, the directors of Schaffer Corporation limited support the principles contained in the company’s corporate governance statement in the corporate governance section of this annual report.
auditor’s iNdepeNdeNCe aNd NoN-audit serviCesthe directors received the following declaration from the auditor of Schaffer Corporation limited.
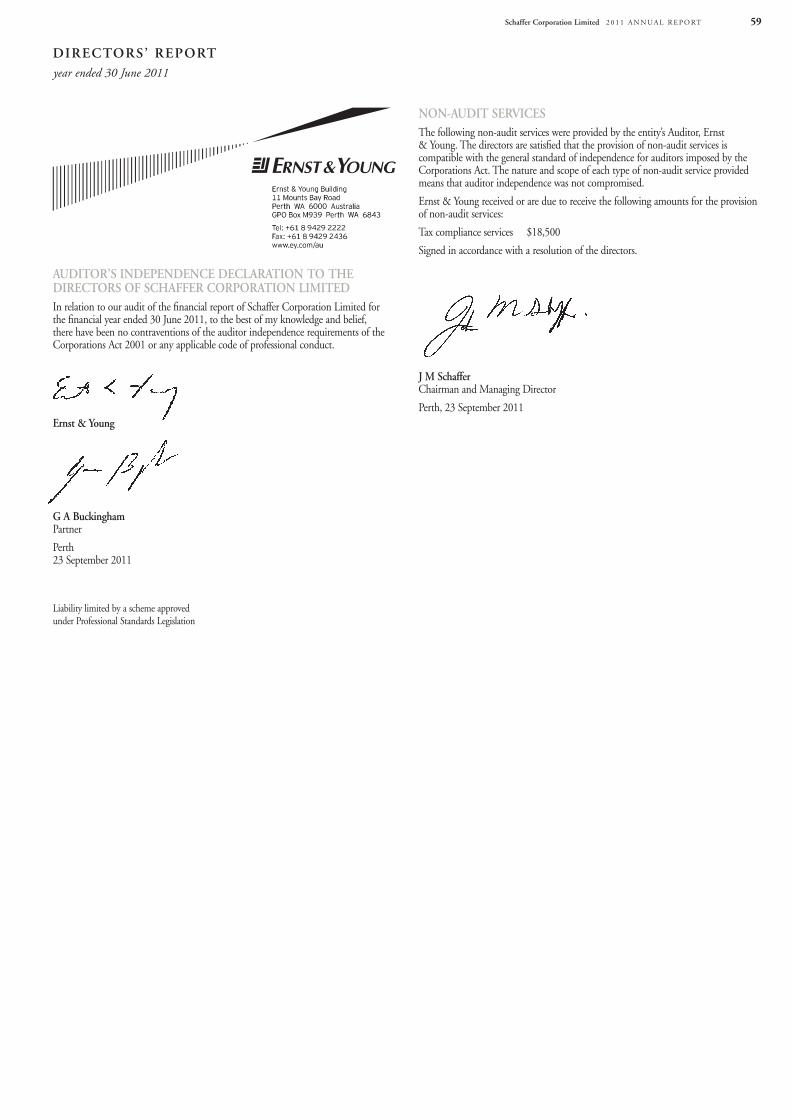
schaffer Corporation limited 2 0 1 1 A n n u A l R e p o Rt 59
NoN-audit serviCesthe following non-audit services were provided by the entity’s Auditor, ernst & young. the directors are satisfied that the provision of non-audit services is compatible with the general standard of independence for auditors imposed by the Corporations Act. the nature and scope of each type of non-audit service provided means that auditor independence was not compromised.
ernst & young received or are due to receive the following amounts for the provision of non-audit services:
tax compliance services $18,500
Signed in accordance with a resolution of the directors.
J m schaffer Chairman and Managing Director
perth, 23 September 2011
auditor’s iNdepeNdeNCe deClaratioN to the direCtors oF sChaFFer CorporatioN limitedIn relation to our audit of the financial report of Schaffer Corporation limited for the financial year ended 30 June 2011, to the best of my knowledge and belief, there have been no contraventions of the auditor independence requirements of the Corporations Act 2001 or any applicable code of professional conduct.
ernst & Young
g a Buckingham partner
perth 23 September 2011
liability limited by a scheme approvedunder professional Standards legislation
direCtors’ reportyear ended 30 June 2011
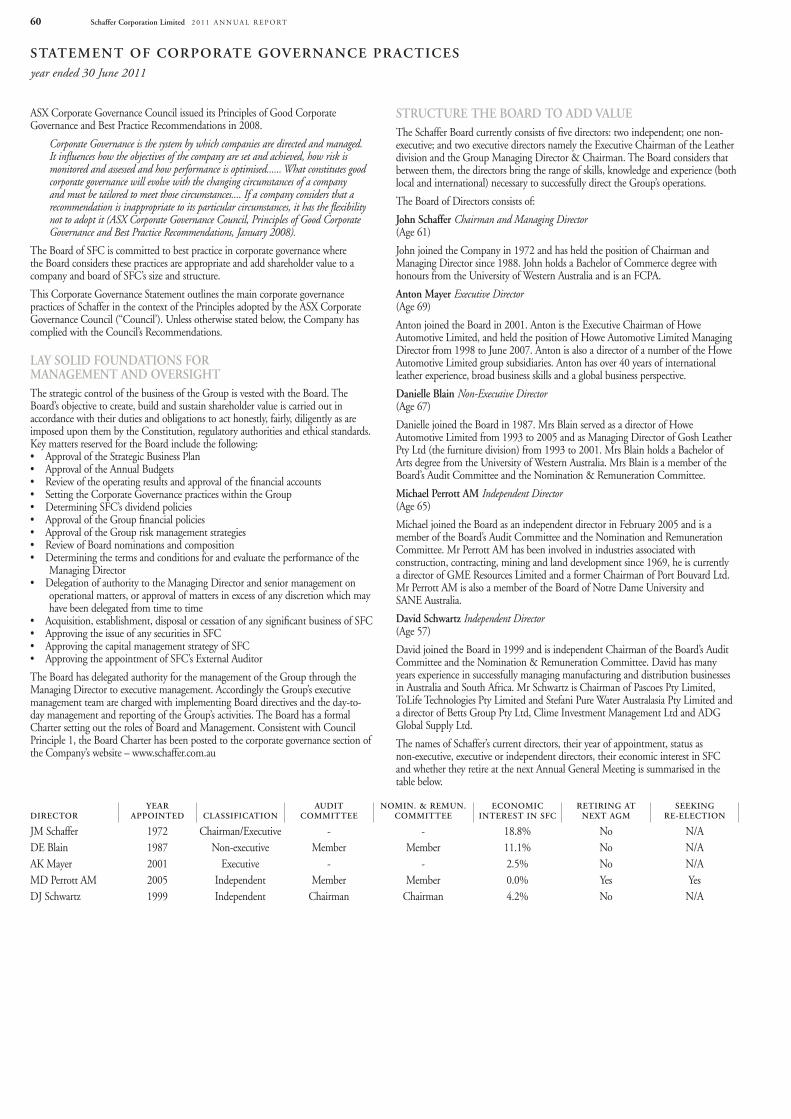
schaffer Corporation limited 2 0 1 1 A n n u A l R e p o Rt60
statemeNt oF Corporate goverNaNCe praCtiCesyear ended 30 June 2011
ASX Corporate Governance Council issued its principles of Good Corporate Governance and Best practice Recommendations in 2008.
Corporate Governance is the system by which companies are directed and managed. It influences how the objectives of the company are set and achieved, how risk is monitored and assessed and how performance is optimised...... What constitutes good corporate governance will evolve with the changing circumstances of a company and must be tailored to meet those circumstances.... If a company considers that a recommendation is inappropriate to its particular circumstances, it has the flexibility not to adopt it (ASX Corporate Governance Council, Principles of Good Corporate Governance and Best Practice Recommendations, January 2008).
the Board of SFC is committed to best practice in corporate governance where the Board considers these practices are appropriate and add shareholder value to a company and board of SFC’s size and structure.
this Corporate Governance Statement outlines the main corporate governance practices of Schaffer in the context of the principles adopted by the ASX Corporate Governance Council (“Council’). unless otherwise stated below, the Company has complied with the Council’s Recommendations.
laY solid FouNdatioNs For maNagemeNt aNd oversightthe strategic control of the business of the Group is vested with the Board. the Board’s objective to create, build and sustain shareholder value is carried out in accordance with their duties and obligations to act honestly, fairly, diligently as are imposed upon them by the Constitution, regulatory authorities and ethical standards. Key matters reserved for the Board include the following:• ApprovaloftheStrategicBusinessPlan• ApprovaloftheAnnualBudgets• Reviewoftheoperatingresultsandapprovalofthefinancialaccounts• SettingtheCorporateGovernancepracticeswithintheGroup• DeterminingSFC’sdividendpolicies• ApprovaloftheGroupfinancialpolicies• ApprovaloftheGroupriskmanagementstrategies• ReviewofBoardnominationsandcomposition• Determiningthetermsandconditionsforandevaluatetheperformanceofthe
Managing Director• DelegationofauthoritytotheManagingDirectorandseniormanagementon
operational matters, or approval of matters in excess of any discretion which may have been delegated from time to time
• Acquisition,establishment,disposalorcessationofanysignificantbusinessofSFC• ApprovingtheissueofanysecuritiesinSFC• ApprovingthecapitalmanagementstrategyofSFC• ApprovingtheappointmentofSFC’sExternalAuditor
the Board has delegated authority for the management of the Group through the Managing Director to executive management. Accordingly the Group’s executive management team are charged with implementing Board directives and the day-to-day management and reporting of the Group’s activities. the Board has a formal Charter setting out the roles of Board and Management. Consistent with Council principle 1, the Board Charter has been posted to the corporate governance section of the Company’s website – www.schaffer.com.au
struCture the Board to add valuethe Schaffer Board currently consists of five directors: two independent; one non-executive; and two executive directors namely the executive Chairman of the leather division and the Group Managing Director & Chairman. the Board considers that between them, the directors bring the range of skills, knowledge and experience (both local and international) necessary to successfully direct the Group’s operations.
the Board of Directors consists of:
John schaffer Chairman and Managing Director (Age 61)
John joined the Company in 1972 and has held the position of Chairman and Managing Director since 1988. John holds a Bachelor of Commerce degree with honours from the university of Western Australia and is an FCpA.
anton mayer Executive Director (Age 69)
Anton joined the Board in 2001. Anton is the executive Chairman of Howe Automotive limited, and held the position of Howe Automotive limited Managing Director from 1998 to June 2007. Anton is also a director of a number of the Howe Automotive limited group subsidiaries. Anton has over 40 years of international leather experience, broad business skills and a global business perspective.
danielle Blain Non-Executive Director (Age 67)
Danielle joined the Board in 1987. Mrs Blain served as a director of Howe Automotive limited from 1993 to 2005 and as Managing Director of Gosh leather pty ltd (the furniture division) from 1993 to 2001. Mrs Blain holds a Bachelor of Arts degree from the university of Western Australia. Mrs Blain is a member of the Board’s Audit Committee and the nomination & Remuneration Committee.
michael perrott am Independent Director (Age 65)
Michael joined the Board as an independent director in February 2005 and is a member of the Board’s Audit Committee and the nomination and Remuneration Committee. Mr perrott AM has been involved in industries associated with construction, contracting, mining and land development since 1969, he is currently a director of GMe Resources limited and a former Chairman of port Bouvard ltd. Mr perrott AM is also a member of the Board of notre Dame university and SAne Australia.
david schwartz Independent Director (Age 57)
David joined the Board in 1999 and is independent Chairman of the Board’s Audit Committee and the nomination & Remuneration Committee. David has many years experience in successfully managing manufacturing and distribution businesses in Australia and South Africa. Mr Schwartz is Chairman of pascoes pty limited, tolife technologies pty limited and Stefani pure Water Australasia pty limited and a director of Betts Group pty ltd, Clime Investment Management ltd and ADG Global Supply ltd.
the names of Schaffer’s current directors, their year of appointment, status as non-executive, executive or independent directors, their economic interest in SFC and whether they retire at the next Annual General Meeting is summarised in the table below.
direCtorYear
appoiNted ClassiFiCatioNaudit
CommitteeNomiN. & remuN.
CommitteeeCoNomiC
iNterest iN sFCretiriNg at
NeXt agmseeKiNg
re-eleCtioN
JM Schaffer 1972 Chairman/executive - - 18.8% no n/ADe Blain 1987 non-executive Member Member 11.1% no n/AAK Mayer 2001 executive - - 2.5% no n/AMD perrott AM 2005 Independent Member Member 0.0% yes yesDJ Schwartz 1999 Independent Chairman Chairman 4.2% no n/A
schaffer Corporation limited 2 0 1 1 A n n u A l R e p o Rt 61
statemeNt oF Corporate goverNaNCe praCtiCesyear ended 30 June 2011
Board Committeesthe Board may from time to time establish committees where the Board is of the belief that the establishment of such a committee will improve the performance of the Board in accomplishing its duties.
the Board operates an Audit Committee and a nomination and Remuneration Committee. Both committees comply with Council guidelines. the Charter of each committee is summarised later in this section. Full details of SFC Audit Committee and nomination and Remuneration Committee can be found on the Company’s website. the Board does not believe the Board it is of sufficient size to warrant the establishment of additional dedicated Board Committees.
Board meetiNgsManagement provides the Board with information in a form, timeframe and quality that facilitates the Board in effectively discharging its duties. the Board meets at least 8 times per year. Board papers are where possible provided to directors at least four days prior to the relevant meeting. the non-executive Board members are joined at Board meetings by the group’s Managing Director, the executive Chairman of Howe Automotive limited and the Company’s Chief Financial officer/Company Secretary.
direCtor iNdepeNdeNCethe Board applies the Council’s independence criteria in assessing director independence. Mr Schwartz and Mr perrott AM are considered by the Board to be independent directors. In analysing Mr Schwartz’s independence, the Board considered the materiality of Mr Schwartz’s minority interests in the relevant joint venture property interests of the Company. Accordingly the Board confirms Mr Schwartz’s independence on the basis that (i) operating revenue from SFC’s property interests represent less than 10% of group revenue; and (ii) no interest held by Mr Schwartz represents a controlling interest in any single property. While the Board considers Mr Schwartz independent for the above reasons, standard Board meeting procedures and governance principles apply whereby in respect of any property business where Mr Schwartz has an interest, Mr Schwartz does not receive the relevant Board papers and does not attend that part of the Board meeting where the matter is being discussed or considered.
Directors classified as not being independent directors are Mrs Blain, Mr Schaffer and Mr Mayer on the basis that:
• MrSchafferisanexecutivedirector,asubstantialshareholderofSFC(withaneconomic interest of 18.8%) and has served on the Board in since 1972;
• MrsBlainisasubstantialshareholderofSFC(withaneconomicinterestof11.1%), served as an executive director of HA from 1993 to 2001 and has served on the SFC Board since 1987; and
• MrMayerisanexecutivedirectorofSFCbyvirtueofhisroleasExecutiveChairman of HA and is a substantial HA shareholder with a 16.8% economic interest in the SFC subsidiary.
the Board does not currently comply with Council guidelines in respect of majority independence, Chairman independence and separation of the Chairman and Managing Director roles. However, the Board is currently of the view that having a competent, cohesive and functioning Board whose members have a balance of practical experience and skills relevant to SFC’s business is more beneficial to maximising returns to shareholders than it would be to expand the Board by an two additional members simply for the purpose of achieving majority independence pursuant to the Council’s definition. Further, the Board is not in entire agreement with the definition of independence as defined by the Council’s guidelines. In the Board’s view, independence is about having individuals on the Board whose interests are directly aligned with shareholders (i.e. they have a significant stake in the company) and have the capability to question and challenge management’s decision making process. on this basis your Board is independent. Collectively the Board has a direct financial interest in approximately 37% of SFC’s issued capital representing a large proportion of each director’s personal asset base. When the shareholders gain, so does the Board; when shareholders lose, the Board loses significantly.
Similarly, based on the strong alignment of shareholders with the Chairman, it is not considered that having an Independent Chairman and separating the roles of Chairman and MD and would add shareholder value at this stage.
As a result of the Company’s departure from the Council Recommendations contained in this principle, governance practices employed by the Board to support its objective and competent operation are:
disclosure of interests and conflicts
A director is required to disclose to all directors any material personal interest they may have, or may reasonably be perceived to have, in a matter which relates to the affairs of the Company. A director is expected to disclose their interest as soon as practicable after the director becomes aware of that interest.
In the event a potential material conflict of interest arises, the director concerned does not receive the relevant Board papers and leaves the Board meeting while the matter is discussed and considered. Directors must keep the Board advised on an ongoing basis of any interests which could cause, or may reasonably be perceived to cause, a conflict with the interests of the Company.
the minutes of the meeting should record the decision taken by those directors who do not have an interest in the matter.
independent legal advice
With the consent of the Chairman, individual directors may seek independent professional advice at the Company’s expense on any matter connected with the discharge of their responsibilities. the Chairman requires the submission of a cost estimate by a director in order to establish the reasonableness of the projected fee. the Chairman’s consent will not be unreasonably withheld.
period of office
Shareholders are given the opportunity to vote on the composition of the Board such that at each Annual General meeting, one third of the Directors (excluding the Managing Director) must retire but may stand for re-election. each director who is required by the Constitution to retire can not hold office for more than three years without retiring within that time frame and standing for re-election. Any director who is appointed to the Board to fill a casual vacancy during a year may only hold office until the next Annual General meeting but may stand for re-election at that meeting.
promote respoNsiBle aNd ethiCal deCisioN maKiNg
Conduct and ethics
the Company operates under a Code of Conduct a copy of which is posted to the corporate governance section of the Company’s website – www.schaffer.com.au
the Company’s Code of Conduct describes how SFC relates to its employees, customers, suppliers, shareholders and the community. SFC is committed to promoting integrity and maintaining the highest standard of ethical conduct in all of its activities.
our business success is dependent on the development and maintenance of trusting relationships, underpinned by the continuous demonstration of corporate integrity.
the purpose of this Code of Conduct is to provide a common behavioural framework for all SFC personnel which recognises social responsibility, complies with applicable laws and standards, and is in keeping with the spirit and rules of the Australian and international markets in which SFC operates. this Code of Conduct applies to SFC and its controlled affiliates.
SFC’s directors and management team lead by example, demonstrating their commitment to this Code of Conduct at all times through their personal behaviour and through guidance provided to our personnel.
securities trading policy
SFC’s Securities trading policy regulates dealing by SFC Directors and senior executives in SFC securities. Restrictions imposed by law on prohibiting anyone dealing in SFC’s securities if in possession of unpublished SFC price-sensitive information have been supplemented by Board imposed restrictions specific to SFC Directors and senior executives. price sensitive information is information a reasonable person would expect to have a material effect on the price or value of SFC securities.
this policy provides that in addition to Directors and senior executives being prohibited from trading in the Company’s securities at any time if they possess any unpublished price sensitive information, Directors and senior executives may buy or sell the Company’s securities only within limited trading windows.
schaffer Corporation limited 2 0 1 1 A n n u A l R e p o Rt62
statemeNt oF Corporate goverNaNCe praCtiCesyear ended 30 June 2011
the periods within which a Director or senior executive may buy or sell SFC securities is:
• From24hoursto4weeksaftertheCompanyhasmadeanyScheduledAnnouncement. A scheduled announcement refers to the announcement by SFC of its (i) results for the half year, (ii) preliminary final year result, (iii) Chairman’s Address to the AGM;
• From24hoursto4weeksaftertheCompanyhasmadeanyUnscheduledAnnouncement. An unscheduled announcement refers to any other announcement of new information made by SFC pursuant to ASX listing Rule 3.1.; and
• DuringtheperiodwhenaprospectusforsecuritiesisreleasedbySFCuntilthelast day for acceptance of securities issued pursuant to that prospectus.
SFC Directors and senior executives are prohibited from trading at all other times. For the purposes of clarity, any unscheduled ASX lR 3.1 announcement made within 4 weeks prior to a Scheduled Announcement does not enable SFC Directors and senior executives to trade SFC securities. the senior executives group to which these restrictive trading periods apply includes all General Manager personnel at Howe & Company pty ltd, urbanStone pty ltd, limestone Resources Australia pty ltd, Delta Corporation limited, Archistone pty. ltd., urbanstone Central pty. ltd. and SFC’s Chief Financial officer/Company Secretary and Group Chief Accountant.
the policy also requires that Directors and senior executives do not buy or sell the Company’s securities on a short-term basis.
these rules also apply to trading by a related party of any SFC Director or senior executive. this policy does not restrict participation by SFC senior executives in SFC’s employee Share options plan (eSop), but applies in respect of the trading of SFC’s securities to which plan participants become entitled under the eSop.
A copy of the Company’s Securities trading policy can be accessed from the corporate governance section of the Company’s website – www.schaffer.com.au
saFeguard iNtegritY iN FiNaNCial reportiNg
Written declaration by management
SFC’s Managing Director and CFo report in writing to the Audit Committee that the consolidated financial statements of SFC and its controlled entities for each half and full financial year present a true and fair view in all material respects, of the Group’s financial condition and operational results are in accordance with accounting standards. this statement is in turn supported by written statements provided by the senior management of all subsidiary companies within the group.
audit Committee
the SFC Audit Committee was established by the Board in 1996. the Audit Committee has adopted a formal Charter, a copy of which can be accessed from the corporate governance section of the Company’s website – www.schaffer.com.au
the Audit Committee’s purpose is to provide assistance to the Board in fulfilling its corporate governance and oversight responsibilities in relation to the company’s financial reporting, risk management systems and the external audit functions. In doing so, it is the responsibility of the Audit Committee to maintain free and open communication between the Committee, external auditors and management of the Company.
In discharging its oversight role, the Audit Committee is empowered to investigate any matter brought to its attention with full access to all books, records, facilities, and personnel of the Company and the authority to engage independent counsel and other advisers as it determines necessary to carry out its duties.
Council guidelines require the Audit Committee to consist of at least three directors and have an independent Chairperson who is not Chairperson of the Board.
the members of the SFC’s Audit Committer are Mr Schwartz (Independent Chairman), Mrs Blain (non-executive Director) and Mr perrott AM (Independent Director). Accordingly SFC’s Audit Committee complies with the Council’s Audit Committee structure guidelines.
maKe timelY aNd BalaNCed disClosure
Continuous disclosure policy
the Board is committed to ensuring that information that is expected to have a material effect on the price or value of SFC’s shares is immediately notified to the ASX for dissemination to the market in accordance with the ASX listing Rules. the Company’s Continuous Disclosure policy sets out the key obligations of the Board and senior management to ensure that SFC complies with its disclosure obligations pursuant to the ASX listing Rules and the Corporations Act. In fulfilling its obligations of continuous disclosure SFC has adopted and adheres to the following practices.
• SFC’sManagingDirectorandChiefFinancialOfficer/CompanySecretaryconstitute the executive team charged with management of all elements of the Company’s activities. this team is responsible for assessing the materiality of information and drafting all disclosures. For administrative convenience, SFC’s Company Secretary is the nominated officer of the Company responsible for communications with the ASX.
• InformationisreleasedfirstlyviaelectronicmeansviatheASX.Furtherdissemination to analysts and investors does not occur until after ASX confirms the information has been released to the market.
• TheinformationispostedtoSFC’swebsiteatwww.schaffer.com.auinordertomake the information accessible to the widest audience. Investor information is posted to an area on SFC’s website separate from any promotional material about the Company or its products;
• SFC’sManagingDirectorandChiefFinancialOfficer,andHA’sManagingDirector are the officers authorised to speak on SFC’s behalf at investor briefings and to the media. these officers understand that when speaking on behalf of the Company it is in respect of explanation and clarification of information previously released via the ASX. As these officers have knowledge of all information previously released to the ASX (they form part of the executive team responsible for the information disclosures), the risk of inadvertent disclosure of price sensitive information when speaking to investor briefings and the media is minimised. presentations used in briefings which may have content which would trigger a continuous disclosure obligation are lodged with ASX prior to the briefing. All presentations are posted to SFC’s website.
• Commentsonanalysts’financialprojectionsareconfinedtoerrorsinfactualinformation and underlying assumptions. the Company will not provide price sensitive information or earnings forecast guidelines to analysts unless it has already done so to the market via the ASX.
• Unlesstheexecutiveteamresponsibleforinformationdisclosuresbelievesithasan obligation to make a statement on a particular matter, SFC’s policy is not to respond to market rumours or speculation.
respeCt the rights oF shareholders
shareholder Communications strategy
SFC aims to ensure that investors and the market are kept informed of all major developments affecting the Company.
Information is communicated to investors and the market in accordance with SFC’s periodic and continuous disclosure obligations pursuant to the ASX listing Rules and the Corporations Act. SFC’s disclosure practices are aimed at ensuring timely access for all investors to Company information.
to achieve these objectives and to satisfy regulatory requirements, SFC provides information to investors and the market in a number of ways:
• SFC’sprincipalcommunicationwithinvestorsisbyprovisionoftheAnnualReport and financial statements, the Interim Report and the Annual General Meeting.
• Periodicandcontinuousdisclosureannouncementsarereleaseddirectlytothe market via the ASX using ASX’s electronic lodgement service. these announcements are immediately placed on the Company’s website, at www.schaffer.com.au and typically mailed to shareholders.
• ThereleaseofInterimandFinalresultsistypicallyfollowedbyinvestorbriefings and road shows. the purpose of the investor briefings/road shows is for explanation and clarification of previously released information and non-material company or industry specific information. Site visits are also arranged to give those who advise investors a better understanding of the Groups operating facilities.
schaffer Corporation limited 2 0 1 1 A n n u A l R e p o Rt 63
statemeNt oF Corporate goverNaNCe praCtiCesyear ended 30 June 2011
• SFC’swebsitecontainsfurtherinformationabouttheGroupanditsactivities,including copies of recent Annual and Interim Reports, the full text of notices of meetings and explanatory notes and copies of road-show presentations and presentations to brokers/analysts.
• TheAnnualGeneralMeetingprovidesanopportunityfortheBoardtocommunicate with shareholders and investors through the presentation of the Chairman’s Address and shareholders, through the Chairman, are given the opportunity to ask general questions of directors. SFC’s external auditor attends each AGM and is available to answer any questions shareholders may have, that are relevant to the conduct of the audit.
• SFC’sseniormanagementmeetsregularlytoconsideritscontinuousdisclosureobligations and assess the appropriateness of its policy in the context of any legislative amendments to the disclosure regime. unless SFC has an obligation to make a statement on a particular matter, the Company’s policy is not to respond to market rumours and media speculation.
reCogNise aNd maNage risK
risk management
the Board has formal written policies on risk oversight and management. SFC’s risk management policy provides the framework to manage the risks associated with SFC’s business activities.
the purpose of the policy is to identify, assess, monitor and manage risk with the objective of minimising losses and maximising shareholder value.
SFC prepares risk profiles including a description of material risks, both financial and non-financial. SFC reviews and updates its risk profile as required.
SFC implements a systematic process to assist in the identification, assessment, treatment and monitoring of risks.
SFC provides the necessary tools and resources to management and staff to support the effective management of risks.
SFC ensures that the Board is adequately informed of significant risk management issues and the actions undertaken to manage risks in a timely manner.
the SFC Board is responsible for SFC reviewing and analysing the implementation and effectiveness of SFC’s risk management systems. the SFC Board reviews these control systems annually.
the Board has considered the need for an internal audit function and concluded that the size and nature of the Group’s operations do not warrant such a function as present. Responsibility for implementation and effective conduct of SFC’s risk management system rests with the Board, Chief executive officer, Chief Financial officer, General Managers and all employees. the Managing Director and the Chief Financial officer are required to state in writing to the Board in respect of the financial periods ending 31 December and 30 June that:
• ThestatementgiveninaccordancewiththeASXCorporateGovernanceCouncil’s Best practice recommendation 4.1 (the integrity of financial statements) is founded on a sound system of risk management and internal compliance and control which implements the policies adopted by the Board; and
• SFC’sriskmanagementandinternalcomplianceandcontrolsystemisoperatingefficiently and effectively in all material respects.
remuNerate FairlY aNd respoNsiBlY
executive remuneration
SFC’s nomination and Remuneration Committee operates to support and advise the board in fulfilling its responsibility to shareholders to ensure that the company has remuneration policies and practices which enable it to attract and retain directors and executives who will best contribute towards achieving positive outcomes for shareholders. the committee determines the remuneration and other conditions of service of the chief executive officer and executive directors, if any. the committee makes recommendations to the board on the remuneration of non-executive directors within the aggregate approved by shareholders in general meeting from time to time. the committee considers individual performance, company performance, internal relativity and fairness in setting levels of remuneration and may seek appropriate independent external advice to assist in its decision making.
SFC’s remuneration policy is directed at attracting, motivating and retaining quality people.
the remuneration of SFC’s senior executive consists of fixed remuneration and annual and long term incentives.
Fixed Remuneration – this includes base salary and the statutory Superannuation Guarantee Contribution (“SGC”) which comprises the cash component; and other non-cash benefits such as a motor vehicle.
the Schaffer Corporation limited Superannuation Fund is available to executives for superannuation contributions and life insurance. premiums for life insurance are deducted from member accounts. executives can elect to have the company contribute superannuation beyond the statutory SGC level by way of a salary sacrifice in lieu of cash salary.
Annual Incentive – the Company has performance-based incentive plans in place at each of its operations in which management and the labour force participate. the level of remuneration payable to participating executives is linked to the financial performance of their business. executives are provided with cash incentives provided profitability thresholds are met.
long term Incentive – SFC’s senior executives (other than Mr Schaffer and Mr Mayer) participate in SFC’s employee Share option plan (“eSop”). HA operates the employee performance unit (“epu”) plan for its executives and the Building products unit has a separate long term Incentive Scheme. All of these incentive plans have long-term vesting provisions and are designed to align the interests of the participating executives with those of all SFC shareholders.
Non-executive director remuneration
SFC’s non-executive directors receive fees for their services (including statutory superannuation) and the reimbursement of reasonable expenses. the amount payable to non-executive directors is set by the Board after having taken regard to the size of the Company and Board, the responsibilities, demands and accountabilities faced by those directors in discharging their duties and after seeking independent advice to ensure the fees are in line with market standards. It is current SFC policy that non-executive directors do not receive shares, options or other securities and are not eligible to participate in SFC’s employee Share option plan.
A directors’ pool limit of $250,000 per annum was approved by shareholders at SFC’s 2003 Annual General Meeting. this limit is not currently fully utilised. the fee pool is payable only to non-executive directors. non-executive directors were paid annual fees for the 2010/11 financial year of $68,130 each from the fee pool (inclusive of superannuation). non-executive directors appointed prior to Jul-03 are entitled to a retirement benefit equivalent to one year’s annual director’s fees. the retirement benefit was reduced from three year’s to one year’s annual director’s fees in Jul-03 (a three year retirement benefit was in place at the time each director accepted their appointment to the Board). SFC considers the reduced benefit modest and appropriate given the benefit which historically existed. It is SFC’s policy that no retirement benefit apply to new directors appointed after July 2003.
schaffer Corporation limited 2 0 1 1 A n n u A l R e p o Rt64
asX additioNal iNFormatioNyear ended 30 June 2011
Additional information required by the Australian Stock exchange ltd is as follows.
total share CapitalIssued as at 13 September 2011 – 14,113,251 ordinary fully paid shares.
share registrY addressC/– Computershare Investor Services pty ltd postal Address:level 2 Reserve Bank Building Gpo Box D18245 St George’s tce peRtH WA 6840peRtH WA 6000
stoCK eXChaNge listiNgthe shares of the Company are listed on the Australian Stock exchange limited. the home exchange is perth.
votiNg rightsSubject to any restrictions from time to time being attached to any class or classes of shares at general meetings of Members or classes of Members.(1) each Member entitled to vote may vote in person or by proxy, attorney or
representative;(2) on a show of hands, every person present who is a Member or a proxy, attorney
or representative of a Member has one vote;(3) on a poll, every person present who is a Member or a proxy, attorney or
representative of a Member shall, in respect of each fully paid share held by him, or in respect of which he is appointed a proxy, attorney or representative, have one vote for the share, but in respect of partly paid shares, shall have a fraction of a vote for each partly paid share. the fraction must be equivalent to the proportion which the amount paid (not credited) is of the total amounts paid and payable (excluding amounts credited). Amounts paid in advance of a call are ignored when calculating the proportion.
distriButioN oF holdiNgsas at 13 september 2011
shareholdiNgs shareholders
1 – 1,000 7971,001 – 5,000 7395,001 – 10,000 142
10,001 – 100,000 120100,001 – and over 15
number of shareholders holding less than a marketable parcel ie less than 157 shares: 141
suBstaNtial shareholdersAs at 24 August 2011, the substantial shareholders of the company summarised below, were:
No oF shares
eCoNomiC iNterest as
a perCeNtage oF issued ordiNarY
shares
Mr J M Schaffer & Associates50% of interest held by Swan Holdings pty. ltd.
2,003,240652,687
14.20%4.62%
2,655,927 18.82%
Mrs D e Blain & Associates50% of interest held by Swan Holdings pty. ltd.
909,673652,687
6.45%4.62%
1,562,360 11.07%* Combined interest of
Mr J M Schaffer & Mrs D e Blain 4,182,287 29.89%
Jobling Investments pty ltdestate of Mr A e Jobling Deceased
507,812286,504794,316 5.63%
perpetual limited and Subsidiaries 1,588,943 11.26%
* pursuant to the Corporation Act (2001), by virtue of the Swan Holdings pty ltd voting Deed conferring on J M Schaffer the power to vote all Swan Holdings pty ltd’s interest in Schaffer Corporation limited’s shares, J M Schaffer is also deemed to have an interest in all the Schaffer Corporation limited shares held by D e Blain and her associates, and vice versa. the consequence of this is that each of the Substantial Shareholder notices lodged with the Regulatory Authorities by J M Schaffer and D e Blain show J M Schaffer’s and D e Blain’s combined interest at 30%, not their individual economic interests of 19% and 11% respectively.
tWeNtY largest shareholdersas at 13 september 2011
No oF shares
perCeNtage oF issued ordiNarY
shares
RBC Dexia Investor Services Australian nominees pty. limited pIpooleD Account 1,353,993 9.59Swan Holdings pty. ltd. 1,305,374 9.25Schaffer nominees pty. ltd. 980,482 6.95Mrs Danielle eva Blain 907,570 6.43Mr John Michael Schaffer 799,554 5.67Jobling Investments pty. ltd. 507,812 3.60Mr David Schwartz 359,654 2.55Keyton enterprises limited 344,263 2.44estate of Mr. Albert edward Jobling Deceased 286,504 2.03Kenneth John Beer (Beer Super Fund A/C) 284,927 2.02Cogent nominees pty. ltd. 234,950 1.66the Sports Café (Australia) pty. ltd. 226,072 1.60Jp Morgan nominees Australia limited Cash Income A/c 143,248 1.01Mrs Debra Ruth Schaffer 108,207 0.77Fredrick Bruce Wareham 105,010 0.74Mr peter Canaway Superannuation Fund Account 100,000 0.71Jp Morgan nominees Australia limited 70,814 0.50Milton Corporation limited 68,999 0.49Winifred Francis Schulze 66,918 0.47Cooglegong Farm pty ltd 50,000 0.35
8,304,351 58.84
aNNual geNeral meetiNgthe Annual General Meeting of Schaffer Corporation limited will be held at perth on Wednesday, 16 november, 2011 at 11:30am. Further information regarding the meeting including the business to be dealt with is contained in the separate notice of meeting.
Final 2011 dividend record date 09 Sep 11
Final 2011 dividend payment date 23 Sep 11
Despatch of 2011 Annual Report and notice of AGM 12 Oct 11
Annual General Meeting 16 Nov 11
2012 half-year earnings release and dividend announcement Feb 12
Interim 2012 dividend payment date Mar 12
C O R P O R AT E T I M E TA B L E
Annual General Meeting
Schaffer Corporation will hold its Annual General Meeting on Wednesday 16 November 2011 at 11.30am at Pagoda Broadwater Hotel, 112 Melville Parade, Como, Western Australia.
Direct Credit of Dividends
Schaffer Corporation provides shareholders with the option to have dividends paid electronically to a nominated bank, building society or credit union account. Payments are credited electronically on the dividend date and confirmed by a payment advice by mail.
The Company encourages shareholders not already using this facility to contact Computershare Investor Services Pty. Limited, who can arrange for an instruction advice to be sent to shareholders for completion.
Change of Address/provide or update banking details
Shareholders who have changed their address or banking particulars should advise our share registry of their new details:
Computershare Investor Services Pty. LimitedGPO Box D182 Perth WA 6840
Telephone: 1300 557 010Website: www-au.computershare.com
Corporate Directory
Schaffer Corporation LimitedABN 73 008 675 689
The Board of Directors
Executive DirectorsJM Schaffer BCom(Hons), FCPA(Chairman and Managing Director)AK Mayer (Executive Chairman – Howe Automotive Ltd)
Non-Executive DirectorsDE Blain BAMD Perrott AM, BCom, FAIMDJ Schwartz
Group Financial Controller and Company SecretaryJason Cantwell B Bus(Acc), CPA, MBA, CSA(Cert)
Head Office and Registered Office1305 Hay StreetWest Perth WA 6005Telephone: 61 8 9483 1222Facsimile: 61 8 9481 0439Email: [email protected]: www.schaffer.com.au
Share RegistryComputershare Investor Services Pty. LimitedGPO Box D182Perth WA 6840Telephone: 1300 557 010 Facsimile: 61 8 9323 2033
AuditorsErnst and Young11 Mounts Bay RoadPerth WA 6000Telephone: 61 8 9429 2222Facsimile: 61 8 9429 2436
SolicitorsBlake Dawson WaldronLevel 32 Exchange Plaza2 The EsplanadePerth WA 6000Telephone: 61 8 9366 8000Facsimile: 61 8 9366 8111
S H A R E H O L D E R I N F O R M A T I O N
06 10 12
About Schaffer Corporation 1
Managing Director’s Report 2
Review of Operations: Building Materials Property
Financial Statements 13
Independent Audit Report 52
Directors’ Report 53
Shareholder Information 65
Automotive Leather
Schaffer Corporation Limited 2 0 1 1 A N N U A L R E P O RT 65

Schaffer Corporation Lim
ited
11A N N UA L R E P O RT
www.mindfield.com.au
SC-1-13805
20
11
AN
NU
AL
RE
PO
RT
Schaffer Corporation Limited