Embed Size (px)
Citation preview
Schaeffler Capital Market PresentationApril 2016
This presentation contains forward-looking statements. The words "anticipate", "assume", "believe", "estimate", "expect", "intend", "may", "plan", "project“, "should" and similar expressions are used to identify forward-looking statements. Forward-looking statements are statements that are not historical facts; they include statements about Schaeffler Group's beliefs and expectations and the assumptions underlying them. These statements are based on plans, estimates and projections as they are currently available to the management of Schaeffler AG. Forward-looking statements therefore speak only as of the date they are made, and Schaeffler Group undertakes no obligation to update any of them in light of new information or future events.
By their very nature, forward-looking statements involve risks and uncertainties. These statements are based on Schaeffler AG management's current expectations and are subject to a number of factors and uncertainties that could cause actual results to differ materially from those described in the forward-looking statements. Actual results may differ from those set forth in the forward-looking statements as a result of various factors (including, but not limited to, future global economic conditions, changed market conditions affecting the automotive industry, intense competition in the markets in which we operate and costs of compliance with applicable laws, regulations and standards, diverse political, legal, economic and otherconditions affecting our markets, and other factors beyond our control).
This presentation is intended to provide a general overview of Schaeffler Group’s business and does not purport to deal with all aspects and details regarding Schaeffler Group. Accordingly, neither Schaeffler Group nor any of its directors, officers, employees or advisers nor any other person makes any representation or warranty, express or implied, as to, and accordingly no reliance should be placed on, the accuracy or completeness of the information contained in the presentation or of the views given or implied. Neither Schaeffler Group nor any of its directors, officers, employees or advisors nor any other person shall have any liability whatsoever for any errors or omissions or any loss howsoever arising, directly or indirectly, from any use of this information or its contents or otherwise arising in connection therewith.
The material contained in this presentation reflects current legislation and the business and financial affairs of SchaefflerGroup which are subject to change.
Disclaimer
2 Schaeffler AG - Capital Market Presentation

Agenda
3 Schaeffler AG - Capital Market Presentation
Overview
Business profile and investment highlights
Financial Results FY 2015
Outlook and Summary
1
32
4
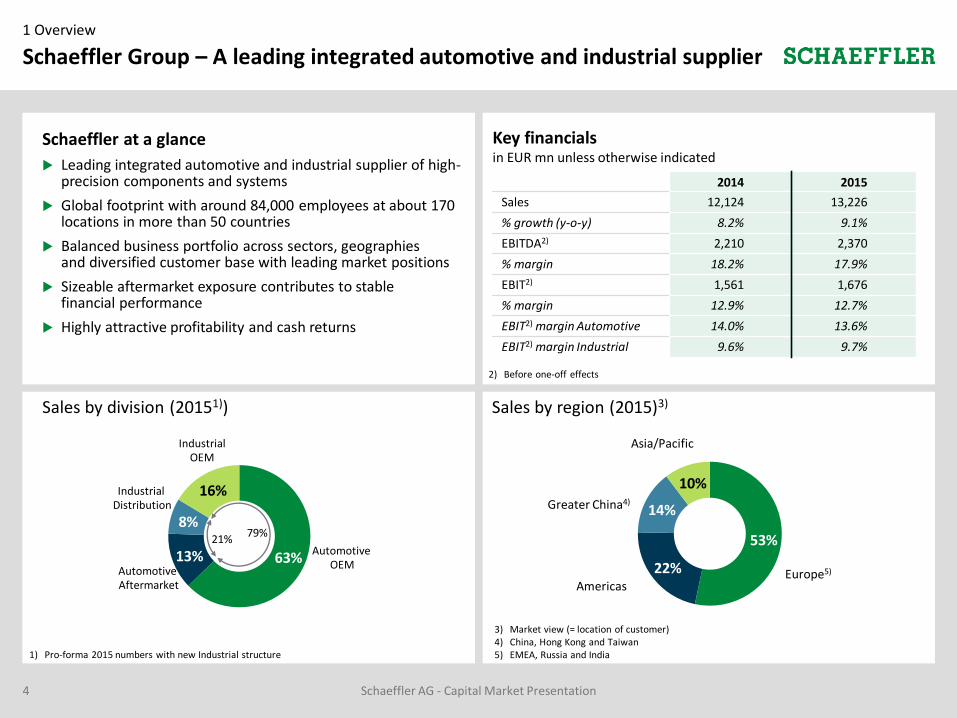
63%13%
8%
16%
Schaeffler Group – A leading integrated automotive and industrial supplier1 Overview
4 Schaeffler AG - Capital Market Presentation
Schaeffler at a glance
Leading integrated automotive and industrial supplier of high-precision components and systems
Global footprint with around 84,000 employees at about 170 locations in more than 50 countries
Balanced business portfolio across sectors, geographiesand diversified customer base with leading market positions
Sizeable aftermarket exposure contributes to stable financial performance
Highly attractive profitability and cash returns
2014 2015
Sales 12,124 13,226
% growth (y-o-y) 8.2% 9.1%
EBITDA2) 2,210 2,370
% margin 18.2% 17.9%
EBIT2) 1,561 1,676
% margin 12.9% 12.7%
EBIT2) margin Automotive 14.0% 13.6%
EBIT2) margin Industrial 9.6% 9.7%
Key financials in EUR mn unless otherwise indicated
Sales by region (2015)3)
3) Market view (= location of customer)4) China, Hong Kong and Taiwan5) EMEA, Russia and India
Sales by division (20151))
Industrial OEM
AutomotiveOEM
Industrial Distribution
Automotive Aftermarket
21%79%
1) Pro-forma 2015 numbers with new Industrial structure
53%
22%
14%
10%
Americas
Greater China4)
Europe5)
Asia/Pacific
2) Before one-off effects

Development of EBIT 2006 – 20151)
in EUR bn
Strong track record of above-average growth and profitability1 Overview
5 Schaeffler AG - Capital Market Presentation
1.1 1.11.0
0.4
1.5
1.7
1.5
1.0
1.4
1.4
2006 2007 2008 2009 2010 2011 2012 2013 2014 2015
Group EBIT EBIT margin (in %)
13% margin
Development of sales 2006 – 20151)
in EUR bn
1) 2006-2010 relates to financials of a different entity (Schaeffler VZ GmbH)
4.7% 8.4% -1.2% -17.6% 29.4% 12.6% 4.0% 0.7% 8.2% 9.1%
Sales growth (y-o-y)
2) Before one-off effects
12% margin
12.9% 12.6% 11.7% 6.1% 15.9% 16.2% 13.2% 12.8% 12.9% 12.7%
EBIT margin (before one-off effects)
12.1
2013 2015
11.110.7
CAGR +5%
2011
11.2
2012
13.2
20142010
9.5
2007 2009
7.3
2008
9.0
2006
8.38.9
2)
1.62)
1.5
1.72)

Development of operating cash flow 2006 – 20151)
in EUR mn
Proactive cash flow management over the cycle1 Overview
6 Schaeffler AG - Capital Market Presentation
933 920978
321361
773
860
572
857
1,025
2006 2007 2008 2009 2010 2011 2012 2013 2014 2015
1) 2006-2010 relates to financials of a different entity (Schaeffler VZ GmbH)
11.2% 10.2% 11.0% 4.4% 3.8% 7.2% 7.7% 5.1% 7.1% 7.7%
in % of sales
8% of sales
6% of sales
482 246 394 393 566 304 301 473 4192) 370
Free Cash Flow
597
890
1,021
2006 20132010
1,133
20082007 2014 2015
1,137
2009
1,091
20122011
1,0691,027
2) Adjusted for EU antitrust fine of EUR 371 mn
Development of capital exenditures2006 – 20151)
in EUR mn
1,372
1,2712)

Schaeffler AG - Capital Market Presentation7
Our success factors – Quality, technology and innovation1 Overview
Best-in-class innovation platform
Outstanding application expertise and productiontechnology
Quality, Technology and Innovation:
State-of-the-art Plants, R&D and testing facilities
Rank 2 in number of patent registrations in Germany
High level of application and system expertise:
Automotive: Know-how of the entire drivetrain allows offering of customized (patented) solutions
Industrial: Deep bearings product know-how allows offering of high-quality standard as well as customized solutions
Unique manufacturing process and production know-how allowing for production of complex parts at low cost, high quality and in high volumes:
Technology leader in Cold Forming, Forging and Heat Treatment
In-house Industrial Engineering with more than 9,800 people (covers entire manufacturing process)
In-house Tool Management & Prototyping with more than 4,400 people
In-house Special Machinery department with more than 1,400 people
Significant R&D spendin EUR mn
Rank in Germany
No of patents registered1)
1) German Patent and Trademark Office
1
3
593 611 622720
2012 2013 2014 2015
in % of sales +5.3% +5.5% +5.1% +5.4%
1.8542.100
2.5182.334
2012 2013 2014 2015
#4 #2 #2 #2
2

Customers base – Global and diversified2 Business profile and investment highlights
8 Schaeffler AG - Capital Market Presentation
Automotive customers Industrial customers
Total: ~8,000 customers Total: ~14,000 customers
Other customers ~40%
Top 10 customers
~60% of Automotive sales
Other customers ~85%
Top 10 customers
~15% of Industrialsales
~ 25% of Schaeffler sales
~ 75% of Schaeffler sales
Top 10 customers Top 10 customers

Product offering – Leader for critical components / systems in Automotive2 Business profile and investment highlights
Schaeffler AG - Capital Market Presentation9
Valve train components
Torque converter
Rolling bearings
Strut bearings
Ball screw drives for steering systems
Wheel bearings
Roll stabilizer
Balancer shaft
Thermo-management
Belt & Chain drive systems
Variable camshaft timer
~70% of Automotive division sales are
non-bearing related
Engine systems
(26% of sales in 2015)
Transmission systems
(42% of sales in 2015)
Chassis systems
(15% of sales in 2015)
Automotive Aftermarket
(17% of sales in 2015)
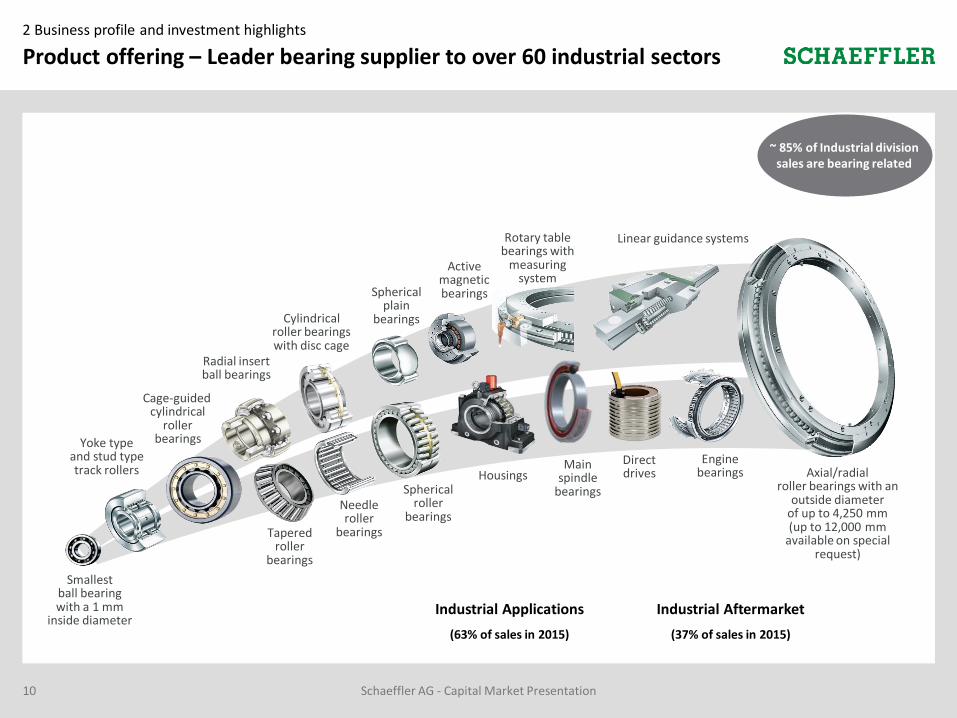
Product offering – Leader bearing supplier to over 60 industrial sectors2 Business profile and investment highlights
Schaeffler AG - Capital Market Presentation10
~ 85% of Industrial division sales are bearing related
Yoke type and stud type track rollers Axial/radial
roller bearings with an outside diameter
of up to 4,250 mm(up to 12,000 mm
available on special request)
Smallest ball bearing with a 1 mm
inside diameter
Spherical plain
bearingsCylindricalroller bearingswith disc cage
Radial insert ball bearings
Needleroller
bearings
Linear guidance systems
Mainspindle
bearingsSphericalroller
bearingsTapered
rollerbearings
Cage-guided cylindrical
rollerbearings
Directdrives
Rotary tablebearings with
measuringsystem
Enginebearings
Activemagneticbearings
Housings
Industrial Aftermarket
(37% of sales in 2015)
Industrial Applications
(63% of sales in 2015)
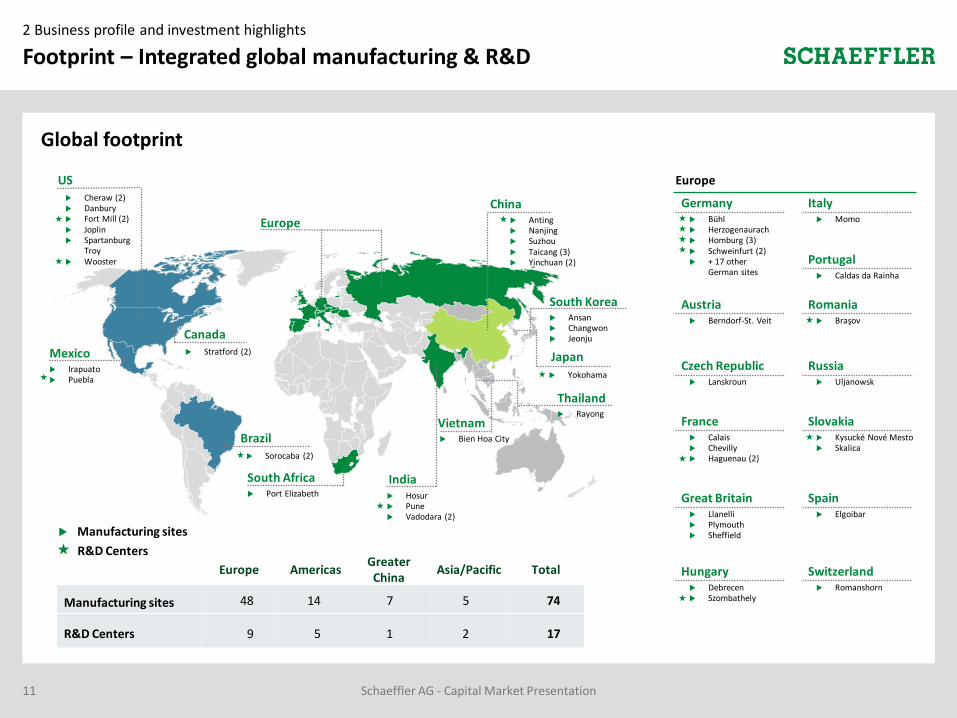
Footprint – Integrated global manufacturing & R&D2 Business profile and investment highlights
Schaeffler AG - Capital Market Presentation11
Anting Nanjing Suzhou Taicang (3) Yinchuan (2)
Global footprint
Europe AmericasGreater China
Asia/Pacific Total
Manufacturing sites 48 14 7 5 74
R&D Centers 9 5 1 2 17
Europe
Mexico Irapuato Puebla
Europe
Canada Stratford (2)
Brazil Sorocaba (2)
South Africa Port Elizabeth Hosur
Pune Vadodara (2)
India
Vietnam Bien Hoa City
Thailand Rayong
Ansan Changwon Jeonju
South Korea
China
Japan
Yokohama
US Cheraw (2) Danbury Fort Mill (2) Joplin Spartanburg
Troy Wooster
Germany Bühl Herzogenaurach Homburg (3) Schweinfurt (2) + 17 other
German sites
Great Britain Llanelli Plymouth Sheffield
Czech Republic Lanskroun
France Calais Chevilly Haguenau (2)
Spain Elgoibar
Portugal Caldas da Rainha
Italy Momo
Switzerland Romanshorn
Austria Berndorf-St. Veit
Romania Braşov
Hungary Debrecen Szombathely
Slovakia Kysucké Nové Mesto Skalica
Russia Uljanowsk
Manufacturing sites
R&D Centers

Our strategic concept – Long-term growth from "Mobility for tomorrow"2 Business profile and investment highlights
12 Schaeffler AG - Capital Market Presentation
… and in IndustrialOffering solutions in Automotive…
4 focus areasKey mega trends
Urbanization
Population growthSociety trends
Increasing complexity
DigitalizationTechnology trends
Renewable energies
Availability of resources
Environmentaltrends
Globalization
AffordabilityEconomic trends
Eco-friendly drives1
Interurban mobility3
Urban mobility 2
Energy chain 4
“Mobility for tomorrow”

Schaeffler equity story2 Business profile and investment highlights
Schaeffler AG - Capital Market Presentation13
2015 FX-adjusted sales growth of 5.8%, EBIT margin before special items at 13.6%
Best-in-class business with superior growth and margin profile
Out-performance of global light vehicle production on average by 6% per annum over the last five years
2015 FX-adjusted sales growth of -3.2%, EBIT margin before special items at 9.7%
Margin upside from CORE program: EBIT margin target of 13% by 2018
Strategic sales target: Industrial division contributes 25% to Group sales by 2020
Free Cash Flow generation of EUR 370 mn in 2015 with significant upside potential from lower interest costs going forward
Further deleveraging from operational cash flow (EUR750mn by 2018)
3 pillars
Out-performancein Automotive
Margin upsidein Industrial
Upside on Free Cash Flow generation
Profitable
growth
1
2
3
Automotive division again strongly outperforms the market in FY 20152 Business profile and investment highlights
14 Schaeffler AG - Capital Market Presentation
1
1) Before one-off effects
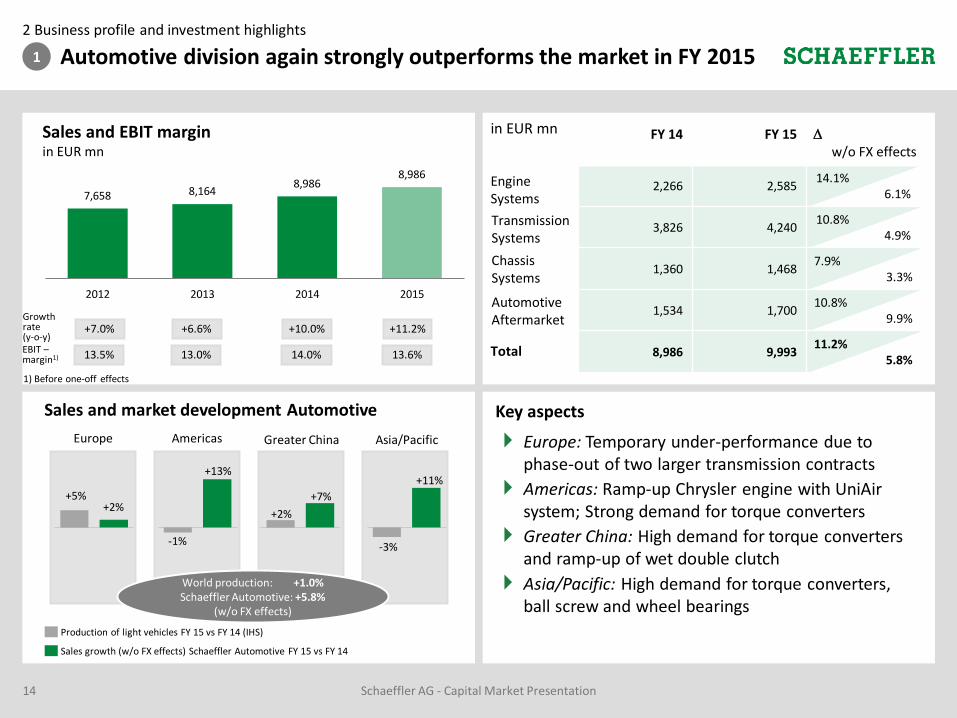
7,658 8,1648,986
8,986
2012 2013 2014 2015
Sales and EBIT margin in EUR mn
Growth rate (y-o-y)
+7.0% +6.6% +10.0% +11.2%
EBIT –margin1) 13.5% 13.0% 14.0% 13.6%
+2%+5%
Europe Americas Asia/PacificGreater China
+13%
-1%
+11%
-3%
+7%
+2%
Sales growth (w/o FX effects) Schaeffler Automotive FY 15 vs FY 14
World production: +1.0%Schaeffler Automotive: +5.8%
(w/o FX effects)
Sales and market development Automotive
Production of light vehicles FY 15 vs FY 14 (IHS)
Engine Systems
Transmission Systems
Total
FY 14 FY 15
w/o FX effects
2,266 2,58514.1%
6.1%
3,826 4,24010.8%
4.9%
1,360 1,4687.9%
3.3%
1,534 1,70010.8%
9.9%
8,986 9,99311.2%
5.8%
Automotive Aftermarket
Chassis Systems
in EUR mn
Key aspects
Europe: Temporary under-performance due to phase-out of two larger transmission contracts
Americas: Ramp-up Chrysler engine with UniAirsystem; Strong demand for torque converters
Greater China: High demand for torque converters and ramp-up of wet double clutch
Asia/Pacific: High demand for torque converters, ball screw and wheel bearings

Automotive – Best-in-class business with superior growth and margin2 Business profile and investment highlights
15 Schaeffler AG - Capital Market Presentation
1
Combustion engine dominant but will be further electrified... …to meet CO2 reduction targets
Source: University of Duisburg-Essen, IHS
CO2 legislation enacted worldwidePowertrain concepts
1) Proposed 2020 targetsSource: icct (November 2014)
80
115
150
185
220
2000 2005 2010 2015 2020 2025
g C
O2
/km
EU: 95g in 2020
US: 97g in 2025
Japan: 122g in 2020
China: 117g in 20201)
US: 106g in 2020
98%80%
56%
2%
19%
35%
1%9%
2013 2020 2030
Combustion engine Hybrids Electric
2014
Key CO2 emission reduction trends…
Engine Friction reduction
Efficiency increase
Thermal management
Start-Stop systems
Transmission
Friction reduction
Torsional vibration isolation
Increased automation
More gears
Clutch-by-Wire
Chassis Friction reduction
Weight reduction
Power on demand
48 V solutions
Hybridization Electrification
Micro&Mild hybrid
Full hybrid
Plug-In hybrid
Electric Vehicle
48 V solutions
...and our market leading solutions
Most comprehensive product offering for all transmission technologies; broad bearings portfolio
Outstanding know-how in damper technologies, clutches, torque converters and actuators
Mechatronic systems offerings
Strong market position in wheel bearings
High precision components and systems for increased variability in combustion engines
Dominant market position in valve-train components
Innovative Thermal Management Module
48V and high-voltage Hybrid modules for Full and Plug-in Hybrids
Complete electric axles for 48V and high-voltage systems for all-electric driving and implementation of all-wheel drive
1) Part of BD Transmission Systems
1)
Automotive – Best-in-class business with superior growth and margin2 Business profile and investment highlights
16 Schaeffler AG - Capital Market Presentation
1
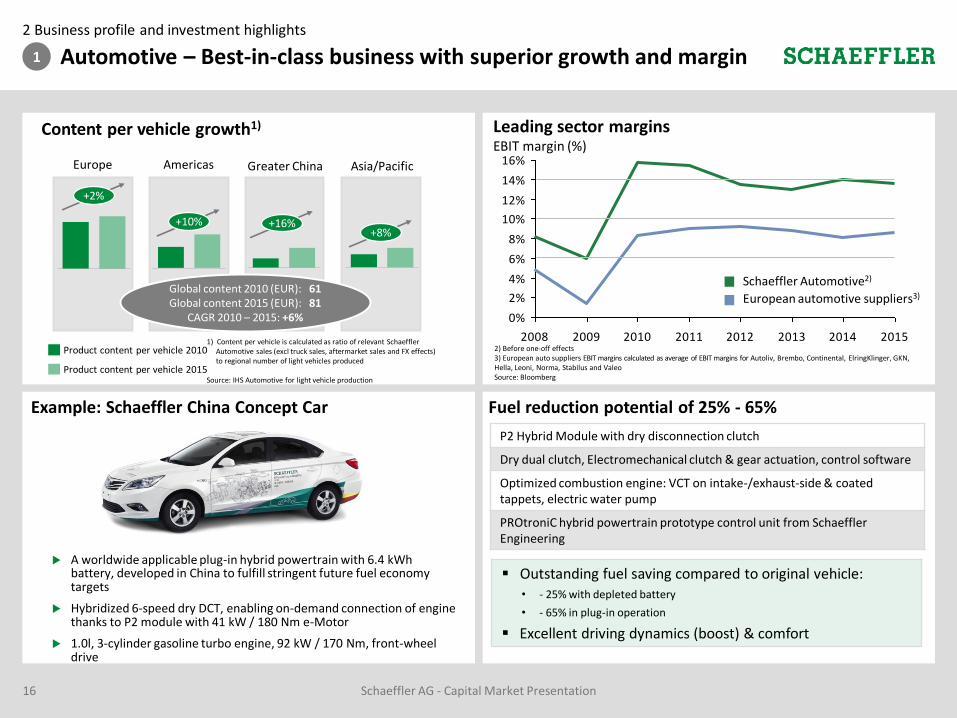
A worldwide applicable plug-in hybrid powertrain with 6.4 kWh battery, developed in China to fulfill stringent future fuel economy targets
Hybridized 6-speed dry DCT, enabling on-demand connection of engine thanks to P2 module with 41 kW / 180 Nm e-Motor
1.0l, 3-cylinder gasoline turbo engine, 92 kW / 170 Nm, front-wheel drive
Example: Schaeffler China Concept Car Fuel reduction potential of 25% - 65%
P2 Hybrid Module with dry disconnection clutch
Dry dual clutch, Electromechanical clutch & gear actuation, control software
Optimized combustion engine: VCT on intake-/exhaust-side & coated tappets, electric water pump
PROtroniC hybrid powertrain prototype control unit from SchaefflerEngineering
Outstanding fuel saving compared to original vehicle:• - 25% with depleted battery
• - 65% in plug-in operation
Excellent driving dynamics (boost) & comfort
Content per vehicle growth1)
Europe Americas Asia/PacificGreater China
Product content per vehicle 2010
Product content per vehicle 2015
1) Content per vehicle is calculated as ratio of relevant Schaeffler Automotive sales (excl truck sales, aftermarket sales and FX effects) to regional number of light vehicles produced
Source: IHS Automotive for light vehicle production
+10%+8%
+16%
+2%
Global content 2010 (EUR): 61Global content 2015 (EUR): 81
CAGR 2010 – 2015: +6% 0%
2%
4%
6%
8%
10%
12%
14%
16%
2008 2009 2010 2011 2012 2013 2014 20152) Before one-off effects3) European auto suppliers EBIT margins calculated as average of EBIT margins for Autoliv, Brembo, Continental, ElringKlinger, GKN, Hella, Leoni, Norma, Stabilus and ValeoSource: Bloomberg
Leading sector marginsEBIT margin (%)
Schaeffler Automotive2)
European automotive suppliers3)
Industrial division with mixed development in FY 20152 Business profile and investment highlights
17 Schaeffler AG - Capital Market Presentation
2
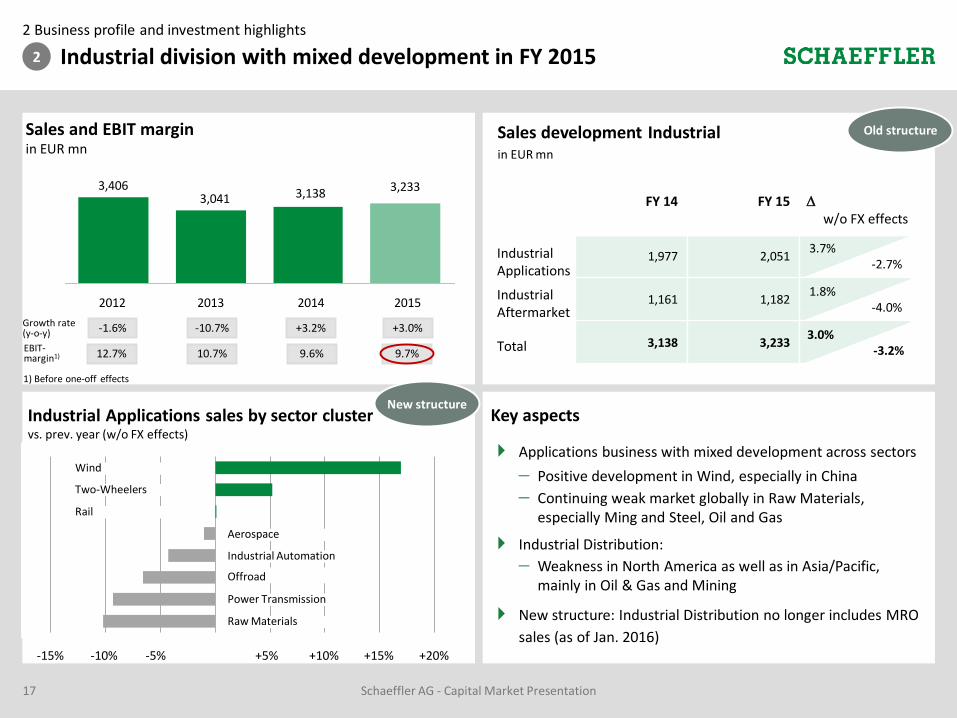
Sales and EBIT margin in EUR mn
Growth rate (y-o-y) -1.6% -10.7% +3.2% +3.0%
2014
3,138
2013
3,041
2012
3,406
2015
3,233
EBIT-margin1) 12.7% 10.7% 9.6% 9.7%
Industrial Applications sales by sector cluster vs. prev. year (w/o FX effects)
-15% -10% -5% +5% +10% +15%
Rail
Aerospace
Industrial Automation
Two-Wheelers
Offroad
Power Transmission
Raw Materials
Wind
+20%
New structure
Sales development Industrialin EUR mn
FY 14 FY 15
w/o FX effects
1,977 2,0513.7%
-2.7%
1,161 1,1821.8%
-4.0%
3,138 3,2333.0%
-3.2%
Industrial Applications
Industrial Aftermarket
Total
Old structure
1) Before one-off effects
Key aspects
Applications business with mixed development across sectors
Positive development in Wind, especially in China
Continuing weak market globally in Raw Materials, especially Ming and Steel, Oil and Gas
Industrial Distribution:
Weakness in North America as well as in Asia/Pacific, mainly in Oil & Gas and Mining
New structure: Industrial Distribution no longer includes MRO
sales (as of Jan. 2016)

2 Business profile and investment highlights
Schaeffler AG - Capital Market Presentation18
Sales development and profitability below expectation
Delivery performance with room for improvement
Production footprint geared towards Europe
Organizational structure with too much emphasis on central functions
1
3
4
Product and business portfolio very broad5
Re-energizing Industrial Division
Industrial business contributes 25% to Group
sales by 2020
13% EBIT margin by 2018
Re-energizing the Industrial businessby Program CORE
Decreasing market share with high-volume products 2
6
Strategic target
Profitability target
Key issues Industrial division
Industrial – Growth and margin upside from program CORE2
Schaeffler AG - Capital Market Presentation19
2 Business profile and investment highlights
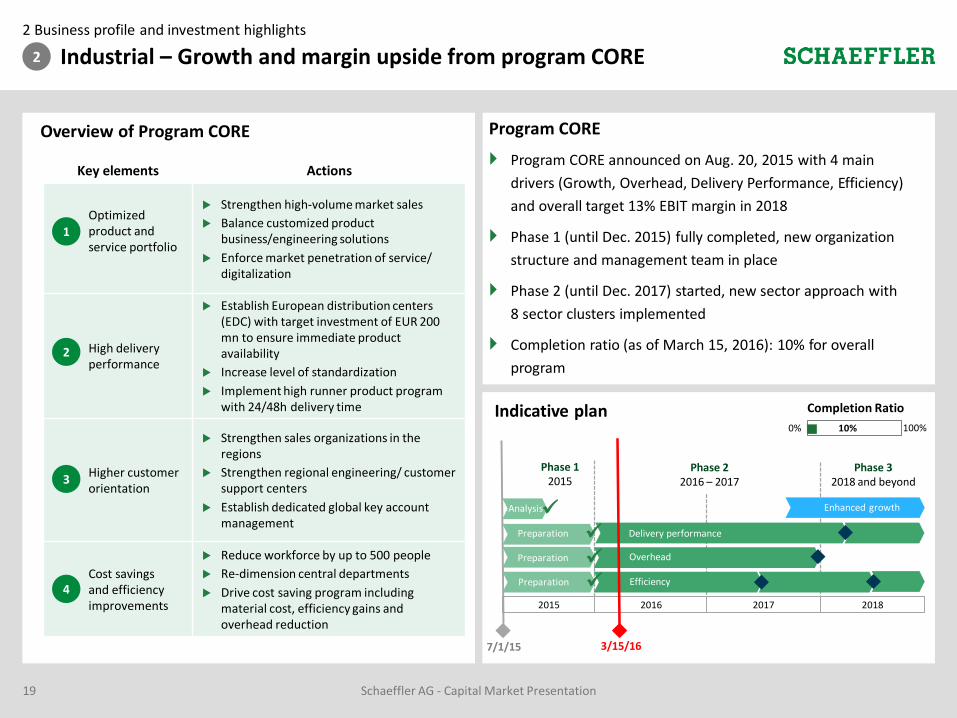
Key elements Actions
Optimized product and service portfolio
Strengthen high-volume market sales
Balance customized product business/engineering solutions
Enforce market penetration of service/ digitalization
High deliveryperformance
Establish European distribution centers (EDC) with target investment of EUR 200 mn to ensure immediate product availability
Increase level of standardization
Implement high runner product program with 24/48h delivery time
Higher customer orientation
Strengthen sales organizations in the regions
Strengthen regional engineering/ customer support centers
Establish dedicated global key account management
Cost savings and efficiency improvements
Reduce workforce by up to 500 people
Re-dimension central departments
Drive cost saving program including material cost, efficiency gains and overhead reduction
1
2
3
4
Overview of Program CORE
Industrial – Growth and margin upside from program CORE2
7/1/15
Indicative plan
2015 2016 2017
Implementation of lean processes
Enhanced growth
Phase 32018 and beyond
Delivery performance
2018
Phase 22016 – 2017
Efficiency
0% 100%10%
Overhead
Analysis
Preparation
Preparation
Preparation
Phase 12015
Completion Ratio
3/15/16
Program CORE
Program CORE announced on Aug. 20, 2015 with 4 main
drivers (Growth, Overhead, Delivery Performance, Efficiency)
and overall target 13% EBIT margin in 2018
Phase 1 (until Dec. 2015) fully completed, new organization
structure and management team in place
Phase 2 (until Dec. 2017) started, new sector approach with
8 sector clusters implemented
Completion ratio (as of March 15, 2016): 10% for overall
program
Strong underlying free cash flow generation2 Business profile and investment highlights
20 Schaeffler AG - Capital Market Presentation
3
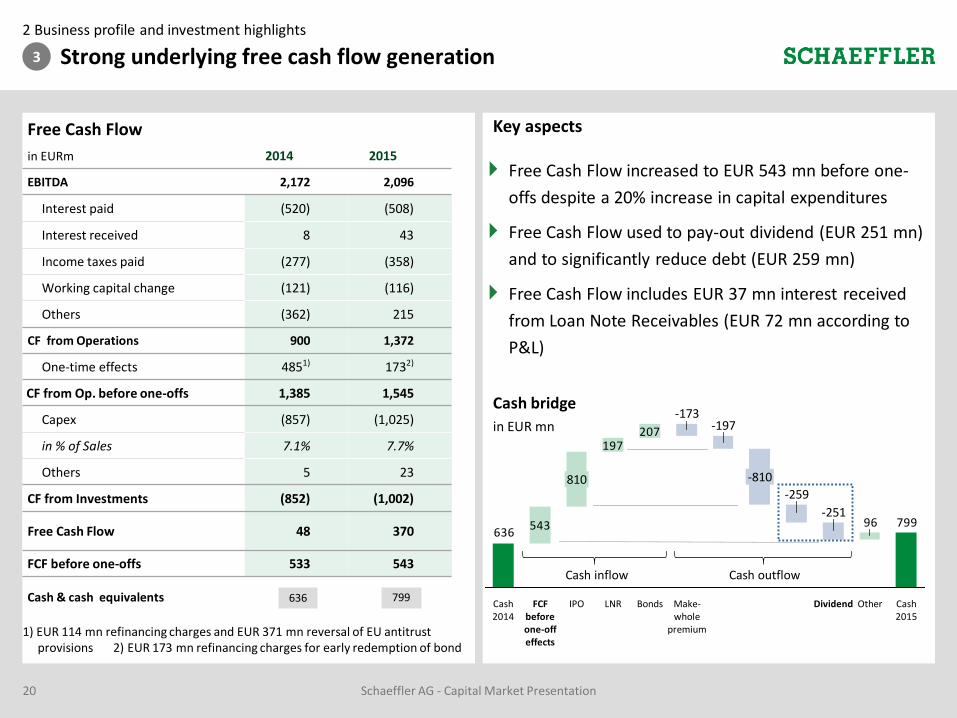
2014 2015
EBITDA 2,172 2,096
Interest paid (520) (508)
Interest received 8 43
Income taxes paid (277) (358)
Working capital change (121) (116)
Others (362) 215
CF from Operations 900 1,372
One-time effects 4851) 1732)
CF from Op. before one-offs 1,385 1,545
Capex (857) (1,025)
in % of Sales 7.1% 7.7%
Others 5 23
CF from Investments (852) (1,002)
Free Cash Flow 48 370
FCF before one-offs 533 543
1) EUR 114 mn refinancing charges and EUR 371 mn reversal of EU antitrustprovisions 2) EUR 173 mn refinancing charges for early redemption of bond
Cash bridge
in EUR mn
Free Cash Flow increased to EUR 543 mn before one-
offs despite a 20% increase in capital expenditures
Free Cash Flow used to pay-out dividend (EUR 251 mn)
and to significantly reduce debt (EUR 259 mn)
Free Cash Flow includes EUR 37 mn interest received
from Loan Note Receivables (EUR 72 mn according to
P&L)
Key aspects
543
197207
79996636
LNRIPO
810
FCF before one-off effects
Cash 2014
-173
OtherBonds Dividend
-197
-810
Make-whole
premium
-251
Cash 2015
-259
Cash inflow Cash outflow
Cash & cash equivalents 636 799
Free Cash Flow
in EURm
Schaeffler AG - Capital Market Presentation21
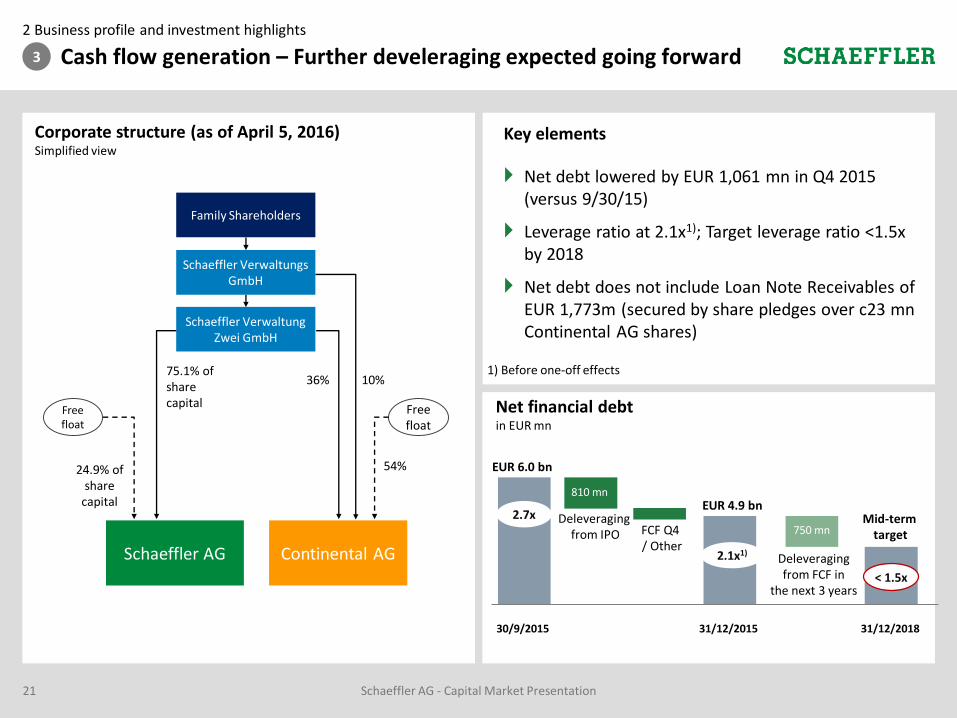
O Cash flow generation – Further develeraging expected going forward2 Business profile and investment highlights
3
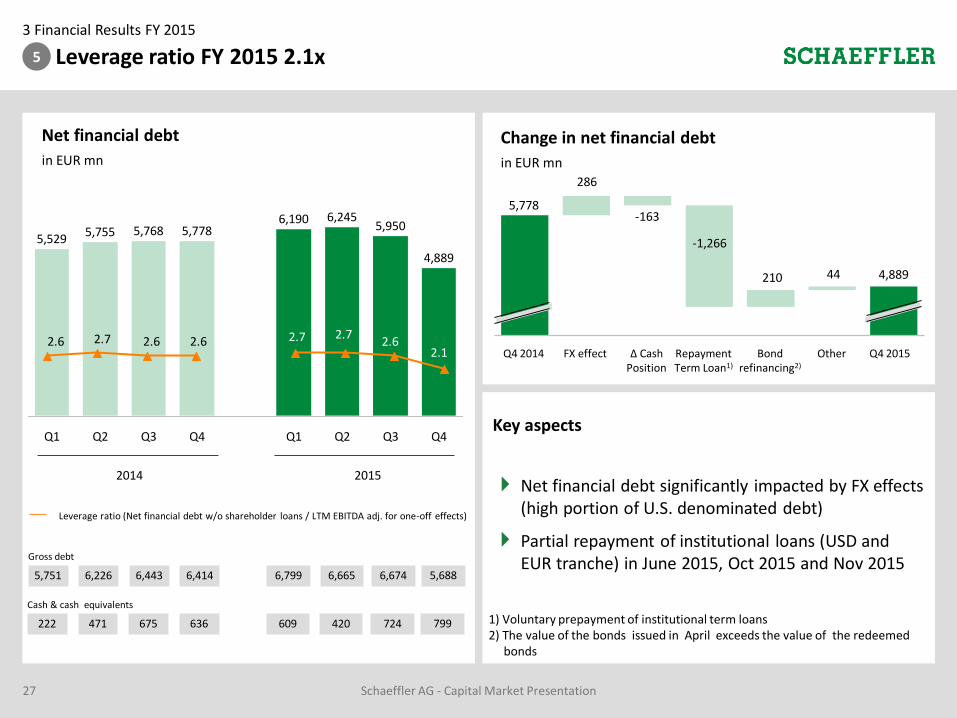
Net debt lowered by EUR 1,061 mn in Q4 2015 (versus 9/30/15)
Leverage ratio at 2.1x1); Target leverage ratio <1.5x by 2018
Net debt does not include Loan Note Receivables of EUR 1,773m (secured by share pledges over c23 mnContinental AG shares)
Key elements
EUR 6.0 bn
2.7x
2.1x1)
< 1.5x
Deleveragingfrom IPO
Deleveragingfrom FCF in
the next 3 years
Mid-termtarget
30/9/2015 31/12/2015 31/12/2018
750 mn
1) Before one-off effects
Net financial debtin EUR mn
EUR 4.9 bn
Schaeffler VerwaltungsGmbH
Schaeffler AG
100%
Continental AG
75.1% of share capital
36% 10%
Free float
54%
Free float
24.9% of share
capital
Corporate structure (as of April 5, 2016) Simplified view
Family Shareholders
Schaeffler VerwaltungZwei GmbH
810 mn
FCF Q4 / Other
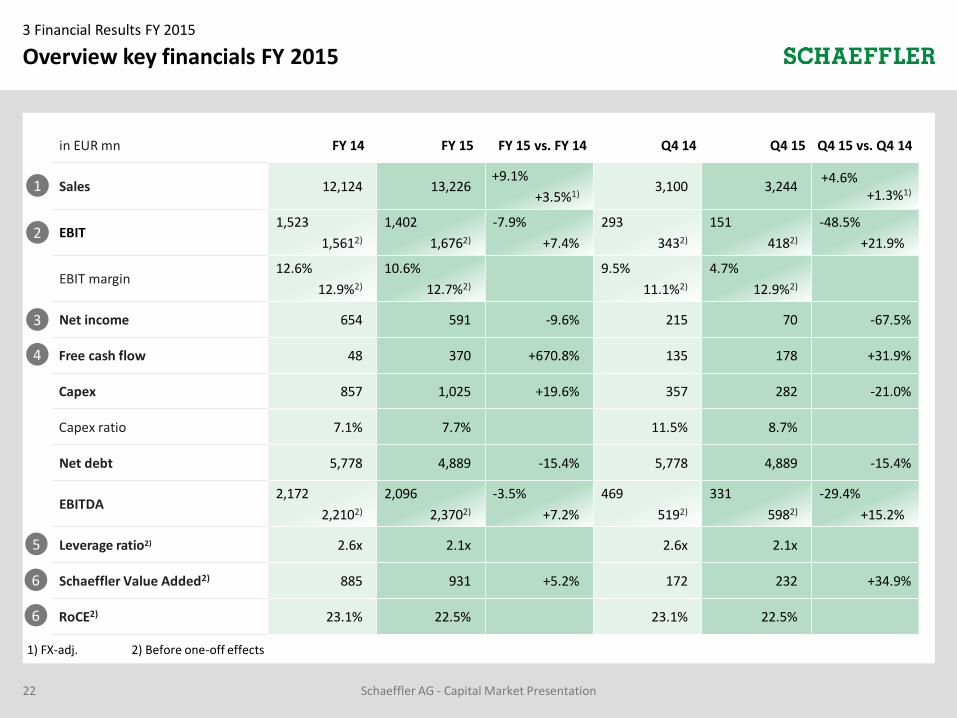
3 Financial Results FY 2015
Overview key financials FY 2015
22
in EUR mn FY 14 FY 15 FY 15 vs. FY 14 Q4 14 Q4 15 Q4 15 vs. Q4 14
Sales 12,124 13,226+9.1%
+3.5%1)3,100 3,244
+4.6%+1.3%1)
EBIT1,523
1,5612)
1,402
1,6762)
-7.9%
+7.4%
293
3432)
151
4182)
-48.5%
+21.9%
EBIT margin12.6%
12.9%2)
10.6%
12.7%2)
9.5%
11.1%2)
4.7%
12.9%2)
Net income 654 591 -9.6% 215 70 -67.5%
Free cash flow 48 370 +670.8% 135 178 +31.9%
Capex 857 1,025 +19.6% 357 282 -21.0%
Capex ratio 7.1% 7.7% 11.5% 8.7%
Net debt 5,778 4,889 -15.4% 5,778 4,889 -15.4%
EBITDA2,172
2,2102)
2,096
2,3702)
-3.5%
+7.2%
469
5192)
331
5982)
-29.4%
+15.2%
Leverage ratio2) 2.6x 2.1x 2.6x 2.1x
Schaeffler Value Added2) 885 931 +5.2% 172 232 +34.9%
RoCE2) 23.1% 22.5% 23.1% 22.5%
Schaeffler AG - Capital Market Presentation
1) FX-adj. 2) Before one-off effects
1
2
4
3
5
6
6

Schaeffler AG - Capital Market Presentation23
Sales FY 2015 up 9.1% – FX-adj. up 3.5%3 Financial Results FY 2015
Q3
3,250
Q2
3,387
Q1
3,345
Q4
3,100
Q3
3,034
Q2
3,014
Q1
2,976
Q4
3,244
2014 2015
Gross profit margin in %
13,226
Sales
in EUR mn
53%
22%
14%
10%
Americas
+17.5% (+8.2%)
Greater China
+23.5% (+6.0%)
Europe
+2.1% (+1.0%)
Asia/Pacific
+13.5% (+5.0%)
FY 2015 sales by regionY-o-y growth (w/o FX effects)
Sales by divisionY-o-y growth (w/o FX effects)
FY 14 FY 15
(w/o FX effects)
Q4 14 Q4 15
(w/o FX effects)
Auto-motive
8,986 9,99311.2%
(5.8%)2,316 2,482
7.2%
(3.8%)
Indu-strial
3,138 3,2333.0%
(-3.2%)784 762
-2.8%
(-6.1%)
Total 12,124 13,2269.1%
(3.5%)3,100 3,244
4.6%
(1.3%)
28.7 27.7 28.9 27.5
28.2
28.3 28.0
28.6
12,124
28.7 29.3
1

EBIT margin FY 2015 12.7%1)
3 Financial Results FY 2015
434
151
293
418
267
433
384
50
429383
Q3Q2Q1
441
Q3Q2Q1
406 7
Q4
343
Q4
418
-12
2014 2015
EBIT margin in %
1,676
EBIT1)
in EUR mn
13.0 11.3
1,561
Key aspects
FY 15 EBIT1) margin slightly below previous year due to increase in R&D expenses and temporarily higher freight costs
Adjustments: one-off effects in EBIT 2015 include provisions for restructuring for program CORE (EUR 36 mn) and provisions for legal claims (EUR 238 mn)
EBIT1) by divisionin EUR mn
Automotive
Industrial
Total
10.6
13.3
FY 14 FY 15 Q4 14 Q4 15
1,260 1,362 +8.1% 326 356 +9.2%
14.0% 13.6% 14.1% 14.3%
301 314 +4.3% 17 62 +264.7%
9.6% 9.7% 2.2% 8.1%
1,561 1,676 +7.4% 343 418 +21.9%
12.9% 12.7% 11.1% 12.9%
Margin
Margin
Margin
24 Schaeffler AG - Capital Market Presentation
1) Before one-off effects
4.714.0 12.7
12.6
14.1 9.5
EBIT1) margin in %
13.2 11.3
12.7
13.3 12.913.6 12.7
12.9
14.1 11.1
2
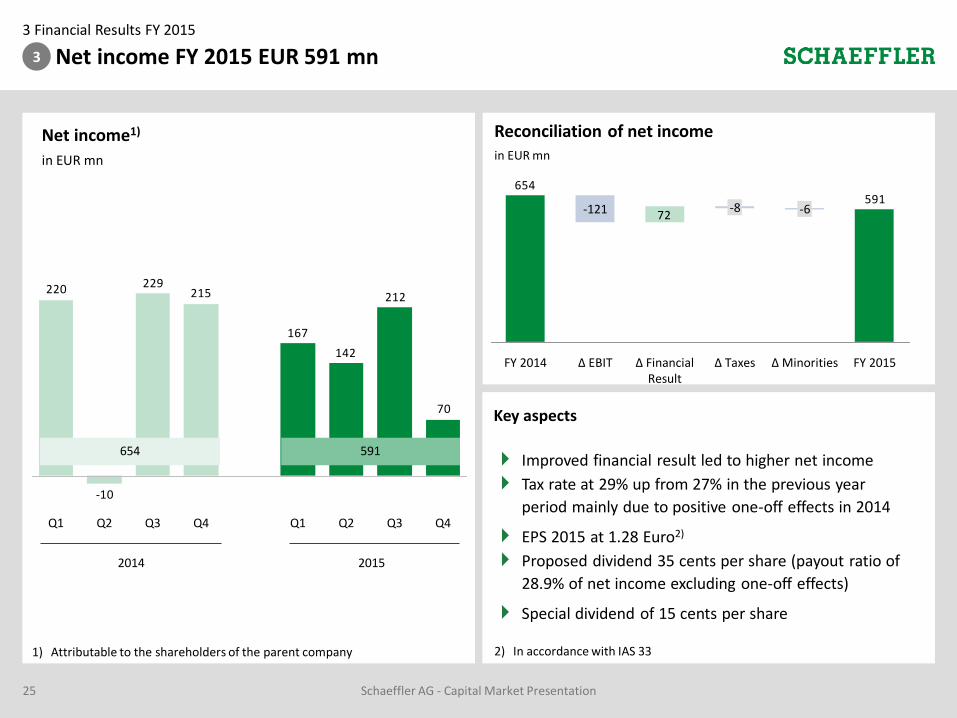
3 Financial Results FY 2015
Net income FY 2015 EUR 591 mn
70
212
142
167
215229
-10
220
Q4Q3Q2 Q2Q1 Q4Q3 Q1
2014 2015
591
Net income1)
in EUR mn
654
1) Attributable to the shareholders of the parent company
Reconciliation of net incomein EUR mn
72591
654
-121
FY 2014
-6
Δ MinoritiesΔ Financial Result
-8
FY 2015Δ TaxesΔ EBIT
Key aspects
Improved financial result led to higher net income
Tax rate at 29% up from 27% in the previous year
period mainly due to positive one-off effects in 2014
EPS 2015 at 1.28 Euro2)
Proposed dividend 35 cents per share (payout ratio of
28.9% of net income excluding one-off effects)
Special dividend of 15 cents per share
25 Schaeffler AG - Capital Market Presentation
2) In accordance with IAS 33
3

Schaeffler AG - Capital Market Presentation26
Free cash flow FY 2015 EUR 370 mn3 Financial Results FY 2015
Free cash flow FY 2015
in EUR mn
370
238
-116
2,096
-1,025
-292
-358
-1731)
Free cash flow
OtherCapexΔ Working Capital
EBITDA TaxInterest
1) One-off effect from refinancing transaction in Q2 2015
Key aspects
Capex increased by EUR 168 mn
FCF impacted by significant Other line (includes provision for legal claims of EUR 238 mn and for restructuring of EUR 36 mn in 2015 and antitrust fine of EUR 371 mn in 2014, respectively)
∆ Free Cash Flow FY 2015 vs. FY 2014
in EUR mn 370
48
76595
5
47168
81
OtherTaxesΔ Working Capital
EBITDAFCF FY 2014
Net Interest
payments
Capex FCF FY 2015
4
3 Financial Results FY 2015
Leverage ratio FY 2015 2.1x
5,7685,755
Q2Q1
5,529
4,889
Q4
6,245
Q2
5,950
Q3Q3 Q1
6,190
Q4
5,778
2014 2015
Gross debt
Net financial debt
in EUR mn
5,751 6,226 6,443 6,414 6,799 6,665
Cash & cash equivalents
222 471 675 636 609 420
Leverage ratio (Net financial debt w/o shareholder loans / LTM EBITDA adj. for one-off effects)
Change in net financial debt
in EUR mn
2.6 2.7 2.6 2.6 2.7 2.7
2.1
6,674
724
Key aspects
Net financial debt significantly impacted by FX effects (high portion of U.S. denominated debt)
Partial repayment of institutional loans (USD and EUR tranche) in June 2015, Oct 2015 and Nov 2015
27 Schaeffler AG - Capital Market Presentation
2.6
5,688
799
286
-163
210 44 4,889
Q4 2015OtherBond refinancing2)
Repayment Term Loan1)
Δ Cash Position
FX effectQ4 2014
5,778
-1,266
1) Voluntary prepayment of institutional term loans 2) The value of the bonds issued in April exceeds the value of the redeemed
bonds
5
Schaeffler AG - Capital Market Presentation
Schaeffler Value Added 931 EUR mn – RoCE 22.5%3 Financial Results FY 2015
6
28
Return on Capital Employed1)
2013
22.1%22.1% 23.1%
2014
22.5%
20152012
Schaeffler Value Added1)
in EUR mn
1) Before one-off effects
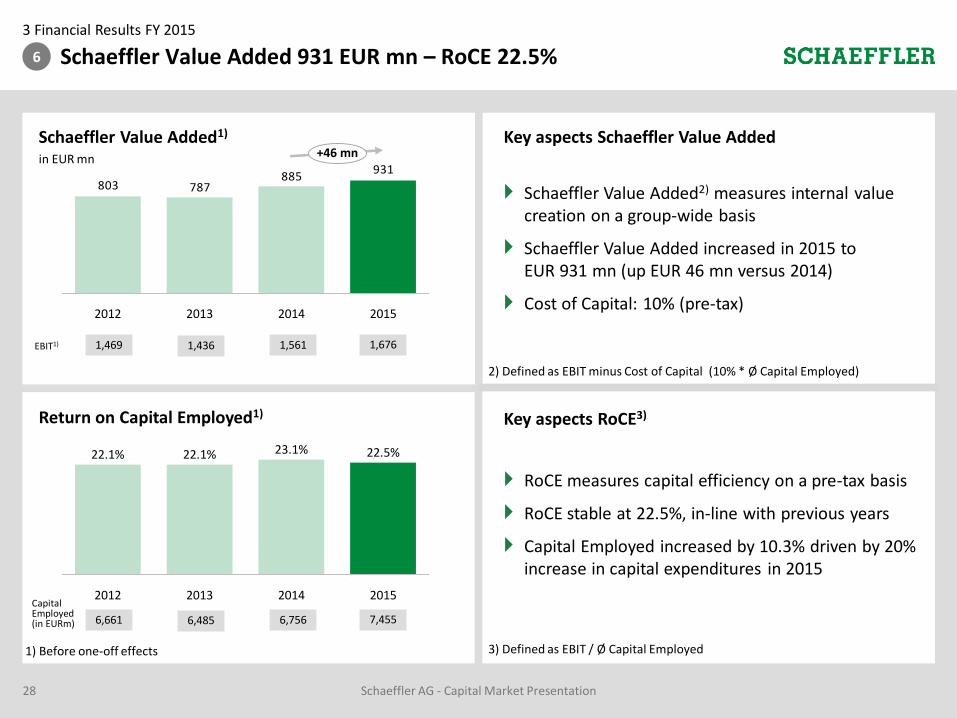
931885
803 787
20142013 2015
+46 mn
2012
Key aspects Schaeffler Value Added
1,469EBIT1) 1,436 1,561 1,676
6,661
Capital Employed (in EURm) 6,485 6,756 7,455
Schaeffler Value Added2) measures internal value creation on a group-wide basis
Schaeffler Value Added increased in 2015 to EUR 931 mn (up EUR 46 mn versus 2014)
Cost of Capital: 10% (pre-tax)
RoCE measures capital efficiency on a pre-tax basis
RoCE stable at 22.5%, in-line with previous years
Capital Employed increased by 10.3% driven by 20% increase in capital expenditures in 2015
2) Defined as EBIT minus Cost of Capital (10% * Ø Capital Employed)
Key aspects RoCE3)
3) Defined as EBIT / Ø Capital Employed
Guidance 20164 Outlook and Summary
29 Schaeffler AG - Capital Market Presentation
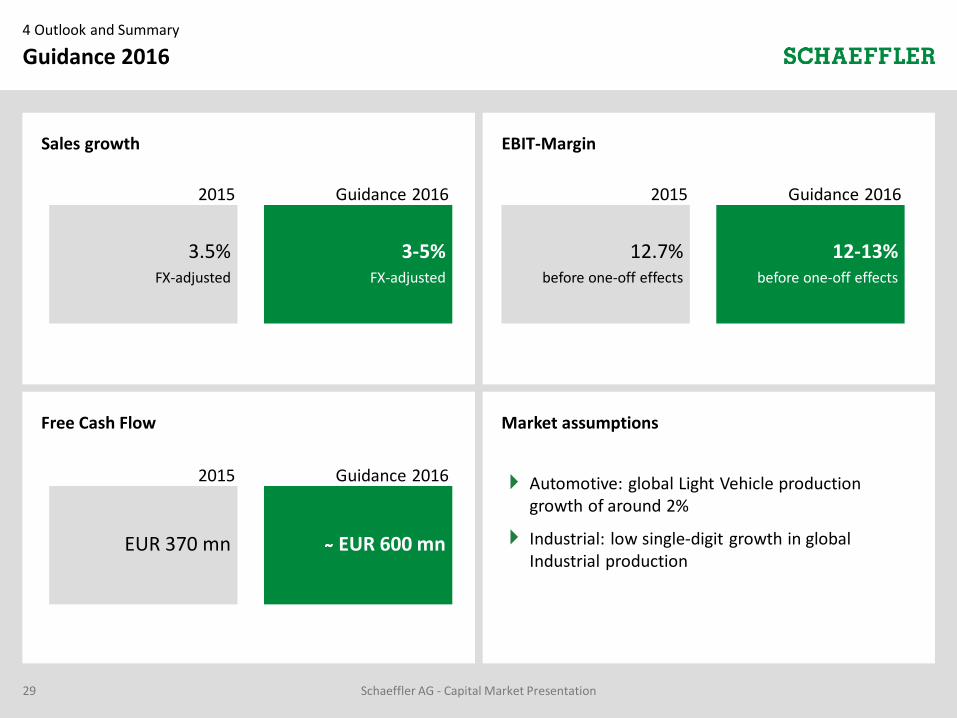
Market assumptions
Automotive: global Light Vehicle production growth of around 2%
Industrial: low single-digit growth in global Industrial production
Free Cash Flow
EBIT-MarginSales growth
3.5% FX-adjusted
3-5% FX-adjusted
Guidance 20162015
12.7%before one-off effects
12-13%before one-off effects
Guidance 20162015
EUR 370 mn ̴̴ EUR 600 mn
Guidance 20162015

Financial calendar 2016
Results FY 2015March 15, 2016
BofAML Global Industrial Conference, LondonMarch 17, 2016
Annual General Meeting, NurembergApril 22, 2016
Results Q1 2016May 12, 2016
Capital Market Day, LondonJuly 20, 2016
Schaeffler AG - Capital Market Presentation30
JP Morgan Annual Autos Conference, LondonJune 7, 2016
UniCredit Automotive Credit Conference, LondonJune 8, 2016
Deutsche Bank European Leveraged Finance Conference, LondonJune 9, 2016
dbAccess German, Swiss, Austrian Conference, BerlinJune 10, 2016

Investor Relations
phone: + 49 9132 82 4440
fax: + 49 9132 82 4444
Email: [email protected]
Web: www.schaeffler.com/ir
IR contact
Christoph Beumelburg +49 (0)9132 82 5414
Niels Fehre +49 (0)9132 82 85805
Susanne Sievers +49 (0)9132 82 4408
31 Schaeffler AG - Capital Market Presentation
Backup
Sales per division
32
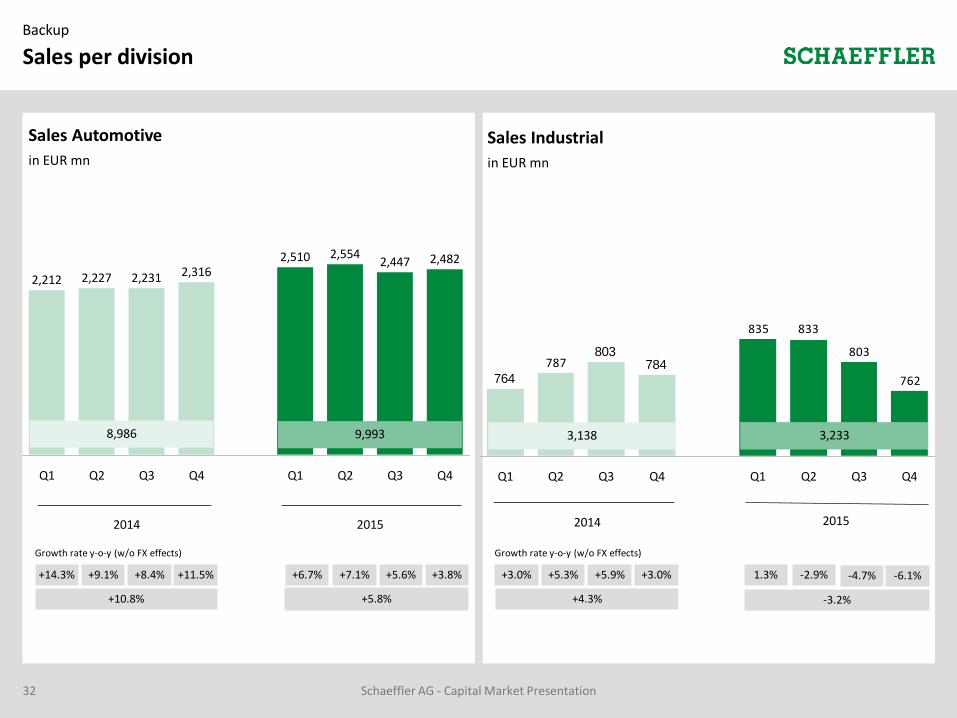
2,482
Q4Q4 Q1 Q2Q1 Q3
2,227
2,554
2,3162,510 2,447
Q2
2,231
Q3
2,212
762
803
833835
787 784803
764
Q4Q1Q4 Q3Q2Q1 Q2 Q3
Sales Automotive
in EUR mn
Sales Industrial
in EUR mn
2014 2015 2014 2015
9,9938,986 3,2333,138
Growth rate y-o-y (w/o FX effects)
+14.3% +9.1% +8.4% +11.5% +6.7% +7.1%
Growth rate y-o-y (w/o FX effects)
+3.0% +5.3% +5.9% +3.0% 1.3% -2.9%
+10.8% +5.8% +4.3% -3.2%
-4.7%+5.6%
Schaeffler AG - Capital Market Presentation
+3.8% -6.1%
Backup
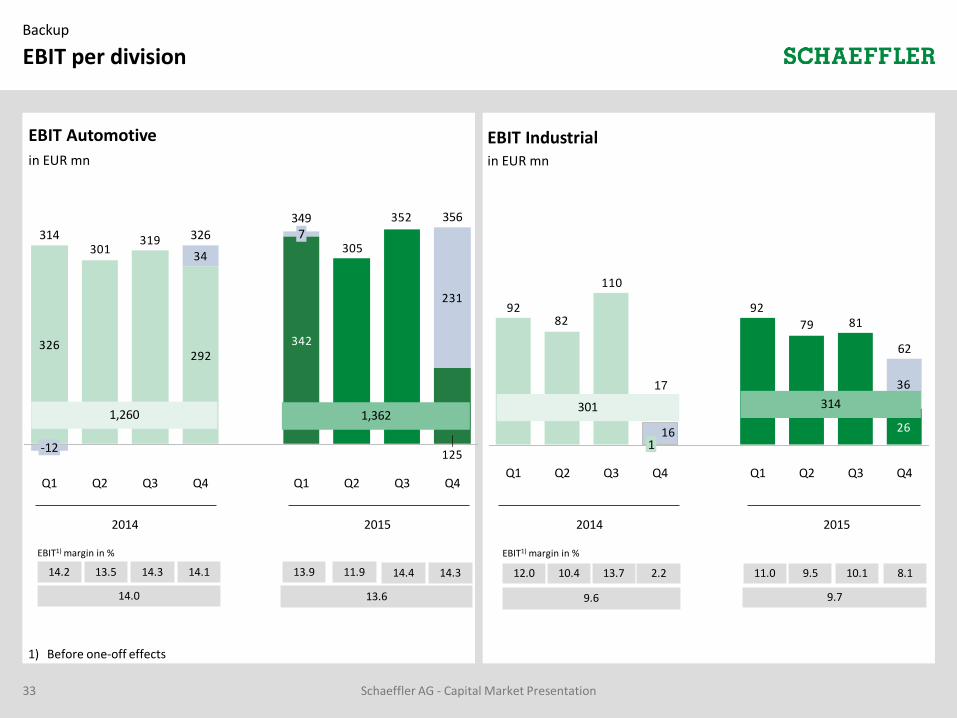
EBIT per division
33
292326
125
342
231
352
30534
319301
Q3Q2
349
Q1 Q2 Q3
356
-12
314
Q1 Q4Q4
326 7
36
26
8179
92
16
110
8292
Q2 Q3 Q4
62
Q1 Q2 Q4 Q1
17
Q3
1
EBIT Automotive
in EUR mn
EBIT Industrialin EUR mn
2014 2015 2014 2015
EBIT1) margin in %
14.2 13.5 14.3 14.1
14.0
13.9 11.9
13.6
EBIT1) margin in %
12.0 10.4 13.7 2.2
9.6
11.0 9.5
9.7
1,3621,260314301
10.114.4
Schaeffler AG - Capital Market Presentation
17
14.3 8.1
1) Before one-off effects
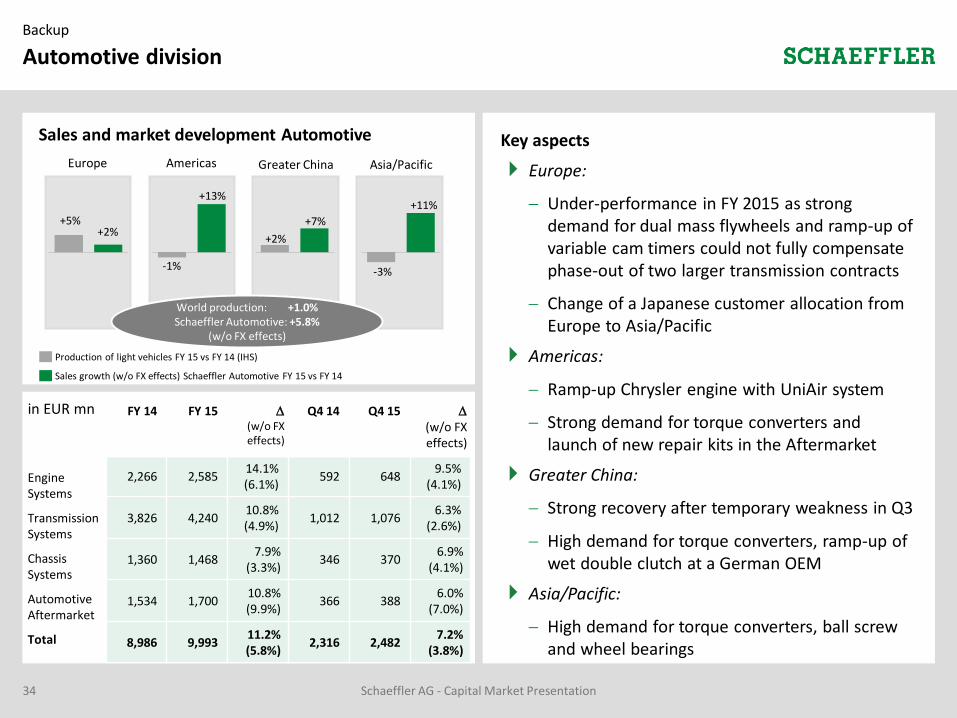
Automotive divisionBackup
Key aspects
Europe:
Under-performance in FY 2015 as strong demand for dual mass flywheels and ramp-up of variable cam timers could not fully compensate phase-out of two larger transmission contracts
Change of a Japanese customer allocation from Europe to Asia/Pacific
Americas:
Ramp-up Chrysler engine with UniAir system
Strong demand for torque converters and launch of new repair kits in the Aftermarket
Greater China:
Strong recovery after temporary weakness in Q3
High demand for torque converters, ramp-up of wet double clutch at a German OEM
Asia/Pacific:
High demand for torque converters, ball screw and wheel bearings
+2%+5%
Europe Americas Asia/PacificGreater China
+13%
-1%
+11%
-3%
+7%
+2%
34
Sales growth (w/o FX effects) Schaeffler Automotive FY 15 vs FY 14
World production: +1.0%Schaeffler Automotive: +5.8%
(w/o FX effects)
Sales and market development Automotive
Production of light vehicles FY 15 vs FY 14 (IHS)
Engine Systems
Transmission Systems
Total
FY 14 FY 15 (w/o FX effects)
Q4 14 Q4 15
(w/o FX effects)
2,266 2,58514.1%(6.1%)
592 6489.5%
(4.1%)
3,826 4,24010.8%(4.9%)
1,012 1,0766.3%
(2.6%)
1,360 1,4687.9%
(3.3%)346 370
6.9% (4.1%)
1,534 1,70010.8%(9.9%)
366 3886.0%
(7.0%)
8,986 9,99311.2%(5.8%)
2,316 2,4827.2%
(3.8%)
Automotive Aftermarket
Chassis Systems
Schaeffler AG - Capital Market Presentation
in EUR mn

Schaeffler AG - Capital Market Presentation35
Industrial Applications sales by sector cluster vs. prev. year (w/o FX effects)
Sales development Industrialin EUR mn
FY 14 FY 15
(w/o FX effects)
Q4 14 Q4 15
(w/o FX effects)
1,977 2,0513.7%
(-2.7%)488 480
-1.6%(-5.7%)
1,161 1,1821.8%
(-4.0%)296 282
-4.7%(-7.4%)
3,138 3,2333.0%
(-3.2%)784 762
-2.8%(-6.1%)
Industrial Applications
Industrial Aftermarket
Total
Backup
Industrial division
Key aspects
Industrial OEM business with mixed development across sectors
Positive development in Wind, especially in China
Continuing weak market globally in Raw Materials, especially Ming and Steel, Oil and Gas
Industrial Distribution:
Weakness in North America as well as in Asia/Pacific, mainly in Oil & Gas and Mining
-15% -10% -5% +5% +10% +15%
Rail
Aerospace
Industrial Automation
Two-Wheelers
Offroad
Power Transmission
Raw Materials
Wind
+20%
New structure
Old structure
8 sector clusters Wind Raw MaterialsAerospace RailOffroad Two-WheelersPower Transmission Industrial AutomationIndustrial Distribution
10%
13%14%
8%7%
7%
5%4%
33%67%
63%37%
Old structure New structure1)
Industrial Applications
Industrial Aftermarket +
1) Pro-forma 2015 numbers; Industrial Distribution does not include MRO sales

Backup
Financial Result
85
125
161176
122
375
100
Q2Q2Q1 Q1Q3 Q4 Q4Q3
2014 2015
547
Financial Result1)
in EUR mn
1) For presentation purposes negative results are shown as positive figures
EUR -72 mnvs FY 2014
61922
36 Schaeffler AG - Capital Market Presentation
Reconciliation Financial Resultin EUR mn
One-offeffects
refinancing2015
272
Non-cashvaluation
effects loans /bonds
-196
-79
12M2015
as reported
12M 2015excl. one-offs andvaluation effects
547
2) Including non-cash valuation effects of EUR 77 mn from refinancingtransactions in 2014
in EUR mn 12M 14 12M 15 Q4 14 Q4 15
Cash interest 266 255 -11 85 83 -2
Accrued interest 54 41 -13 -6 -18 -12
Other 100 -24 -124 3 -8 -11
Financial Result excl. one-offs and valuation effects
420 272 -148 82 57 -25
Non-cash valuation effects
-22 79 101 -46 26 72
One-off effects refinancing
2212) 196 -25 -14 2 16
Reported Financial Result
619 547 -72 22 85 63

Backup
Working Capital and Capex
37
2014 2015
282
242257244
357
202
143155
Q1 Q2 Q4Q4 Q2Q1 Q3Q3
In % of sales
2) Cash view
1,025
Capex2)
in EUR mn
5.2 4.7 6.7 11.5
7.1
7.3 7.6
7.7
857
Q3
3,022
Q1 Q3
2,944
2,548
2,880
Q4 Q2 Q4
2,7782,900
Q1 Q2
2,696 2,662
2014 2015
In % of sales
23.6 24.0 24.6 21.0 24.2 22.9
Working capitalin EUR mn
7.422.0
Schaeffler AG - Capital Market Presentation
20.1 8.7
21.0 20.1
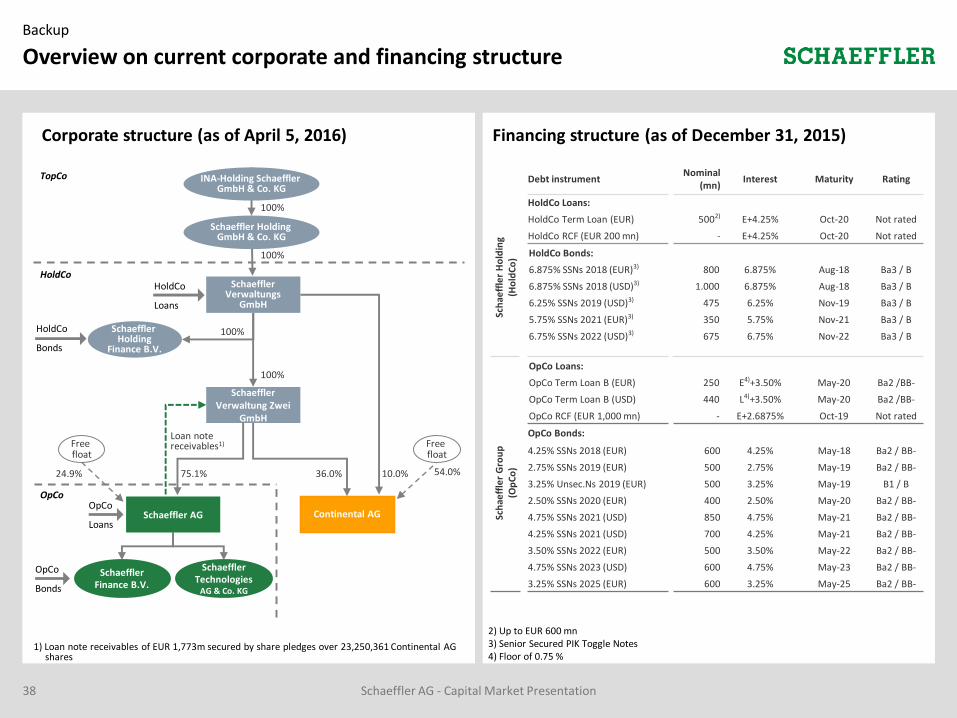
Overview on current corporate and financing structureBackup
38 Schaeffler AG - Capital Market Presentation
54.0%24.9%
Debt instrumentNominal
(mn)Interest Maturity Rating
HoldCo Loans:
Sch
aeff
ler
Ho
ldin
g(H
old
Co
)
HoldCo Term Loan (EUR) 5002) E+4.25% Oct-20 Not rated
HoldCo RCF (EUR 200 mn) - E+4.25% Oct-20 Not rated
HoldCo Bonds:
6.875% SSNs 2018 (EUR)3) 800 6.875% Aug-18 Ba3 / B
6.875% SSNs 2018 (USD)3) 1.000 6.875% Aug-18 Ba3 / B
6.25% SSNs 2019 (USD)3) 475 6.25% Nov-19 Ba3 / B
5.75% SSNs 2021 (EUR)3) 350 5.75% Nov-21 Ba3 / B
6.75% SSNs 2022 (USD)3) 675 6.75% Nov-22 Ba3 / B
OpCo Loans:
Sch
aeff
ler
Gro
up
(Op
Co
)
OpCo Term Loan B (EUR) 250 E4)+3.50% May-20 Ba2 /BB-
OpCo Term Loan B (USD) 440 L4)+3.50% May-20 Ba2 /BB-
OpCo RCF (EUR 1,000 mn) - E+2.6875% Oct-19 Not rated
OpCo Bonds:
4.25% SSNs 2018 (EUR) 600 4.25% May-18 Ba2 / BB-
2.75% SSNs 2019 (EUR) 500 2.75% May-19 Ba2 / BB-
3.25% Unsec.Ns 2019 (EUR) 500 3.25% May-19 B1 / B
2.50% SSNs 2020 (EUR) 400 2.50% May-20 Ba2 / BB-
4.75% SSNs 2021 (USD) 850 4.75% May-21 Ba2 / BB-
4.25% SSNs 2021 (USD) 700 4.25% May-21 Ba2 / BB-
3.50% SSNs 2022 (EUR) 500 3.50% May-22 Ba2 / BB-
4.75% SSNs 2023 (USD) 600 4.75% May-23 Ba2 / BB-
3.25% SSNs 2025 (EUR) 600 3.25% May-25 Ba2 / BB-
Schaeffler Holding
Finance B.V.
100%
Schaeffler Verwaltung Zwei
GmbH
Schaeffler Verwaltungs
GmbH
100%
Continental AGSchaeffler AGOpCo
Loans
Schaeffler Finance B.V.
OpCo
Bonds
Free float
10.0%75.1%
TopCo
HoldCo
OpCo
HoldCo
Bonds
HoldCo
Loans
36.0%
SchaefflerTechnologies
AG & Co. KG
100%
100%
INA-Holding Schaeffler GmbH & Co. KG
Schaeffler Holding GmbH & Co. KG
Loan note receivables1)
2) Up to EUR 600 mn3) Senior Secured PIK Toggle Notes4) Floor of 0.75 %
1) Loan note receivables of EUR 1,773m secured by share pledges over 23,250,361 Continental AGshares
Free float
Corporate structure (as of April 5, 2016) Financing structure (as of December 31, 2015)