Embed Size (px)
Citation preview

Indian Institute of Management, Ahmedabad, India
Scenarios, Modelling and Analysis of Low Carbon Society for India
P.R. ShuklaIndian Institute of ManagementAhmedabad, India
Presented in the‘13th AIM International Workshop’Tsukuba, Japan, February 17-18, 2008

Indian Institute of Management, Ahmedabad, India
Base Scenario

Indian Institute of Management, Ahmedabad, India
Demographic DriversYear: 2000 Pop: 1021 Million
80 60 40 20 0 20 40 60 80
Age
Population (million)
Female Male
15 -
60 y
ears
0
Male Female
18-6
2 Yr
s
80 60 40 20 20 40 60 80Population (Million)
Age
Pop: 1593 MillionYear: 2050
80 60 40 20 0 20 40 60 80
Age
Populat ion (mil l ion)
Female Male
15 -
60 y
ears
Male Female
18-6
2 Yr
s
80 60 40 20 0 20 40 60 80Population (Million)
Age
Population (Million)
358
555
849
1183
14491593
0
400
800
1200
1600
1950 1970 1990 2010 2030 2050
2.22%
2.15%
1.67%
1.02%
0.47%
Growth Rate
Labor Force (Million)
133
210
360
595
795915
0
200
400
600
800
1000
1950 1970 1990 2010 2030 2050
2.30%
2.74%
2.54%
1.46%
0.70%
Growth Rate

Indian Institute of Management, Ahmedabad, India
Drivers of Economic GrowthHuman Capital
⎯ High Labor Supply ⎯ Increasing Education ⎯ Migration (intra & inter county)
R&D⎯ Increasing Government/ Private Expenditure⎯ International Knowledge Flows ⎯ R&D Collaborations
Technology⎯ Infrastructures⎯ Learning, transfers, deployment
Behavioral Changes⎯ High Savings Rate⎯ Changing Lifestyles
Governance⎯ Institutions⎯ Laws⎯ Policies
Savings Rate
20.622.8
24.6
33.035.0
32
0
5
10
15
20
25
30
35
1980 1990 2000 2010 2020 2030
4037??

Indian Institute of Management, Ahmedabad, India
Base Scenario GDP
0
5
10
15
20
25
2005 2020 2035 2050
Bas
e Ye
ar 2
005=
1
Annual Growth Rate 2005-50: 7.3%Annual Growth Rate 2005-32: 8%
GDP
0
2000
4000
6000
8000
10000
12000
2000 2010 2020 2030 2040 2050
US
$/pe
rson
Per Capita Income
Base Case Assumptions: Summary1. GDP
• Ann. Growth Rate: 7.2% from 2005-50• 2050 Economy: 24 times larger than 2005
2. Population • 2000: 1021 Million• 2050: 1593 Million
3. 650 ppmv CO2e Concentration Stabilization (or 550 CO2)4. Radiative Forcing: 4.7 W/m2

Indian Institute of Management, Ahmedabad, India
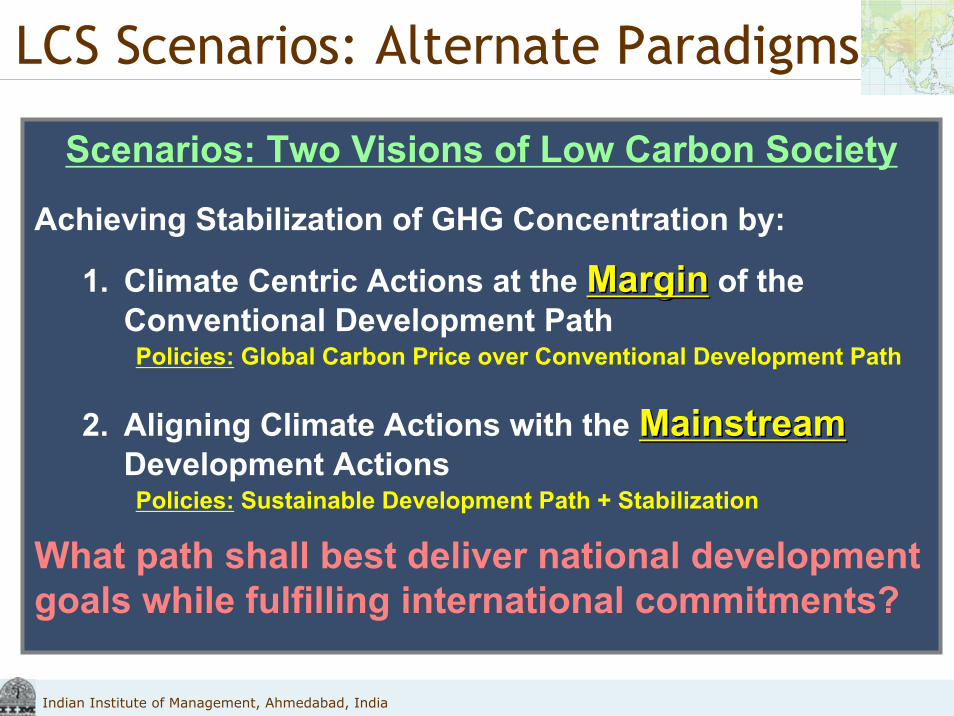
LCS Scenarios: Alternate Paradigms
Scenarios: Two Visions of Low Carbon SocietyAchieving Stabilization of GHG Concentration by:
1.Climate Centric Actions at the MarginMargin of the Conventional Development Path
Policies: Global Carbon Price over Conventional Development Path
2.Aligning Climate Actions with the MainstreamMainstream DevelopmentActions
Policies: Sustainable Development Path + Stabilization
What path shall best deliver national development goals while fulfilling international commitments?

Indian Institute of Management, Ahmedabad, India
Modeling

Indian Institute of Management, Ahmedabad, India
Integrated Modeling Framework
DATABASES-Socio-Economic, Technologies, Energy Resources, Environmental Constraints
AIM CGE Model
ANSWER-MARKALModel
AIM SNAPSHOT ModelEnd
Use
Dem
and
Mod
elA
IM Strategic D
atabase(SD
B)
Integrated Modelling FrameworkDATABASES
-Socio-Economic, Technologies, Energy Resources, Environmental Constraints
AIM CGE Model
ANSWER-MARKALModel
AIM SNAPSHOT ModelEnd
Use
Dem
and
Mod
elA
IM Strategic D
atabase(SD
B)
DATABASES-Socio-Economic, Technologies, Energy Resources, Environmental Constraints
AIM CGE Model
ANSWER-MARKALModel
AIM SNAPSHOT ModelEnd
Use
Dem
and
Mod
elA
IM Strategic D
atabase(SD
B)
Integrated Modelling Framework

Indian Institute of Management, Ahmedabad, India
Base Scenario Analysis

Indian Institute of Management, Ahmedabad, India
Energy and Carbon: Base Case
From 2005-2050:Annual Economic Growth: 7.2%Annual Population Growth: 0.9%
Absolute Growth in 2050 over 2005Economy 23 timesPopulation 1.56 times
0
500
1,000
1,500
2,000
2,500
3,000
3,500
2005 2010 2015 2020 2025 2030 2035 2040 2045 2050
Mto
e
Other RenewablesNuclearHydroGasOilCoalCommercial BiomassNon Com Biomass
Energy
Assumptions
Annual Improvement From 2005-2050:Energy Intensity: 3.14 (%)Carbon Intensity: 3.07 (%)Decarbonization of Energy: -0.07 (%)
Ratios: 2050 over 2005Energy Intensity: 0.249Carbon Intensity: 0.257Decarbonization of Energy: -3.1 (%)
Results: Energy and Carbon Intensity
Carbon Emissions
0
1,000
2,000
3,000
4,000
5,000
6,000
7,000
8,000
2000 2005 2010 2015 2020 2025 2030 2035 2040 2045 2050M
illio
n To
n C
O2
Indian Institute of Management, Ahmedabad, India
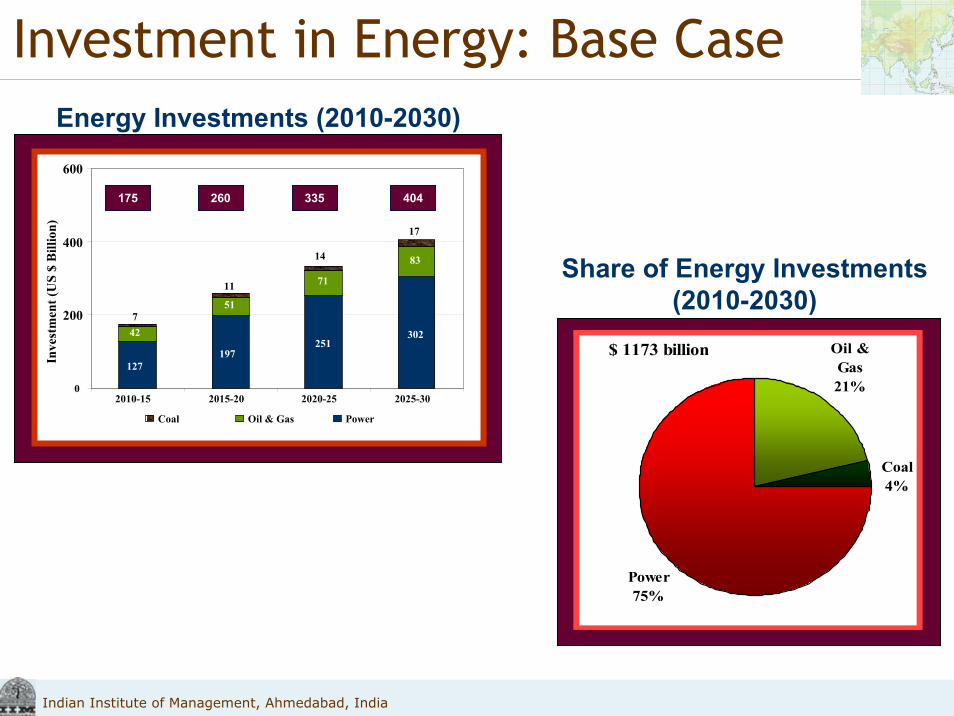
Investment in Energy: Base Case
127197
25130242
51
71
83
17
14
11
7
0
200
400
600
2010-15 2015-20 2020-25 2025-30
Inve
stm
ent (
US
$ B
illio
n)
Coal Oil & Gas Power
175 260 335 404
Energy Investments (2010-2030)
Oil & Gas21%
Power75%
Coal4%
$ 1173 billion Oil & Gas21%
Power75%
Coal4%
$ 1173 billion
Share of Energy Investments (2010-2030)

Indian Institute of Management, Ahmedabad, India
LCS Scenario Analysis
Indian Institute of Management, Ahmedabad, India
LCS Scenarios: Alternate Paradigms
Scenarios: Two Visions of Low Carbon Society
Achieving Stabilization of GHG Concentration by:
1. Climate Centric Actions at the MarginMargin of the Conventional Development PathPolicies: Global Carbon Price over Conventional Development Path
2. Aligning Climate Actions with the MainstreamMainstreamDevelopment ActionsPolicies: Sustainable Development Path + Stabilization
What path shall best deliver national development goals while fulfilling international commitments?

Indian Institute of Management, Ahmedabad, India
Indian LCS Scenario Assumptions• LCS Scenarios assume 550 ppmv CO2e
Concentration (or 470 CO2 Concentration)
• 3.4 W/m2 (or @ 3oC temperature increase)
• Two pathways of LCS produce identical cumulative CO2 emissions from 2005 to 2050
• LCS Vision 1 scenario has same GDP and Population as in Base Case (7.2% from 2005 to 50)
• LCS Vision 2 is a ‘Sustainability’ driven scenario with population & GDP lower than in Base Case (6.9%from 2005 to 50) but include variety of interventions in line with sustainable development paradigm
Indian Institute of Management, Ahmedabad, India
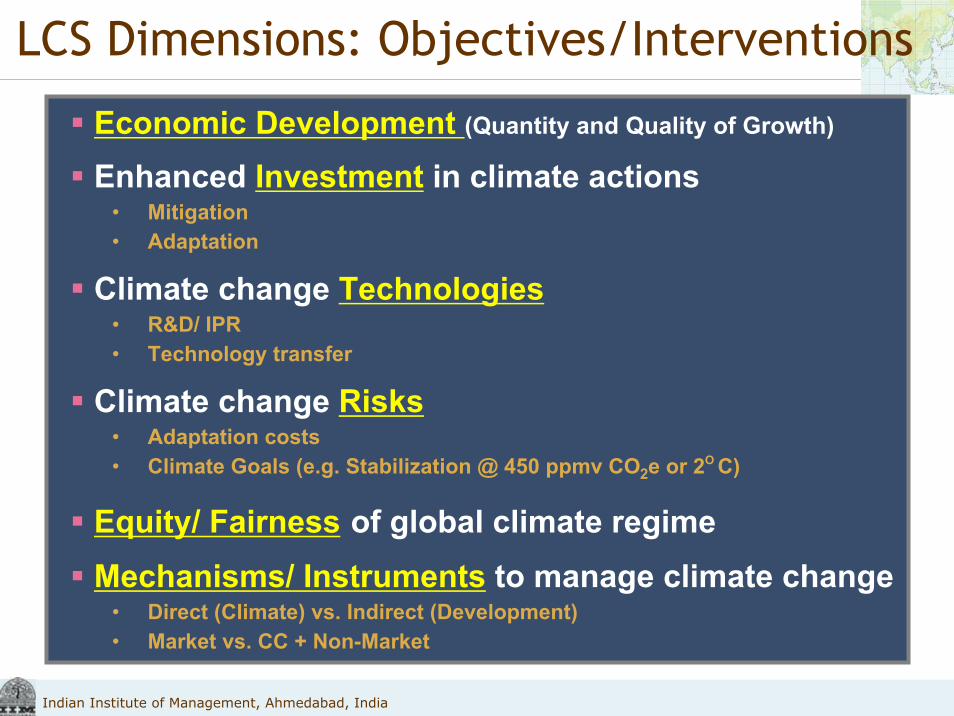
LCS Dimensions: Objectives/Interventions
Economic Development (Quantity and Quality of Growth)
Enhanced Investment in climate actions • Mitigation• Adaptation
Climate change Technologies• R&D/ IPR• Technology transfer
Climate change Risks• Adaptation costs• Climate Goals (e.g. Stabilization @ 450 ppmv CO2e or 2O C)
Equity/ Fairness of global climate regimeMechanisms/ Instruments to manage climate change
• Direct (Climate) vs. Indirect (Development)• Market vs. CC + Non-Market

Indian Institute of Management, Ahmedabad, India
Low Carbon Society Transitions
0
1,000
2,000
3,000
4,000
5,000
6,000
7,000
2000 2010 2020 2030 2040 2050
Mill
ion
Ton
CO
2
OthersDevice Efficiency
Renewable Energy
Electricity (Fuel Switch)
CCS
Carbon Tax 7 22 40 67 100$/tCO2
0
1,000
2,000
3,000
4,000
5,000
6,000
7,000
2000 2005 2010 2015 2020 2025 2030 2035 2040 2045 2050
OthersCCSTransport ModeUrban PlanningConsumptionRecyclingMaterial SubstitutionsAppliance EfficiencyRenewable Energy Building
Electricity (Fuel Switch)
0
1,000
2,000
3,000
4,000
5,000
6,000
7,000
2000 2005 2010 2015 2020 2025 2030 2035 2040 2045 2050
Mill
ion
Ton
CO
2
Renewable Energy Renewable
LCS Vision 1: transition with conventional path and carbon price
• High Carbon Price• Climate Focused Technology Push• Top-down/Supply-side actions
LCS Vision 2: aligning climate actions with sustainable development actions
• Low Carbon Price• Bottom-up/Demand-side actions• Behavioural change• Demand-side technology pull• Diverse Technology portfolio

Indian Institute of Management, Ahmedabad, India
Demand Reduction & Substitution
0
200
400
600
800
1000
Dem
and
(Mill
ion
Ton)
Conventional Development
Sustainable Society
0
200
400
600
800
1000
Dem
and
(Mill
ion
Ton)
Conventional Development
Sustainable Society
Cement
2000 2010 2020 2030 2040 20500
100
200
300
400
500
600
700
2000 2010 2020 2030 2040 2050
Dem
and
(Mill
ion
Ton)
Steel
Conventional Development
Sustainable SocietyD
eman
d (M
illio
n To
n)
0
100
200
300
400
500
600
700
2000 2010 2020 2030 2040 2050
Steel
Conventional Development
Sustainable Society100
200
300
400
500
600
700
2000 2010 2020 2030 2040 2050
Conventional DevelopmentConventional Development
Sustainable Society
0
5
10
15
20
25
30
35
40
Conventional Development
Sustainable Society
0
5
10
15
20
25
30
35
40
Conventional Development
Sustainable Society
0
5
10
15
20
25
30
35
Dem
and
(Mill
ion
Ton)
Conventional Development
Sustainable Society
2000 2010 2020 2030 2040 2050
Paper
Dem
and
(Tril
lion
Lum
en h
rs)
0
1000
2000
3000
Conventional Development
Sustainable Society
Lighting
2000 2010 2020 2030 2040 2050

Indian Institute of Management, Ahmedabad, India
Energy Mix in 2050
200
400
600
800
1,000
1,200
Coal
Oil
Gas
Hydro
Nuclea
r
Biomas
s
Renew
able
Mto
e
Base Case
Conventional Dev. + Tax
Sustainability
Share of Renewable
Base 24 %C+T 34 %Sust. 47 %
Total Energy Demand
Base 3004 MtoeC+T 2945 MtoeSust. 2004 Mtoe
Sustainable LCS would reduce competition & conflicts for energy resources; thus contributing to peaceful transition to prosperous global socio-economic order in the 21st Century

Indian Institute of Management, Ahmedabad, India
Energy and Carbon Intensities
0
10
20
30
40
50
2000 2010 2020 2030 2040 2050
EI (t
oe/M
illio
n IN
R)
0
10
20
30
40
50
CI (
tCO
2/M
illio
n IN
R)
Base CI
CT CILCS CI
Energy Intensities (EI)
Carbon Intensities (CI)

Indian Institute of Management, Ahmedabad, India
Co-benefits of Regional Co-operationCoCo--benefits of Southbenefits of South--AsiaAsia
Integrated EnergyIntegrated Energy--Water MarketWater Market
Benefit (Saving) Cumulative from 2010 to 2030
$ Billion % GDP
Energy 60 Exa Joule 321 0.87
CO2 Equiv. 5.1 Billion Ton 28 0.08
SO2 50 Million Ton 10 0.03
Total 359 0.98
Spill-over Benefits / Co-Benefits
• More Water for Food Production (MDG1)
• 16 GW additional Hydropower (MDG1&7)
• Flood control (MDG1&7)
• Lower energy prices would enhance competitiveness of regional industries (MDG1)
MDG 1: Eradicate extreme poverty and hunger, MDG 7: Environmental Sustainability
¨
!.
!.
!.
!. !.
!.
!.!.!.!.
F
F
Ѻ
ѺѺ
India
China
Iran
Pakistan
Afghanistan
OmanMyanmar (Burma)
Thailand
Nepal
Turkmenistan
Saudi Arabia
Tajikistan
Yemen
Bangladesh
Sri Lanka
Bhutan
Uzbekistan
Somalia
United Arab Emirates
Qatar
Laos
Malaysia
Bahrain
IndonesiaMaldives
Pune
GayaKota
Guna
Gadag
Kochi
Patna
Delhi
Anand
Dadra
SuratOlpad
Kalol
Panvel
Hassan
Dispur
Ambala
Nangal
Kanpur
Jhansi
UjjainJhabua
Valsad
NadiadRajkot
SolapurGuhagarChiptun
Chennai
Nellore
Kolkata
Sangrur
Sonipat
AuraiyaGwalior
Chotila Bharuch
PalmanerChittoor
Kokinada
LudhianaBathinda
Bareilly
Vijaypur
Mahesana
Tutikorin
MangaloreBangalore
Vijaywada
Faridabad
Ratnagiri
Kayankulam
Coimbatore
Jagdishpuri
Shahjahanpur
Vishakhapattnam
Tiruchchirappalli
Herat
MultanQuetta
Khuzdar
Karachi
DelaramKandhar
South-ParsIranshaharBandar-e-Abbas
Yemen
Somalia
Legend Important PlacesExisting Gas Pipelines
Proposed Gas PipelinesExisting LNG terminalsProposed LNG terminalsExisting Gas Basin
Gas Pipelines under construction
Proposed Gas Basin¨

Indian Institute of Management, Ahmedabad, India
CO2 Emissions & Price Trajectories
0
1
2
3
4
5
6
7
2000 2010 2020 2030 2040 2050
Inde
x 20
00 =
1
India Base Case
India Carbon Tax(550 ppmv CO2e)
550 ppmv CO2e
Global Base Case
Base Case assumes global 650 ppmv CO2e stabilization
CO2 Emissions: Global and India
Base Case
Conventional Society
Sustainable Society
0
20
40
60
80
100
120
2010 2020 2030 2040
Pric
e C
O2
(US
$/tC
O2)
2050
CO2 Price
Indian Institute of Management, Ahmedabad, India
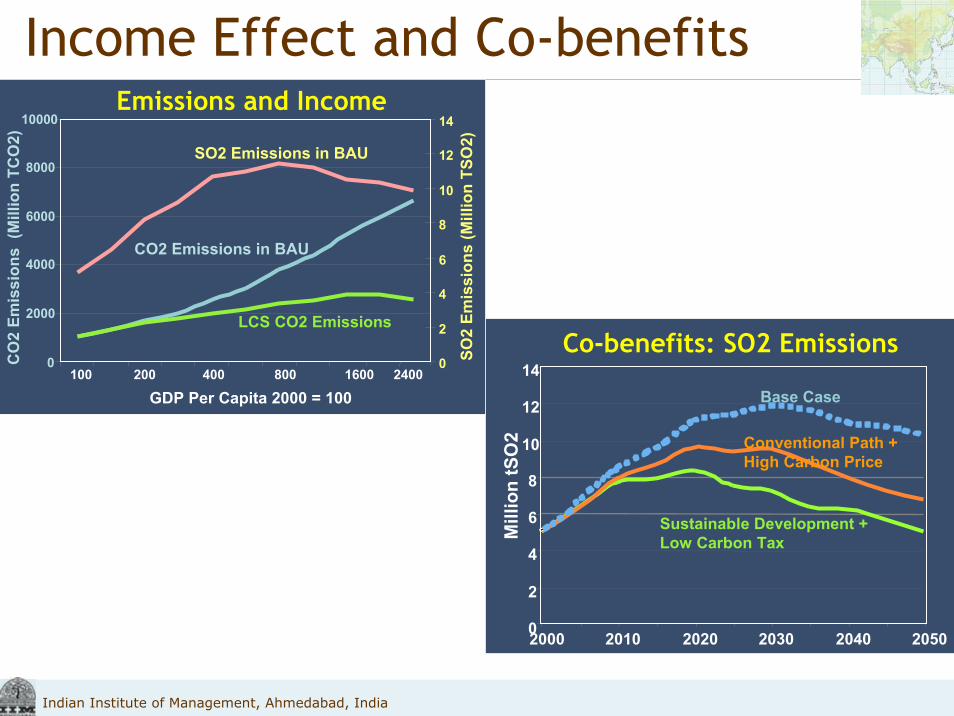
Income Effect and Co-benefits
0
2
4
6
8
10
12
14
2000 2010 2020 2030 2040 2050
Mill
ion
tSO
2
Base Case
Sustainable Development + Low Carbon Tax
Conventional Path + High Carbon Price
Co-benefits: SO2 Emissions0
2000
4000
6000
8000
10000
100 200 400 800 1600 2400
GDP Per Capita 2000 = 100
CO
2 Em
issi
ons
(Mill
ion
TCO
2)
0
2
4
6
8
10
12
14
SO2
Emis
sion
s (M
illio
n TS
O2)
CO2 Emissions in BAU
LCS CO2 Emissions
SO2 Emissions in BAU
Emissions and Income

Indian Institute of Management, Ahmedabad, India
Kaya Analysis of LCS Scenarios
883%
-315%
197%
-715%
50%
678%
-316%
279%
-471%
171%
-800%
-600%
-400%
-200%
0%
200%
400%
600%
800%
1000%
D E/D
C/E
C'/
C
Tota
l
vs20
00's
2050 CT Case 2050 SS Case

Indian Institute of Management, Ahmedabad, India
Sustainable Low Carbon Development
LowCarbonSociety
Innovations
Co-benefits
Sustainability
Technological
Social/Institutional
Management
Modify Preferences
Avoid Lock-ins
Long-term Vision
Win/Win OptionsShared Costs/Risks
Aligning Markets
National Socio-economic
Objectivesand Targets
GlobalClimate Change
Objectivesand Targets
TargetsInterventionsDriversAim
Back-casting

Indian Institute of Management, Ahmedabad, India
Conclusions• Modeling
– Integrated Modeling System with AIM/CGE, MARKAL & SNAPSHOT models
• Scenarios– Climate Change at Margin versus Mainstream
– High Carbon Tax versus Sustainable Development Policies
• Analysis– Kaya Identity Factors
– Technology roadmap to LCS
– Incentives and Infrastructures for Behavioral Changes
– Sustainability policies for altering development pathway
– Climate-centric policies to contribute to cost-effective global stabilization pathway and adaptation

Indian Institute of Management, Ahmedabad, India
Thank you