Embed Size (px)
Citation preview
FEWS NET 1717 H Street NW Washington DC 20006 [email protected]
FEWS NET is a USAID-funded activity. The authors’ views expressed in this publication do not necessarily reflect the view of the United States Agency for International Development or the United States Government.
Scenario Development for Food Security Early Warning Guidance for Famine Early Warning Systems Network (FEWS NET) Staff and Partners Version 2.0 November 2012 This publication was prepared by Chris Hillbruner under the United States Agency for International Development Famine Early Warning Systems Network (FEWS NET) Indefinite Quantity Contract, AID-‐OAA-‐I-‐12-‐00006.
FEWS NET Scenario Development Guidance November 2012
2
Introduction Food security early warning requires the estimation of future food security outcomes many months in advance. However, the complex web of factors shaping food security makes it almost impossible to definitively predict future outcomes. Given that early warning is the primary mandate of the FEWS NET project, how can these two conflicting issues be reconciled? The answer: scenario development. Scenario development relies on the creation of specific, informed assumptions about future events, their effects, and the likely responses of various actors. In combination with an understanding of current conditions and local livelihoods, these assumptions allow for the estimation of future food security outcomes. In addition, a clear description of key assumptions facilitates both the explanation of the food security analysis to colleagues and partners and the process of updating scenarios as new information becomes available. For these reasons, scenario development is a key pillar of FEWS NET’s work. This document provides general guidance on food security scenario development for a range of contexts. Specific guidance on how FEWS NET Representatives should apply scenario building for Food Security Outlooks (e.g., scenario types, scenario duration, etc) will be provided separately. This guidance document is divided into the following sections:
• Section 1 – An overview of the steps of scenario development • Section 2 – Guiding principles • Section 3 – Glossary of key terms

FEWS NET Scenario Development Guidance November 2012
3
SECTION 1: An overview of the steps to scenario development At its core, scenario development is little more than a sophisticated “if-‐then” statement. That is: given current conditions, if the assumptions outlined in steps 3 through 6 are accurate, then it is likely that the outcomes described in 7 and 8 will occur. For the purpose of early warning, however, getting from “if” to “then” involves a multi-‐step process that requires analysis and assumptions at each stage (Figure 1). STEP 1: SET PARAMETERS To begin, step 1 of scenario development involves making four choices. First, you need to determine the geographic scope of the scenario. What area will you build a scenario for: a livelihood zone, a region, or a smaller administrative area? Use these criteria to decide on areas of focus:
ü Choose areas where acute food insecurity is likely to be most severe or where major changes in food security are expected. Due to time and resource limits, it is rarely feasible to develop scenarios for all areas. Therefore, your scenarios should focus on areas where food security outcomes (household food consumption, livelihood change, nutritional status, mortality) are likely to be most severe, or where large changes in food security are expected compared to previous analysis, either deterioration or improvement.
ü Limit the area covered by the scenario; a livelihood zone or a portion of a
livelihood zone is best. For example, in 2011, a FEWS NET scenario in Niger focused on the agropastoral livelihood zone in Tillaberi Department. This area was most affected by a poor 2011 cropping season. Limiting the size of the area is important because scenario building gets more difficult as areas get larger and livelihoods become more diverse. In some cases, your analysis may need to cover an entire country or region. If you need to analyze a large area, break it into smaller pieces, such as livelihoods zones or smaller administrative units, and develop a number of smaller scenarios. Alternatively, you might develop a detailed scenario for one zone and then use the results of this analysis to inform a “lighter” analysis of similar, surrounding areas.
Next, identify which household group the scenario will focus on. FEWS NET typically focuses on the Poor wealth group as these households are most at risk of food insecurity. In addition, the Poor wealth group usually includes at least 20 percent of the area’s population, facilitating IPC-‐compatible mapping. Your analysis can also cover additional wealth groups (e.g., middle income households) or other household
Figure 1. Steps to scenario development
Source: FEWS NET
EXAMPLE: In 2012, FEWS NET Ethiopia developed scenarios for three livelihood zones: the Sorghum, Maize, and Chat livelihood zone in East and West Harrarghe; the Northeast Waya Adega Mixed Cereal livelihood zone (NMC); and the Wolayaita Maize and Root Crop livelihood zone. The team then used these three detailed scenarios as the basis for analyzing and classifying much larger areas of the country.

FEWS NET Scenario Development Guidance November 2012
4
groups (e.g., IDP households), particularly if these groups are likely to face severe acute food insecurity. If you chose multiple household groups, implement each step of scenario development (except for Step 8, Area Classification) separately for each household group analyzed. Third, establish the time period of interest. For example, will the scenario cover a three-‐month period or the entire consumption year? The typical scenario period length for FEWS NET analysis is six months. Finally, you must choose which type of scenario to develop (e.g., a flood scenario, a worst case scenario, a most likely scenario). Note that identifying the “most likely” outcomes is often the most useful for decision-‐makers. A “most-‐likely scenario” is the default option for both FEWS NET and IPC 2.0 analysis. If great uncertainty exists regarding future food insecurity, you might also develop a worst case scenario. In this case, you should develop a probable worst case scenario rather than an absolute worst case scenario. Typically, the likelihood of absolute worst case scenarios is so low that they are not useful for decision-‐making. STEP 2: DESCRIBE AND CLASSIFY CURRENT FOOD SECURITY The purpose of step 2 is to describe and classify current food security. Step 2A: First, summarize current food security conditions. These include, for example: current food prices, progress of the current season, and ongoing humanitarian assistance programs. See the text box on this page for a list of some common food security conditions. The conditions you describe should be relevant for the household group and scenario period of interest. For example, international maize prices should not be described for a region where people eat only locally produced maize. Step 2B: Next, describe current household group food security outcomes. Remember, food security outcomes relate to impacts on households. When describing outcomes, consider the following questions: ü Are households in the area of concern currently meeting basic food needs? Why or why not? ü How are they doing so? Through seasonally typical means, such as crop production or purchases? Or through less
common means, such as food aid or atypical selling of productive assets? ü Is the household group of interest able to afford the expenditures needed to maintain current livelihoods? ü If deficits do exist, which households are most affected (e.g. a specific wealth group or sub-‐population)? ü Are levels of malnutrition and mortality high due to food consumption gaps? And how do they compare to seasonal
norms? ü Is emergency assistance being delivered in the area of focus? To what degree is it reducing food and income
deficits?1
1 Emergency assistance may affect household food consumption, labor opportunities, market supplies, and prices, and/or levels of acute malnutrition. Therefore, it is extremely difficult to remove its impact from an assessment of food security outcomes. For example, simply removing direct food aid distribution from an assessment household food sources does not necessarily provide an accurate picture of current conditions as less direct impacts, such as those on prices and nutrition, have not been accounted for.
Examples of food security conditions
Staple food prices Cash crop prices Livestock prices Wage levels Labor demand Fuel prices Regional/International prices Trade context Terms of trade Remittance flows Market supplies Market functioning Rainfall or snowfall performance Temperature Recent weather shocks (e.g., hail) Crop conditions Recent crop production levels Animal body conditions Milk availability Livestock or crop disease Household asset holdings Security context Political/policy context Current assistance levels
Household Food security outcomes
Food consumption • Diet quantity • Diet quality
Livelihoods change • Ability to maintain current
livelihoods • Coping strategies
FEWS NET Scenario Development Guidance November 2012
5
Your evidence of these outcomes can be directly measured, like a Food Consumption Score, or it can be inferred based on your evidence of current conditions and local livelihoods. STEPS 2C and 2D: Once you have gathered and described conditions and outcomes, use the latest version of the Integrated Food Security Phase Classification protocols to classify the food insecurity of the household group. Then, using available nutrition and mortality data, classify the area covered by the scenario. If you need more background on the IPC, check out www.ipcinfo.org. STEP 3: DEVELOP KEY ASSUMPTIONS Step 3 asks you to develop evidence-‐based assumptions related to future events likely to influence food security during the scenario period. This step has two parts. Step 3A: In the first part of Step 3, you should identify factors relevant to food security that are expected to behave normally during the scenario period. For example, if you anticipate labor migration to be typical or expect expenditure on agricultural inputs to be normal, these are not shocks. Even so, if they are relevant to food security in the scenario focus area, identify them explicitly in this step of the analysis. Step 3B: In the second part of Step 3, you should identify shocks (also known as hazard events) that you expect to occur during the scenario period. Remember to include both positive shocks (e.g., an above-‐average harvest) and negative shocks (e.g, drought or a price spike). Frequently, multiple shocks may occur during a scenario period. For example, a policy decision to stop input subsidies could occur shortly after poor rainfall is forecast and while conflict continues along a key border point. Once you have identified likely shocks, make assumptions about their timing, duration, and severity. To develop these assumptions, make use of sectoral experts, historical data, and your own expert judgment.2 While this may require additional analysis and/or technical support, specificity here makes it easier to accurately identify the impact of these shocks in later steps. Two examples of shock assumptions are presented below.
EXAMPLE: Rather than simply stating that a rainy season will be “poor” or “below-average”, a better assumption would be “Based on the national meteorological agency forecast, and international forecasts the April through June long rains are likely to be 60-‐80 percent of normal in the northeastern pastoral livelihood zone. Rains in this areas are also expected to be erratic, poorly distributed and to end after six weeks instead of three months.”
EXAMPLE: Similarly, an assumption that prices will rise or decline is too simplistic. The May 2012 Malawi Outlook report provides a good example of a well-developed staple food price assumption. It reads: A 33 percent currency devaluation is assumed for Quarter 1 (April to June 2012). Prices will also be influenced by a combination of high transport costs, an ADMARC purchase price that is 40 percent higher than last year (MKW 35/kg Vs MKW 25/kg), and typical seasonal trends. Over the course of the consumption year, retail maize prices in the south are therefore expected to rise roughly 60 percent, peaking at MWK 60/kg –MWK 80/kg during January-March 2013 (Q4).
For both parts of Step 3, information on local livelihoods, including seasonal activity and consumption calendars, should indicate which assumptions need to be developed. For example, if, during the scenario period, poor households in the area of focus access food through 1) milk from their own goats and 2) purchases funded by remittances and agricultural wage labor, then you should develop assumptions related to each of these factors. Depending on the season, your assumptions might relate to:
2 During the current phase (2012-‐2016) FEWS NET plans to develop additional guidance on building assumptions for specific sectors (e.g., rainfall, crop production, livestock herd dynamics, etc)

FEWS NET Scenario Development Guidance November 2012
6
• rainfall performance • pasture/water availability • animal conceptions • remittance flows • wage labor demand • wage levels • food prices
External issues, such as international prices, should also be considered as appropriate. STEP 4: DESCRIBE IMPACTS ON HH INCOME SOURCES Step 4 connects the current context and assumptions made in Step 3 to impacts on household-‐level income sources. This involves six sub-‐steps. Table 1 provides a complete example of Step 4. Step 4A: First, identify the income sources that the chosen household group relies on during the scenario period. These may include, for example, crop sales, wage labor, or remittances. Even when detailed livelihoods information is available, the timing of income sources is often unclear. In that case, use your judgment to assess income sources relevant to the scenario period. Step 4B: Use available livelihoods information and your expert judgment to describe the importance of each source of income. In this step, consider any typical, inter-‐annual assistance programs such as cash-‐based safety nets.
Step 4C: Once you have established typical income sources and their relative importance, describe how income from each source will compare to a normal year. Will income be higher, lower, or the same? In your analysis, consider the current conditions and outcomes in Step 2, the assumptions made in Step 3, and historical information (that is, what happened under similar circumstances in the past). As with other aspects of scenario development, be as specific as possible.
EXAMPLE: In 2011, FEWS NET analysis of poor farmers in Somalia’s Lower Shabelle Riverine livelihood zone assumed that income from maize sales would decline by 66%.
EXAMPLE: In 2011, FEWS NET analysis of poor agropastoralists in Niger’s Ouallam department assumed that net income from hay sales would be 35 percent below 2008/09 levels.
Step 4D: Describe when income from each source will be available during the scenario period. Some income sources may be available for the entire period, other sources may be available for only part of it, and the timing of this income may have changed compared to a normal year. As noted earlier, even when detailed livelihoods information is available, the timing of income sources is often unclear. In this case, use your judgment to assess when the selected income sources are relevant during the scenario period.
EXAMPLE: In Ethiopia’s North East Woynadega Mixed Cereal Livelihood Zone, income between July and December comes from crop sales (~40%), Wage labor (~30%), livestock sales (~20%) and safety-net programs (~5%), with the remainder coming from self-employment and livestock product sales.
EXAMPLE: In Liberia’s Southeast Rice with Cassava Livelihood Zone, where available livelihoods information is less detailed, income between July and December comes from cassava sales (the most important source), rice sales, and on-farm labor.

FEWS NET Scenario Development Guidance November 2012
7
EXAMPLE: In the example from Liberia mentioned above, on-farm labor is an important source of income. However, the seasonal calendar indicates that this income is primarily available during November/December, the last two months of the scenario period.
Step 4E: Explain any changes to the quantity or timing of expected income listed in Step 4C or 4D.
EXAMPLE: In the Lower Shabelle example above, the analyst assumed that income from crop sales would decline 66%. In 4E he/she might then explain that the assumption was based on a recent crop assessment that found production of maize (the major cash crop) had declined by 66%.
EXAMPLE: In the Ouallam example above, the analyst assumed that income from hay sales would be 35% below 2008/09 levels. He/she gave the following explanation: Assuming that hay production in 2011/12 is correlated relatively closely with rainfall, hay production is expected to be 50 percent of the 2008/09 levels. FEWS NET’s interviews with hay middlemen indicate that prices are likely to be approximately 133 percent of 2008/09 levels given reduced production and increased demand. Due to the drop in production, poorer households will sell less hay than in the reference year. And while prices will be higher, they are not expected to be high enough to offset lower sales.
Step 4F: Provide a summary statement about total household income during the scenario period as compared to a normal year.
EXAMPLE: In sum, total household income is expected to be slightly higher than during a normal year.
Table 1. Example of Step 4
A Income sources
B Describe the importance of each income source for the chosen HH group (1B) during the scenario period.3
C Given the assumptions made in Step 3, how will income from each source compare to a normal, non-crisis year? Be as specific as possible.
D When during the scenario period will this income be available?
E If you expect a change from usual in the amount of income earned or the timing of income, why do you think this will occur?
On-farm Wage labor ~50% Decline moderately Throughout the
scenario period
This area has received significant in-flows of refugees in the last 6 months (>20,000
people). These refugees are expected to compete with local populations for on-farm
labor, pushing wages down.
Staple Crop Sales ~25% Increase by 20% October-December
Crop production is expected to be average but farmgate prices are expected to be
higher than usual in part because the government has raised its purchase price to
45 pesos/bag
Wild Food sales <10% No wild food sales this year n/a
Overharvesting of wild foods during last year’s crisis means that these food will be
very scarce this year
Remittances <10% No Change Throughout the scenario period
Remittance information from the national bank indicates average levels this year
F Given your assumptions in Column C, how will total household income during the scenario period compare to normal? Total HH income will be about ¾ of normal
3 If Livelihoods data is available, percentage estimates should be included (e.g. Crop production: 40%). In the absence of this data, income sources should be classified as Significant (>50% of income), Moderate (20-‐50% of income), Minimal (<20 percent of income), or N/A (not applicable).
FEWS NET Scenario Development Guidance November 2012
8
STEP 5: DESCRIBE IMPACTS ON HH FOOD SOURCES Step 5 is very similar in structure to Step 4 but it focuses on food sources. The objective of this step is to link the current context, assumptions made in Step 3, and the outlook for household income from Step 4 to impacts on household-‐level food access. This process involves six sub-‐steps. Table 2 provides a complete example of Step 5. Step 5A: First, identify the food sources that the chosen household group relies on during the scenario period. These may include, for example: own crop/animal production, market purchases using cash or credit, safety net programs, or gifts. Step 5B: Next, use available livelihoods information and your expert judgment to describe the importance of each source of food during the scenario period. This step should include any typical, inter-‐annual assistance programs such as food-‐based safety nets or purchase of government-‐subsidized food.
Step 5C: Once you have established typical food sources and their relative importance, describe how access to food from each source will compare to a normal year. Will access be higher, lower, or the same? Take into account the current conditions and outcomes described in Step 2, the assumptions made in Step 3, the income context described in Step 4, and historical information (for example, what happened under similar circumstances in the past). As with other aspects of scenario development, be as specific as possible.
EXAMPLE: In May 2012, FEWS NET analysis of poor households in Malawi’s Lower Shire livelihood zone assumed that during the 2012/13 consumption year, food from in-kind wage labor would decline by 50% compared to the baseline year.
EXAMPLE: In the Nuba Mountains of Sudan, access to wild food is expected to be better than average.
EXAMPLE: IN the SE marginal cropping areas of Kenya, December/January poor household maize harvests are forecast to be 125% of average.
Step 5D: Describe when food from each source will be available during the scenario period. Some food sources may be available for the entire scenario period; other sources may be available for only part of the scenario period. The timing of food availability may have changed compared to a normal year.
EXAMPLE: In the example from Afghanistan mentioned above, market purchases are most important from April-June while own production is most important from July to September.
EXAMPLE: In the example from Djibouti’s Northwest Pastoral zone mentioned above, goat milk is a source of food, but only during April and September, the first and last months of the scenario period.
Step 5E: Finally, explain any changes to the quantity or timing of expected food access listed above.
EXAMPLE: In the Lower Shire analysis mentioned above, the assumption of a 50% reduction in food from in-kind wage labor was based on preliminary crop production data that indicated significant local crop failure, an expectation that already high maize prices would rise further (eroding in-kind wages), and increased border restrictions that raised the cost of labor migration to surplus-producing farms in Mozambique.
EXAMPLE: In Afghanistan’s East-Central Mountainous Agro-Pastoral livelihood zone, the key sources of food between April and September are market purchases of wheat, rice, and beans (April-June), and own produced wheat (Jul-Sep).
EXAMPLE: In the Northwest Pastoral zone of Djibouti, during the April-September period, poor households access food through market purchase (65%), barter for salt (15%), gifts (10%), and own produced goat milk (5%).
FEWS NET Scenario Development Guidance November 2012
9
TIP: Remember that for Steps 3, 4, and 5 your assumptions about shocks, normal events, and impacts on food and income sources should reflect expectations for the entire household group of interest. For example, if you are discussing poor household millet production, your assumption should reflect average millet production across all poor households in the area, not just the worst affected.
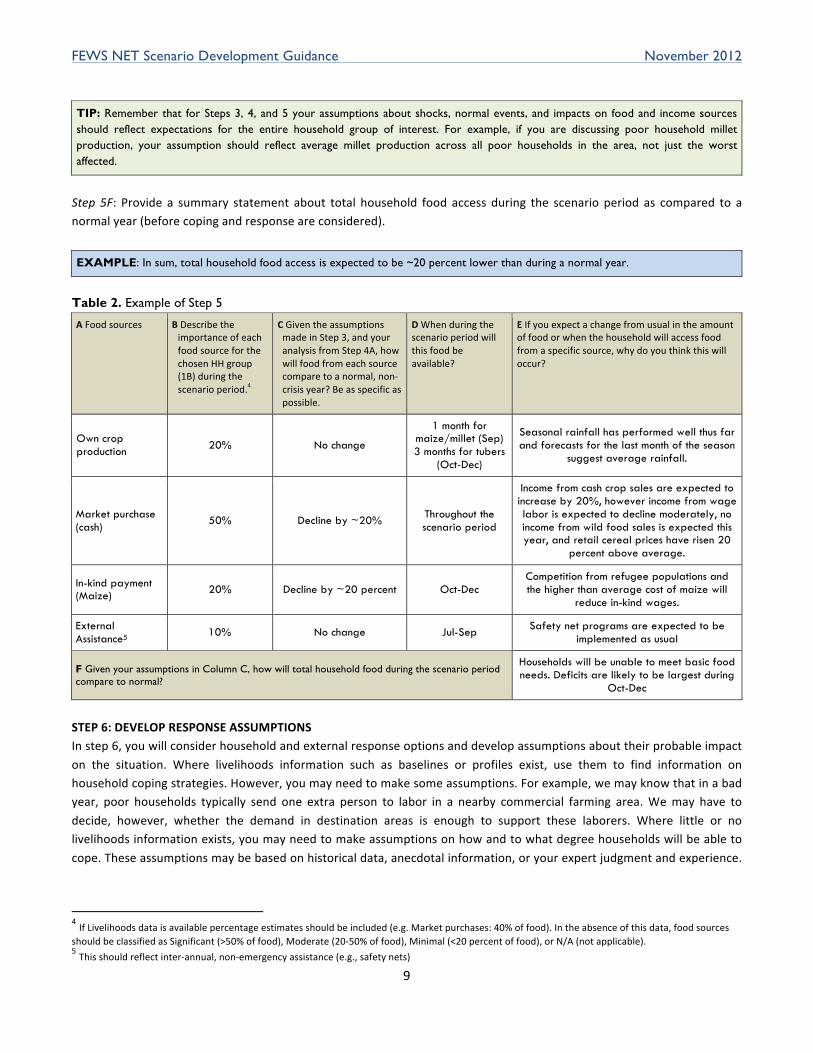
Step 5F: Provide a summary statement about total household food access during the scenario period as compared to a normal year (before coping and response are considered).
EXAMPLE: In sum, total household food access is expected to be ~20 percent lower than during a normal year.
Table 2. Example of Step 5
A Food sources B Describe the importance of each food source for the chosen HH group (1B) during the scenario period.4
C Given the assumptions made in Step 3, and your analysis from Step 4A, how will food from each source compare to a normal, non-‐crisis year? Be as specific as possible.
D When during the scenario period will this food be available?
E If you expect a change from usual in the amount of food or when the household will access food from a specific source, why do you think this will occur?
Own crop production 20% No change
1 month for maize/millet (Sep) 3 months for tubers
(Oct-Dec)
Seasonal rainfall has performed well thus far and forecasts for the last month of the season
suggest average rainfall.
Market purchase (cash) 50% Decline by ~20% Throughout the
scenario period
Income from cash crop sales are expected to increase by 20%, however income from wage labor is expected to decline moderately, no income from wild food sales is expected this year, and retail cereal prices have risen 20
percent above average.
In-kind payment (Maize) 20% Decline by ~20 percent Oct-Dec
Competition from refugee populations and the higher than average cost of maize will
reduce in-kind wages.
External Assistance5 10% No change Jul-Sep Safety net programs are expected to be
implemented as usual
F Given your assumptions in Column C, how will total household food during the scenario period compare to normal?
Households will be unable to meet basic food needs. Deficits are likely to be largest during
Oct-Dec
STEP 6: DEVELOP RESPONSE ASSUMPTIONS In step 6, you will consider household and external response options and develop assumptions about their probable impact on the situation. Where livelihoods information such as baselines or profiles exist, use them to find information on household coping strategies. However, you may need to make some assumptions. For example, we may know that in a bad year, poor households typically send one extra person to labor in a nearby commercial farming area. We may have to decide, however, whether the demand in destination areas is enough to support these laborers. Where little or no livelihoods information exists, you may need to make assumptions on how and to what degree households will be able to cope. These assumptions may be based on historical data, anecdotal information, or your expert judgment and experience.
4 If Livelihoods data is available percentage estimates should be included (e.g. Market purchases: 40% of food). In the absence of this data, food sources should be classified as Significant (>50% of food), Moderate (20-‐50% of food), Minimal (<20 percent of food), or N/A (not applicable). 5 This should reflect inter-‐annual, non-‐emergency assistance (e.g., safety nets)

FEWS NET Scenario Development Guidance November 2012
10
In either case, assumptions about coping should include an assessment of how successfully these coping strategies will lessen any food or income deficits households face.
EXAMPLE: In 2011, poor pastoralists in Ethiopia’s Borena zone faced significant reductions in access to food and income due to a drought and high staple food prices. In one FEWS NET scenario, it was assumed that poor households would cope by selling one additional cow. While selling a cow would have negative impacts on household livelihoods in the longer term, it would double household income in the short term, allowing the household to offset food deficits over the coming six months.
TIP: When developing assumptions related to coping, focus on strategies that, if successful, could offset some food or income deficits. These might include: shifting to cheaper staple food, migrating for labor, moving herds to an atypical grazing area, or selling additional livestock. Step 6 should not include consumption-based coping strategies such as skipping meals, reducing portion sizes, or reducing dietary diversity/quality. These changes to consumption are food security outcomes; they are more appropriately described in Step 7.
In addition to assumptions about household response, make assumptions about the level, timing, and duration of future responses by groups other than the household. These include: community response, trader response, and emergency assistance from local and national governments, the UN, NGOs, and other partners. Emergency response can include, for example: food aid or cash distributions, cash/food-‐for-‐work, water trucking, or nutritional support. This assistance can play an important role in mitigating food insecurity by helping decision-‐makers prioritize scarce resources. Therefore, it is important to highlight areas where assistance is already likely to mitigate future food insecurity so that remaining resources can be put to use elsewhere. When looking ahead, make assumptions about emergency assistance based on your knowledge of current and planned programming. You should include in your response assumptions emergency assistance that is ongoing and likely to continue. You can assume future emergency assistance if this assistance has been planned, funded, and is considered likely. In either case, the assumption should describe the type, location, magnitude, and duration of the assistance, along with any caveats regarding adequacy, targeting, timeliness, and anticipated impact. When you have little clear information on the size, location, and duration of assistance, or where there is considerable uncertainty as to whether assistance will be allocated, leave assistance out of the most-‐likely scenario, but consider including it in Step 9, events that might change the scenario. Remember that assumptions related to inter-‐annual assistance, such as safety nets, should be included in Steps 4 and 5.
EXAMPLE: In South Sudan’s Jonglei State, WFP has prepositioned more than 80 percent of planned food assistance (10,000 MT out of planned 12,500 MT) ahead of the June rains. The delivery of an additional 1,000 MT is anticipated by the end of April and another 2,000 MT during May. Therefore, delivery of humanitarian assistance to most areas of concern is expected to continue during the coming 4 months, though conflict is likely to disrupt deliveries in the southern part of the state.
EXAMPLE: In Chad, the Ministry of Agriculture estimates total food needs at 41,799 MT. In response, a number of humanitarian organizations and the Chadian government, via the ONASA (the National Food Security Agency), have joined forces to implement assistance programs, including distributions of free food aid, subsidized grain marketing programs, food for work activities, and cash transfer programs. The programs target very poor and poor households in Kanem, Batha, and Biltine and are designed to facilitate food access and protect livelihoods. These programs should significantly offset food deficits during the coming three months. However, programming during the latter half of the lean season remains unfunded.
STEP 7: DESCRIBE AND CLASSIFY PROJECTED HOUSEHOLD FOOD SECURITY In step 7, household food insecurity is described and classified. As in Step 2, FEWS NET classifies food security outcomes first by household group, then by area, in keeping with IPC 2.0.
FEWS NET Scenario Development Guidance November 2012
11
Step 7A: Assess the assumptions related to household food and income sources (Steps 4 and 5) and assumptions related to response (Step 6) to project trends in household food security outcomes. There are two primary outcomes of interest in household-‐level analysis. First, how will food consumption compare to a normal year and to survival needs? Second, will households be able to maintain their livelihoods? Remember, in these scenarios, we are interested in: 1) food security outcomes for people and 2) outcomes for the entire scenario period. Where livelihood baseline information exists, you can run HEA outcome analyses to project the level and extent of survival and livelihood-‐protection deficits6. The content of Steps 4, 5, and 6 will inform the HEA problem specification. In countries where baseline data does not exist, you should assess the net impact of the changes in food and income described in Steps 4 and 5 (if any) and the response assumptions made in Step 6. Then, answer the following:
ü Once you have accounted for assumptions about coping and external response, will the household see a net
reduction in food and/or income access? ü If yes, will the impact be significant enough to threaten household livelihood security by: 1) limiting expenditure on
typical non-‐food needs, 2) preventing participation in normal livelihood activities, or 3) requiring unsustainable asset sales?
ü Will it be significant enough that households will not be able to access the food needed for survival? Or will households meet basic food needs, but only through unsustainable coping strategies such as asset stripping?
ü If you anticipate food deficits, how large will these deficits likely be, and how long are they likely to last?
EXAMPLE: Over the next 6 months, food security among the poor wealth group will deteriorate. A reduction in income from July/August wage labor and August/September livestock sales will prevent households from purchasing adequate fodder during the July-December dry season. As a result, they are likely to lose additional small livestock, particularly lambs born in recent months. That will reduce below-normal herd sizes even further. These same income constraints, in combination with the poor sorghum harvest and high cereal prices, also mean that these households will be unable to access basic food needs using typical means. Even once significant coping has occurred – likely in the form of additional livestock sales and increased charcoal production – almost all poor households will face food deficits of up to 20 percent during the peak lean season (October-December), assuming that emergency food assistance programs are not initiated. Atypical migration from these areas towards the regional capital is possible by November.
EXAMPLE: Maize reserves from the 2011 harvests have now been exhausted among the poorest households. Accordingly, purchases will be the predominant source of food through September/October. Since sources of employment are scarce during this period and prices remain seasonally high (especially for grains), both the quality and quantity of the diet will deteriorate over the coming three months. Households will rely on typical livelihood strategies, including sale of firewood and fruits, to meet their minimum caloric needs. The September harvest of primera crops and the subsequent harvesting of postrera crops will allow households to restock their reserves of maize and beans.
EXAMPLE: Household-level responses to this year’s crop shortfalls are likely to vary by location. Poor households in Aweil counties are likely to rely more heavily on wild food, labor, and petty trade, but these strategies are unlikely to fully offset food deficits due to the disruption of traditional trade patterns with Sudan and unusually high grain prices. Poor households in Gogrial and Twic counties are likely to increase reliance on better-off kin and increase movement to fishing areas for more fish, water lily plants and other wild foods. Nonetheless, as in Aweil, asset poor households, returnees, and the IDP population from Abyei will continue to experience significant food consumption gaps. The gaps are likely to remain most critical in Twic County, where the displaced from Abyei (42,000 people) are relying on humanitarian assistance and the host population to meet basic food needs.
Step 7B: Use the projected food consumption and livelihoods outcomes for the household group of interest (Step 7A) to classify food insecurity for the household group. Use the most recent version of the Integrated Food Security Phase
6 For information on survival and livelihoods protection thresholds see The Practitioner’s Guide to HEA, which can be reached via the ‘Livelihoods’ section of the FEWS NET website under ‘Guidance and Tools’: http://v4.fews.net/Pages/livelihoods.aspx?loc=6&l=en
FEWS NET Scenario Development Guidance November 2012
12
Classification protocols, particularly the Acute Food Insecurity Reference Table for Household Group Classification. More information on the IPC can be found at www.ipcinfo.org. Be sure to provide classification for the entire scenario period. STEP 8: DESCRIBE AND CLASSIFY PROJECTED AREA FOOD SECURITY In Step 8, classify the area chosen for the scenario using the most recent version of the Integrated Food Security Phase Classification’s Acute Food Insecurity Reference Table for Area Classification. This step has two parts. Step 8A: Describe the likely evolution of malnutrition and mortality over the scenario period. Consider current levels of malnutrition and mortality, projected changes to food access (Step 7A), and other factors that may affect malnutrition (e.g., local caring practices, seasonal disease patterns, available healthcare) and mortality (e.g., disease, conflict). Although baseline information on malnutrition and mortality is often limited, you should avoid simplistic statements such as “malnutrition and mortality will increase”.
EXAMPLE: Typically, acute malnutrition and child mortality peak between July and September, during the rainy/lean season. In August 2008, a normal year, the GAM prevalence was 11.6 percent according to a SMART survey by Save the Children. No mortality surveys have been conducted in the last five years. This year, food deficits related to extremely high cereal prices are likely to result in levels of acute malnutrition that are higher than 2008. However, it is unlikely that the GAM prevalence would exceed 20 percent. Above-average levels of child mortality are not expected.
Step 8B: Use the projected household classification from Step 7B7 and the projected nutrition and mortality outcomes from Step 8A to classify food insecurity for the scenario area using the most recent version of the Integrated Food Security Phase Classification protocols, particularly the Acute Food Insecurity Reference Table for Area Classification. More information on the IPC can be found at www.ipcinfo.org. Be sure to provide classification for the entire scenario period.
TIP: Classifying an area using the IPC 2.0 uses three types of information: household food security classification, malnutrition data, and mortality data. However, it is important to remember that for IPC 2.0 classification, malnutrition and mortality data are only relevant to the extent that they reflect household food insecurity. Therefore, a GAM prevalence or crude death rate driven primarily by chronic issues (e.g., caring practices, poor health infrastructure) or an acute issue unrelated to household food security (e.g., disease outbreak or conflict) should be considered carefully when classifying acute food insecurity.
STEP 9: EVENTS THAT COULD CHANGE THE SCENARIO In step 9, identify events that might change the scenario outcomes and describe the impact of these alternative assumptions. This step communicates to decision-‐makers the degree of uncertainty in the most-‐likely scenario and the range of possible alternative outcomes. As discussed above, scenario building requires food security analysts to make many assumptions. For some of these assumptions, the individual or group building the scenario may feel very confident. For other assumptions, they may feel less confident. Additionally, certain unlikely events, were they to occur, might have a significant impact on food security outcomes (e.g., a major hurricane in Haiti). Along with the most likely scenario, decision-‐makers need information reflecting this uncertainty and an explanation of why things might turn out differently.8 It is good practice to identify possible events—other than those listed in Steps 7 and 8—that would result in different food security outcomes.
7 This assumes that the chosen household group includes at least 20% percent of the scenario area’s population. If this is not the case, an additional household group, or groups, should be analyzed and classified in order to inform area classification. 8 If you are building multiple scenarios, you will be able to communicate the level of uncertainty around future food security outcomes more clearly. Nonetheless, Step 9 may still be useful. For example, if the primary area of uncertainty is price behavior, you may develop multiple scenarios, each reflecting a different price assumption. However, a table of less likely events may still help highlight other events that, while possible, remain unlikely enough that they do not feature in the constructed scenarios.
FEWS NET Scenario Development Guidance November 2012
13
To accomplish this, review the various assumptions made during the scenario building process. Include both the assumptions about shocks in Step 3 (e.g., how will rainfall perform) as well as assumptions in other steps (e.g., level of income from wage labor or humanitarian assistance). You should consider the following questions:
ü Which 1 or 2 assumptions are most critical to your scenario? ü Which assumptions are you least confident in? ü Are there any events9, not described in your scenario, which would significantly change your projected levels of
food insecurity? For each of your responses to questions 1 and 2, consider how food security outcomes would be different if the assumptions were incorrect. Would your food security projection change significantly (i.e, at least one IPC Phase better or worse)? If so, you should develop an alternative assumption and describe its likely impact on food security. Similarly, if events not described in your scenario would significantly change your projections, they should also be listed, along with a description of how they would change your scenario. Note that these descriptions can be brief. The objective here is to highlight monitoring priorities.
EXAMPLE: Imagine that an analyst is developing a scenario two months before the start of the main rainy season. The analyst has a medium-term precipitation forecast and, based on this information, has assumed that in the most likely situation rainfall totals will be 20 percent better than normal. This assumption has then informed other assumptions about crop production, labor demand, food prices, and, eventually, food security outcomes. However, while this is the best available information, the analyst has limited confidence in these forecasts. Therefore, at the end of the scenario, the analyst should identify an alternative assumption. For example, he/she could assume that rainfall would be average and then describe how average rainfall would change the outcomes presented in the most likely scenario. This way, if the assumption about above-normal rainfall turns out to be incorrect, decision-makers will already have an idea about the ways in which projected food security outcomes might change.
9 This should include events that have a reasonable chance of occurring. For example, if the government has a history of implementing trade restrictions along a particular border point, this may be something to mention. However, extreme events with a very small chance of occurring (e.g., a massive tsunami) should not be listed.
FEWS NET Scenario Development Guidance November 2012
14
SECTION 2: Guiding principles In addition to the nine steps outlined above, consider the following guiding principles when building food security scenarios. A. Align scenario development with the Disaster Risk Reduction Framework It order to maintain consistency, food security scenario development needs to use a common vocabulary. Because famine early warning is essentially a form of disaster risk analysis, it makes sense to adopt a vocabulary consistent with the internationally agreed upon Disaster Risk Reduction (DRR) framework. Disaster risk is typically understood as a function of some hazard and the vulnerability of a population to that hazard (and likewise, their ability to cope). This relationship can be expressed as follows:
RISK = ƒ (Hazard, Vulnerability, Coping Capacity)
The DRR framework, expressed in this way, is powerful because it helps us differentiate between cause and effect. ‘Risk’ is the effect or outcome we are measuring, specifically: the “risk of food insecurity”. Two factors cause this outcome: the external cause, which is the hazard, andthe internal cause, which is a combination of people’s vulnerability to that hazard, and their capacity to cope with it. In food security analysis, a household may be “vulnerable” to a particular hazard, but not necessarily at “risk” of food insecurity. How can that be?
• First, a household’s level of vulnerability to a particular hazard will vary depending on how the household meets its basic needs. That relates to its livelihood system—i.e., the assets or capital (social, natural, physical, financial, productive, and human) available to it. For instance, if a household meets these needs by relying primarily on crop production, then a staple price shock will not necessarily put this household at risk of food insecurity. A drought, on the other hand, may.
• Second, the magnitude of the hazard is important to consider, as variations occur within each year, and from year to year.
• Third, even if a household is vulnerable to a hazard, it may still be able to effectively respond, or cope, by increasing reliance on livelihood strategies not affected by that hazard, or by drawing down on food stocks or savings.
So, the risk of food insecurity depends not only on the household’s vulnerability to a hazard, but also the magnitude of that hazard, and the coping capacity of households in the short-‐ and medium-‐term. B. Use historical data to inform assumptions Making informed assumptions about future shocks, effects, and response will always require an assessment of current conditions and some level of expert judgment. However, historical data should also play an important role in informing the development of these assumptions. This information can include both quantitative data, such as historical price or production data, and qualitative information, such as an understanding of how households have coped with similar conditions in the past. For example, you might use information on typical patterns of acute malnutrition to inform estimates of the likely caseload for feeding centers over the coming six months. Or, analogue years could help to estimate the likely impacts of forecast rainfall on cropping. C. Consider the relevant regional and international context Although food security scenarios are typically developed on a country-‐by-‐country basis, consider regional and international factors in the analysis. Events in a neighboring or even a distant country can raise important questions about how food

FEWS NET Scenario Development Guidance November 2012
15
security conditions and outcomes will develop. It is important to recognize when such events are likely to impact household food security and consider them when developing scenarios. For example, will trade policies in neighboring countries affect food supply and prices in the scenario? Will conflict in a neighboring country affect access to markets, land, or social services? Will above-‐average regional production offset localized production deficits? Will drought in major cereal-‐exporting countries (e.g., Thailand, Australia, and the U.S.A.) affect the price of imported cereals? E. Incorporate seasonality into scenario analysis Just as shocks impact different households in different ways, they will impact households differently at different times during the scenario period. For example, a spike in staple food prices will have more impact if it occurs during a period when food stocks from own production are depleted and households are more reliant on purchases. Crop losses may affect agricultural laborers both during peak labor periods (loss of cash income and in-‐kind payment) as well as following the harvest (losses in own production for sale and consumption). Similarly, options for household response will change depending on the time of year. Households might typically rely on the collection of wild foods during the lean season. But, if the harvest is especially poor and food shortages begin earlier than normal, these foods may not yet be available. As such, scenarios should be sure to include a consideration of seasonality. Discussion of shocks, effects, and response should include information on timing. Scenarios should describe food security outcomes over the course of the scenario period, not just at the end. F. Provide clear descriptions of food security outcomes Food security analysis is ultimately concerned with food security outcomes for people. As such, scenarios must go beyond the prediction of shocks (e.g., crop failure or high food prices) and the description of food security conditions to an analysis of how these shocks will affect households and their food security. Food security outcomes should describe the level of food access and food utilization of households and people in the area of analysis. This includes a description of who is food insecure (e.g., what population or wealth group, size of the food insecure population), the expected duration of this food insecurity, the severity of this food insecurity, and any relevant comment on coping or external response. G. Linking scenario development with HEA outcome analysis In many places, FEWS NET staff and/or partners may wish to conduct Household Economy Approach (HEA) outcome analysis. This approach presents a question: how do scenario development and HEA fit together? In fact, these two approaches align very well, in part because FEWS NET’s scenario development approach was heavily influenced by the conceptual approach pioneered by the HEA. Steps 4-‐6 of scenario development are very similar to the process of developing a problem specification for HEA outcome analysis. Running HEA analysis, through a LIAS or another software program, is essentially an automation of Step 7A. That said, in cases where HEA outcome analysis is feasible, you should complete steps 1-‐6 normally, being sure that the food and income sources considered in Steps 4 and 5 match those listed in the HEA analysis spreadsheet/software. Next, your assumptions in Steps 4-‐6 should be entered into the spreadsheet/software and the analysis run. The outputs of this analysis should then inform your response to Step 7A. You can complete the remaining steps as usual. H. When livelihoods change, adjust analysis Livelihoods information is essential to scenario building. However, livelihoods can change and analysis based on out of date information can be misleading. You should be aware of how livelihoods may be changing and incorporate this evolution, where possible, into scenario analysis. For example, in some areas of the Horn of Africa, poor households who were once pastoralists became poor urban dwellers after losing their livestock to drought. When these livestock losses first occur, it is reasonable to analyze these households and their food security status in the context of a pastoralist livelihood system. Yet once many years have passed, and these households have clearly left the pastoral livelihood, your livelihoods analysis must also shift to reflect the new ways that these households access food and income.
FEWS NET Scenario Development Guidance November 2012
16
SECTION 3 -‐ Glossary of key terms acute food insecurity – food security at a specific moment in time, regardless of causes, context, or duration. Severity is
defined by assessing the degree to which households can meet basic survival needs and maintain their normal livelihoods.
analogue year -‐ a year in history that shares key characteristics with the current year and can therefore help to support
assumptions about how, the current year may progress. In food security analysis, analogue years are most commonly used in relation to climate and seasonal forecasts. Information about current atmospheric and oceanic conditions/patterns is used to identify similar years that may suggest likely precipitation and temperature behavior. Analogue years can also be used to look at other issues, such as market behavior and food prices.
assumptions – for the purpose of scenario building, assumptions are judgments about the anticipated type, magnitude, and
timing of future events or conditions. Assumptions are the product of an analysis of current conditions (e.g., rainfall pattern to date), on past experiences (a reference period, or how a similar series of events unfolded, such as a previous drought), official or unofficial estimates or projections, qualitative or quantitative data, and/or expert judgment. Assumptions can be made at any level of analysis (i.e., household, village, market, district, national, regional, or international). Assumptions form the basis of a scenario and support and reasonably limit its scope.
chronic food insecurity -‐ food insecurity that continues, even in normal, non-‐crisis years when shocks do not occur. coping – contending with difficulties and acting to overcome them. In food security, we typically speak of coping capacity
and coping strategies. Coping capacity refers to the ability of households to diversify and expand access to various sources of food, income, and other basic needs, and thus to cope with a specific stress. Coping strategies are the tactics used by households for this purpose. Coping strategies can be positive, neutral, or negative in terms of their impact on livelihood systems and individual wellbeing. For the purpose of scenario building, we distinguish between coping strategies that, if successful, help to mitigate acute food and income deficits (e.g., the sale of assets) and coping strategies that indicate reduced dietary quantity or quality (e.g., skipping meals). The former should be considered as a part of Step 6. The latter should be considered as a part of Step 7A.
disaggregate – to divide into constituent parts. In scenario building, disaggregation is distinguishing responses, effects,
impacts, and outcomes across different geographic areas, entities (e.g., markets) or population groups (e.g., wealth, income, ethnic, or other socio-‐economic groups). It is important to provide information with the level of disaggregation that decision-‐makers find appropriate given the responses they need to design, implement, or support.
food security conditions – the context with regard to external circumstances and influences related to food security;
variables, causal factors, drivers of food security. Food security conditions are different from food security outcomes. Outcomes refer to the final situation faced by households or areas once all conditions and responses have been analyzed. For example, food security conditions may describe seasonal progress, food prices, and labor demand, while food security outcomes describe whether households are able to access and utilize the food needed for a healthy life.
food security outcomes -‐ The net result of changes in household incomes and food access plus the effect of response by
households, governments, or other actors in terms of food consumption, livelihoods maintenance, nutritional status, and mortality risk. Outcomes can be positive or negative. A description of food security outcomes should explain who is food insecure (e.g. what population or wealth group, size of the food insecure population), the expected duration of food insecurity, the severity of food insecurity, and any relevant comments on response.
hazard – something that poses a potential threat to life, health, property, or the environment. Most hazards are dormant,
with only a potential risk of harm. Once a hazard becomes "active", it is called a shock (or in some cases, a hazard event). For example: a volcano is a hazard; its eruption is a shock. Hazards can be single, sequential, or combined in their origin and effects. They are characterized by their location, intensity, frequency, and probability. Hazard and vulnerability interact together to create risk. Hazards can have different origins: natural (geological, hydro-‐meteorological and biological) and/or induced by human processes (environmental degradation and technological, political, economic, or social threats).
FEWS NET Scenario Development Guidance November 2012
17
normal conditions – the typical or average range of attributes, characteristics, or relationships (e.g., weather, market
behavior, livelihoods, etc). They provide a framework, baseline, or reference period that can then be compared to current and/or projected conditions.
purchasing power -‐ the value of money as measured by the quantity and quality of products and services it can buy. As
prices move upwards, the purchasing power of individuals erodes, unless incomes also increase. response – any action taken before, during, or after a potential change in food security is identified, taken with the
intention to prevent or mitigate food insecurity and/or to avoid loss of life or livelihoods. Response actors include: households, local governments, communities and civil society, the private sector (e.g. traders), non-‐governmental organizations, multilateral organizations, and other regional and international sources.
risk – the probability of harmful consequences or expected losses (of lives, livelihoods, persons injured, property, economic
activity disrupted, or environment damaged) due to a particular hazard for a given area and reference period resulting from interactions between natural or human-‐induced hazards and vulnerable conditions. Risk can be expressed as the product of hazard and vulnerability. It is mitigated by coping capacity: Risk = f (hazard × vulnerability/coping)
scenario – in the context of food security analysis, an informed “if/then” analysis that communicates shocks, their impacts
on household food and income sources, response by both households and other actors, and the net food security outcomes for different households in specific geographic areas. Scenarios are rooted in a series of reasonable assumptions based on existing conditions, historical information, and expert judgment. Scenarios are used to project future food security outcomes and inform decision-‐making processes.
shock – an atypical event or series of events (either rapid or slow-‐onset), which has a significant impact. Shocks can be
positive (e.g. a significantly better than average harvest) or negative (e.g., a failed below-‐average harvest or an unseasonable increase in food prices). A shock differs from a hazard in that it is an event that has occurred or is occurring, while a hazard indicates a potential threat. (Sometimes shocks are also called “hazard events”.)
vulnerability – the conditions determined by physical, social, economic, and environmental factors or processes, which
increase the susceptibility of a community or population group to hazards. Vulnerability is not a general state; people are only vulnerable to a specific hazard. For example: farmers cultivating along a river bank may be vulnerable to floods (which are likely to wash away their crops), but may not be vulnerable to drought (since they can irrigate their crops using water from the river).