Embed Size (px)
Citation preview

A2C2ONR NPS
1
SCENARIO DESIGN FOR THE EMPIRICAL TESTINGOF ORGANIZATIONAL CONGRUENCE
David L. KleinmanGeorgiy M. LevchuckSusan G. HutchinsWilliam G. Kemple
Presented at CCRTSWashington, DC
June 17-19, 2003
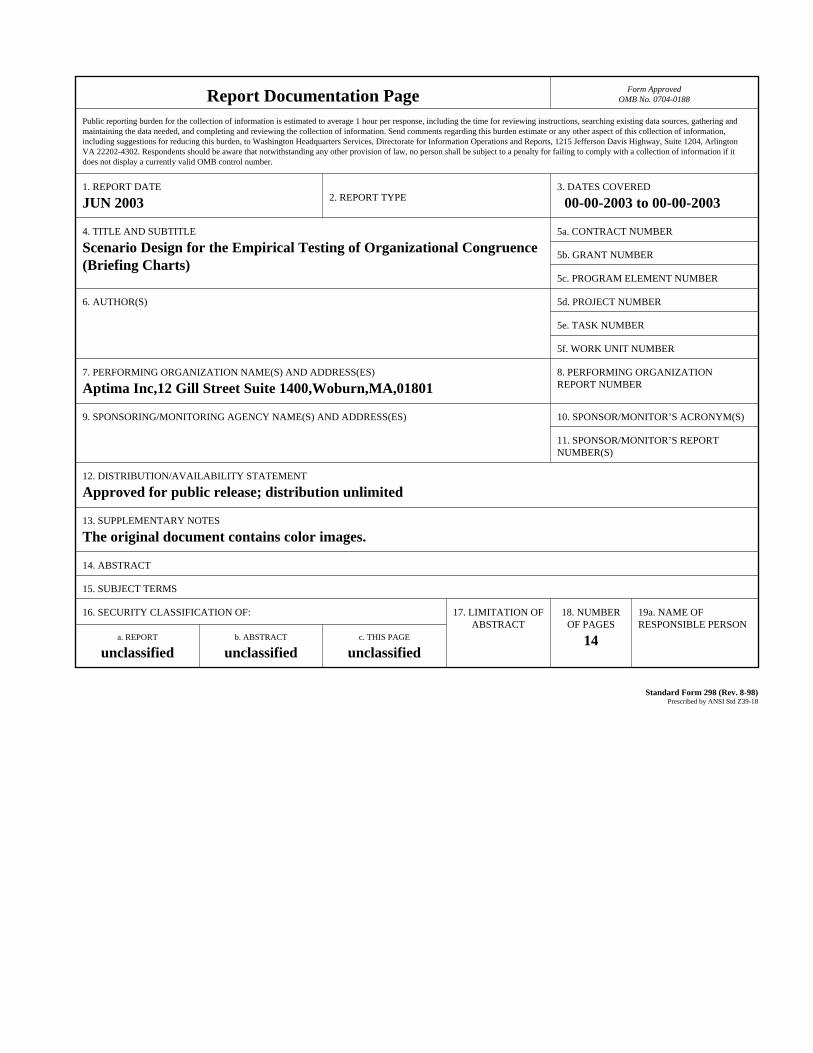
Report Documentation Page Form ApprovedOMB No. 0704-0188
Public reporting burden for the collection of information is estimated to average 1 hour per response, including the time for reviewing instructions, searching existing data sources, gathering andmaintaining the data needed, and completing and reviewing the collection of information. Send comments regarding this burden estimate or any other aspect of this collection of information,including suggestions for reducing this burden, to Washington Headquarters Services, Directorate for Information Operations and Reports, 1215 Jefferson Davis Highway, Suite 1204, ArlingtonVA 22202-4302. Respondents should be aware that notwithstanding any other provision of law, no person shall be subject to a penalty for failing to comply with a collection of information if itdoes not display a currently valid OMB control number.
1. REPORT DATE JUN 2003 2. REPORT TYPE
3. DATES COVERED 00-00-2003 to 00-00-2003
4. TITLE AND SUBTITLE Scenario Design for the Empirical Testing of Organizational Congruence(Briefing Charts)
5a. CONTRACT NUMBER
5b. GRANT NUMBER
5c. PROGRAM ELEMENT NUMBER
6. AUTHOR(S) 5d. PROJECT NUMBER
5e. TASK NUMBER
5f. WORK UNIT NUMBER
7. PERFORMING ORGANIZATION NAME(S) AND ADDRESS(ES) Aptima Inc,12 Gill Street Suite 1400,Woburn,MA,01801
8. PERFORMING ORGANIZATIONREPORT NUMBER
9. SPONSORING/MONITORING AGENCY NAME(S) AND ADDRESS(ES) 10. SPONSOR/MONITOR’S ACRONYM(S)
11. SPONSOR/MONITOR’S REPORT NUMBER(S)
12. DISTRIBUTION/AVAILABILITY STATEMENT Approved for public release; distribution unlimited
13. SUPPLEMENTARY NOTES The original document contains color images.
14. ABSTRACT
15. SUBJECT TERMS
16. SECURITY CLASSIFICATION OF: 17. LIMITATION OF ABSTRACT
18. NUMBEROF PAGES
14
19a. NAME OFRESPONSIBLE PERSON
a. REPORT unclassified
b. ABSTRACT unclassified
c. THIS PAGE unclassified
Standard Form 298 (Rev. 8-98) Prescribed by ANSI Std Z39-18

A2C2ONR NPS
2
OBJECTIVES
• ESTABLISH EXPERIMENTAL CONDITIONS WITHIN WHICH TO DEMONSTRATE THAT CONGRUENCE SIGNIFICANTLY AFFECTS PERFORMANCE OUTCOMES
• HYPOTHESIS ~ “the better an organization is matched to the overall mission,using a multi-variant set of workload and other congruence metrics, the better will that organization perform”
Congruence ⇒ the interaction of organizational structure and mission/scenario(degree of structural fit between an organization and the mission)
• UNDER A2C2, A METHODOLOGY HAS BEEN DEVELOPED TO DESIGN AN ORGANIZATION THAT IS CONGRUENT WITH A SPECIFIED MISSION– who should own what assets, who does what, who sees what, etc.– extensive publications in past CCRTS Proceedings, SMC Transactions, …– limited empirical testing conducted in previous A2C2 experiments
(usually via comparison with an ad-hoc organizational structure on one scenario)
A2C2ONR NPS
3
APPROACH
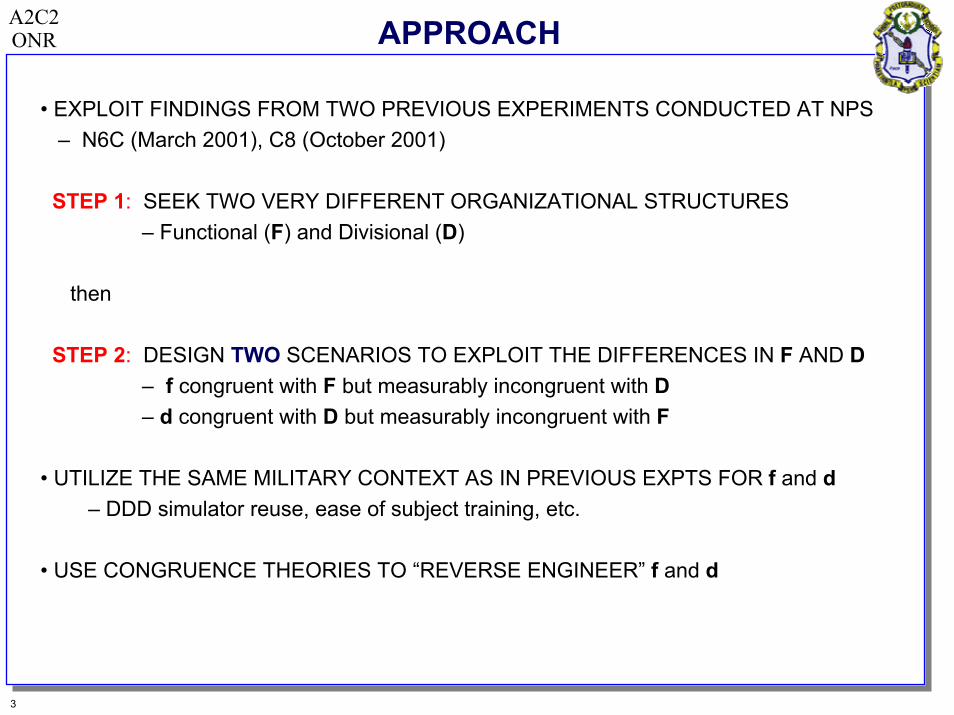
• EXPLOIT FINDINGS FROM TWO PREVIOUS EXPERIMENTS CONDUCTED AT NPS– N6C (March 2001), C8 (October 2001)
STEP 1: SEEK TWO VERY DIFFERENT ORGANIZATIONAL STRUCTURES– Functional (F) and Divisional (D)
then
STEP 2: DESIGN TWO SCENARIOS TO EXPLOIT THE DIFFERENCES IN F AND D– f congruent with F but measurably incongruent with D– d congruent with D but measurably incongruent with F
• UTILIZE THE SAME MILITARY CONTEXT AS IN PREVIOUS EXPTS FOR f and d– DDD simulator reuse, ease of subject training, etc.
• USE CONGRUENCE THEORIES TO “REVERSE ENGINEER” f and d

A2C2ONR NPS
4
EXPERIMENT 8 SCENARIO AOR
• Country A has invaded B- remove A’s forces from B
• Prepare for introduction offollow-on forces
- Clear SAMs North of 325- Clear mines: NBE, PORT- Dominate air and sea
• Respond rapidly to high-priority unanticipated tasksand (combat) S&R
• Protect D and E from A’sSCUD missile attacks
• Defend Task Force assets- vs. enemy air and sea
A course of action (COA)giving a specific sequencefor accomplishing missiontasks has been developed by the CJTF.
0
100
200
300
400
5000 100 200 300 400 500
NBW NBE
ABW ABE
E2C
E2C
U
U
U
U
U
U
A
A
BR
CMD
PORT
COUNTRY A COUNTRY B
COUNTRY C
ISLANDD
ISLANDE
CVN
DDGC CG
FFG
DDGB
AOF
FOB
DDGA
A2C2ONR NPS
5
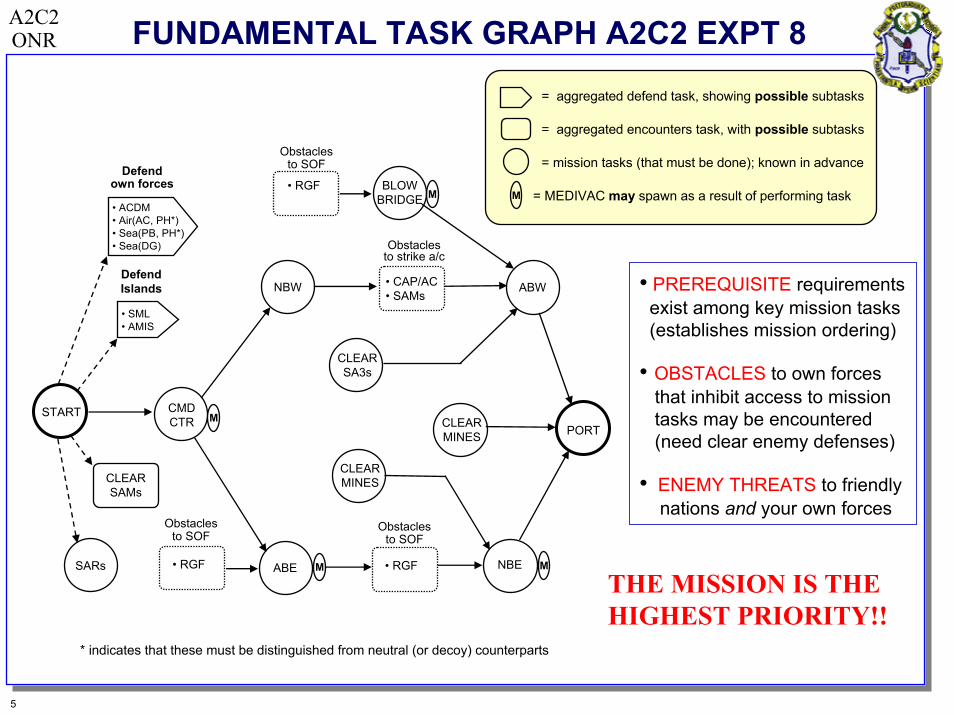
FUNDAMENTAL TASK GRAPH A2C2 EXPT 8
= aggregated defend task, showing possible subtasks
= aggregated encounters task, with possible subtasks
= mission tasks (that must be done); known in advance
= MEDIVAC may spawn as a result of performing task
START MCMDCTR
NBW
Obstaclesto strike a/c
• CAP/AC• SAMs
CLEARSA3s
CLEARMINES
ABW
PORT
• RGF ABE NBE M
Obstaclesto SOF
M
CLEARMINES
• RGF
• RGF BLOWBRIDGE M
Obstaclesto SOF
• ACDM• Air(AC, PH*)• Sea(PB, PH*)• Sea(DG)
DefendIslands
• SML• AMIS
CLEARSAMs
SARs
M
Defendown forces
• PREREQUISITE requirementsexist among key mission tasks(establishes mission ordering)
• OBSTACLES to own forces that inhibit access to missiontasks may be encountered(need clear enemy defenses)
• ENEMY THREATS to friendlynations and your own forces
Obstaclesto SOF
THE MISSION IS THEHIGHEST PRIORITY!!
* indicates that these must be distinguished from neutral (or decoy) counterparts

A2C2ONR NPS
6
TWO ORGANIZATIONAL STRUCTURES: D and F
TEAMS OF SIX PLAYERS EACH: FLAT HIERARCHY, EMPOWERED
• FUNCTIONAL: A DM is a warfare area commander and “owns” all appropriate JTF assets– a single warfare area that is theater-wide
• DIVISIONAL: A DM “owns” a single multi-function capable platform with all its subplatforms– multiple warfare areas in a defined geographical region
Functional
Div
isio
nal
DM 1 2 3 4 5 6Platform STRIKE BMD ISR AWC SuWC/MINES SOF/SAR
1 CVN 2F18S xxx 1UAV 2F18A, E2C 1FAB, 1MH53 1HH602 DDGA 8TLAM 3ABM,4TTOM 1UAV 6SM2 1FAB, 2HARP 1HH60,1SOF3 DDGB 8TLAM 3ABM,4TTOM 1UAV 6SM2 1FAB, 2HARP 1HH60,1SOF4 CG 8TLAM 3ABM 1UAV 6SM2 1FAB,2HARP,1MH53 1HH605 FFG* 2F18S xxx 1UAV 2F18A,E2C,4SM2 1FAB,2HARP,1MH53 1HH606 DDGC 8TLAM 3ABM,4TTOM 1UAV 6SM2 1FAB, 2HARP 1HH60,1SOF
* FFGs fixed wing aircraft are located on an island Air Operation Facility (AOF)SOFs are pre-inserted and located on a Forward Operating Base (FOB)

A2C2ONR NPS
7
DESIGNING A SCENARIO “INCONGRUENT” WITH AN ORGANIZATION
CONGRUENCE MANIPULATION EXPLOITS ROLES and GEOGRAPHY, PLUS TASK REQUIREMENTS, ASSET CAPABILITIES and LOCATIONS
1) INCREASE DM-DM COORDINATION– Introduce tasks that require multi-DM processing– Construct many of these tasks to be time-critical and/or unanticipated,
with a finite time window within which assets must synchronize– Introduce precedence/prerequisite and information-dependence (flow)
structure among tasks allocated to different DMs ⇒ create dependenceof one DM’s processing upon another DM’s success/activities
(e.g., ISR for detection, obstacles to assets, mission task graph, … )
2) CREATE WORKLOAD (TASK LOAD) IMBALANCE AMONG DMS– Introduce temporal overload of tasks that must be done by one DM
3) OTHER MANIPULATIONS– Create a set of tasks where inefficient asset utilization is “costly”
(Provide team with limited assets that must be used efficiently)– Reduce situational awareness within team and among DMs
(Create tasks that cause DMs to adopt “tunnel vision”)– Insert tasks that “boundary-split” regions between adjacent DMs

A2C2ONR NPS
8
MECHANICS OF SCENARIO DESIGN ( 1 and 2)
SCENARIO f: (congruent with organization F; incongruent with organization D)1. INTRODUCE TASKS WITH HIGH RESOURCE REQUIREMENTS OF THE
SAME TYPE (REQUIRE DIVISIONAL DMS TO COORDINATE) – e.g., task requiring multiple units of STRIKE
2. CREATE TEMPORAL OVERLOADS USING TASKS OF DIFFERENT TYPES IN ONE GEOGRAPHICAL AREA (e.g., simultaneous air + sea + S&R tasks) – increase the workload of a selected divisional DM
SCENARIO d: (congruent with organization D; incongruent with organization F)1. INTRODUCE TASKS WITH RESOURCE REQUIREMENTS OF DIFFERENT
TYPES (REQUIRE FUNCTIONAL DMS TO COORDINATE)– e.g., task requiring 1 unit each of SOF, STRIKE and AIR
2. CREATE TEMPORAL OVERLOADS USING TASKS THAT NEED ONERESOURCE TYPE SPREAD OVER A LARGE GEOGRAPHICAL AREA– e.g., an enemy air wave simultaneously targeting several platforms– increase the workload of a selected functional DM
A2C2ONR NPS
9
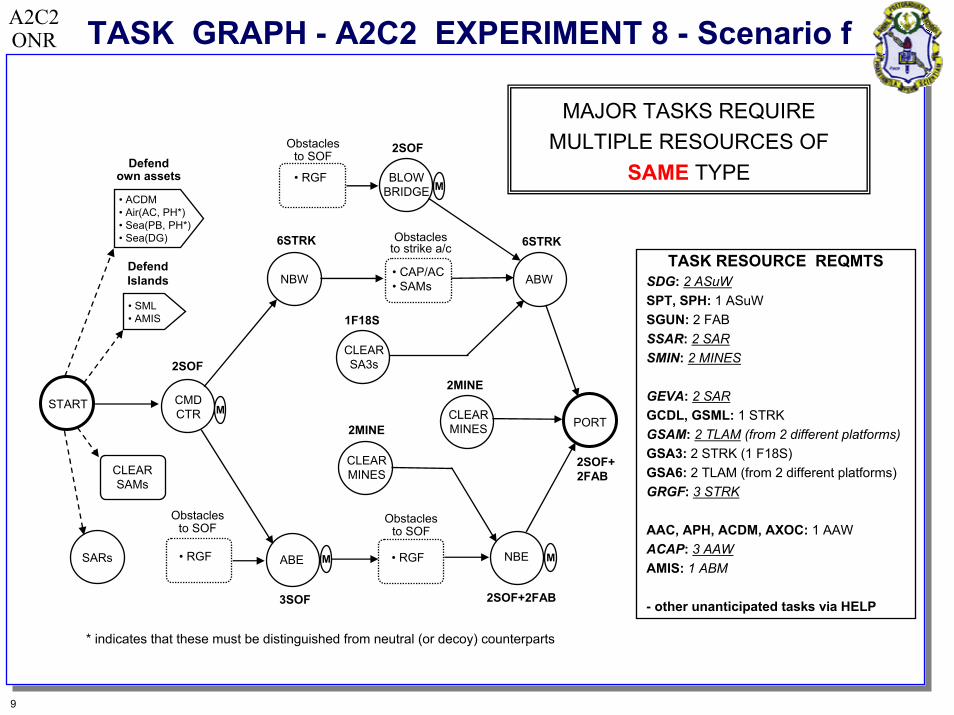
TASK GRAPH - A2C2 EXPERIMENT 8 - Scenario f
START MCMDCTR
NBW
Obstaclesto strike a/c
• CAP/AC• SAMs
CLEARSA3s
CLEARMINES
ABW
PORT
• RGF ABE NBE M
Obstaclesto SOF
M
CLEARMINES
• RGF
2SOF+2FAB
2SOF
6STRK
• RGF BLOWBRIDGE M
Obstaclesto SOF
• ACDM• Air(AC, PH*)• Sea(PB, PH*)• Sea(DG)
DefendIslands
• SML• AMIS
CLEARSAMs
SARs
MAJOR TASKS REQUIRE MULTIPLE RESOURCES OF
SAME TYPE2SOF
Defendown assets
6STRK
TASK RESOURCE REQMTSSDG: 2 ASuWSPT, SPH: 1 ASuWSGUN: 2 FABSSAR: 2 SARSMIN: 2 MINES
GEVA: 2 SARGCDL, GSML: 1 STRKGSAM: 2 TLAM (from 2 different platforms)GSA3: 2 STRK (1 F18S)GSA6: 2 TLAM (from 2 different platforms)GRGF: 3 STRK
AAC, APH, ACDM, AXOC: 1 AAWACAP: 3 AAWAMIS: 1 ABM
- other unanticipated tasks via HELP
1F18S
2MINE
2MINE
Obstaclesto SOF
2SOF+2FAB3SOF
* indicates that these must be distinguished from neutral (or decoy) counterparts
A2C2ONR NPS
10
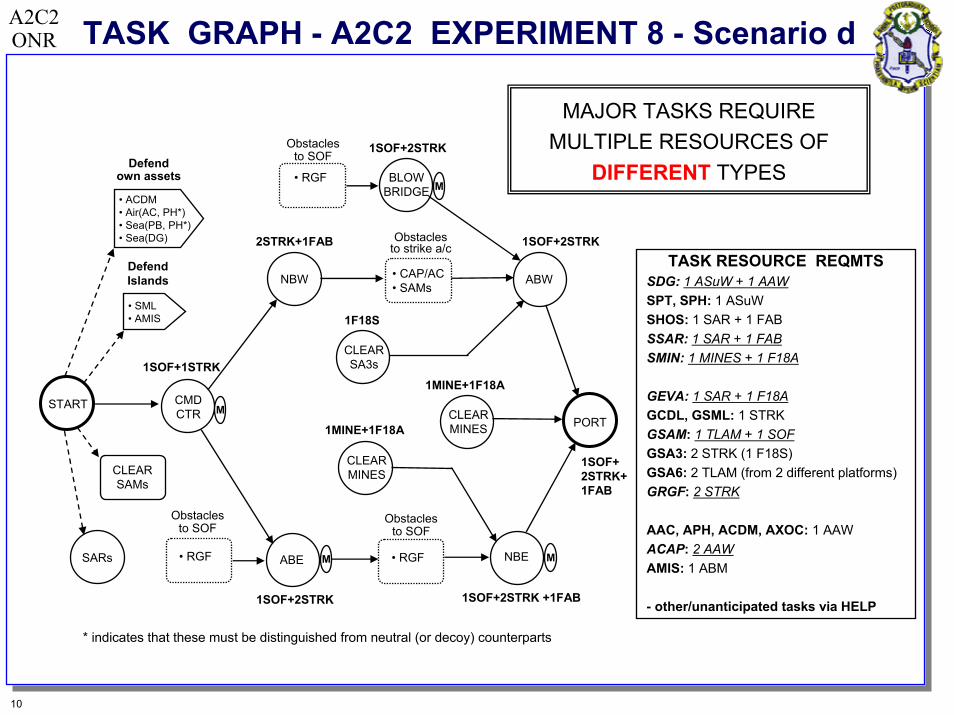
TASK GRAPH - A2C2 EXPERIMENT 8 - Scenario d
START MCMDCTR
NBW
Obstaclesto strike a/c
• CAP/AC• SAMs
CLEARSA3s
CLEARMINES
ABW
PORT
• RGF ABE NBE M
Obstaclesto SOF
M
CLEARMINES
• RGF
1SOF+1STRK
1SOF+2STRK
• RGF BLOWBRIDGE M
Obstaclesto SOF
• ACDM• Air(AC, PH*)• Sea(PB, PH*)• Sea(DG)
DefendIslands
• SML• AMIS
CLEARSAMs
SARs
MAJOR TASKS REQUIRE MULTIPLE RESOURCES OF
DIFFERENT TYPES1SOF+2STRK
Defendown assets
2STRK+1FAB
TASK RESOURCE REQMTSSDG: 1 ASuW + 1 AAWSPT, SPH: 1 ASuWSHOS: 1 SAR + 1 FABSSAR: 1 SAR + 1 FABSMIN: 1 MINES + 1 F18A
GEVA: 1 SAR + 1 F18AGCDL, GSML: 1 STRKGSAM: 1 TLAM + 1 SOFGSA3: 2 STRK (1 F18S)GSA6: 2 TLAM (from 2 different platforms)GRGF: 2 STRK
AAC, APH, ACDM, AXOC: 1 AAWACAP: 2 AAWAMIS: 1 ABM
- other/unanticipated tasks via HELP
1F18S
1MINE+1F18A
1MINE+1F18A
1SOF+2STRK+1FAB
Obstaclesto SOF
1SOF+2STRK +1FAB1SOF+2STRK
* indicates that these must be distinguished from neutral (or decoy) counterparts
A2C2ONR NPS
11
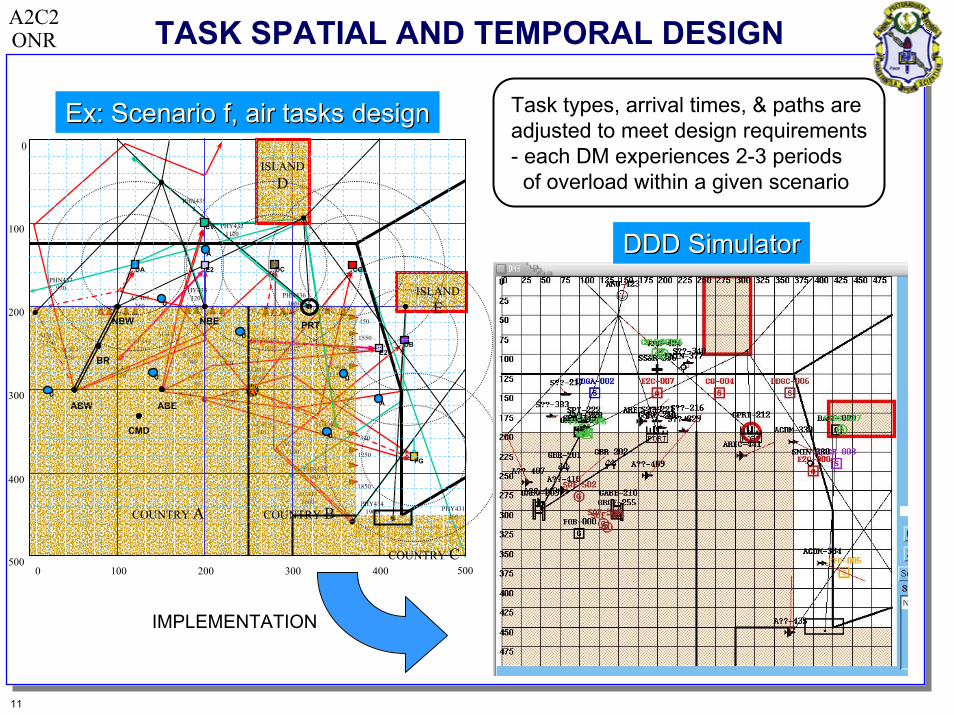
TASK SPATIAL AND TEMPORAL DESIGN
AC4121250
AC4131600
AC41025
AC409750
AC4151100
AC407350
AC405S1830
AC4061251
AC408920
AC41480
AC416S1730
AC417100
AC4181252
AC419910
AC420700
AC4211420
PHY431460
PHN4352
PHN437970
PHY4321120
PHN438880
PHY433320
PHY4341900
PHN43616606505501650 200 50 850
450
1550
1900
310
1250
AC411420
CAP4431220
CAP4441600
1850
1750
0
100
200
300
400
5000 100 200 300 400 500
NBW NBE
ABW ABE
CG
E2
E2DA
CV
U
U
U
U
U
U
A
A
BR
CMD
PRT
DB
DC
FG
COUNTRY A COUNTRY B
COUNTRY C
ISLANDD
ISLANDE
Task types, arrival times, & paths areadjusted to meet design requirements- each DM experiences 2-3 periods
of overload within a given scenario
Ex: Scenario f, air tasks designEx: Scenario f, air tasks design
DDD SimulatorDDD Simulator
IMPLEMENTATION

A2C2ONR NPS
12
MODELING CYCLE FOR EXPERIMENT 8
N6 & C8 scenarios and structuresN6 & C8 scenarios and structures
Create two distinct structures – Divisional and Functional
1. Organizations• F: Minimize overlap of resource
capabilities• D: Maximize overlap of resource
capabilities
NPS• operationalize• practical specifics
operationalDDD
NPS• operationalize• practical specifics
operationalDDD
UCONN• evaluate• analyze• improve
UCONN• evaluate• analyze• improve
Scenario design cycle
theoretical designreq’ts & measures
operational “realism”
2. Scenario - Coordination• f: tasks requiring multiple resources
of same type• d: tasks requiring multiple resources
of different types
3. Scenario - Task load• f: load single geographical area
over multiple functions and time • d: load single functional area over a
wide geographical region and time
need
can
Task load
Create two distinct structures – Divisional and Functional
GMU
Final DDD ScenariosFinal DDD Scenarios

A2C2ONR NPS
13
SOME DATA FROM A POST-EXPERIMENT SURVEYEXPERIMENT 8 WAS CONDUCTED IN AUGUST AND NOVEMBER 2002
• PLAYER RATINGS* OF FACTORS THAT AFFECTED PERFORMANCE
4.43.74.64.1Task Load
4.24.73.65.1“How proactive vs. reactive did you feel you were when playing each scenario?”
3.53.04.54.6Secondary Task Demands
5.43.75.54.3Need for Coordination
dffd“What made playing these scenarios difficult for you?”
F TeamsD Teams
* Note: Ratings used a 7-point scale
• IN WHICH SCENARIO DID YOU FEEL THAT YOUR TEAM PERFORMED “BETTER”?– 96% of Divisional participants reported “better” in congruent (d) scenario– Only 52% of Functional participants reported “better” in congruent (f) scenario

A2C2ONR NPS
14
SUMMARY & CONCLUSION
• MODEL-BASED EXPERIMENTAL AND SCENARIO DESIGN– Integrated scenarios, organizational structures, and congruence metrics– “Reverse engineered” f and d using congruence theories
• SO, DO CONGRUENT ORGANIZATIONS PERFORM BETTER?– Model-based performance and process measures of congruence effects exist– Can associate nature of incongruence with asymmetric performance decrements
e.g., F ⇔ d and D ⇔ f.
• YES! – EXTENSIVE RESULTS ARE FOUND IN COMPANION PAPERSExample: Accrued Task Gain metric (gain = value*processing accuracy)
AREA UNDER CURVE IS A MEASURE OF OVERALL PERFORMANCE
Task completion times
time
Task gain
Accr
ued
gain d f
D
F
45.8 33.6
33.5 42.8
On average the CONGRUENT teams significantly outperformed the NON-congruent teams- better time-accuracy tradeoff- but . . .