Embed Size (px)
Citation preview
SCENARIO AND PERSPECTIVES FOR THE
NATIONAL PHARMACEUTICAL INDUSTRY
2018-2021
INDUSTRIAL CHAMBER OF ARGENTINE PHARMACEUTICAL LABORATORIES
August 2018
2
CILFA'S BOARD OF DIRECTORS 2017-2019
President: Isaías Drajer Elea SACIF y A
Senior Vice President: Eduardo Macchiavello Roemmers S.A.
Deputy Vice President: Carlos Perez Lab. Bagó S.A.
Secretary: Juan A. Craveri Craveri SAIC Deputy Secretary: Luis Rodriguez Gador S.A.
Treasurer: Andrés Ziffer Dr. Lazar y Cía. SAQeI
Deputy Treasurer: Jorge Beluzzo Raffo S.A.
Regular Members: Rodolfo Blüthgen Investi Farma S.A.
Lucila Macchiavello Lab.Temis Lostaló S.A. Rubén Abete Lab. Dallas S.A. Norberto Cassina Casasco S.A. Manuel Giglio Lab. Bernabó S.A. Luis Baliarda Baliarda S.A.
Esteban Echenique Nova Argentia S.A. Mariano Bidner Finadiet S.A. Marcelo Figueiras Lab. Richmond S.A. Edgardo Taraciuk Tuteur S.A.
Alternate Members Pablo Barenboim Lab. Monserrat y Eclair Agustín Gold Elea Phoenix S.A. Micaela Alvarez Saavedra Gador S.A
Mariela Casasco Casasco S.A. Regular Account Controllers: Cesáreo Lachiondo Lab. Beta S.A. Javier Rodriguez Ruiz Lab. Andrómaco S.A. Substitute Account Controller: Santiago García Belmonte Biosidus S.A.
3
ASSOCIATED COMPANIES
Atlas Farmacéutica S.A. Baliarda S.A. Biosidus S.A.
Craveri S.A.I.C. Dr. Lazar y Cía. S.A.Q. e I.
Elea Phoenix S.A. Ferrer Argentina S.A.
Finadiet S.A. Gador S.A.
Gemabiotech S.A. Gerardo Ramón y Cía. S.A.I.C.
Instituto Massone S.A. Ivax Argentina S.A. Investi Farma S.A.
Laboratorios Andrómaco S.A.I.C.I. Laboratorios Bagó S.A.
Laboratorios Bernabó S.A. Laboratorios Beta S.A.
Laboratorios Buxton S.A. Laboratorios Casasco S.A.I.C.
Laboratorios Cetus S.R.L. Laboratorios Dallas S.A. Laboratorio Dosa S.R.L.
Laboratorios Fabra S.R.L. Laboratorio Hemoderivados – UNC –
Laboratorio Internacional Argentino S.A. Laboratorio Jayor S.R.L.
Laboratorios Monserrat y Eclair S.A. Laboratorios Poen S.A.C.I.F.I.
Laboratorios Richet S.A. Laboratorios Richmond S.A.C.I.F. Laboratorios Temis Lostaló S.A.
Nova Argentia S.A. Novocap S.A.
Raymos S.A.I.C. Raffo S.A.
Roemmers S.A.I.C.F. Tuteur S.A.C.I.F.I.A
4
I INTRODUCTION
The local policies of most developed countries consider the pharmaceutical industry a strategic sector. This
responds to facts such as knowledge creation, technology, healthcare, and the production of high value-added
assets, as well as the need to make all therapeutic innovations available to the population in order to improve
national health standards.
The manufacturing and marketing of pharmaceuticals around the world is led by multinational companies
present in most markets. In 2017, the global pharmaceutical market size, measured by the volume of sales of all
companies in the main markets, amounted to USD 1.099 trillion, 3.2 % higher than the previous year. Global sales
increased by 37.1%, rising from USD 801.5 bn. in 20081 Such growth rate implies a 3.6% annual accumulated rate
for the period 2008-2016.
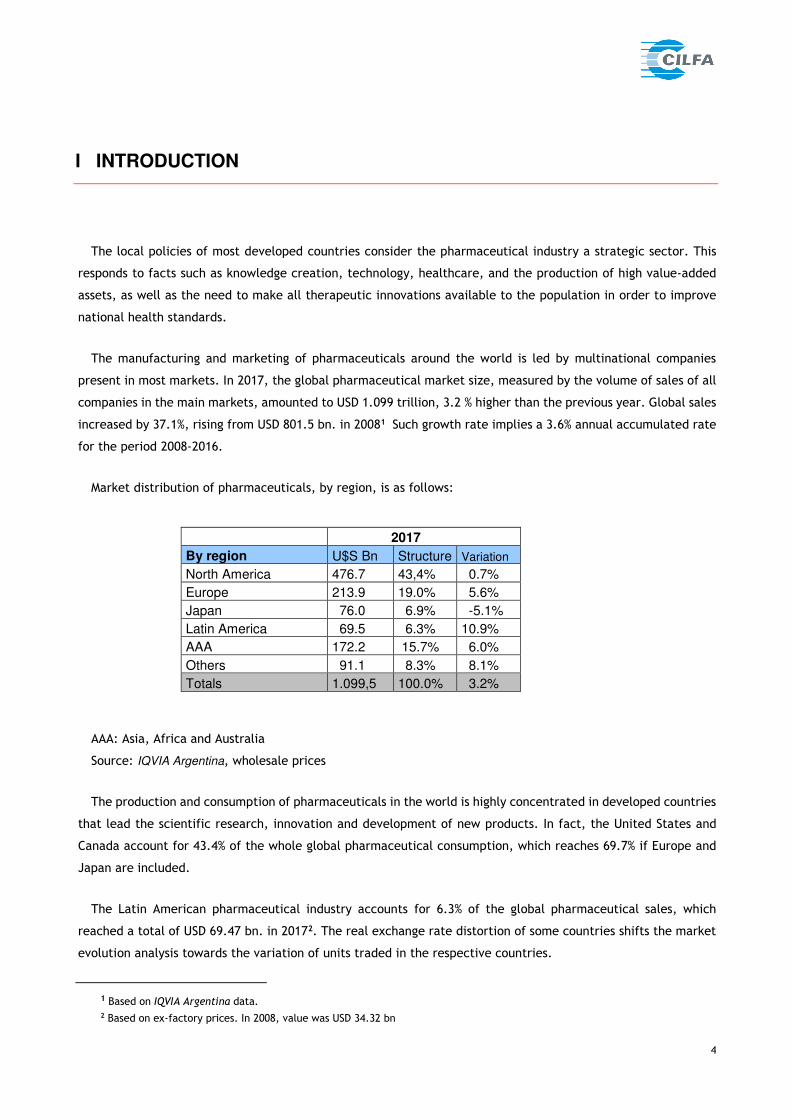
Market distribution of pharmaceuticals, by region, is as follows:
AAA: Asia, Africa and Australia
Source: IQVIA Argentina, wholesale prices
The production and consumption of pharmaceuticals in the world is highly concentrated in developed countries
that lead the scientific research, innovation and development of new products. In fact, the United States and
Canada account for 43.4% of the whole global pharmaceutical consumption, which reaches 69.7% if Europe and
Japan are included.
The Latin American pharmaceutical industry accounts for 6.3% of the global pharmaceutical sales, which
reached a total of USD 69.47 bn. in 20172. The real exchange rate distortion of some countries shifts the market
evolution analysis towards the variation of units traded in the respective countries.
1 Based on IQVIA Argentina data. 2 Based on ex-factory prices. In 2008, value was USD 34.32 bn
2017
By region U$S Bn Structure Variation
North America 476.7 43,4% 0.7%
Europe 213.9 19.0% 5.6%
Japan 76.0 6.9% -5.1%
Latin America 69.5 6.3% 10.9%
AAA 172.2 15.7% 6.0%
Others 91.1 8.3% 8.1%
Totals 1.099,5 100.0% 3.2%
5
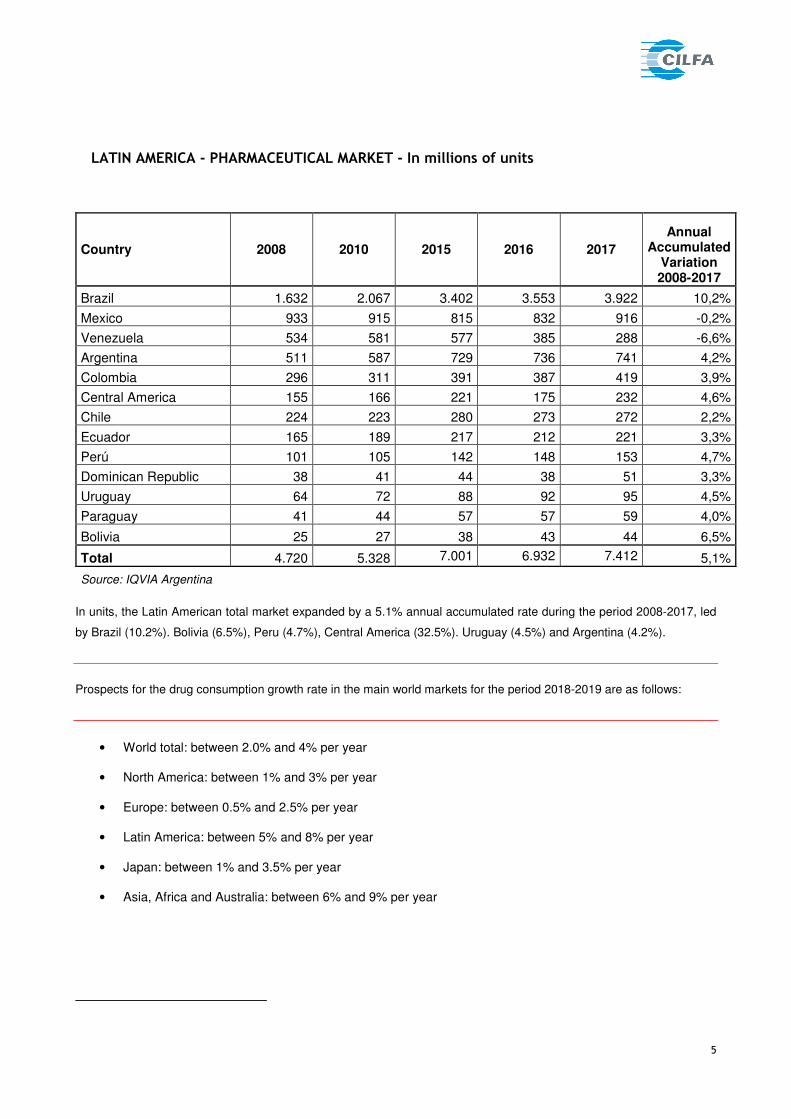
LATIN AMERICA - PHARMACEUTICAL MARKET - In millions of units
Country 2008 2010 2015 2016 2017
Annual Accumulated
Variation 2008-2017
Brazil 1.632 2.067 3.402 3.553 3.922 10,2%
Mexico 933 915 815 832 916 -0,2%
Venezuela 534 581 577 385 288 -6,6%
Argentina 511 587 729 736 741 4,2%
Colombia 296 311 391 387 419 3,9%
Central America 155 166 221 175 232 4,6%
Chile 224 223 280 273 272 2,2%
Ecuador 165 189 217 212 221 3,3%
Perú 101 105 142 148 153 4,7%
Dominican Republic 38 41 44 38 51 3,3%
Uruguay 64 72 88 92 95 4,5%
Paraguay 41 44 57 57 59 4,0%
Bolivia 25 27 38 43 44 6,5%
Total 4.720 5.328 7.001 6.932 7.412 5,1%
Source: IQVIA Argentina In units, the Latin American total market expanded by a 5.1% annual accumulated rate during the period 2008-2017, led
by Brazil (10.2%). Bolivia (6.5%), Peru (4.7%), Central America (32.5%). Uruguay (4.5%) and Argentina (4.2%).
Prospects for the drug consumption growth rate in the main world markets for the period 2018-2019 are as follows:
• World total: between 2.0% and 4% per year
• North America: between 1% and 3% per year
• Europe: between 0.5% and 2.5% per year
• Latin America: between 5% and 8% per year
• Japan: between 1% and 3.5% per year
• Asia, Africa and Australia: between 6% and 9% per year
6
II. THE PHARMACEUTICAL INDUSTRY IN ARGENTINA
II.1. Added value, sales and employment level
Argentina’s national pharmaceutical industry (NFI) is highly competitive and technologically modern, which meets
the strategic goal of ensuring an adequate supply of medicines at affordable prices, manufactured according to international
standards. Within this context, Argentina is –altogether with countries such as US, Japan, Germany and Switzerland- one
of the few countries in the world where the locally-owned laboratories’ presence and share in the domestic market are
higher than the multinational laboratories.
Also, the pharmaceutical industry in Argentina is the third industrial sector in terms of the industrial added-value
that it generates, only behind the oil refinery and the iron and steel sectors. In addition to this fact -not widely known-, it
should be noted that this industry also has the highest research and development levels by sector, which generates high
quality and professional job positions; it also plays a key role in the local health system since, by providing significant
discounts, it facilitates access to medications to social security beneficiaries.
The national accounts show that the added value of the pharmaceutical sector accounts for 4.9% of the total
added value of the industry, while the share of the pharmaceutical sector in the gross production value of the whole
Argentine industry is 3.3%, according to the latest economic census data3.
These characteristics, together with the key role the industry plays in keeping its competitiveness level in the
domestic market and defending the country position in the world in terms of intellectual property, render it a strategic
industry from the standpoint of national interests.
In the year 2017, the Argentine pharmaceutical industry sales in the domestic market amounted to USD 177.7
bn, at consumer prices4, and 101.28 bn Argentine pesos at ex-factory prices, which accounted for a 27.4 % increase as
compared to the previous year. Sales in dollar currency for last year reached 6.1 bn, which accounts for a 14.8% increase
as compared to 2016. Unit sales amounted to 741 millions for the year, representing a 0.6% increase as compared to the
year 2016.
3 INDEC, 2003. 4 Source: QuintilesIMS. Does not include sales to institutions, hospitals, public bids or "Plan Remediar" (a free
medicine program).
7
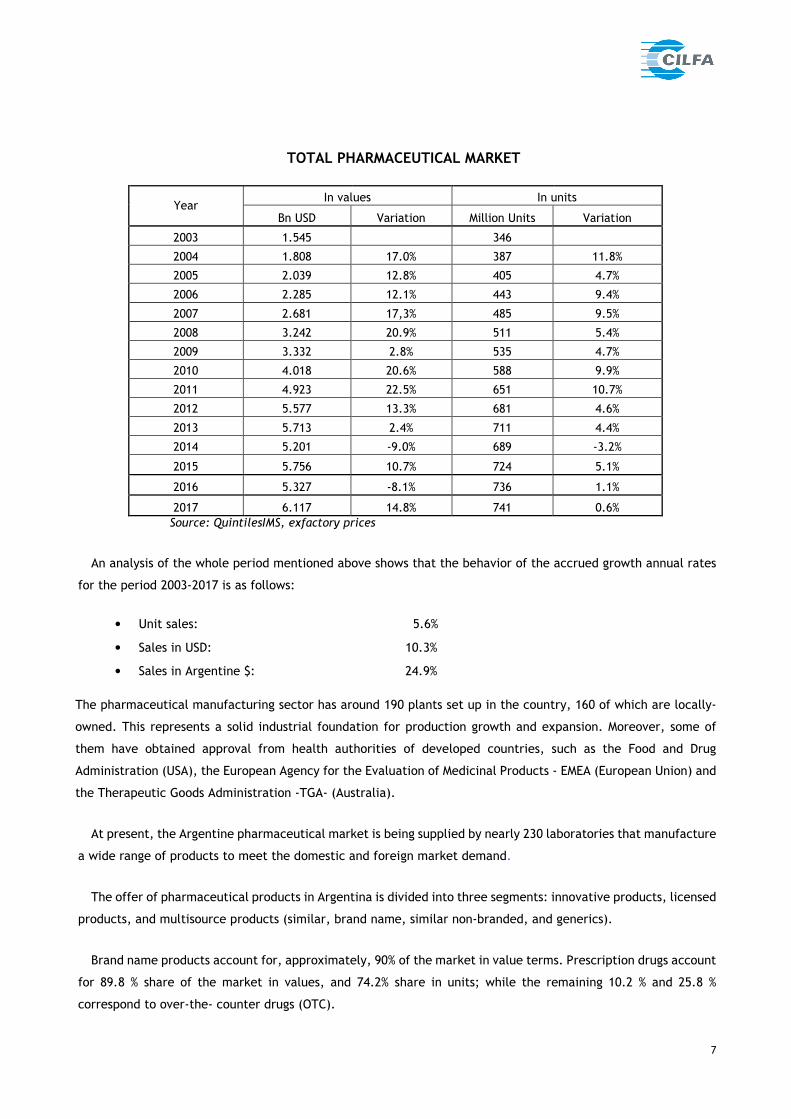
TOTAL PHARMACEUTICAL MARKET
Source: QuintilesIMS, exfactory prices
An analysis of the whole period mentioned above shows that the behavior of the accrued growth annual rates
for the period 2003-2017 is as follows:
• Unit sales: 5.6%
• Sales in USD: 10.3%
• Sales in Argentine $: 24.9%
The pharmaceutical manufacturing sector has around 190 plants set up in the country, 160 of which are locally-
owned. This represents a solid industrial foundation for production growth and expansion. Moreover, some of
them have obtained approval from health authorities of developed countries, such as the Food and Drug
Administration (USA), the European Agency for the Evaluation of Medicinal Products - EMEA (European Union) and
the Therapeutic Goods Administration -TGA- (Australia).
At present, the Argentine pharmaceutical market is being supplied by nearly 230 laboratories that manufacture
a wide range of products to meet the domestic and foreign market demand.
The offer of pharmaceutical products in Argentina is divided into three segments: innovative products, licensed
products, and multisource products (similar, brand name, similar non-branded, and generics).
Brand name products account for, approximately, 90% of the market in value terms. Prescription drugs account
for 89.8 % share of the market in values, and 74.2% share in units; while the remaining 10.2 % and 25.8 %
correspond to over-the- counter drugs (OTC).
Year In values In units
Bn USD Variation Million Units Variation
2003 1.545 346
2004 1.808 17.0% 387 11.8%
2005 2.039 12.8% 405 4.7%
2006 2.285 12.1% 443 9.4%
2007 2.681 17,3% 485 9.5%
2008 3.242 20.9% 511 5.4%
2009 3.332 2.8% 535 4.7%
2010 4.018 20.6% 588 9.9%
2011 4.923 22.5% 651 10.7%
2012 5.577 13.3% 681 4.6%
2013 5.713 2.4% 711 4.4%
2014 5.201 -9.0% 689 -3.2%
2015 5.756 10.7% 724 5.1%
2016 5.327 -8.1% 736 1.1%
2017 6.117 14.8% 741 0.6%
8
Around 2,000 active ingredients and their combinations are used as critical supplies in drug manufacturing,
and are imported in most cases. The 20 most demanded active ingredients in Argentina account for nearly 30 %
of units sold to the domestic market.
The current direct and indirect labor force amounts to 43,000 and 120,000 employees, respectively. The rate
of technicians and university graduates in different professions is relatively higher compared to other sectors,
which urges the local industry to consider the implementation of corporate policies that promote the repatriation
of Argentine scientists. This procedure, applied several times in the past, would enable the availability of highly
skilled and experienced human resources that emigrated from the country and gained experience in the
developed world.
The economy globalization was accompanied by a process of concentration of industrial plants and, as a result,
many of them closed down. Latin America and Argentina, as part of the area, have not been excluded from that
process, during which many foreign companies ceased their local manufacturing activities and concentrated their
production in few and specific countries in Latin America. In the case of Argentina, these industrial plants were
taken over by local companies, which kept the original production and employment sources.
The industry growth during the last years is evidenced by an increase of the installed capacity utilization, plant
expansions and the construction of new industrial facilities that incorporate state of the art technology,
machinery and production plants, in order to supply the local demand and remain competitive to penetrate new
markets overseas.
Regarding the structure of the drug domestic consumption, in terms of their local manufacturing and imports,
71.5 % is currently being supplied by locally-manufactured drugs, and the remaining 28.5 % by imported drugs.
However, an analysis of the historical evolution of such share shows that imports were significantly lower in the
90's. In fact, they accounted for only 6.9% of the total sales in 1994 while, in the year 2000, it had grown by 19.3
%. Therefore, the share of imported medicines in the Argentine market has grown four times in the last 20 years.
Should this trend continue, a significant amount of the positive results that this sector generates for the rest of
the economy will improve, since the economic contribution provided by the local production is much higher than
that of imports in terms of employment, tax collections, currency and technological progress.
In fact, it is to be noted that the access to medicines for the population would increase if a higher share of the
domestic market were supplied by local production, since the price of imported drugs is growing, in particular,
due to the imports of innovative biotechnological medicines (monoclonal antibodies), recently introduced in the
market, which treat critical and special pathologies. Therefore, it appears to be important for the public health
policy to encourage the local manufacturing of medicines, thus reducing the cost of treatments, while improving
their access.
9
Argentina’s pharmaceutical market evidences some differences as compared to the characteristics observed
internationally, in particular, in Latin America, due to the higher presence of locally- owned companies. In fact, in
Argentina, the pharmaceutical laboratories owned by local entrepreneurs account for 66.4 % of the units sold in the
market and 66.1 % of the sector turnover. Foreign companies commercialize 33.6 % of the units sold and 33.9 % of
sales in values. Typically, these companies are branches of multinational corporations, mostly North American,
German or Swiss.
II.2. Pharmaceutical foreign trade
II.2.1. Trade balance
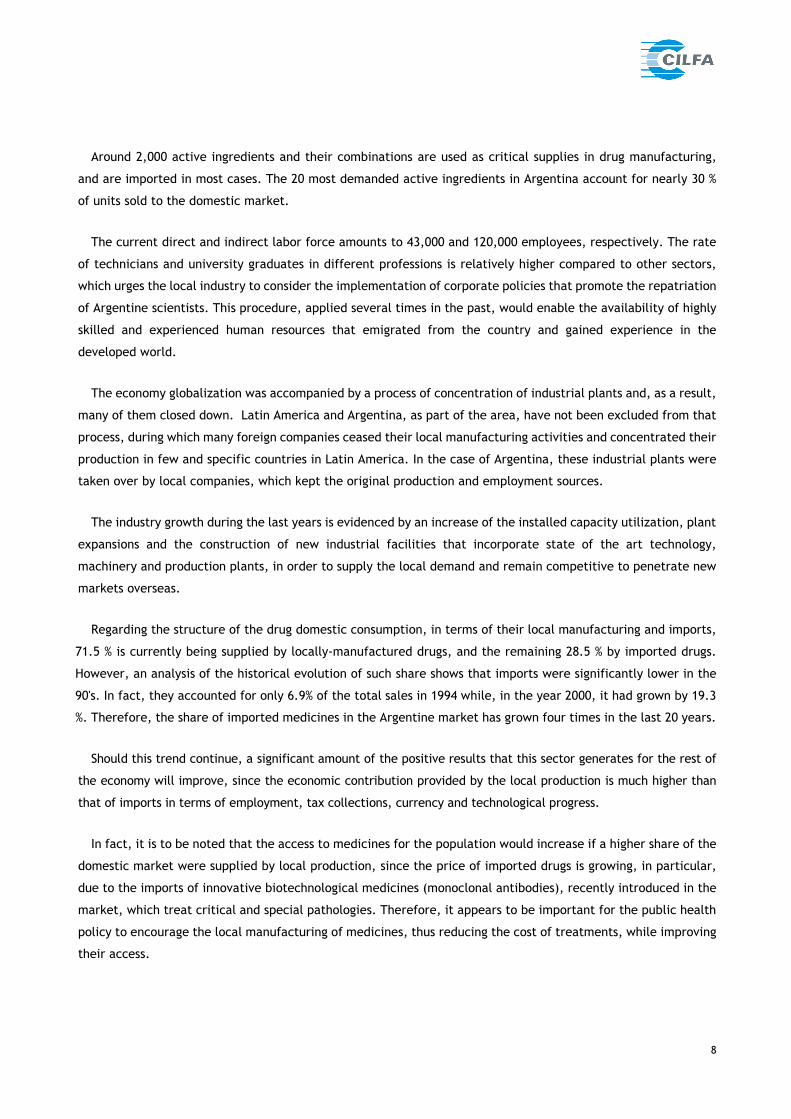
In 2017, pharmaceutical exports amounted to USD 744.2 million, a 18.0% decline as compared to 2016.
However, the exports rate in 2017 was 180% higher than the 2003 value, an accrued annual rate of 7.6%.
In terms of imports, they accounted for USD 2.38 bn in 2017, a 10.4% increase as compared to the previous
year. This value is 401% higher than in 2003, evidencing an accrued annual rate of 12.2%.
ARGENTINA: EXPORTS AND IMPORTS OF PHARMACEUTICALS
Año EXPORTS IMPORTS
Million U$S Variation Million U$S Variation
2003 266.4 475.3
2004 344.8 29.4% 545.1 14.77%
2005 351.4 1.9% 624.6 14.6%
2006 436.3 24.2% 763.1 22.2%
2007 512.7 17.5% 939.2 23.1%
2008 6277 22.4% 1.14 bn 21.5%
2009 6595 5.1% 1.21 bn 5.8%
2010 6932 5.1% 1.56 bn 29.6%
2011 8102 16.9% 1.79 bn 14.4%
2012 9030 11.5% 2.08 bn 16.6%
2013 9123 1.0% 2.13 bn 2.4%
2014 8513 -6.7% 2.14 bn 0.5%
2015 1.048 bn 23.2% 2.40 bn 12.0%
2016 907.9 -13.4% 2.15 bn -10.4%
2017 744.2 -18,0% 2.38 bn 10.4%
(*) Chapter 30 of the "Pharmaceutical Products" NMC
Source: ABECEB based on INDEC data
10
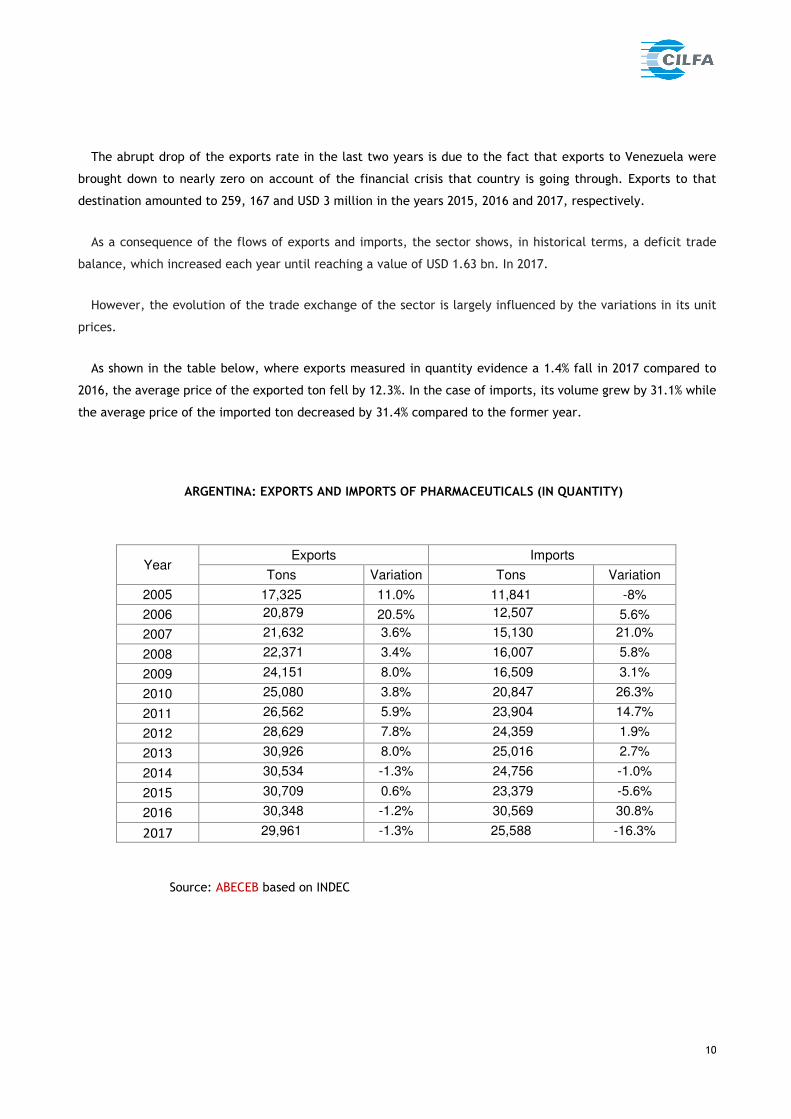
The abrupt drop of the exports rate in the last two years is due to the fact that exports to Venezuela were
brought down to nearly zero on account of the financial crisis that country is going through. Exports to that
destination amounted to 259, 167 and USD 3 million in the years 2015, 2016 and 2017, respectively.
As a consequence of the flows of exports and imports, the sector shows, in historical terms, a deficit trade
balance, which increased each year until reaching a value of USD 1.63 bn. In 2017.
However, the evolution of the trade exchange of the sector is largely influenced by the variations in its unit
prices.
As shown in the table below, where exports measured in quantity evidence a 1.4% fall in 2017 compared to
2016, the average price of the exported ton fell by 12.3%. In the case of imports, its volume grew by 31.1% while
the average price of the imported ton decreased by 31.4% compared to the former year.
ARGENTINA: EXPORTS AND IMPORTS OF PHARMACEUTICALS (IN QUANTITY)
Year Exports Imports
Tons Variation Tons Variation
2005 17,325 11.0% 11,841 -8%
2006 20,879 20.5% 12,507 5.6%
2007 21,632 3.6% 15,130 21.0%
2008 22,371 3.4% 16,007 5.8%
2009 24,151 8.0% 16,509 3.1%
2010 25,080 3.8% 20,847 26.3%
2011 26,562 5.9% 23,904 14.7%
2012 28,629 7.8% 24,359 1.9%
2013 30,926 8.0% 25,016 2.7%
2014 30,534 -1.3% 24,756 -1.0%
2015 30,709 0.6% 23,379 -5.6%
2016 30,348 -1.2% 30,569 30.8%
2017 29,961 -1.3% 25,588 -16.3%
Source: ABECEB based on INDEC
11
II.2.2. Imports and Exports Structure
As mentioned before, the accrued annual growth rate (+12.2%) for imports is higher than the respective export
rate (+7.6%) for the period 2003-2017, which leads to an increase of the trade deficit during the last decade.
However, the analysis of imports structure shows that each kind of product has a different behavior.
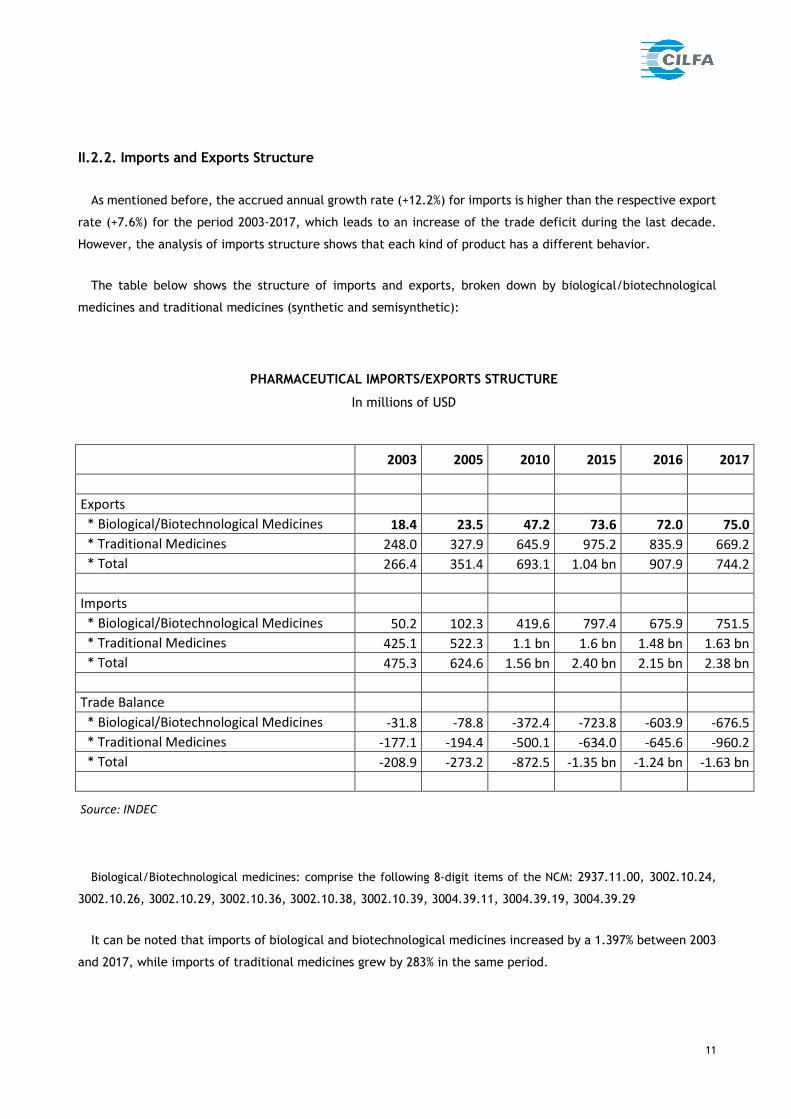
The table below shows the structure of imports and exports, broken down by biological/biotechnological
medicines and traditional medicines (synthetic and semisynthetic):
PHARMACEUTICAL IMPORTS/EXPORTS STRUCTURE
In millions of USD
2003 2005 2010 2015 2016 2017
Exports
* Biological/Biotechnological Medicines 18.4 23.5 47.2 73.6 72.0 75.0
* Traditional Medicines 248.0 327.9 645.9 975.2 835.9 669.2
* Total 266.4 351.4 693.1 1.04 bn 907.9 744.2
Imports
* Biological/Biotechnological Medicines 50.2 102.3 419.6 797.4 675.9 751.5
* Traditional Medicines 425.1 522.3 1.1 bn 1.6 bn 1.48 bn 1.63 bn
* Total 475.3 624.6 1.56 bn 2.40 bn 2.15 bn 2.38 bn
Trade Balance
* Biological/Biotechnological Medicines -31.8 -78.8 -372.4 -723.8 -603.9 -676.5
* Traditional Medicines -177.1 -194.4 -500.1 -634.0 -645.6 -960.2
* Total -208.9 -273.2 -872.5 -1.35 bn -1.24 bn -1.63 bn
Source: INDEC
Biological/Biotechnological medicines: comprise the following 8-digit items of the NCM: 2937.11.00, 3002.10.24,
3002.10.26, 3002.10.29, 3002.10.36, 3002.10.38, 3002.10.39, 3004.39.11, 3004.39.19, 3004.39.29
It can be noted that imports of biological and biotechnological medicines increased by a 1.397% between 2003
and 2017, while imports of traditional medicines grew by 283% in the same period.
12
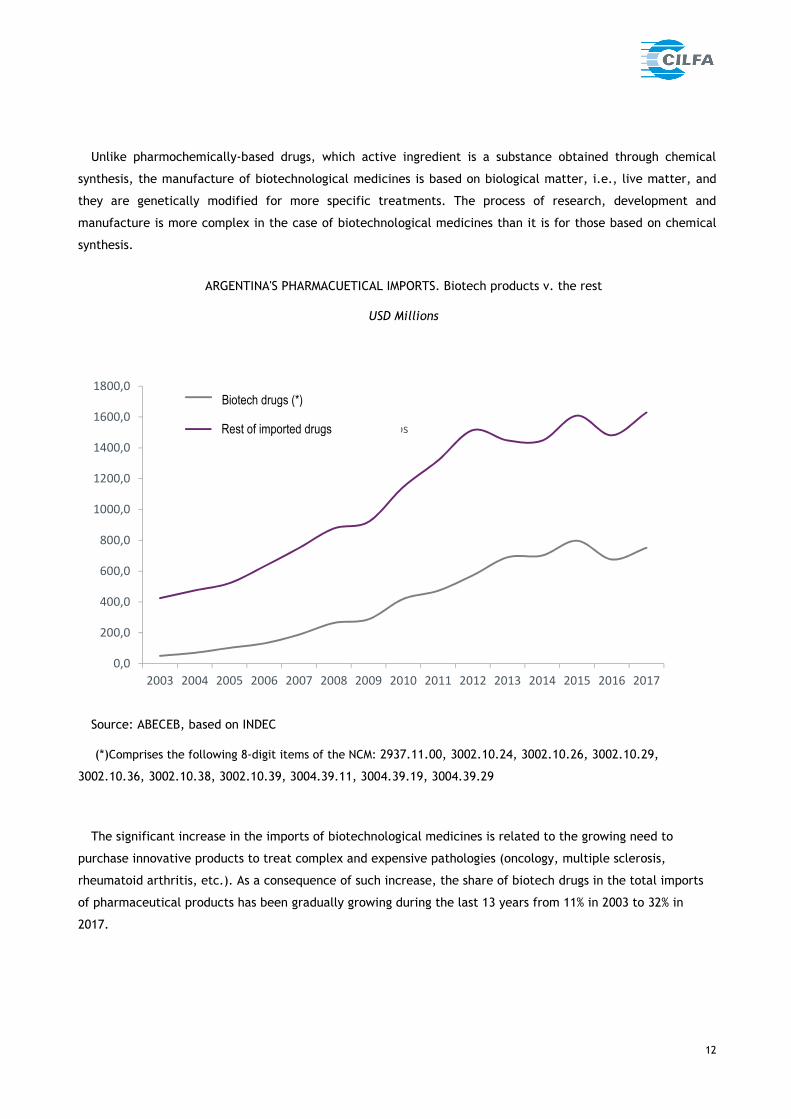
Unlike pharmochemically-based drugs, which active ingredient is a substance obtained through chemical
synthesis, the manufacture of biotechnological medicines is based on biological matter, i.e., live matter, and
they are genetically modified for more specific treatments. The process of research, development and
manufacture is more complex in the case of biotechnological medicines than it is for those based on chemical
synthesis.
ARGENTINA'S PHARMACUETICAL IMPORTS. Biotech products v. the rest
USD Millions
Source: ABECEB, based on INDEC
(*)Comprises the following 8-digit items of the NCM: 2937.11.00, 3002.10.24, 3002.10.26, 3002.10.29,
3002.10.36, 3002.10.38, 3002.10.39, 3004.39.11, 3004.39.19, 3004.39.29
The significant increase in the imports of biotechnological medicines is related to the growing need to
purchase innovative products to treat complex and expensive pathologies (oncology, multiple sclerosis,
rheumatoid arthritis, etc.). As a consequence of such increase, the share of biotech drugs in the total imports
of pharmaceutical products has been gradually growing during the last 13 years from 11% in 2003 to 32% in
2017.
0,0
200,0
400,0
600,0
800,0
1000,0
1200,0
1400,0
1600,0
1800,0
2003 2004 2005 2006 2007 2008 2009 2010 2011 2012 2013 2014 2015 2016 2017
Medicamentos Biotecnológicos (*)
Resto importaciones medicamentos
Biotech drugs (*)
Rest of imported drugs
13
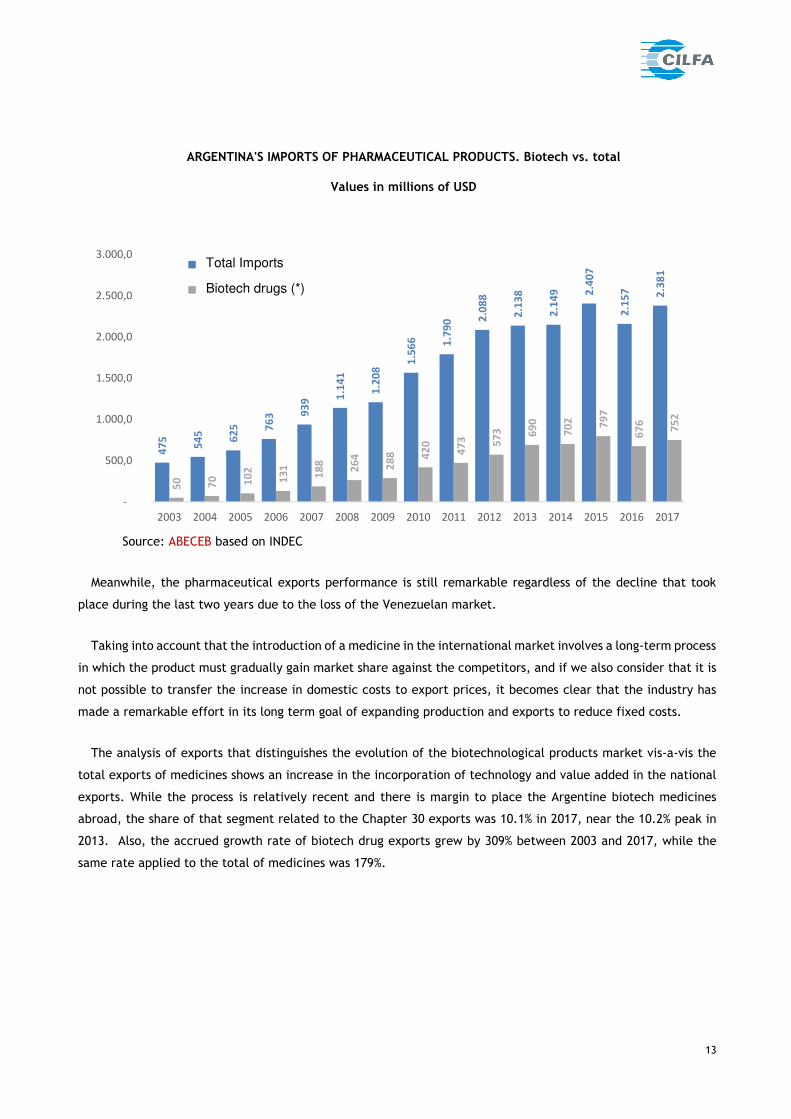
ARGENTINA'S IMPORTS OF PHARMACEUTICAL PRODUCTS. Biotech vs. total
Values in millions of USD
Source: ABECEB based on INDEC
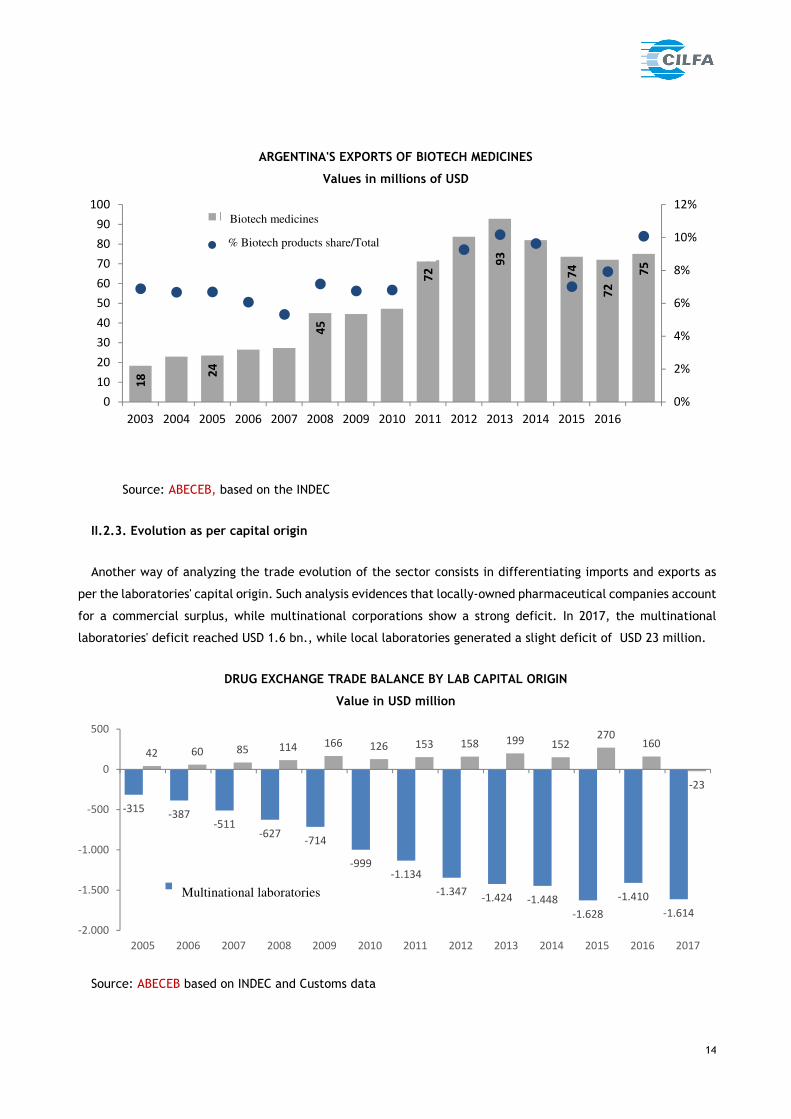
Meanwhile, the pharmaceutical exports performance is still remarkable regardless of the decline that took
place during the last two years due to the loss of the Venezuelan market.
Taking into account that the introduction of a medicine in the international market involves a long-term process
in which the product must gradually gain market share against the competitors, and if we also consider that it is
not possible to transfer the increase in domestic costs to export prices, it becomes clear that the industry has
made a remarkable effort in its long term goal of expanding production and exports to reduce fixed costs.
The analysis of exports that distinguishes the evolution of the biotechnological products market vis-a-vis the
total exports of medicines shows an increase in the incorporation of technology and value added in the national
exports. While the process is relatively recent and there is margin to place the Argentine biotech medicines
abroad, the share of that segment related to the Chapter 30 exports was 10.1% in 2017, near the 10.2% peak in
2013. Also, the accrued growth rate of biotech drug exports grew by 309% between 2003 and 2017, while the
same rate applied to the total of medicines was 179%.
47
5
54
5
62
5 76
3 93
9 1.1
41
1.2
08
1.5
66 1.7
90 2
.08
8
2.1
38
2.1
49 2
.40
7
2.1
57 2.3
81
50 70 10
2
13
1
18
8
26
4
28
8 42
0
47
3 57
3 69
0
70
2 79
7
67
6
75
2
-
500,0
1.000,0
1.500,0
2.000,0
2.500,0
3.000,0
2003 2004 2005 2006 2007 2008 2009 2010 2011 2012 2013 2014 2015 2016 2017
Importaciones Totales
Medicamentos Biotecnológicos (*)
Total Imports
Biotech drugs (*)
14
ARGENTINA'S EXPORTS OF BIOTECH MEDICINES
Values in millions of USD
Source: ABECEB, based on the INDEC
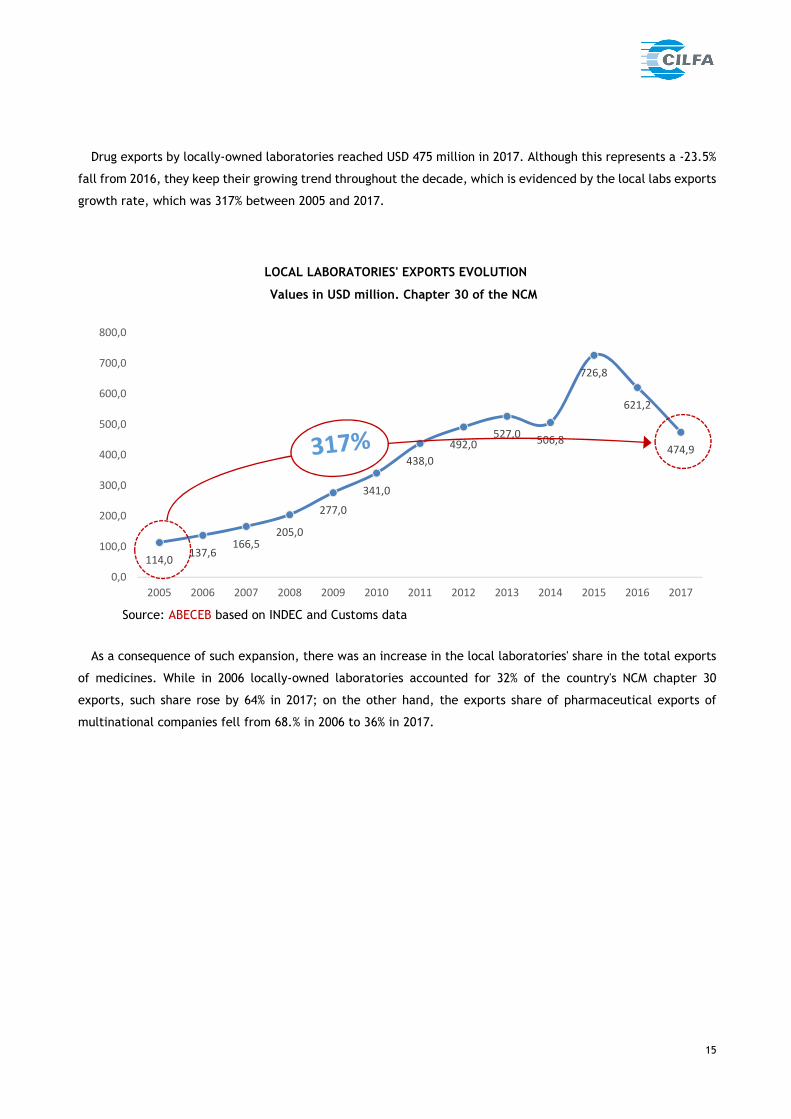
II.2.3. Evolution as per capital origin
Another way of analyzing the trade evolution of the sector consists in differentiating imports and exports as
per the laboratories' capital origin. Such analysis evidences that locally-owned pharmaceutical companies account
for a commercial surplus, while multinational corporations show a strong deficit. In 2017, the multinational
laboratories' deficit reached USD 1.6 bn., while local laboratories generated a slight deficit of USD 23 million.
DRUG EXCHANGE TRADE BALANCE BY LAB CAPITAL ORIGIN
Value in USD million
Source: ABECEB based on INDEC and Customs data
18 2
4
45
72
93
74
72
75
0%
2%
4%
6%
8%
10%
12%
0
10
20
30
40
50
60
70
80
90
100
2003 2004 2005 2006 2007 2008 2009 2010 2011 2012 2013 2014 2015 2016
Medicamentos biotecnológicos
Particip. % Biotecnológicos / Total
-315-387
-511-627
-714
-999-1.134
-1.347-1.424 -1.448
-1.628
-1.410
-1.614
42 60 85 114 166 126 153 158 199 152270
160
-23
-2.000
-1.500
-1.000
-500
0
500
2005 2006 2007 2008 2009 2010 2011 2012 2013 2014 2015 2016 2017
Laboratorios
multinacionales
Biotech medicines
% Biotech products share/Total
Multinational laboratories
15
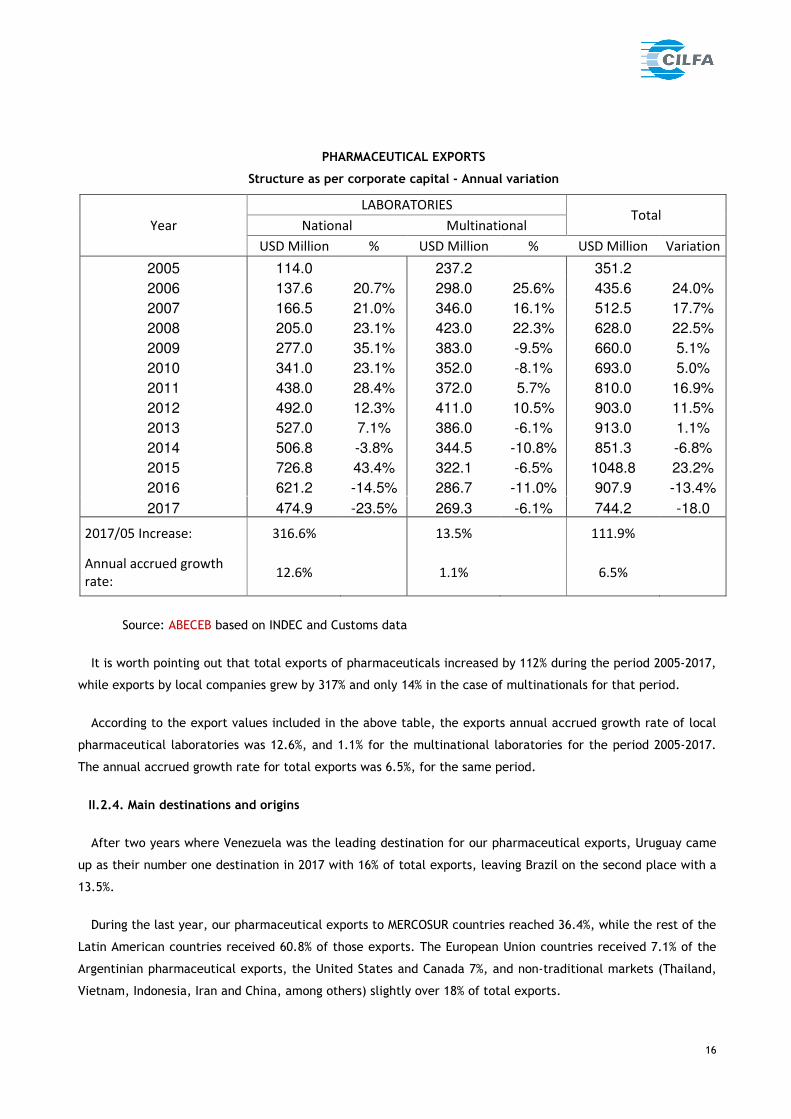
Drug exports by locally-owned laboratories reached USD 475 million in 2017. Although this represents a -23.5%
fall from 2016, they keep their growing trend throughout the decade, which is evidenced by the local labs exports
growth rate, which was 317% between 2005 and 2017.
LOCAL LABORATORIES' EXPORTS EVOLUTION
Values in USD million. Chapter 30 of the NCM
Source: ABECEB based on INDEC and Customs data
As a consequence of such expansion, there was an increase in the local laboratories' share in the total exports
of medicines. While in 2006 locally-owned laboratories accounted for 32% of the country's NCM chapter 30
exports, such share rose by 64% in 2017; on the other hand, the exports share of pharmaceutical exports of
multinational companies fell from 68.% in 2006 to 36% in 2017.
114,0137,6
166,5205,0
277,0
341,0
438,0
492,0527,0
506,8
726,8
621,2
474,9
0,0
100,0
200,0
300,0
400,0
500,0
600,0
700,0
800,0
2005 2006 2007 2008 2009 2010 2011 2012 2013 2014 2015 2016 2017
16
PHARMACEUTICAL EXPORTS
Structure as per corporate capital - Annual variation
Year
LABORATORIES Total
National Multinational
USD Million % USD Million % USD Million Variation
2005 114.0 237.2 351.2
2006 137.6 20.7% 298.0 25.6% 435.6 24.0%
2007 166.5 21.0% 346.0 16.1% 512.5 17.7%
2008 205.0 23.1% 423.0 22.3% 628.0 22.5%
2009 277.0 35.1% 383.0 -9.5% 660.0 5.1%
2010 341.0 23.1% 352.0 -8.1% 693.0 5.0%
2011 438.0 28.4% 372.0 5.7% 810.0 16.9%
2012 492.0 12.3% 411.0 10.5% 903.0 11.5%
2013 527.0 7.1% 386.0 -6.1% 913.0 1.1%
2014 506.8 -3.8% 344.5 -10.8% 851.3 -6.8%
2015 726.8 43.4% 322.1 -6.5% 1048.8 23.2%
2016 621.2 -14.5% 286.7 -11.0% 907.9 -13.4%
2017 474.9 -23.5% 269.3 -6.1% 744.2 -18.0
2017/05 Increase: 316.6% 13.5% 111.9%
Annual accrued growth
rate: 12.6% 1.1% 6.5%
Source: ABECEB based on INDEC and Customs data
It is worth pointing out that total exports of pharmaceuticals increased by 112% during the period 2005-2017,
while exports by local companies grew by 317% and only 14% in the case of multinationals for that period.
According to the export values included in the above table, the exports annual accrued growth rate of local
pharmaceutical laboratories was 12.6%, and 1.1% for the multinational laboratories for the period 2005-2017.
The annual accrued growth rate for total exports was 6.5%, for the same period.
II.2.4. Main destinations and origins
After two years where Venezuela was the leading destination for our pharmaceutical exports, Uruguay came
up as their number one destination in 2017 with 16% of total exports, leaving Brazil on the second place with a
13.5%.
During the last year, our pharmaceutical exports to MERCOSUR countries reached 36.4%, while the rest of the
Latin American countries received 60.8% of those exports. The European Union countries received 7.1% of the
Argentinian pharmaceutical exports, the United States and Canada 7%, and non-traditional markets (Thailand,
Vietnam, Indonesia, Iran and China, among others) slightly over 18% of total exports.
17
The ranking of pharmaceutical imports by origin country is led by Germany with 20.5% (USD 489 million),
followed by the United States with 17.8 % (USD 425 million) in the year 2017.
An analysis of the structure of imports by region shows that 54.2% of imports come from countries in the
European Union, 22.2% from the United States and Canada, and 5.5% from Latin America (of which 4.1%
corresponds to Brazil, with USD 98 million).
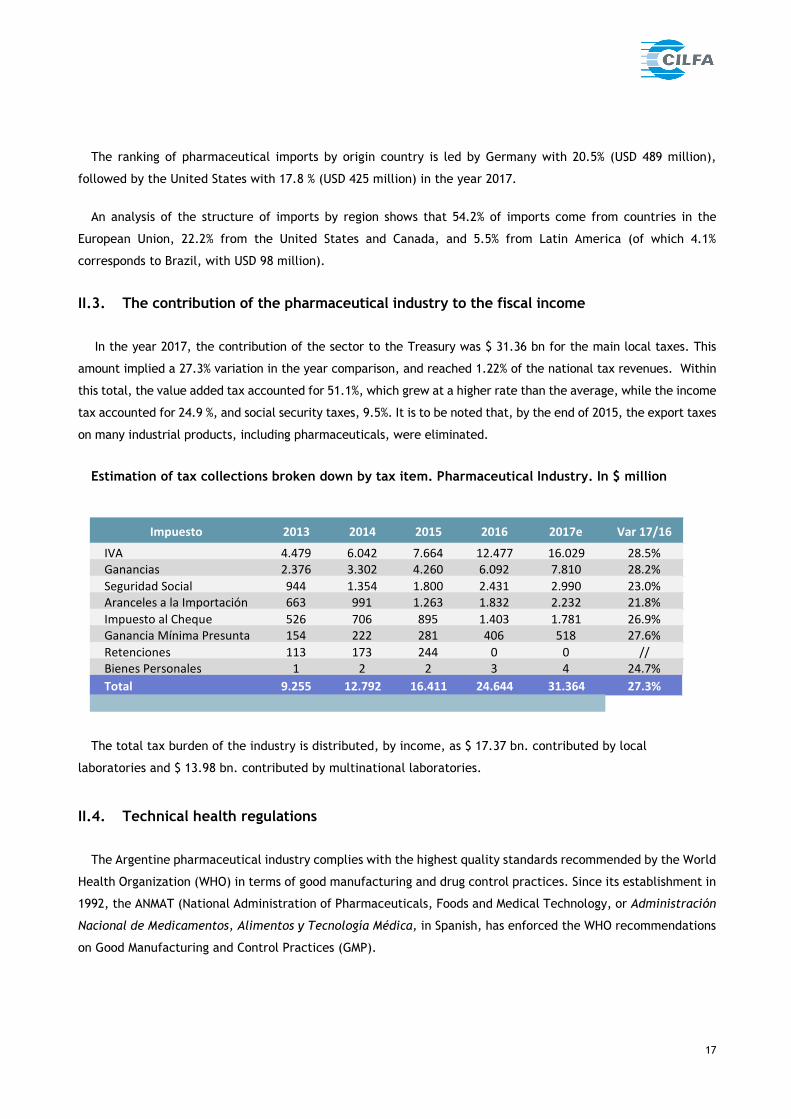
II.3. The contribution of the pharmaceutical industry to the fiscal income
In the year 2017, the contribution of the sector to the Treasury was $ 31.36 bn for the main local taxes. This
amount implied a 27.3% variation in the year comparison, and reached 1.22% of the national tax revenues. Within
this total, the value added tax accounted for 51.1%, which grew at a higher rate than the average, while the income
tax accounted for 24.9 %, and social security taxes, 9.5%. It is to be noted that, by the end of 2015, the export taxes
on many industrial products, including pharmaceuticals, were eliminated.
Estimation of tax collections broken down by tax item. Pharmaceutical Industry. In $ million
The total tax burden of the industry is distributed, by income, as $ 17.37 bn. contributed by local
laboratories and $ 13.98 bn. contributed by multinational laboratories.
II.4. Technical health regulations
The Argentine pharmaceutical industry complies with the highest quality standards recommended by the World
Health Organization (WHO) in terms of good manufacturing and drug control practices. Since its establishment in
1992, the ANMAT (National Administration of Pharmaceuticals, Foods and Medical Technology, or Administración
Nacional de Medicamentos, Alimentos y Tecnología Médica, in Spanish, has enforced the WHO recommendations
on Good Manufacturing and Control Practices (GMP).
Impuesto 2013 2014 2015 2016 2017e Var 17/16
IVA 4.479 6.042 7.664 12.477 16.029 28.5%
Ganancias 2.376 3.302 4.260 6.092 7.810 28.2%
Seguridad Social 944 1.354 1.800 2.431 2.990 23.0%
Aranceles a la Importación 663 991 1.263 1.832 2.232 21.8%
Impuesto al Cheque 526 706 895 1.403 1.781 26.9%
Ganancia Mínima Presunta 154 222 281 406 518 27.6%
Retenciones 113 173 244 0 0 //
Bienes Personales 1 2 2 3 4 24.7%
Total 9.255 12.792 16.411 24.644 31.364 27.3%
18
As a PIC/S (Pharmaceutical Inspection Cooperation Scheme) member, the ANMAT has updated their BPM
regulations based on the PIC/S “Guide to Good Manufacturing Practices for Producers, Importers/Exporters of
Medicinal Products for Human Use” and the 2015 WHO recommendations, by means of provision number 3827/18.
It should be noted that the National Institute of Medicines (INAME), which belongs to the ANMAT, was accepted
as a PIC´S member effective January 1st 2008, becoming the first Latin American country to be a member of such
cooperation plan on good manufacturing and control practices, applied by the main European and Asian health
agencies.5
In December 2009, The Pan American Health Organization (PAHO) certified the ANMAT as a Health Authority
of reference, and it became the first Latin American health agency to obtain such certification, which has been
renewed in December 2016.
It is also worth mentioning that the manufacture of pharmaceuticals is considered a clean activity, as its
environmental impact is very low.
There is, then, the challenge to continue generating business opportunities in the country and abroad, where
the quality of Argentine medicines is widely acknowledged and valued. Therefore, in order to compete at a global
scale, it is essential to encourage investments in new industrial plants and refurbishment, extension and
technological updating of the existing ones.
5 For a full member list, visit www.picscheme.org
19
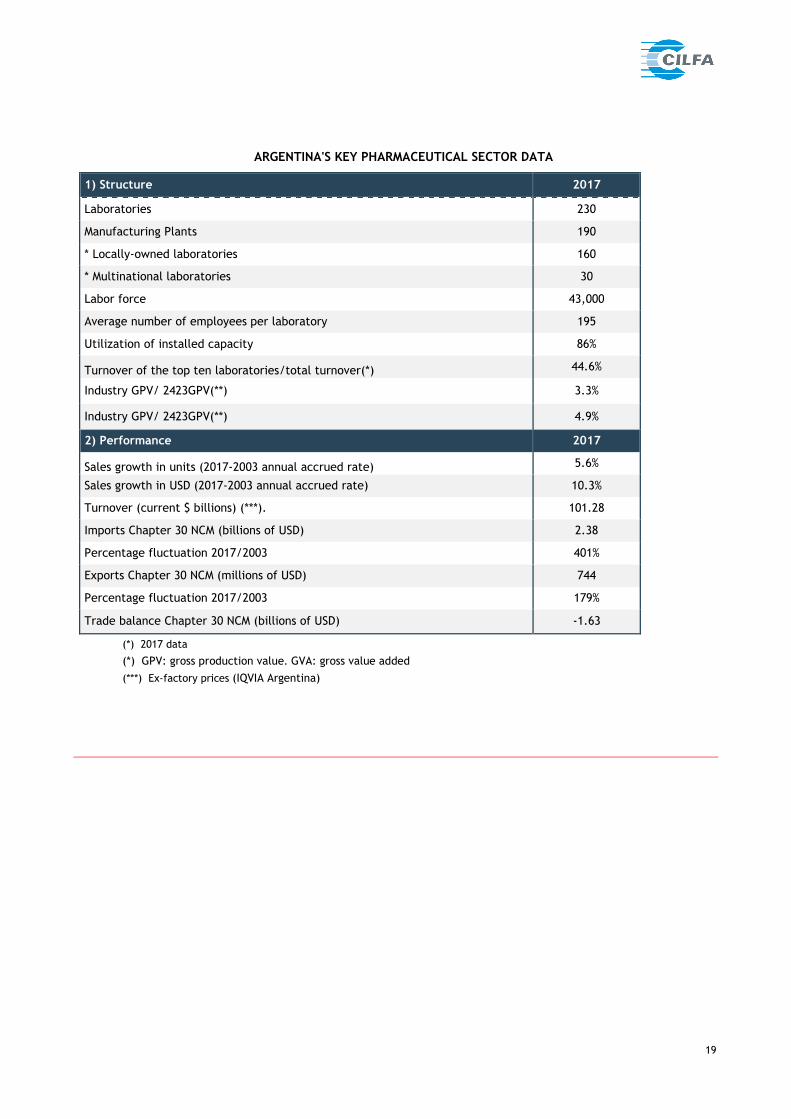
ARGENTINA'S KEY PHARMACEUTICAL SECTOR DATA
1) Structure 2017
Laboratories 230
Manufacturing Plants 190
* Locally-owned laboratories 160
* Multinational laboratories 30
Labor force 43,000
Average number of employees per laboratory 195
Utilization of installed capacity 86%
Turnover of the top ten laboratories/total turnover(*) 44.6%
Industry GPV/ 2423GPV(**) 3.3%
Industry GPV/ 2423GPV(**) 4.9%
2) Performance 2017
Sales growth in units (2017-2003 annual accrued rate) 5.6%
Sales growth in USD (2017-2003 annual accrued rate) 10.3%
Turnover (current $ billions) (***). 101.28
Imports Chapter 30 NCM (billions of USD) 2.38
Percentage fluctuation 2017/2003 401%
Exports Chapter 30 NCM (millions of USD) 744
Percentage fluctuation 2017/2003 179%
Trade balance Chapter 30 NCM (billions of USD) -1.63
(*) 2017 data
(*) GPV: gross production value. GVA: gross value added
(***) Ex-factory prices (IQVIA Argentina)
20
III. SCENARIO AND PERSPECTIVES FOR THE ARGENTINE PHARMACEUTICAL INDUSTRY
This section provides a forecast on the pharmaceutical sector, and takes into account following pivotal items:
investment, financing, exports and R&D.
The aim is to identify the typical characteristics of the sector which may exert an influence on its
competitiveness, such as potential, strengths and weaknesses, as well as opportunities for development and
future threats faced by the activity.
Strengths
Among the main identified strengths, we can highlight the high versatility and dynamics that have made it
possible for this sector to overcome the successive economic crises of the Argentine economy.
The Argentine pharmaceutical sector has an important comparative advantage over the other nations of the
region and a large number of the emerging world markets: it is one of the few that concentrate over 60% of the
production and sales in domestically-owned companies.6 This percentage has reached 66.1% in 2017, measured
in values, and 66.4% if measured in units.
During the last ten years, the manufacture of biotechnology medicines in local plants has experienced a
significant boost as a result of the installment of local plants to manufacture biotech active ingredients, the
growth of first-generation biotech drugs (interferon, erythropoietin, growth hormone and others), biosimilar
monoclonal antibodies (rituximab and bevacizumab) and the exports of these to non-traditional markets.
Argentine has locally-owned laboratories that have become multinationals, with subsidiaries in most of the
Latin American countries, USA, Europe and some Asian countries.
The pharmaceutical industry has managed to “…significantly increase work productivity, becoming one of the
industrial sectors that allocate the highest amount of its income to R&D efforts and one of the most intensive
sectors in terms of qualified workforce”.7
The Ministry of Science, Technology and Productive Innovation published the results of a survey on Research
and Development (R&D), addressed to the corporate sectors, in which 1,225 companies participated. Of this
total, 571 firms spent and invested in R&D; they declared a total amount of $ 7.8 billion in the year 2015
(approximately USD 840 million) and a workforce of 10,514 employees working on R&D.
6 González García, Catalina de la Puente, Sonia Tarragona, Medicamentos – Salud, Política y Economía -, 2005,
Editorial Isalud, page 106: “In the domestic market, local labs account for over a 50% share in the industry’s total sales. This situation is atypical and almost unprecedented for developing countries and only occurs in those with major world manufacturing companies, such as the United States, Japan and Germany.”
7 González García et al, 2005, pp 103-104
21
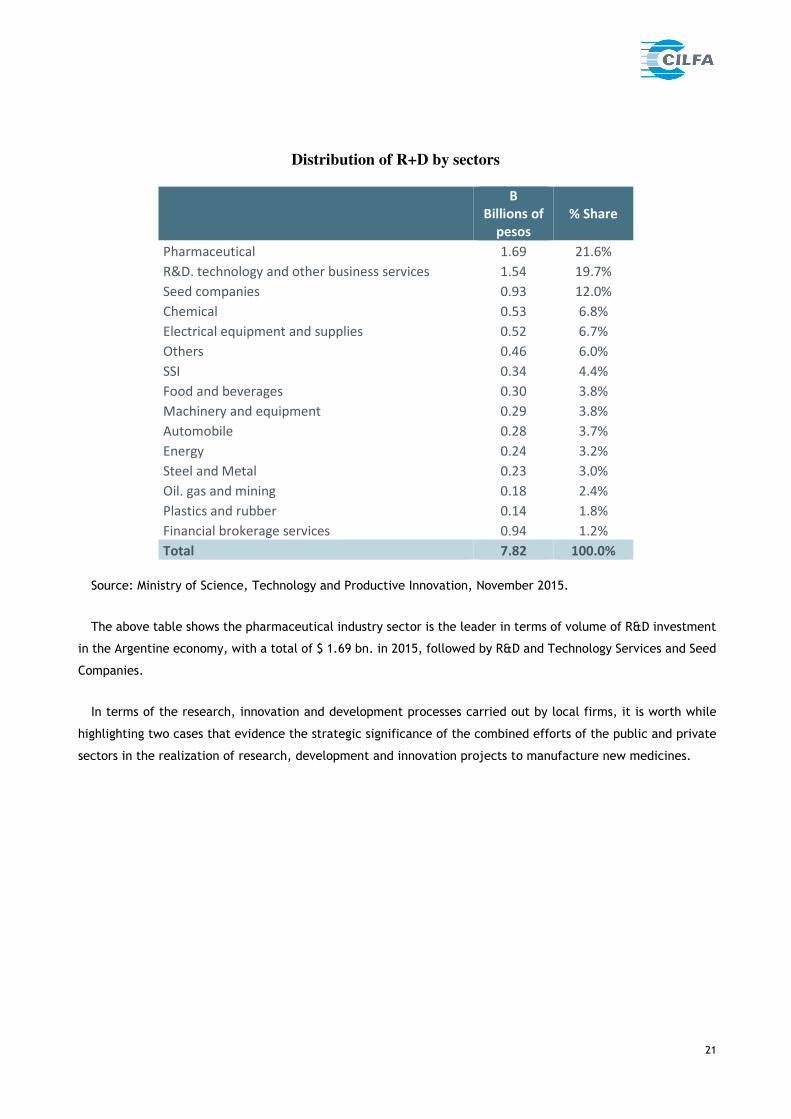
Distribution of R+D by sectors
B
Billions of
pesos
% Share
Pharmaceutical 1.69 21.6%
R&D. technology and other business services 1.54 19.7%
Seed companies 0.93 12.0%
Chemical 0.53 6.8%
Electrical equipment and supplies 0.52 6.7%
Others 0.46 6.0%
SSI 0.34 4.4%
Food and beverages 0.30 3.8%
Machinery and equipment 0.29 3.8%
Automobile 0.28 3.7%
Energy 0.24 3.2%
Steel and Metal 0.23 3.0%
Oil. gas and mining 0.18 2.4%
Plastics and rubber 0.14 1.8%
Financial brokerage services 0.94 1.2%
Total 7.82 100.0%
Source: Ministry of Science, Technology and Productive Innovation, November 2015.
The above table shows the pharmaceutical industry sector is the leader in terms of volume of R&D investment
in the Argentine economy, with a total of $ 1.69 bn. in 2015, followed by R&D and Technology Services and Seed
Companies.
In terms of the research, innovation and development processes carried out by local firms, it is worth while
highlighting two cases that evidence the strategic significance of the combined efforts of the public and private
sectors in the realization of research, development and innovation projects to manufacture new medicines.
22
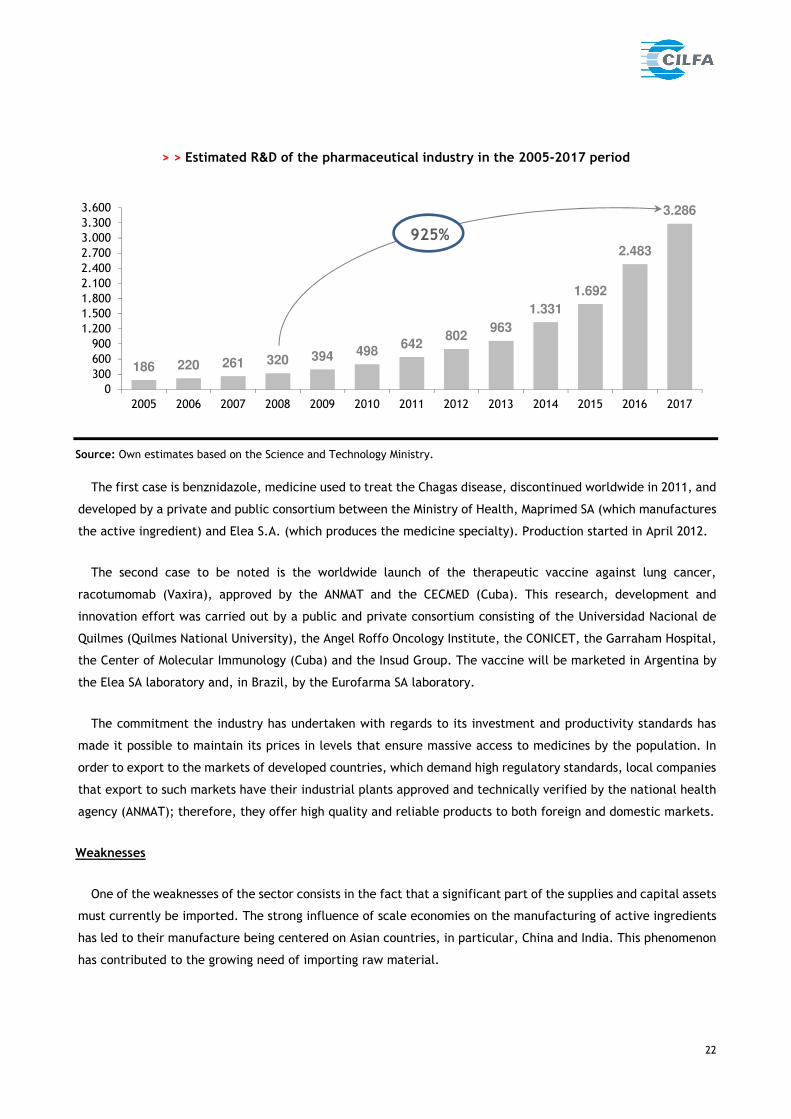
> > Estimated R&D of the pharmaceutical industry in the 2005-2017 period
Source: Own estimates based on the Science and Technology Ministry.
The first case is benznidazole, medicine used to treat the Chagas disease, discontinued worldwide in 2011, and
developed by a private and public consortium between the Ministry of Health, Maprimed SA (which manufactures
the active ingredient) and Elea S.A. (which produces the medicine specialty). Production started in April 2012.
The second case to be noted is the worldwide launch of the therapeutic vaccine against lung cancer,
racotumomab (Vaxira), approved by the ANMAT and the CECMED (Cuba). This research, development and
innovation effort was carried out by a public and private consortium consisting of the Universidad Nacional de
Quilmes (Quilmes National University), the Angel Roffo Oncology Institute, the CONICET, the Garraham Hospital,
the Center of Molecular Immunology (Cuba) and the Insud Group. The vaccine will be marketed in Argentina by
the Elea SA laboratory and, in Brazil, by the Eurofarma SA laboratory.
The commitment the industry has undertaken with regards to its investment and productivity standards has
made it possible to maintain its prices in levels that ensure massive access to medicines by the population. In
order to export to the markets of developed countries, which demand high regulatory standards, local companies
that export to such markets have their industrial plants approved and technically verified by the national health
agency (ANMAT); therefore, they offer high quality and reliable products to both foreign and domestic markets.
Weaknesses
One of the weaknesses of the sector consists in the fact that a significant part of the supplies and capital assets
must currently be imported. The strong influence of scale economies on the manufacturing of active ingredients
has led to their manufacture being centered on Asian countries, in particular, China and India. This phenomenon
has contributed to the growing need of importing raw material.
186 220 261 320 394 498642
802963
1.331
1.692
2.483
3.286
0300
600
900
1.200
1.5001.800
2.100
2.400
2.700
3.0003.300
3.600
2005 2006 2007 2008 2009 2010 2011 2012 2013 2014 2015 2016 2017
925%
23
Also, the availability of loans for production and investment development is a factor that limits the chances of
expansion, particularly in the international markets.
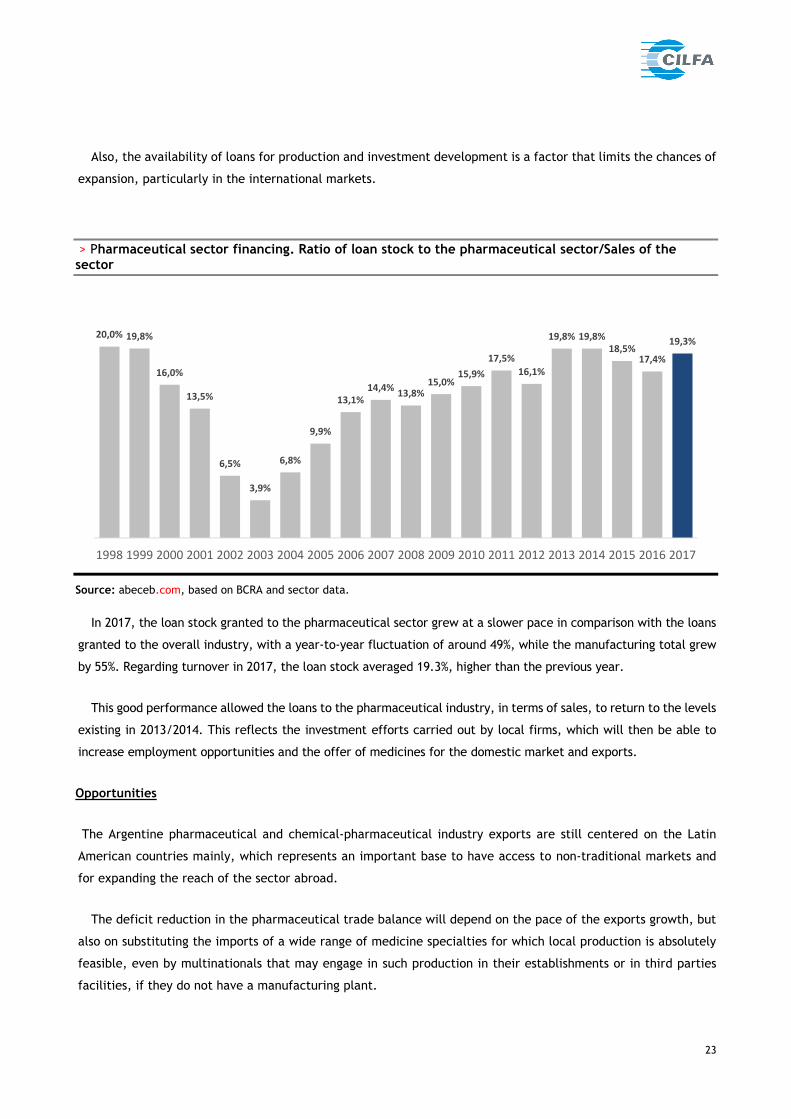
> Pharmaceutical sector financing. Ratio of loan stock to the pharmaceutical sector/Sales of the sector
Source: abeceb.com, based on BCRA and sector data.
In 2017, the loan stock granted to the pharmaceutical sector grew at a slower pace in comparison with the loans
granted to the overall industry, with a year-to-year fluctuation of around 49%, while the manufacturing total grew
by 55%. Regarding turnover in 2017, the loan stock averaged 19.3%, higher than the previous year.
This good performance allowed the loans to the pharmaceutical industry, in terms of sales, to return to the levels
existing in 2013/2014. This reflects the investment efforts carried out by local firms, which will then be able to
increase employment opportunities and the offer of medicines for the domestic market and exports.
Opportunities
The Argentine pharmaceutical and chemical-pharmaceutical industry exports are still centered on the Latin
American countries mainly, which represents an important base to have access to non-traditional markets and
for expanding the reach of the sector abroad.
The deficit reduction in the pharmaceutical trade balance will depend on the pace of the exports growth, but
also on substituting the imports of a wide range of medicine specialties for which local production is absolutely
feasible, even by multinationals that may engage in such production in their establishments or in third parties
facilities, if they do not have a manufacturing plant.
20,0% 19,8%
16,0%
13,5%
6,5%
3,9%
6,8%
9,9%
13,1%
14,4%13,8%
15,0%15,9%
17,5%
16,1%
19,8% 19,8%
18,5%17,4%
19,3%
1998 1999 2000 2001 2002 2003 2004 2005 2006 2007 2008 2009 2010 2011 2012 2013 2014 2015 2016 2017
24
One of the most significant restrictions in the sector is the growing relevance of imports in the overall sales to
the domestic market. In fact, in the year 2017, 28.5% of the medicines purchased in the country were imported. In
1994, that percentage was only 6.9%.
It should be noted that the domestic pharmaceutical market is split differently between local and multinational
laboratories. Indeed, in the year 2017, the local laboratories accounted for 66.1% of the total domestic sales, while
multinational labs had the remaining 33.9%.
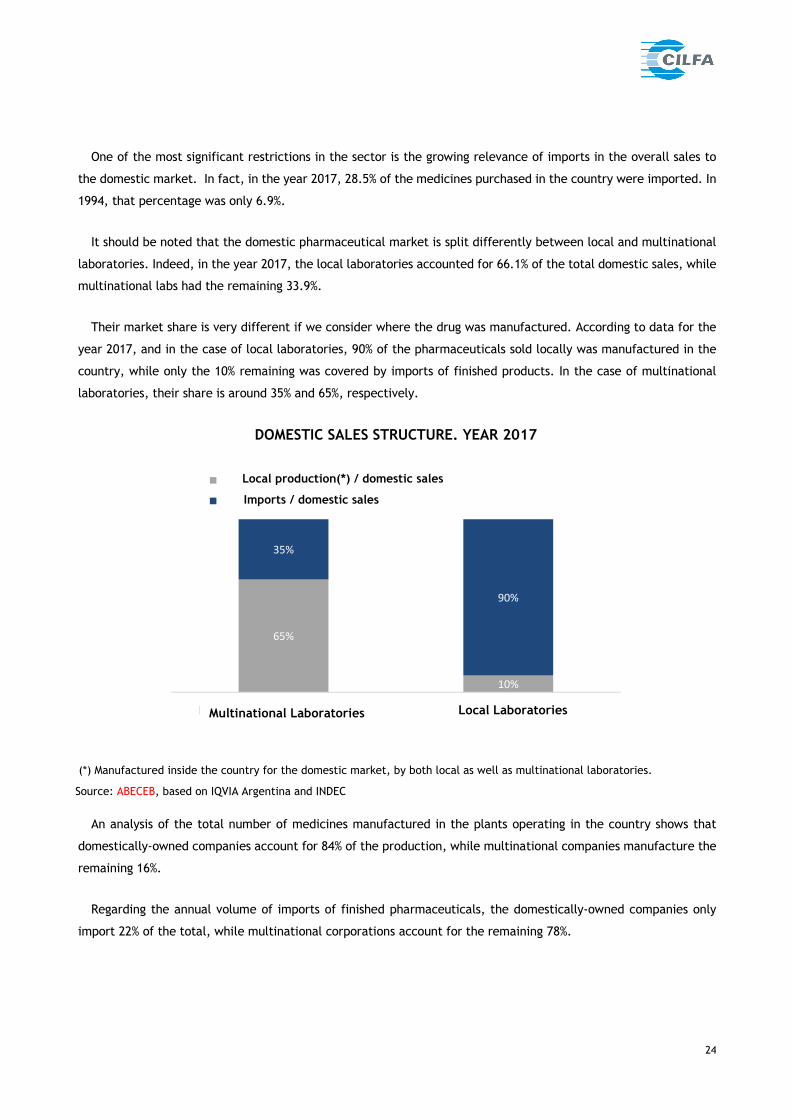
Their market share is very different if we consider where the drug was manufactured. According to data for the
year 2017, and in the case of local laboratories, 90% of the pharmaceuticals sold locally was manufactured in the
country, while only the 10% remaining was covered by imports of finished products. In the case of multinational
laboratories, their share is around 35% and 65%, respectively.
DOMESTIC SALES STRUCTURE. YEAR 2017
(*) Manufactured inside the country for the domestic market, by both local as well as multinational laboratories.
Source: ABECEB, based on IQVIA Argentina and INDEC
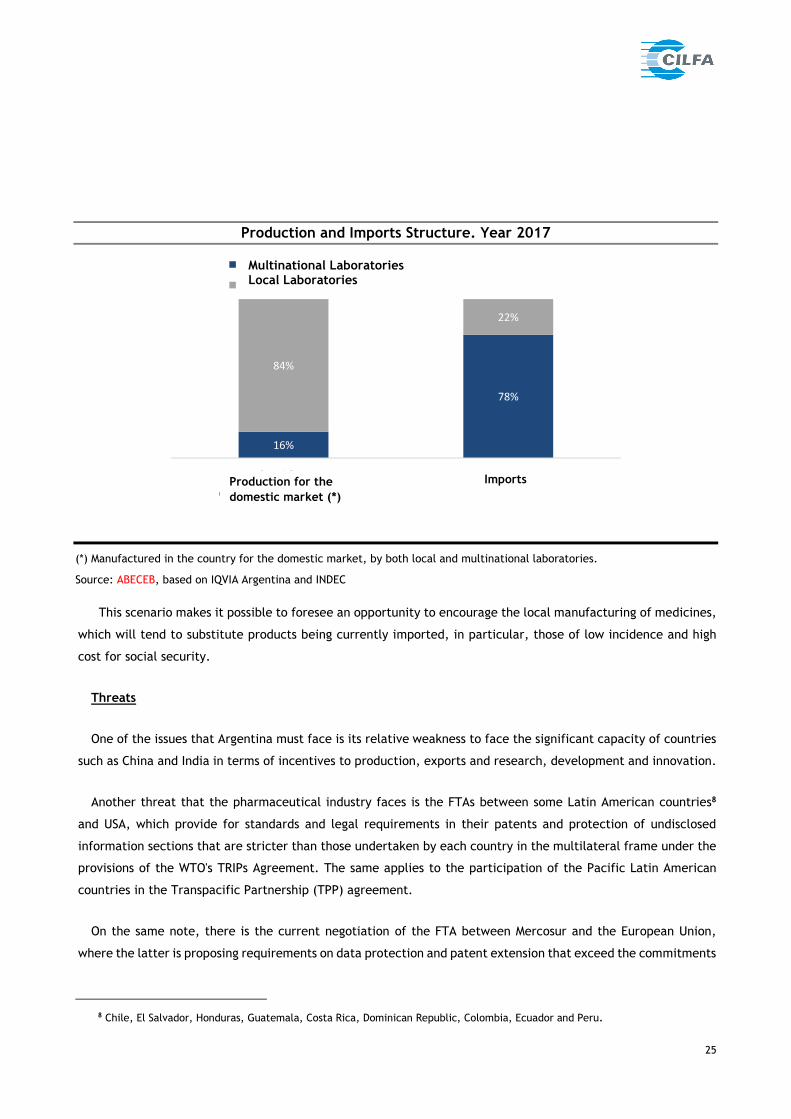
An analysis of the total number of medicines manufactured in the plants operating in the country shows that
domestically-owned companies account for 84% of the production, while multinational companies manufacture the
remaining 16%.
Regarding the annual volume of imports of finished pharmaceuticals, the domestically-owned companies only
import 22% of the total, while multinational corporations account for the remaining 78%.
65%
10%
35%
90%
Laboratorios Multinacionales Laboratorios Nacionales
Importaciones / ventas internas
Producción local (*) / ventas internas Imports / domestic sales
Multinational Laboratories Local Laboratories
Local production(*) / domestic sales
25
Production and Imports Structure. Year 2017
(*) Manufactured in the country for the domestic market, by both local and multinational laboratories.
Source: ABECEB, based on IQVIA Argentina and INDEC
This scenario makes it possible to foresee an opportunity to encourage the local manufacturing of medicines,
which will tend to substitute products being currently imported, in particular, those of low incidence and high
cost for social security.
Threats
One of the issues that Argentina must face is its relative weakness to face the significant capacity of countries
such as China and India in terms of incentives to production, exports and research, development and innovation.
Another threat that the pharmaceutical industry faces is the FTAs between some Latin American countries8
and USA, which provide for standards and legal requirements in their patents and protection of undisclosed
information sections that are stricter than those undertaken by each country in the multilateral frame under the
provisions of the WTO's TRIPs Agreement. The same applies to the participation of the Pacific Latin American
countries in the Transpacific Partnership (TPP) agreement.
On the same note, there is the current negotiation of the FTA between Mercosur and the European Union,
where the latter is proposing requirements on data protection and patent extension that exceed the commitments
8 Chile, El Salvador, Honduras, Guatemala, Costa Rica, Dominican Republic, Colombia, Ecuador and Peru.
16%
78%
84%
22%
Producción para
el mercado interno (*)
Importaciones
Laboratorios Multinacionales
Laboratorios Nacionales
Multinational Laboratories Local Laboratories
Production for the domestic market (*)
Imports
26
of the Mercosur member countries in the WTO TRIPs Agreement. Also, the incipient negotiations between
Mercosur and Canada, EFTA and South Korea could become a threat.
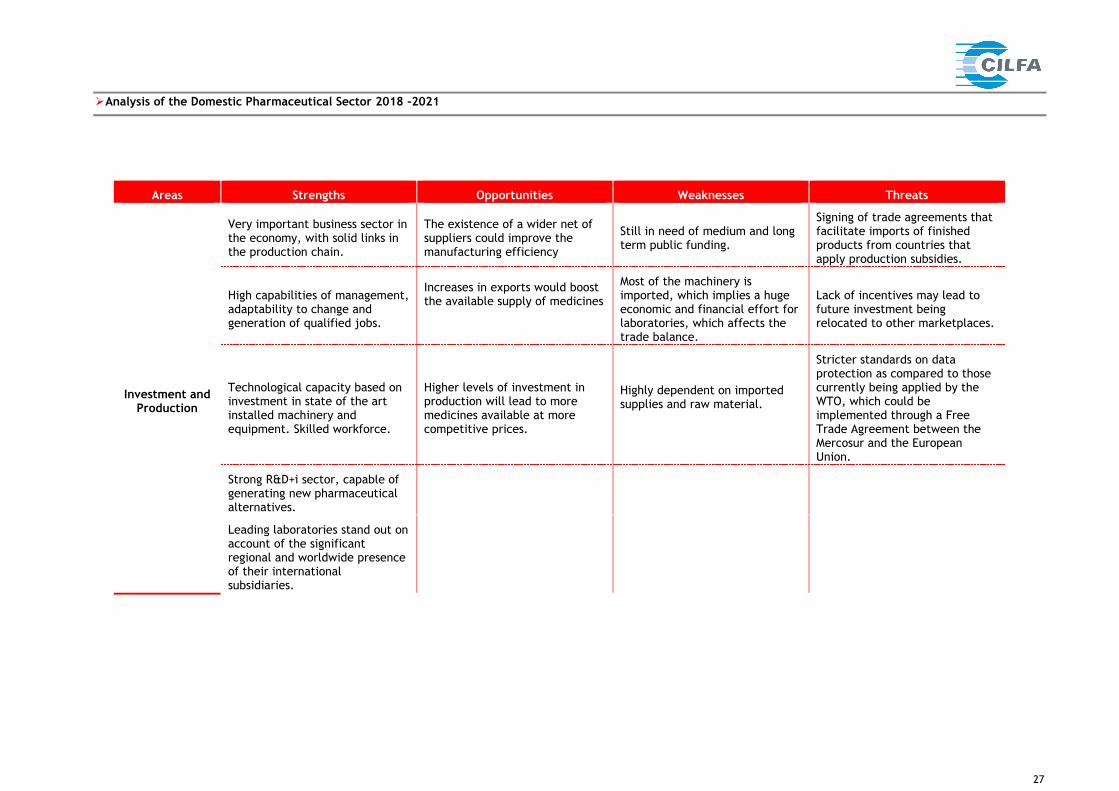
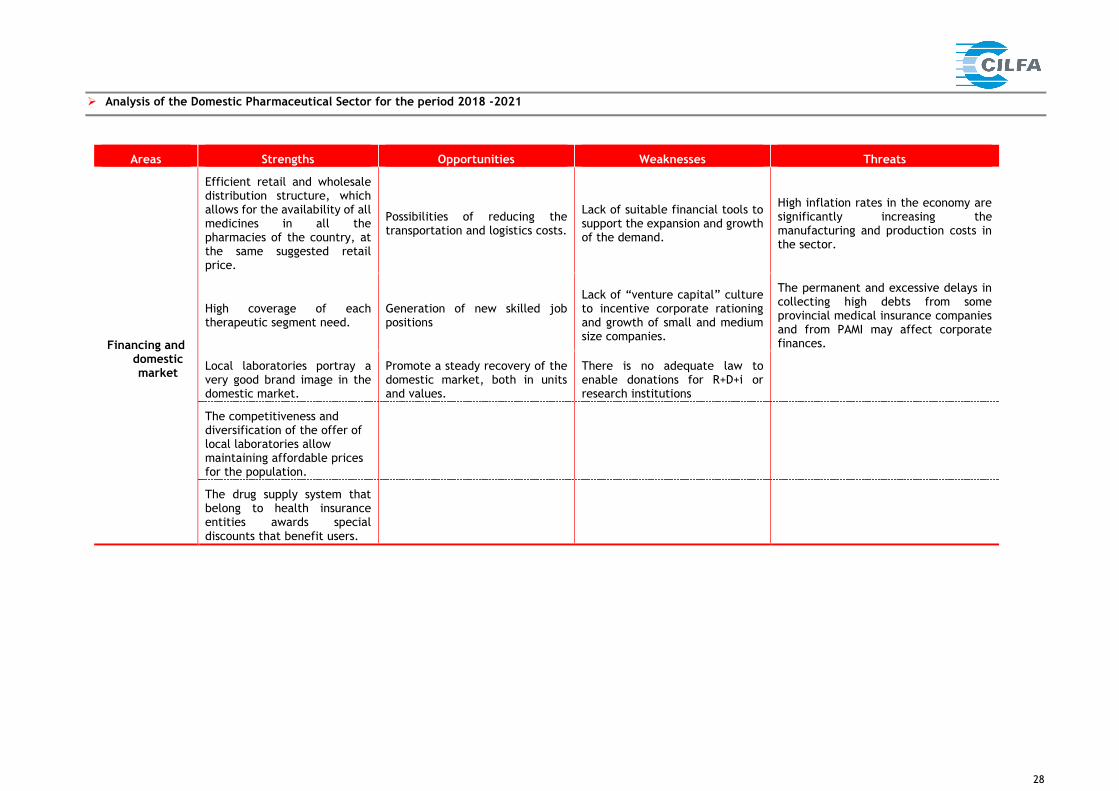
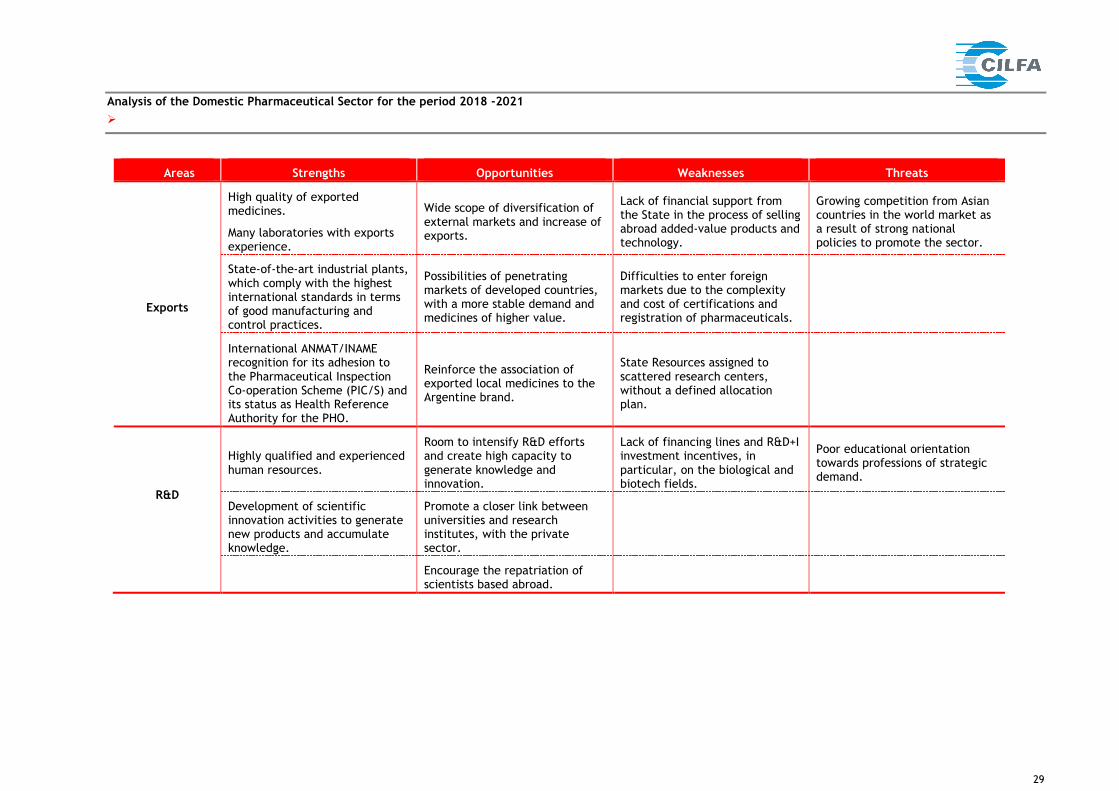
The table below analyzes the main characteristics of the Argentine economic scenario of the pharmaceutical
and chemical-pharmaceutical industry, in terms of strengths, opportunities, weaknesses and threats.
27
Analysis of the Domestic Pharmaceutical Sector 2018 -2021
Areas Strengths Opportunities Weaknesses Threats
Investment and Production
Very important business sector in the economy, with solid links in the production chain.
The existence of a wider net of suppliers could improve the manufacturing efficiency
Still in need of medium and long term public funding.
Signing of trade agreements that facilitate imports of finished products from countries that apply production subsidies.
High capabilities of management, adaptability to change and generation of qualified jobs.
Increases in exports would boost the available supply of medicines
Most of the machinery is imported, which implies a huge economic and financial effort for laboratories, which affects the trade balance.
Lack of incentives may lead to future investment being relocated to other marketplaces.
Technological capacity based on investment in state of the art installed machinery and equipment. Skilled workforce.
Higher levels of investment in production will lead to more medicines available at more competitive prices.
Highly dependent on imported supplies and raw material.
Stricter standards on data protection as compared to those currently being applied by the WTO, which could be implemented through a Free Trade Agreement between the Mercosur and the European Union.
Strong R&D+i sector, capable of generating new pharmaceutical alternatives.
Leading laboratories stand out on account of the significant regional and worldwide presence of their international subsidiaries.
28
Analysis of the Domestic Pharmaceutical Sector for the period 2018 -2021
Areas Strengths Opportunities Weaknesses Threats
Financing and domestic market
Efficient retail and wholesale distribution structure, which allows for the availability of all medicines in all the pharmacies of the country, at the same suggested retail price.
Possibilities of reducing the transportation and logistics costs.
Lack of suitable financial tools to support the expansion and growth of the demand.
High inflation rates in the economy are significantly increasing the manufacturing and production costs in the sector.
High coverage of each therapeutic segment need.
Generation of new skilled job positions
Lack of “venture capital” culture to incentive corporate rationing and growth of small and medium size companies.
The permanent and excessive delays in collecting high debts from some provincial medical insurance companies and from PAMI may affect corporate finances.
Local laboratories portray a very good brand image in the domestic market.
Promote a steady recovery of the domestic market, both in units and values.
There is no adequate law to enable donations for R+D+i or research institutions
The competitiveness and diversification of the offer of local laboratories allow maintaining affordable prices for the population.
The drug supply system that belong to health insurance entities awards special discounts that benefit users.
29
Analysis of the Domestic Pharmaceutical Sector for the period 2018 -2021
Areas Strengths Opportunities Weaknesses Threats
Exports
High quality of exported medicines.
Many laboratories with exports experience.
Wide scope of diversification of external markets and increase of exports.
Lack of financial support from the State in the process of selling abroad added-value products and technology.
Growing competition from Asian countries in the world market as a result of strong national policies to promote the sector.
State-of-the-art industrial plants, which comply with the highest international standards in terms of good manufacturing and control practices.
Possibilities of penetrating markets of developed countries, with a more stable demand and medicines of higher value.
Difficulties to enter foreign markets due to the complexity and cost of certifications and registration of pharmaceuticals.
International ANMAT/INAME recognition for its adhesion to the Pharmaceutical Inspection Co-operation Scheme (PIC/S) and its status as Health Reference Authority for the PHO.
Reinforce the association of exported local medicines to the Argentine brand.
State Resources assigned to scattered research centers, without a defined allocation plan.
R&D
Highly qualified and experienced human resources.
Room to intensify R&D efforts and create high capacity to generate knowledge and innovation.
Lack of financing lines and R&D+I investment incentives, in particular, on the biological and biotech fields.
Poor educational orientation towards professions of strategic demand.
Development of scientific innovation activities to generate new products and accumulate knowledge.
Promote a closer link between universities and research institutes, with the private sector.
Encourage the repatriation of scientists based abroad.
IV. FORECAST FOR THE ARGENTINE ECONOMY AND THE PHARMACEUTICAL SECTOR
V.1. Macroeconomic Perspectives
The current administration intends to stabilize the economic situation and correct its imbalances, namely, the
fiscal deficit, foreign trade deficit, high inflation rate, recovery of foreign reserves, distorted relative prices,
Argentine currency appreciation, outdated tariffs for public services in CABA and greater Buenos Aires, and
logistic costs out of date for the international levels. The goals set by the Administration were the following: a)
to solve the pending issue of payment of the foreign debt (resolved in 2016); b) order macroeconomics; c)
reinvigorate a sustained growth process driven by investment and exports rather than consumption and public
expenditure as in the previous decade; and d) reduce poverty.
Although the Administration set a 15% inflation rate goal for 2018, foreseeing a 5 point reduction per year, the
exchange rate turmoil in the first two weeks of May has led to an increase of the foreign currency that
compromises such rate, which will most probably be around 28%. The Administration has also set the goal of
reducing the public expenditure in new works at half point of the gross domestic product (GDP). The
announcement of financial aid from the International Monetary Fund seeks to have a more affordable and
accessible source of financing than that of international markets, within a global economic context of
appreciation of the U.S. dollar, rise of interest rates and the oil price (which in a few months rose from USD 35
to 70 per barrel). This also implies restoring trust from the financial sectors and avoid a crisis in the local banking
system.
Undoubtedly, this scenario will imply an economic growth of around 1.5%, taking into account that the growth
of the agricultural sector will be less than expected9, as compared to the year 2017.
It is necessary that, in this new macroeconomic context, the predominance of investment within the
components of aggregate demand persists, followed by private consumption (albeit with a certain lag). In turn,
largely thanks to Brazil's recovery, exports are expected to once again have a positive and significant impact on
GDP.
In sum, this year appears to be critical and challenging for the economic authorities to achieve the
normalization of economic fluctuations, facilitate development, employment and investment conditions of
companies, boost exports, reduce the primary fiscal deficit while maintaining social plans and gradually
accommodating relative prices.
9 The drought in the agricultural core zone affected significantly the growth prospects for 2018. Draught impacts directly the
gross production value of the coarse crop and the loss of the producers: almost 30% volumen loss in the case of soybeans and 21.8% for corn.
| 31 |
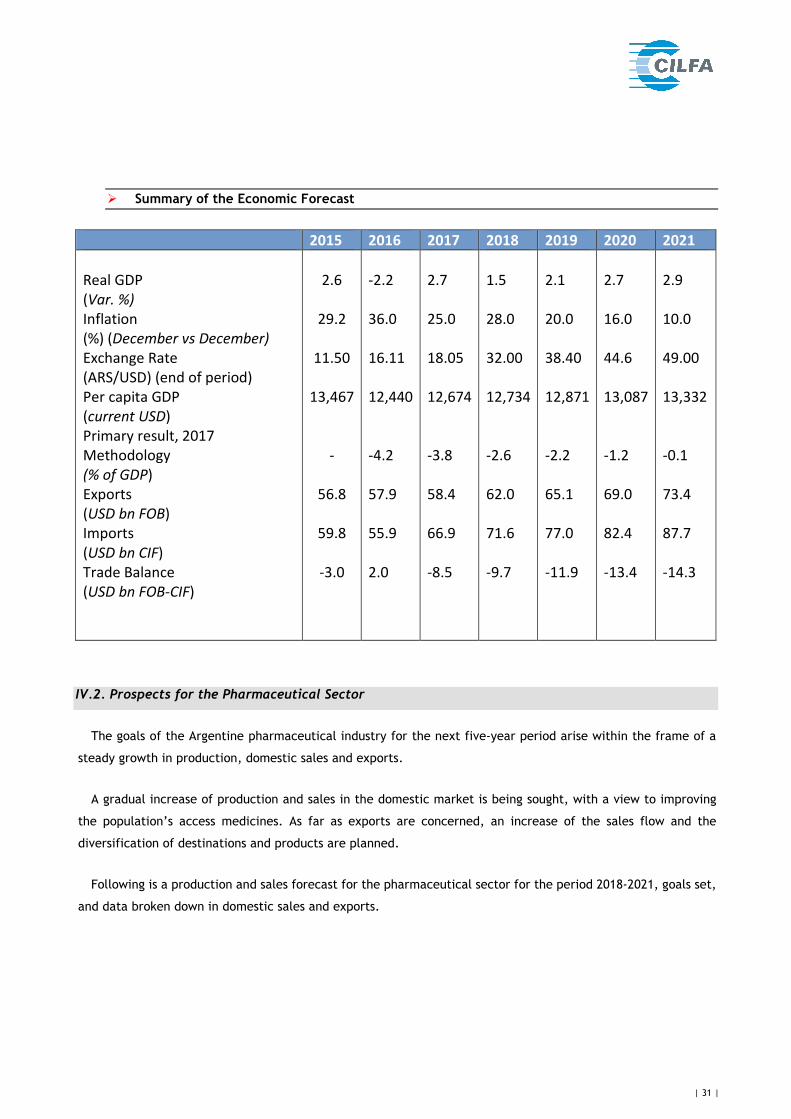
Summary of the Economic Forecast
2015 2016 2017 2018 2019 2020 2021
Real GDP
(Var. %)
Inflation
(%) (December vs December)
Exchange Rate
(ARS/USD) (end of period)
Per capita GDP
(current USD)
Primary result, 2017
Methodology
(% of GDP)
Exports
(USD bn FOB)
Imports
(USD bn CIF)
Trade Balance
(USD bn FOB-CIF)
2.6
29.2
11.50
13,467
-
56.8
59.8
-3.0
-2.2
36.0
16.11
12,440
-4.2
57.9
55.9
2.0
2.7
25.0
18.05
12,674
-3.8
58.4
66.9
-8.5
1.5
28.0
32.00
12,734
-2.6
62.0
71.6
-9.7
2.1
20.0
38.40
12,871
-2.2
65.1
77.0
-11.9
2.7
16.0
44.6
13,087
-1.2
69.0
82.4
-13.4
2.9
10.0
49.00
13,332
-0.1
73.4
87.7
-14.3
IV.2. Prospects for the Pharmaceutical Sector
The goals of the Argentine pharmaceutical industry for the next five-year period arise within the frame of a
steady growth in production, domestic sales and exports.
A gradual increase of production and sales in the domestic market is being sought, with a view to improving
the population’s access medicines. As far as exports are concerned, an increase of the sales flow and the
diversification of destinations and products are planned.
Following is a production and sales forecast for the pharmaceutical sector for the period 2018-2021, goals set,
and data broken down in domestic sales and exports.
| 32 |
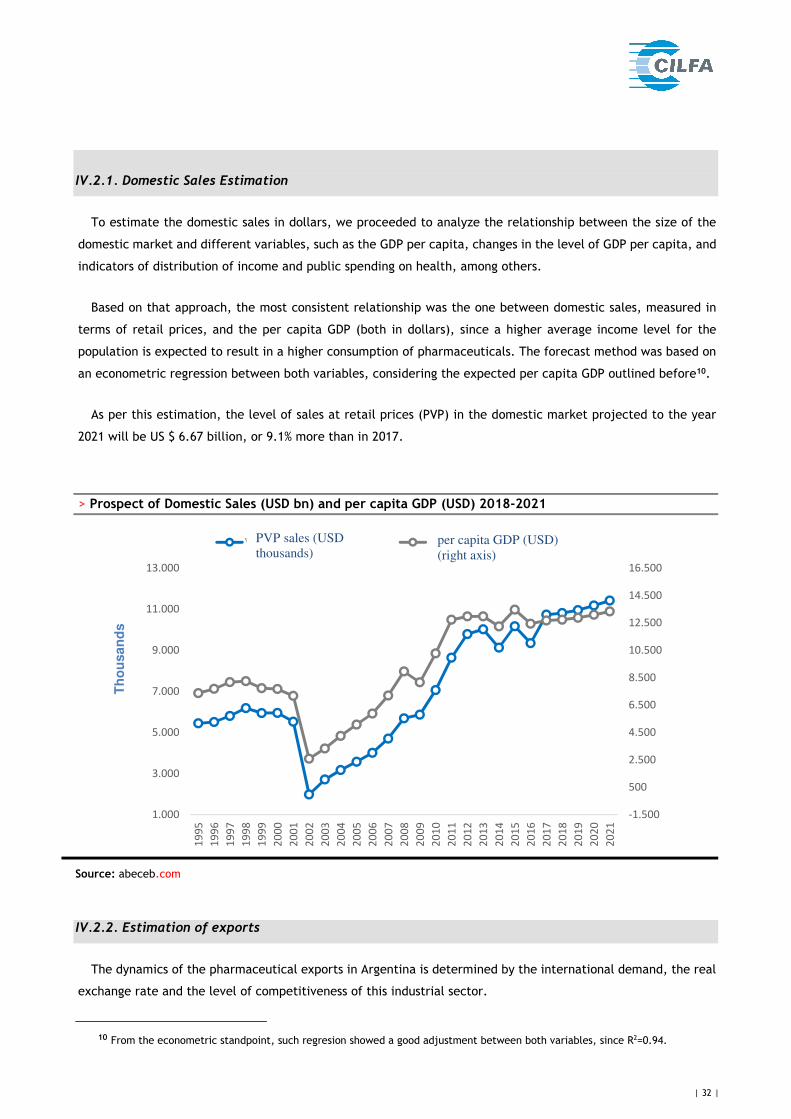
IV.2.1. Domestic Sales Estimation
To estimate the domestic sales in dollars, we proceeded to analyze the relationship between the size of the
domestic market and different variables, such as the GDP per capita, changes in the level of GDP per capita, and
indicators of distribution of income and public spending on health, among others.
Based on that approach, the most consistent relationship was the one between domestic sales, measured in
terms of retail prices, and the per capita GDP (both in dollars), since a higher average income level for the
population is expected to result in a higher consumption of pharmaceuticals. The forecast method was based on
an econometric regression between both variables, considering the expected per capita GDP outlined before10.
As per this estimation, the level of sales at retail prices (PVP) in the domestic market projected to the year
2021 will be US $ 6.67 billion, or 9.1% more than in 2017.
> Prospect of Domestic Sales (USD bn) and per capita GDP (USD) 2018-2021
Source: abeceb.com
IV.2.2. Estimation of exports
The dynamics of the pharmaceutical exports in Argentina is determined by the international demand, the real
exchange rate and the level of competitiveness of this industrial sector.
10 From the econometric standpoint, such regresion showed a good adjustment between both variables, since R2=0.94.
-1.500
500
2.500
4.500
6.500
8.500
10.500
12.500
14.500
16.500
1.000
3.000
5.000
7.000
9.000
11.000
13.000
19
95
19
96
19
97
19
98
19
99
20
00
20
01
20
02
20
03
20
04
20
05
20
06
20
07
20
08
20
09
20
10
20
11
20
12
20
13
20
14
20
15
20
16
20
17
20
18
20
19
20
20
20
21
Mil
es
Ventas PVP (miles de USD) PBI Per Cápita (USD)-eje der.per capita GDP (USD)
(right axis)
Th
ou
san
ds
PVP sales (USD
thousands)
| 33 |
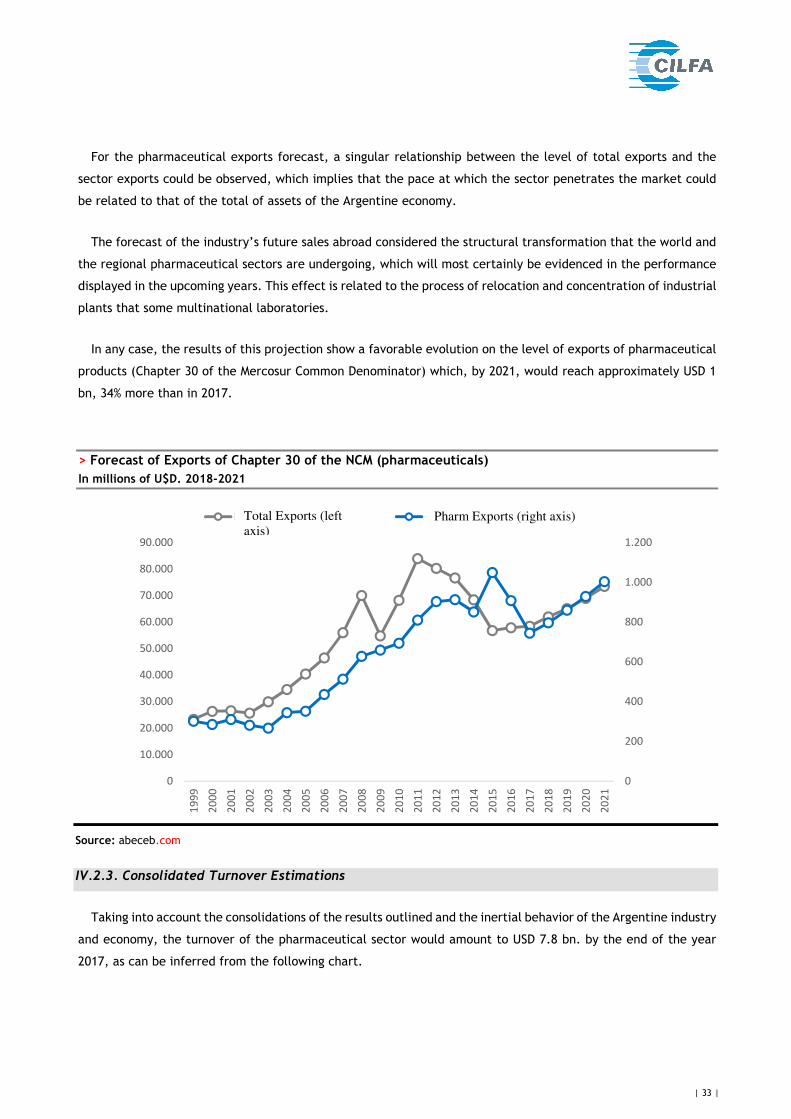
For the pharmaceutical exports forecast, a singular relationship between the level of total exports and the
sector exports could be observed, which implies that the pace at which the sector penetrates the market could
be related to that of the total of assets of the Argentine economy.
The forecast of the industry’s future sales abroad considered the structural transformation that the world and
the regional pharmaceutical sectors are undergoing, which will most certainly be evidenced in the performance
displayed in the upcoming years. This effect is related to the process of relocation and concentration of industrial
plants that some multinational laboratories.
In any case, the results of this projection show a favorable evolution on the level of exports of pharmaceutical
products (Chapter 30 of the Mercosur Common Denominator) which, by 2021, would reach approximately USD 1
bn, 34% more than in 2017.
> Forecast of Exports of Chapter 30 of the NCM (pharmaceuticals)
In millions of U$D. 2018-2021
Source: abeceb.com
IV.2.3. Consolidated Turnover Estimations
Taking into account the consolidations of the results outlined and the inertial behavior of the Argentine industry
and economy, the turnover of the pharmaceutical sector would amount to USD 7.8 bn. by the end of the year
2017, as can be inferred from the following chart.
0
200
400
600
800
1.000
1.200
0
10.000
20.000
30.000
40.000
50.000
60.000
70.000
80.000
90.000
19
99
20
00
20
01
20
02
20
03
20
04
20
05
20
06
20
07
20
08
20
09
20
10
20
11
20
12
20
13
20
14
20
15
20
16
20
17
20
18
20
19
20
20
20
21
Expo Totales (eje izquierdo) Expo Medicamentos (eje derecho)Pharm Exports (right axis) Total Exports (left
axis)
| 34 |
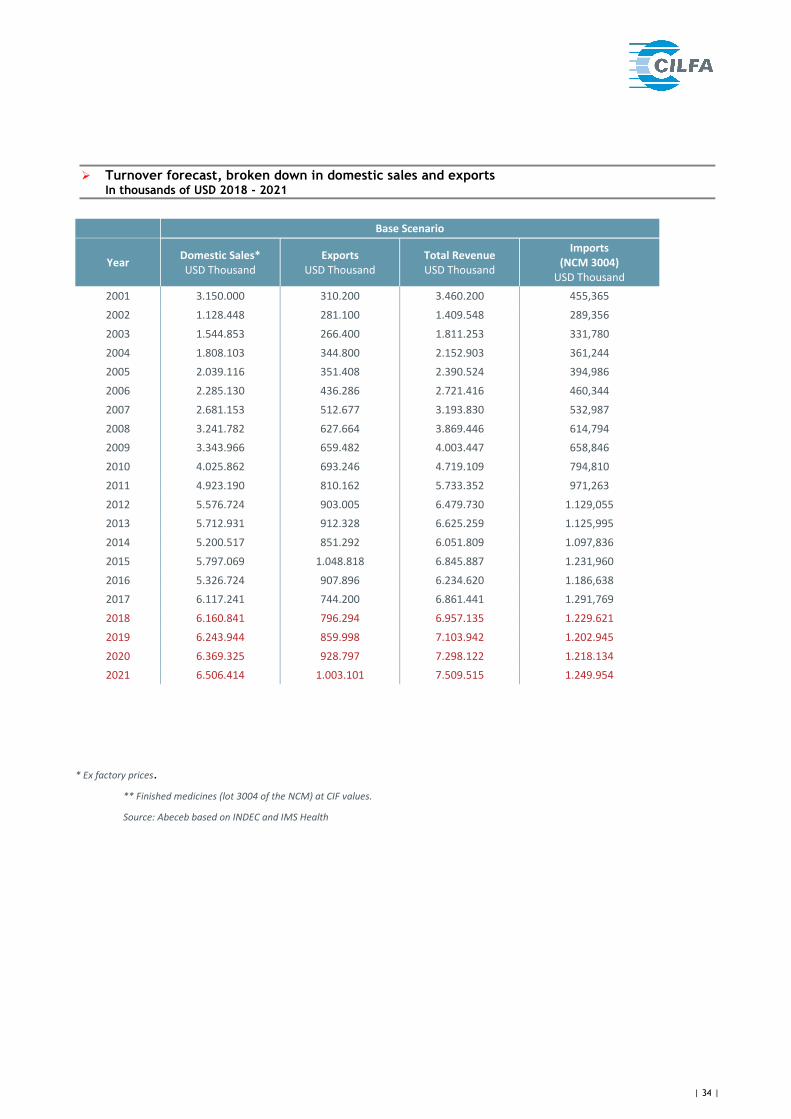
Turnover forecast, broken down in domestic sales and exports In thousands of USD 2018 - 2021
Base Scenario
Year Domestic Sales*
USD Thousand
Exports
USD Thousand
Total Revenue
USD Thousand
Imports
(NCM 3004)
USD Thousand
2001 3.150.000 310.200 3.460.200 455,365
2002 1.128.448 281.100 1.409.548 289,356
2003 1.544.853 266.400 1.811.253 331,780
2004 1.808.103 344.800 2.152.903 361,244
2005 2.039.116 351.408 2.390.524 394,986
2006 2.285.130 436.286 2.721.416 460,344
2007 2.681.153 512.677 3.193.830 532,987
2008 3.241.782 627.664 3.869.446 614,794
2009 3.343.966 659.482 4.003.447 658,846
2010 4.025.862 693.246 4.719.109 794,810
2011 4.923.190 810.162 5.733.352 971,263
2012 5.576.724 903.005 6.479.730 1.129,055
2013 5.712.931 912.328 6.625.259 1.125,995
2014 5.200.517 851.292 6.051.809 1.097,836
2015 5.797.069 1.048.818 6.845.887 1.231,960
2016 5.326.724 907.896 6.234.620 1.186,638
2017 6.117.241 744.200 6.861.441 1.291,769
2018 6.160.841 796.294 6.957.135 1.229.621
2019 6.243.944 859.998 7.103.942 1.202.945
2020 6.369.325 928.797 7.298.122 1.218.134
2021 6.506.414 1.003.101 7.509.515 1.249.954
* Ex factory prices.
** Finished medicines (lot 3004 of the NCM) at CIF values.
Source: Abeceb based on INDEC and IMS Health
| 35 |
V. CONCLUSIONS
The national pharmaceutical industry is building a long-term vision, in terms of its expansion and development
both in the domestic as well as in the international markets, through the increase in the volume of exports to
non-traditional markets as well as by the establishment and consolidation of subsdiaries in the main countries of
Latin America and other nations.
The macroeconomic and sector projections will include a substantial increase of investment, employment and
offer of medicines for the population, which will contribute to promoting their accessibility.
The pharmaceutical industry is an industrial branch with highly qualified labor force, and one of the sectors
that manufacture high added-value products.
The structure of the Argentine pharmaceutical industry shows that the domestically-owned pharmaceutical
laboratories have a more significant presence or share in the market than the multinational companies.
In sum, we consider that the Argentine pharmaceutical industry represents a strategic industry for the socially-
inclusive economy development project being underway in our country:
1. The pharmaceutical industrial plants based in the country ensure its population the normal supply of
affordable medicines, their quality being internationally acknowledged.
2. The existence of locally-owned pharmaceutical companies makes it possible to facilitate the
competition in the market, thus avoiding the existence of monopoly prices.
3. This is a highly technologic industry, with a remarkably skilled workforce in terms of technology and
education; therefore, the result is high added-value production.
4. The 741 million units produced per year by the pharmaceutical industry account for 4.9 % of the
industrial added value of this country. There are 43,000 direct jobs and 120,000 indirect jobs.
5. The industry employs Argentine researchers and scientists, and includes the repatriation of Argentine
scientists that had emigrated. An evidence of this is the human health-related biotech and
bioengineering developments, which are part of the agenda, and projects from Argentine
pharmaceutical laboratories, which add to the growing generation of human capital and ensure
sustainable development.
6. The pharmaceutical industry exports reached USD 744 million in the year 2017 and they are expected
to grow in the next years. The commercial activities developed by companies abroad are diversifying
the destination markets of their products. In fact, exports to non-traditional markets grew more than
six times between the years 2003 and 2017.
| 36 |
7. This industry has a project to increase and expand its activities in the country and abroad, and represents
the sector with the highest number of Argentine companies that develop activities with international
outreach.
In sum, the local pharmaceutical industry is able to maintain their development trend and increase the supply
of goods and services, as well as its productive employment and exports.