Embed Size (px)
Citation preview

SCELTA TRA UN'AUTO ELETTRICA
ED UNA CONVENZIONALE: UN
MODELLO PROBABILISTICO BASATO
SULLA META-ANALISI
Scorrano M., Rotaris L., Danielis R., Giansoldati M.
XX RIUNIONE SCIENTIFICA DELLA SOCIETÀ ITALIANA DI ECONOMIA DEI TRASPORTI E DELLA LOGISTICA, MILANO, 20-22 GIUGNO2018

Research goal: analyzing EV choice
Which attributes?
How important are they?
Meta-analysis
Scenario and policy analysis
Monte-Carlo Simulation
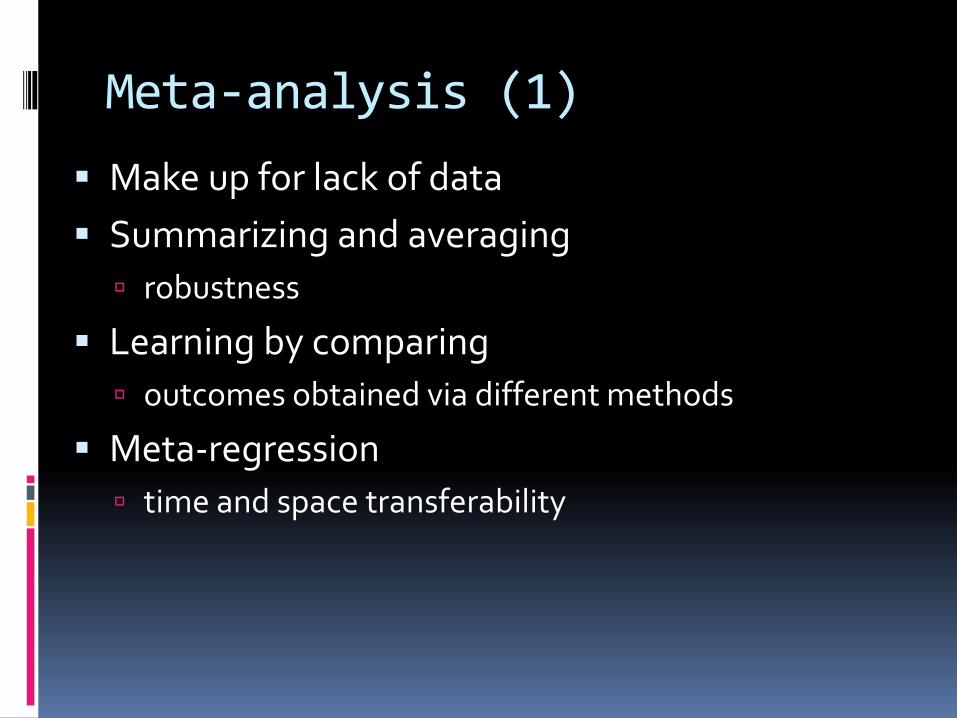
Meta-analysis (1)
Make up for lack of data
Summarizing and averaging
robustness
Learning by comparing
outcomes obtained via different methods
Meta-regression
time and space transferability

…meta-analysis (2)
Accounting for differences of: sampling
sample size, where, when
data collection: SP\RP, CATI, CAPI, face-to-face
model specification model, functional form, interaction terms
metrics used lack of description, currency conversion, reference
points
number of estimates
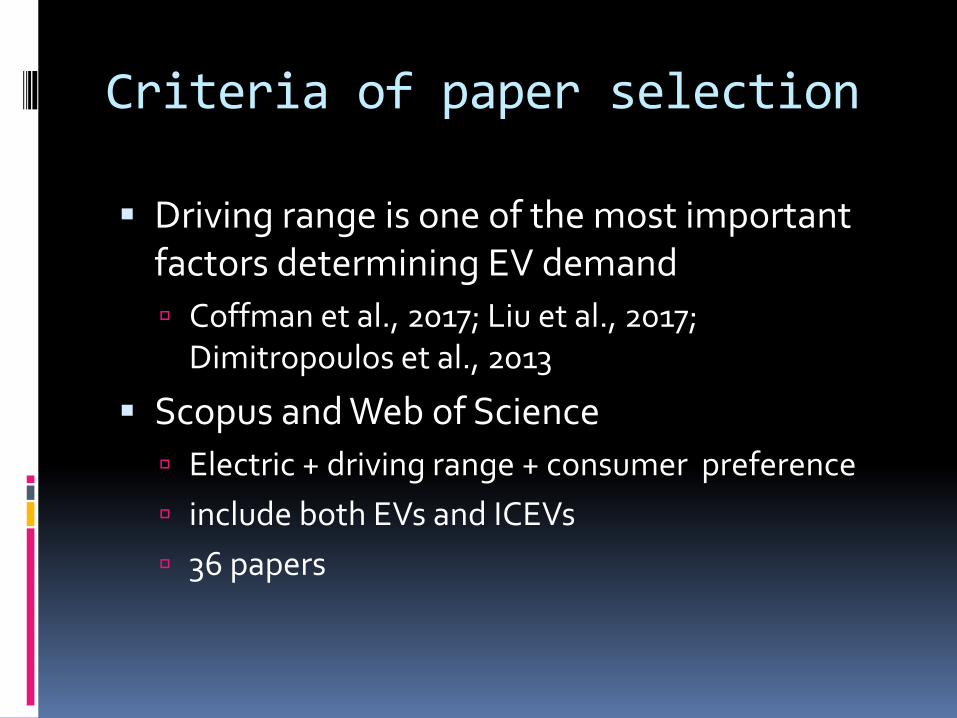
Criteria of paper selection
Driving range is one of the most important factors determining EV demand
Coffman et al., 2017; Liu et al., 2017; Dimitropoulos et al., 2013
Scopus and Web of Science
Electric + driving range + consumer preference
include both EVs and ICEVs
36 papers

Attributes and metrics Price
different currencies and at different years
Fuel costs fuel economy (cent/km) vs. fuel price (€/liter)
Emissions (CO2/km) tailpipe vs. life cycle
Acceleration sec 0-30 miles/h; 0-60 miles/h; 0-100 km/h
Recharging \ Refueling time recharging at home vs. at station
Driving range highly heterogeneous reference values
Operating costs annual \monthly fuel expenses, sometimes including also maintenance,
insurance, and parking for highly heterogeneous (not always specified) reference distance travelled

Random effect summary model The observed coefficient Yi for any study is
given by
the grand mean,
the deviation of the study’s true effect from the grand mean (between study variance),
and the deviation of the study’s observed effect from the study’s true effect (within study variance).

Driving range coeff: linear specification (Non_BEV) Authors Parameter St. Err. Lower Limit Upper Limit Weight (random)
Beggs et al. (1981) 0.0025 0.0003 0.0019 0.0031 5.8%
Golob et al. (1997) 0.0009 0.0003 0.0003 0.0016 5.6%
Tompkins et al. (1998) 0.0014 0.0004 0.0005 0.0023 4.9%
Ewing and Sarigöllü (1998) 0.0024 0.0006 0.0012 0.0036 3.9%
Dagsivik et al. (2002) 0.0019 0.0006 0.0007 0.0030 4.0%
Train and Weeks (2005) 0.0057 0.0022 0.0013 0.0101 0.6%
Hesse et al. (2006) 0.0035 0.0015 0.0005 0.0065 1.1%
Knockaert (2010) 0.0026 0.0005 0.0016 0.0036 4.4%
Christensen et al. (2010) 0.0017 0.0002 0.0014 0.0020 6.7%
Ziegler (2012) 0.0020 0.0004 0.0012 0.0027 5.3%
Chorus et al. (2013) 0.0014 0.0002 0.0011 0.0017 6.7%
Hackbarth and Madlener (2013) 0.0008 0.0003 0.0003 0.0013 6.2%
Jensen et al. (2013) 0.0004 0.0001 0.0001 0.0007 6.8%
Hoen and Koetse (2014) 0.0024 0.0004 0.0016 0.0032 5.2%
Tanaka et al. (2014) 0.0004 0.0000 0.0003 0.0005 7.0%
Valeri and Danielis (2015) 0.0016 0.0002 0.0011 0.0020 6.3%
Dimitropoulos et al. (2016) 0.0025 0.0003 0.0019 0.0031 5.8%
Cherchi (2017) 0.0008 0.0001 0.0005 0.0010 6.8%
Giansoldati et al. (2018) 0.0010 0.0002 0.0006 0.0013 6.7%
Summary Effect 0.00154 0.00133 0.00188

Attributes and summary effects BEV metrics summary lower upper spread/summary
Price € -0.00012 -0.00014 -0.00011 17%
Fuel economy cent €/km -0.02612 -0.03028 -0.02197 32%
CO2 life cycle kg/km -0.00287 -0.00331 -0.00244 30%
Acceleration sec (0 – 100 km/h) -0.05040 -0.07053 -0.03027 80%
Recharging time (at station)
min -0.00122 -0.00154 -0.00089 53%
Driving range km 0.00299 0.00263 0.00335 24%
ASC dummy -0.7746 -1.0368 -0.5124 68%
NON_BEV metrics summary lower upper spread/summary
Price € -0.00013 -0.00015 -0.00012 17%
Fuel economy cent €/km -0.02612 -0.03028 -0.02197 32%
CO2 life cycle kg/km -0.00301 -0.00337 -0.00266 24%
Acceleration sec (0 – 100 km/h) -0.04144 -0.05503 -0.02784 66%
Refueling time min -0.00143 -0.00154 -0.00131 16%
Driving range km 0.00154 0.00133 0.00175 28%

Montecarlo simulation
substituting frequency distributions for the coefficients’ point value of the discrete choice models stochastic sampling obtaining a number of
random draws from the coefficients' probability distribution
estimation of the corresponding EV choice probability
output probability distribution of EV choice

Scenario analysis: base case
Smart Forfour Electric
Smart Forfour Fuel Cell
Nissan Leaf Nissan Pulsar
Price 24,000 € 17,000 € 36,360 € 23,640 €
Fuel economy 0.047 cent €/km 0.067 cent €/km 0.044 cent €/km 0.12 cent €/km
CO2 life cycle 0.07 kg/km 0.10 kg/km 0.07 kg/km 0.117 kg/km
Acceleration 12.7 sec (0 – 100 km/h)
15.9 sec (0 – 100 km/h)
7.9 sec (0 – 100 km/h)
10.7 sec (0 – 100 km/h)
Recharging time (at
station) \ Refueling time 60 min 7 min
30 min 7 min
Driving range 160 km 670 km 300 km 920 km
Summary functional form
Triangular
N draws 10.000
Algorithm Halton

…scenario analysis 1: SMART Prob. Base case Prob. with a subsidy of € 5.000
Mean: 11% Mean: 18%
S.D. 2% S.D. 3%
Min: 5% Min: 9%
Max: 20% Max: 32%

…scenario analysis 1: Leaf\Pulsar
Mean: 7% Mean: 12%
S.D. 2% S.D. 3%
Min: 3% Min: 5%
Max: 15% Max: 23%
Prob Base case Prob With a subsidy of € 5000

…scenario analysis 2:prob E_SMART Prob. with a subsidy of € 7.000
Prob. Base case and driving range km 560
Mean: 11% Mean: 50%
S.D. 2% S.D. 6%
Min: 5% Min: 30%
Max: 20% Max: 69%

…scenario analysis 2: Leaf\Pulsar
Mean: 7% Mean: 50%
S.D. 2% S.D. 7%
Min: 3% Min: 29%
Max: 15% Max: 71%
Prob. with a subsidy of € 7.000
Prob. Base case and driving range km 890

Conclusions
Most important attributes
sensitivity analysis Monte Carlo simulation:
price, driving range, acceleration
charging time, fuel economy, CO2 emissions

…conclusions (2)
Meta-analysis critical factors:
selection criteria, heterogeneity of models, attributes, metrics, functional forms, sample size, data collection techniques
transparency and transferability of metrics used
reference points
Advantages:
ex-ante: how to set a new experiment
ex-post: validation \ comparison of the results obtained
a priori: make up for lack of data

…conclusions (3)
To be done:
Sensitivity analysis
Additional attributes
Uncertainty on exogenous variables (price, driving range, …)

THANK YOU FOR YOUR ATTENTION!