Embed Size (px)
Citation preview
Preprint for “X-ray Standing Wave Techniques” M.J. Bedzyk, in Encyclopedia of Condensed Matter Physics, edited by F. Bassani, G.L. Liedl, P. Wyder (Elsevier, Oxford, 2005), Vol. 6, p. 330-341.
1
Scattering: X-Ray Standing Wave Techniques
Michael J. Bedzyk
Department of Materials Science and Engineering,
Northwestern University,
Evanston, IL 60208, USA
Encyclopedia of Condensed Matter Physics
Elsevier, Oxford 2005
KEYWORDS: X-ray standing waves, structure, bulk-impurity, surface, adsorbate,
interface, liquid-solid, thin film, x-ray diffraction, x-ray reflectivity, x-ray synchrotron,
dynamical diffraction, phase problem, total external reflection, x-ray multilayer mirror
PACS numbers: 61.10.-i, 68.49.Uv, 41.50,+h, 07.85.Qe

Preprint for “X-ray Standing Wave Techniques” M.J. Bedzyk, in Encyclopedia of Condensed Matter Physics, edited by F. Bassani, G.L. Liedl, P. Wyder (Elsevier, Oxford, 2005), Vol. 6, p. 330-341.
2
Introduction The X-ray standing wave (XSW) technique provides an element-specific structural
probe by using x-ray reflectivity to generate a “two-beam” interference field that in turn induces a spatial dependence to the x-ray spectroscopic yields from atoms within the field. The XSW technique is primarily used for resolving the atomic-scale structure at surfaces, interfaces, and thin films with applications spanning a wide scientific range including: materials science, solid-state and soft-condensed-matter physics, environmental-chemistry, geochemistry, biochemistry, and electrochemistry.
As a fundamental wave phenomenon, the superposition of two coherently coupled X-ray plane-waves localizes the X-ray intensity into interference fringes of an X-ray standing wave (XSW) field (Figure 1). This effect, which is produced by an x-ray reflection, makes it possible to attain a periodic structural probe with a length-scale equivalent to the XSW period:
!
D ="
2sin#=2$
Q
, (1)
where λ is the X-ray wavelength, 2θ is the scattering angle between the two coherently coupled wave vectors KR and K0, and Q is the scattering vector defined as:
Q = KR! K
0 . (2)
Q can also be referred to as the standing wave vector, since it points perpendicular to the equal-intensity planes of the XSW and has a magnitude that is the reciprocal of D. Figure 1. Top: A standing wave field formed from the superposition of two traveling plane waves of wavelength λ and intersection angle (scattering angle) 2θ. The standing wave period is D as defined in Eq. 1. Middle: The two traveling planes waves are represented in reciprocal space by wave vectors K0 and KR. K0 = KR = 2π/ λ. The standing wave is defined by standing-wave vector Q defined in Eq. 2. Bottom: Same as the top, but with a larger 2θ angle and therefore a smaller period D.

Preprint for “X-ray Standing Wave Techniques” M.J. Bedzyk, in Encyclopedia of Condensed Matter Physics, edited by F. Bassani, G.L. Liedl, P. Wyder (Elsevier, Oxford, 2005), Vol. 6, p. 330-341.
3
This two-beam reflection condition can be produced by: (1) strong Bragg
diffraction from a single crystal, (2) strong Bragg diffraction from a periodically layered synthetic microstructure, (3) total external reflection (TER) from an X-ray mirror, or (4) weak kinematical Bragg diffraction from a single-crystal thin film. Single crystal Bragg diffraction generates an XSW with a period equivalent to the diffraction plane spacing; typically between 0.5 and 10 ångstroms. Cases (2) and (3) occur at small incident angles (θ) (or small Q) and therefore according to Eq. (1) will generate an XSW with a much longer period; typically 20 to 2000 ångstroms. An XSW can be used as an element-specific spatial probe via the photoelectric effect, which can be observed by photoelectron, photo-ion, fluorescence, or Auger electron emission.
The XSW technique is used to investigate bulk-impurity structures in single crystals and a wide range of surface, interface, and thin film structures. These include semiconductor, metal, and oxide surfaces, electrochemical interfaces, and organic membranes. In all cases the XSW phase is directly linked to the substrate reflecting (or diffracting) lattice planes or interfaces and can thereby be used to directly determine the absolute positions of the selected elements relative to these substrate planes. The accessibility of synchrotron radiation sources (with high brightness, energy tunability, and linear polarization) dramatically increases the sensitivity and applicability of the XSW technique.
X-RAY STANDING WAVES GENERATED BY SINGLE CRYSTAL DYNAMICAL BRAGG DIFFRACTION
An X-ray standing wave generated by single crystal Bragg diffraction can be used to determine the 3D lattice location of bulk impurity atoms and surface adsorbates. Dynamical diffraction theory, which solves Maxwell’s equations in a periodic dielectric with appropriate boundary conditions, is used to describe the fields inside and outside of the crystal. Figure 2. X-ray standing wave field formed in a crystal and above its surface by the interference of incident and Bragg-diffracted X-ray plane waves. The XSW period is equal to the d-spacing “d”. Aligning a XSW nodal (or antinodal) plane with an atomic plane will minimize (or maximize) the characteristic fluorescence yield from that atomic plane.
θ
dCrystal
Fluorescence Detector

Preprint for “X-ray Standing Wave Techniques” M.J. Bedzyk, in Encyclopedia of Condensed Matter Physics, edited by F. Bassani, G.L. Liedl, P. Wyder (Elsevier, Oxford, 2005), Vol. 6, p. 330-341.
4
Theory Consider the two-beam Bragg diffraction condition, described in Figure 2, where
the incident and the Bragg-diffracted X-ray plane waves are expressed as:
!
E0(r ,t) = E
0exp["i(K
0#r "$t)]
EH(r ,t) = E
Hexp["i(K
H#r "$ t)]
. (3)
Here E0 and EH are the complex E-field amplitudes associated with the incident and diffracted X-ray plane-waves; K0 and KH are the respective complex wave vectors inside the crystal; and ω is the X-ray frequency. The two wave vectors are coupled according to the Laue condition:
H = KH! K
0 , (4)
where H = ha *+kb* +lc * is a reciprocal lattice vector. The scalar equivalent of the Laue condition reduces to Bragg's law, ! = 2d
Hsin"
B, where d
H = 2π/|H| is the lattice spacing
of the H = hkl crystal diffraction planes and !B is the geometrical Bragg angle. The
interference between the incident and diffracted plane waves results in a standing-wave field. The normalized intensity of the total E-field that gives rise to the XSW field is:
!
I ",r( ) =E
0+ E
H
2
E0
2
= 1+R(")+ 2 R(") cos(v(") -H #r )[ ]$1 ;
e%µ
z(" )z
& ' (
above the surface
; at depth z below surface,
(5)
where the reflectivity R is related to the E-field amplitude ratio as:
R =EH
E0
2
, (6)
and the XSW phase, v, is identical to the relative phase between the two E-field amplitudes,
!
EH
E0
=E
H
E0
exp(iv) . (7)
From Eq. (1) and (5), one can conclude that for Bragg diffraction the XSW periodicity is equal to the lattice d-spacing of the hkl diffraction planes; that is, D = d
H.
In the following discussion, we will assume the most common case of σ-polarized symmetrical Bragg diffraction from a semi-infinite crystal with 1° < θB < 89°. Figure 2 shows the case of σ-polarization with the vector directions of the two E-fields pointing perpendicular to the scattering plane defined by the two wave vectors. The incident and exit angles of the two wave vectors with respect to the surface are equivalent for a symmetric reflection.
From dynamical diffraction theory, the E-field amplitude ratio is defined as:

Preprint for “X-ray Standing Wave Techniques” M.J. Bedzyk, in Encyclopedia of Condensed Matter Physics, edited by F. Bassani, G.L. Liedl, P. Wyder (Elsevier, Oxford, 2005), Vol. 6, p. 330-341.
5
!
EH
E0
= "F
H
FH
#± #2 "1( ) , (8)
where FH
and FH
are the H and –H structure factors, which describe the superposition of the coherent x-ray scattering from the N atoms within the unit cell as:
!
FH
= FH
exp(i"H
)
=n
0f (H)+
n
/#f ($)+ i
n
//#f ($)[ ] ns (H)
n=1
N
% nD (H) ,
(9)
where sn(H) = exp(iH.•rn) is the geometrical phase factor for the nth atom located at rn relative to the unit cell origin. Dn(H) = exp(-Mn) is the Debye-Waller temperature factor
for the nth atom.
!
n
/
"f and
!
n
//
"f are the real and imaginary wavelength dependent
anomalous dispersion corrections to the atomic form factor
!
n
0
f (H). η is the normalized angle parameter defined as:
!
" =#$% sin(2%
B)+&F
0
& FHF
H
. (10)
In this equation, Δθ = θ - θB is the relative incident angle. ! = (re"2) (#V
c) is a scaling
factor, where
!
re
= 2.818 "10#5 Å is the classical electron radius and Vc is the volume of
the unit cell. (To separate the real and the imaginary parts of a complex quantity A, the notation
!
A = " A + i " " A is used, where ! A and ! ! A are real quantities.) From Eq. (6-10) it can be shown that the reflectivity approaches unity over a very small arc-second angular width w, defined as:
!
w = "#$ % =&1&"#
$ % =1=2' $ F
H$ F H
+ $ $ F 0
2 & $ $ F H$ $ F
H
sin2#B
. (11)
This is the “Darwin width” of the reflectivity curve or “rocking curve”. Using the above dynamical diffraction theory equations (Eq. 7-10), one can show
that the relative phase, v, of the standing wave field decreases by π radians as the incident angle is scanned from the low-angle side to the high-angle side of the rocking curve. According to Eq. (5), this causes the standing-wave antinodal planes to move by a distance of 12 dH in the −H direction. Also from Eq. (5), if
!
n
//
"f = 0, then R = 1, and the intensity at the antinode is four-times the incident intensity, |E0|2, and there is zero intensity at the node. The case of I = 4 at the antinode assumes that the field is being examined above the surface or at a shallow depth where exp(-µzz) ≈ 1.
The Darwin width, w, is dependent on both the structure factors and the wavelength of the incident X-ray beam. For a typical low-index strong Bragg reflection from a inorganic single crystal w is within the range of 5 to 100 microradians (µrad) for X-rays

Preprint for “X-ray Standing Wave Techniques” M.J. Bedzyk, in Encyclopedia of Condensed Matter Physics, edited by F. Bassani, G.L. Liedl, P. Wyder (Elsevier, Oxford, 2005), Vol. 6, p. 330-341.
6
within the range of λ = 0.5 to 2 Å. Figure 3a shows a calculated rocking curve R(η’) and the corresponding phase v(η’) for the GaAs (111) Bragg reflection at Eγ = 15 keV. In this case, w = 40.7 µrad = 8.39 arc-sec. Semi-empirically, the reflectivity-curve has a FWHM = 1.2w. Referring to the identical R(θ) curve in Fig. 3b, notice that the center of the rocking curve is shifted slightly above the geometrical Bragg angle !
B by ~34 µrad. This
shift is the result of refraction at the crystal-air interface. In general, this shift is !" = # $ F
0/ sin 2"
B. The asymmetry in the reflectivity curve, namely the further
diminishing from R = 1 as the angle is increased through the strong Bragg condition, is due to the movement of the XSW. On the high-angle side (η’ < -1) the XSW antinodes align with the strong x-ray absorption planes in the crystal. (See Figure 4.) Therefore absorption is higher than average on the high-angle side and weaker on the low-angle side (η’ > 1) for this case.
Figure 3. (a): The theoretical angle η’ dependence of the reflectivity R and XSW phase v /2π for the GaAs(111) Bragg reflection at Eγ = 15 keV. (b): The corresponding theoretical angle Δθ dependence of the reflectivity and normalized fluorescence yields (Eq. 15) for coherent positions P111= 0.0, 0.25, 0.5 and 0.75 with coherent fraction f111 = 1 and Z(θ) = 1. Referring to Figure 4, this calculation has Ga at the 0,0,0 and As at the 1/4, 1/4, 1/4 position of the cubic zinc blende unit cell. Therefore the P111= 0 curve is the E-field intensity at the Ga site and the P111= 0.75 (or = -0.25) curve is the E-field intensity at the As site. The dashed horizontal line in (a) represents the phase φ/2π of the structure factor. The respective phases of the geometrical structure factors for the Ga and As sublattices are illustrated with respect to the phase scale on the right-hand-side of (a). Figure 4. A [0-11] projection of the zinc-blende GaAs structure showing the [111] projected scale for the lattice positions in units of the d111 d-spacing. The horizontal dashed lines represent the phase of the GaAs (111) structure factor at 15 keV.
0.00
0.25
0.50
0.75
-0.25
1.00
(2!)-1[111]•r
[111][100]
[011]φ/2π
Ga
As
Ga
Asd1113.26Å
Preprint for “X-ray Standing Wave Techniques” M.J. Bedzyk, in Encyclopedia of Condensed Matter Physics, edited by F. Bassani, G.L. Liedl, P. Wyder (Elsevier, Oxford, 2005), Vol. 6, p. 330-341.
7
The exponential damping factor in Eq. (5) accounts for attenuation effects within the crystal, in which case the effective absorption coefficient is defined as:
!
µz"( ) =
µ0
sin"B
1 + # F H
# # F 0
EH
E0
$
% &
'
( )
*
+ # # F H
# # F 0
EH
E0
$
% &
'
( )
#+
,
- -
.
/
0 0
, (12)
where
!
µ0
=2"
#$F
0
" is the linear absorption coefficient. The second and third terms in Eq.
(12) account for the extinction effect that strongly limits the X-ray penetration depth 1/ µ
z for a strong Bragg reflection. For example, the penetration depth for 15-keV X-rays
at the GaAs (111) Bragg reflection goes from 2.62 µm at off-Bragg conditions to 0.290 µm at the center (η’ = 0) of the Bragg rocking curve. The general expression for this minimum penetration depth or extinction length is:
!
"ext
= Vc[4d
Hr
e(F
0
"+ F
HF
H )]
#1 . (13)
X-ray standing wave photo-effect yields
The XSW field established inside the crystal and above the crystal surface induces photoelectron emission from atoms within the field. The excited ions, in turn, emit characteristic fluorescence X-rays and Auger electrons. In the dipole approximation, the photoelectric effect cross section is proportional to the E-field intensity at the center of the atom. (It is necessary to consider higher-order multi-pole terms in the photoelectric cross-section under special conditions; e.g., XSW induced photoemission that is not angle-integrated.) For the discussion that follows, we will assume the dipole approximation, in which case the normalized X-ray fluorescence yield is defined as:
!
Y (") = I(",r ) #(r ) exp[$µf(%)& z] dr , (14)
where !(r ) is the normalized fluorescent atom distribution, and
!
µ f (") is the effective absorption coefficient for the emitted fluorescent x-rays which is dependent on their takeoff angle, α. Upon integration, the normalized XSW yield is given as:
!
Y (" ) = [1+R(" ) + 2 R(" ) fH
cos(v(" )# 2$PH
)] Z (" ) , (15)
where the parameters fH and PH
are the coherent fraction and coherent position, respectively. In more general terms, fH is the amplitude and P
His the phase of the Hth-
order Fourier coefficient of the normalized distribution function:
!
FH
= "(r )uc
# exp(iH $r )dr = fHexp(2%iP
H) . (16)
Z(θ) is the effective-thickness factor, which will be discussed below. Z(θ) = 1 for atoms above the surface of the crystal and at a depth much less than the extinction length, Z(θ) ~ 1.
Preprint for “X-ray Standing Wave Techniques” M.J. Bedzyk, in Encyclopedia of Condensed Matter Physics, edited by F. Bassani, G.L. Liedl, P. Wyder (Elsevier, Oxford, 2005), Vol. 6, p. 330-341.
8
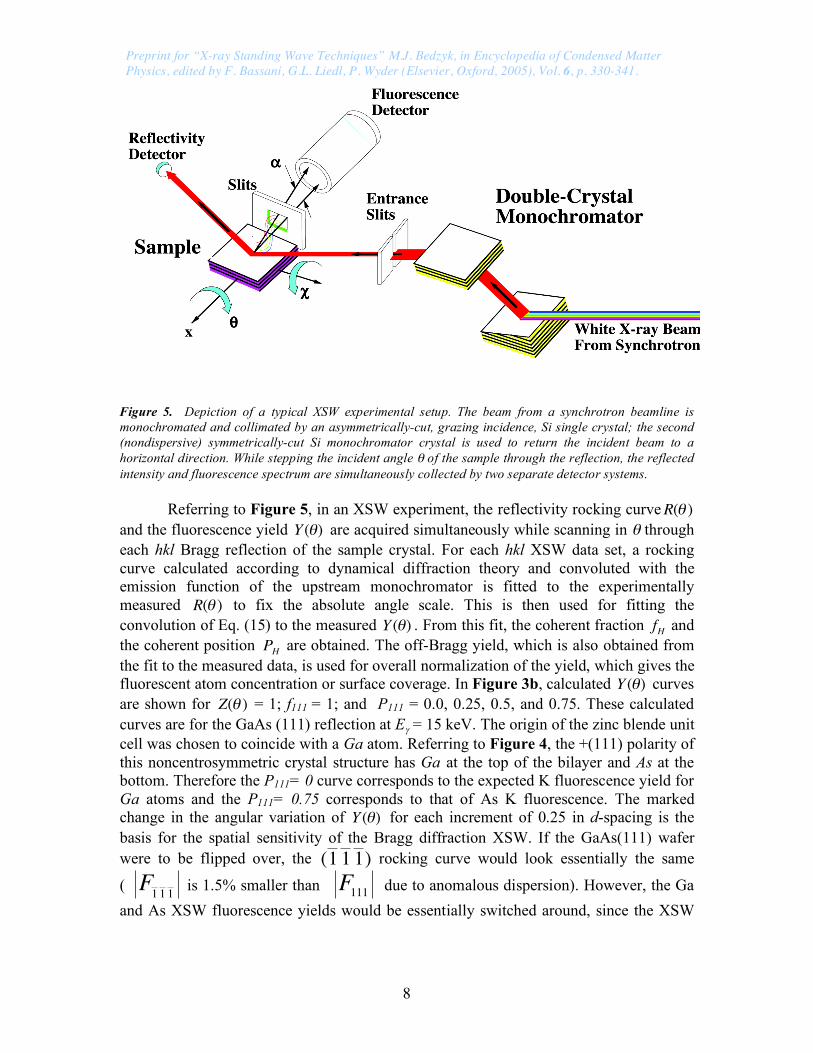
Figure 5. Depiction of a typical XSW experimental setup. The beam from a synchrotron beamline is monochromated and collimated by an asymmetrically-cut, grazing incidence, Si single crystal; the second (nondispersive) symmetrically-cut Si monochromator crystal is used to return the incident beam to a horizontal direction. While stepping the incident angle θ of the sample through the reflection, the reflected intensity and fluorescence spectrum are simultaneously collected by two separate detector systems.
Referring to Figure 5, in an XSW experiment, the reflectivity rocking curveR(! ) and the fluorescence yield Y (!) are acquired simultaneously while scanning in θ through each hkl Bragg reflection of the sample crystal. For each hkl XSW data set, a rocking curve calculated according to dynamical diffraction theory and convoluted with the emission function of the upstream monochromator is fitted to the experimentally measured R(! ) to fix the absolute angle scale. This is then used for fitting the convolution of Eq. (15) to the measured Y (!) . From this fit, the coherent fraction fH and the coherent position
!
PH
are obtained. The off-Bragg yield, which is also obtained from the fit to the measured data, is used for overall normalization of the yield, which gives the fluorescent atom concentration or surface coverage. In Figure 3b, calculated Y (!) curves are shown for Z(! ) = 1; f111 = 1; and P111 = 0.0, 0.25, 0.5, and 0.75. These calculated curves are for the GaAs (111) reflection at Eγ = 15 keV. The origin of the zinc blende unit cell was chosen to coincide with a Ga atom. Referring to Figure 4, the +(111) polarity of this noncentrosymmetric crystal structure has Ga at the top of the bilayer and As at the bottom. Therefore the P111= 0 curve corresponds to the expected K fluorescence yield for Ga atoms and the P111= 0.75 corresponds to that of As K fluorescence. The marked change in the angular variation of Y (!) for each increment of 0.25 in d-spacing is the basis for the spatial sensitivity of the Bragg diffraction XSW. If the GaAs(111) wafer were to be flipped over, the
!
(1 1 1 ) rocking curve would look essentially the same
(
!
F1 1 1
is 1.5% smaller than
!
F111
due to anomalous dispersion). However, the Ga and As XSW fluorescence yields would be essentially switched around, since the XSW
Preprint for “X-ray Standing Wave Techniques” M.J. Bedzyk, in Encyclopedia of Condensed Matter Physics, edited by F. Bassani, G.L. Liedl, P. Wyder (Elsevier, Oxford, 2005), Vol. 6, p. 330-341.
9
antinodes pass through the Ga atomic layers when scanning in angle through the (111) reflection; and pass through the As atomic layers for the
!
(1 1 1 ). Extinction effect and evanescent-wave emission
The effective-thickness factor Z(! ) in Eq. (15) accounts for the θ dependence of the penetration depth of the primary x-ray field (extinction effect) in conjunction with the escape depth, Λ, of the out-going secondary fluorescence x-rays. For atoms at the crystal surface (e.g., adsorbates) or at a depth much smaller than the extinction depth, the effective-thickness factor is constant at Z(! ) = 1 . For atoms evenly distributed throughout the semi-infinite crystal:
!
Z(") =µ0(sin"B )
#1 + µ f ($)
µz (") + µ f ($) , (17)
where µz(! ) is the effective absorption coefficient of the incident X-rays (Eq. 12) and
µ f (! ) is the effective absorption coefficient of the outgoing fluorescence X-rays from the crystal at takeoff angle α. To achieve surface sensitivity of substrate atoms, it is possible to reduce α to a value approaching the critical angle αc of the fluorescence X-rays. Under such conditions, µ f (! ) dominates over µ
z(! ) in Eq. (17) and therefore the
effective thickness factor is constant at Z(θ) = 1. The value of µ f (! ) is dependent on the wavelength ! f of the fluorescence and the index of refraction calculated at λ = λf. The index of refraction is:
n = 1! " ! i# , (18)
where
! =1
2"N
er
e#2
=1
2$ % F
0 , ! =
1
4"µ0# =
1
2$ % % F
0 , (19)
and Ne is the effective electron density of the refractive medium. From the index of
refraction, µ f (! ) can be obtained as:
µ f (! ) =2 2"
# f
(2$ % !2)2+ 4&
2+2$ %!
2[ ]1
2 . (20)
At takeoff angles much greater than the critical angle (i.e.,
!
" >>"C
= 2# ), µ f = µ 0 / sin! . Below the critical angle refraction effects dominate and the escape depth
Λ = µ f
!1 approaches 14 (Nere)! 12 .
The evanescent-wave emission effect can be used to remove the extinction effect of bulk fluorescence in XSW experiments. This is important, since for ! >> αc, the extinction effect tends to dominate over the standing wave effect; causing loss of phase (positional) sensitivity.
Structure determination using coherent fraction and coherent position
Preprint for “X-ray Standing Wave Techniques” M.J. Bedzyk, in Encyclopedia of Condensed Matter Physics, edited by F. Bassani, G.L. Liedl, P. Wyder (Elsevier, Oxford, 2005), Vol. 6, p. 330-341.
10
The coherent fraction fH senses the spread in the spatial distribution of the fluorescent atoms. For simplicity, we subdivide fH into three factors:
!
fH
= CaHD
H , (21)
where C is the ordered fraction, aH
is the geometrical factor, and DH is the Debye-Waller factor. All three factors range in value from 0 to 1.
Consider the general case of a discrete distribution having the same atom located at N different unit cell positions
!
r j = x ja + y jb + z jc , plus an added random distribution of the same atoms. The ordered fraction C is the fraction of the atoms in the distribution that are coherent (or are crystallographically registered) with the substrate crystal lattice. If the atoms’ occupation fractions for the ordered positions are
!
c1, c
2,…,c
N, respectively,
the ordered fraction is:
!
C = c j
j=1
N
" . (22)
At this point it is useful to define the normalized geometrical structure factor SH for the ordered fluorescent-selected atoms:
!
SH
=1
Ccjexp(iH "r
j)[ ]
j =1
N
# . (23)
The geometrical factor is defined as: aH =|SH| (24)
and the coherent position is defined as:
PH =Arg[SH]/2π . (25) Note that the origin for the set of
!
r j (and therefore the origin of PH
) in the unit cell is the same origin that was arbitrarily chosen for generating the structure factor F
H used in Eq.
(8-12). For the simple case of one atomic site, N = 1 , aH= 1 , and P
H is the projected
H•r/2π fractional d-spacing position of the atomic site. For the case of two equally occupied atom sites the geometrical factor reduces to
!
aH
= cos H " (r1#r
2) /2[ ] . (26)
The coherent position in this case is the averaged fractional d-spacing position of the two sites. If the two equally occupied sites have a separation of exactly one-half of a d-spacing along a particular H, then a
H= 0 for that particular H. This is analogous to a
forbidden reflection in crystallography. Again for the case of two sites separated by one-half of a d-spacing, if the site occupation fractions are 2/3 and 1/3, the geometrical fraction will be aH = 1/3 and the coherent position will equal the position of the 2/3 occupied site.
In XSW analysis, the Debye-Waller factor DH accounts for the time-averaged spatial distribution in the H direction due to thermally induced vibrations of the

Preprint for “X-ray Standing Wave Techniques” M.J. Bedzyk, in Encyclopedia of Condensed Matter Physics, edited by F. Bassani, G.L. Liedl, P. Wyder (Elsevier, Oxford, 2005), Vol. 6, p. 330-341.
11
fluorescence-selected ordered atoms about their average lattice positions. In general, individual DH factors can be assigned to the individual sites. In addition to including the dynamic (thermal vibration) distribution, one can also include the static (spatial disordering) distribution. Generally, DH can be expressed in terms of the mean-square vibrational amplitude along the H direction
!
"uH
2 # , as
!
DH
= exp("M ) = exp("2# 2 $uH
2 % dH
2). (27)
XSW measurements are not restricted to being made along the surface-normal direction (i.e., H perpendicular to the crystal surface). They can be performed with respect to any sufficiently strong Bragg reflection of a crystal. A three-dimensional triangulation of the atom site can be obtained by combining XSW measurements by using three mutually non-collinear diffraction vectors. In triangulating an atomic site, the point symmetry of the surface can be used to reduce the number of required XSW measurements. Direct-space imaging
The XSW measured coherent fraction and position are model-independent and correspond to the amplitude fH and phase
!
PH
of the Hth Fourier coefficient of the fluorescence-selected atomic distribution. Therefore, based on the Fourier inversion of Eq. (16), the distribution !(r ) of each fluorescent atomic species can be synthesized directly by the Fourier summation
!
"(r ) =H#"H
=H# f
Hexp i(2$P
H%H &r )[ ] =1+2
H'%HH'0
# fHcos 2$P
H%H &r[ ]
. (28)
The above simplification to a summation of cosine terms makes use of f0 = 1 and the symmetry relationship analogous to Friedel’s law that makes
!
fH
= fH
and
!
PH
= -PH.
Since the summation is limited to allowed bulk reflections, the image ρ(r) generated from the XSW measured fH and PH values, is limited to being a projection into the primitive unit cell of the bulk crystal. The quality (resolution) of the XSW image will depend on the extent in reciprocal space over which the set of fH and P
H values were measured.
As a simple example consider the Ge diamond-cubic crystal structure (identical to zinc blende shown in Figure 4, but with Ga and As replaced by Ge). In Figure 6 the 1D projection of the Ge Fourier components ρhhh are plotted over an interval corresponding to the d111 1D unit cell and then summed according to Eq. (28) to produce the 1D image. The extra oscillations are due to truncating the sum and zeroing all terms higher than hhh = 888.
The resolution of the image in a given [hkl] direction is equivalent to one-half of the smallest d-spacing that has been entered into the summation in that direction. This imaging method in 3D is especially useful for solving multi-site surface adsorbate phases. After this typically 0.5-Å-resolution model-independent analysis step, the measured fH and P
H values can be used to refine the parameters of a structural model (suggested by
the imaging method). This previously discussed model-dependent analysis method has a typical resolution of 0.03 Å.
Preprint for “X-ray Standing Wave Techniques” M.J. Bedzyk, in Encyclopedia of Condensed Matter Physics, edited by F. Bassani, G.L. Liedl, P. Wyder (Elsevier, Oxford, 2005), Vol. 6, p. 330-341.
12
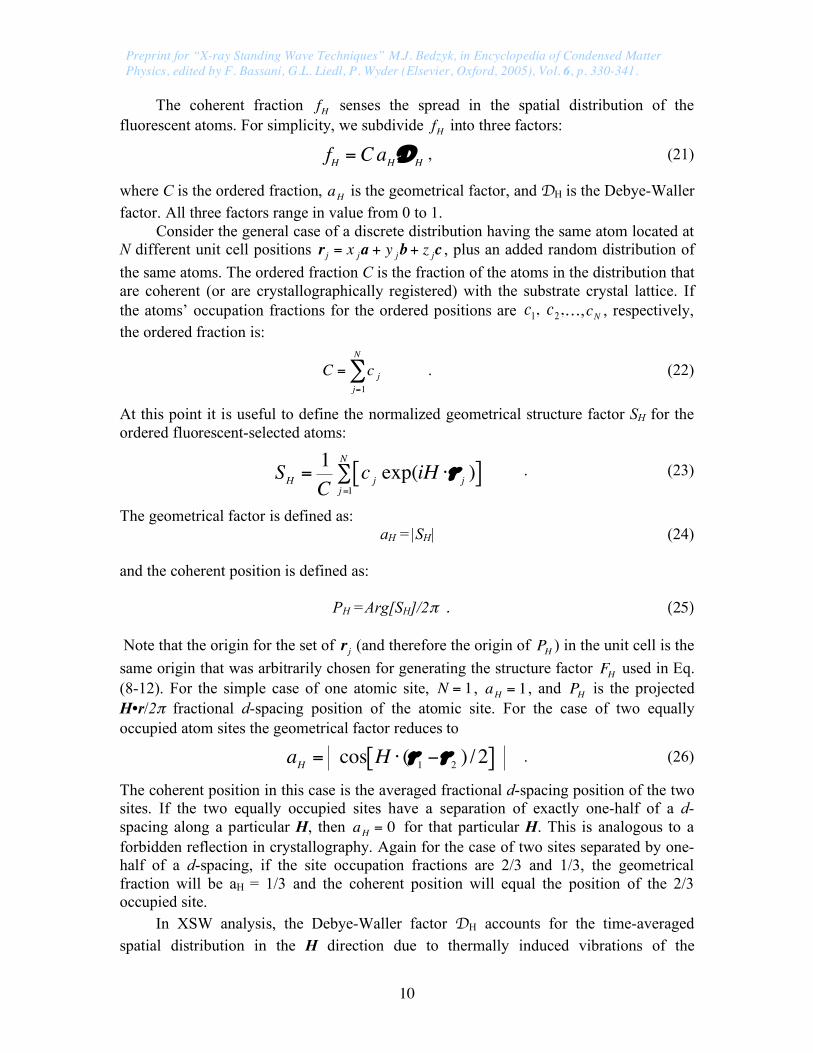
Figure 6. (a) The 1D spatial-dependence of the hhh Fourier-components (ρhhh , h=0 to 8) for the distribution of Ge atomic-centers in the diamond-cubic structure. (Each curve is given a vertical offset of +h.) This is identical to the GaAs zinc-blende structure shown in Figure 4, but with Ga and As replaced by Ge. The spatial interval corresponds to the 1D unit cell along the [111] direction that has a lattice constant corresponding to d111 and has two equally occupied Ge sites at x = ±1/8 (two vertical lines). The h dependence of the amplitude fhhh and phase Phhh for each Fourier component is calculated from Eqs. (23-26) for the case of C=1 and Dhhh=1. In which case fhhh=ahhh=|cos(πh/4)|. This makes f000=f444=f888=1, f111=f333=f555=f777= 1/√2 , and f222=f666=0. P111=P777=P888=0, and P333=P444=P555=1/2. (b) The calculated 1D image ρ(x) of Ge atom centers as summed over the terms from hhh =000 to 888 based on Eq. (28). The curves in (a) can also represent the phase and period of the XSW at the high-angle side (η’<-1) of the Bragg peak for the case of Δf”=0.
Solution to phase problem
Unlike conventional diffraction methods, the XSW method does not lose phase information and can therefore be used directly to map the direct-space structure from the set of Fourier coefficients collected in reciprocal space. The XSW measurement does not lose phase information, because the detector of the E-field is the fluorescent atom itself, lying within the spatial region where the fields interfere coherently with each other. In contrast, in conventional diffraction measurements the relative phase between the diffracted and incident fields is lost, because the intensities of the incident and scattered fields are detected far from this region of coherent spatial overlap.
It should be stressed that the Bragg XSW positional information acquired is in the same absolute coordinate system as used for describing the substrate unit cell. This unit cell and its origin were previously chosen when the structure factors FH and
!
FH
(as defined in Eq. 9) were calculated and used in Eqs. (8), (10), and (12). The XSW phase (v) is directly linked to the phase (φΗ) of the structure factor. Referring to Figures 3a and 4, v asymptotically approaches φ+π at angles well below the strong Bragg condition and v approaches φ, far-above. This corresponds precisely to the XSW antinodes shifting inward from being halfway between the diffraction planes on the low-angle-side to being
-2
0
2
4
6
8
10
Fo
uri
er_
Su
m
!(x
)
0
2
4
6
8
-0.5 -0.25 0 0.25 0.5
hhh F
ouri
er C
om
ponen
ts f
H•c
os(
2"
PH
- H
•r)
x = (2")-1
[111] • r
0
12
3
4
56
7
8(a)
(b)

Preprint for “X-ray Standing Wave Techniques” M.J. Bedzyk, in Encyclopedia of Condensed Matter Physics, edited by F. Bassani, G.L. Liedl, P. Wyder (Elsevier, Oxford, 2005), Vol. 6, p. 330-341.
13
coincident with the diffraction planes on the high-angle side. This XSW-antinode-asymptotic-limit definition for the hkl diffraction planes, defines the diffraction planes as coinciding with the maxima of the real-part of the Hth Fourier component of the scattering density function, which is expressed as Max{Re[ FH exp(-iH•r) ]}. Consequently, the correct values for f0, Δf’ and Δf” must be used to compute the structure factor FH in order to assure an accurate determination of the absolute lattice position of an impurity or adsorbate atom. This is typically quite straight forward, unless the incident energy is near an absorption edge for one of the atoms in the bulk crystal. “Ideal crystals” vs. “real crystals” in Bragg diffraction XSW
According to Eq. (11), the intrinsic Darwin width for a typical strong Bragg diffraction peak in the reflection geometry is between 5 to 100 µrad. To produce useful quantitative information from an XSW measurement, the measured reflectivity curve should reasonably match theory. Only a few exceptionally high quality crystals qualify as ideal crystals according this criterion, e.g. Si, Ge, GaAs and calcite. Most real single crystals contain internal imperfections that result in mosaic spreads that exceed their intrinsic Darwin widths. These mosaic spreads can reduce the reflected intensity and subsequently smear out the standing wave effect. For these real crystals, the measured reflectivity curves cannot be fitted directly by the ideal theoretical reflectivity described by Eq. (6). To make the Bragg diffraction XSW technique adaptable to applications on real crystals, a number of theoretical and experimental methods have been developed. The most formal method is the modification of the XSW theory to include the effect of crystal imperfection on Bragg diffraction. On the other hand, one can make XSW applications under certain conditions where the stringent requirements of the conventional theory are relaxed. One of such condition is when a Bragg reflection occurs near the back-reflection geometry, typically when 87° <!
B< 90° . Under this condition,
Eq. (11) breaks down, and the intrinsic Darwin width is magnified to milliradians. Another condition is when the crystal is very thin; under this condition the kinematical theory can replace the dynamical theory in calculating Bragg reflection. Both of these special-cases, which will be discussed briefly below, are important alternatives when the conventional XSW technique cannot be applied.
An additional practical method for applying XSW to real crystals takes advantage of the high-brilliance of X-ray undulators at third-generation synchrotron sources. With such a source, sufficiently high x-ray intensities can be delivered with beams slitted down to microns in cross section. Thus making it possible to illuminate one isolated “perfect” grain at the sample surface.
The special case of back-reflection XSW
As just mentioned, one means of circumventing problem of analyzing less-than-perfect crystals is to use dynamical diffraction at Bragg angles approaching 90°. In this back-reflection geometry, the angular Darwin width is measured in milliradians instead of microradians.
For !B> 88° , the conventional dynamical diffraction theory breaks down. This is
due to an approximation in the conventional theory that treats the spherical asymptotes of the dispersion surface in reciprocal space as planes. With an extended dynamical diffraction theory the Bragg reflectivity and the standing wave E-field intensity can be

Preprint for “X-ray Standing Wave Techniques” M.J. Bedzyk, in Encyclopedia of Condensed Matter Physics, edited by F. Bassani, G.L. Liedl, P. Wyder (Elsevier, Oxford, 2005), Vol. 6, p. 330-341.
14
properly described for 87° <!B< 90° . In this regime, the Bragg reflectivity has a much
smaller energy width and a much broader angle width. For a given d-spacing, the largest angle width occurs at a wavelength of
!
"b
= 2dH1#
$( % F 0# % F
H)
2
&
' (
)
* + . (29)
In this case,
!
" = 4redH
2(#V
c)$1. For wavelengths slightly smaller, the angular width can be
expressed as
!
w = "#y=1$"#
y=$1 , (30)
where !"y=1 and !"y=#1 are the angular displacements from 90° of the low- and high-angle side of the strong Bragg diffraction condition, respectively. For a symmetric reflection,
!"y =±1 = 2(1# sin" B ) +$( % F 0 m % F H ) . (31)
The back-reflection XSW (BRXSW) technique has been primarily applied to metal and oxide crystals, whose rocking curves typically exhibit angular mosaicity up to ~0.1°. BRXSW is mostly used in combination with XPS (rather than XRF) for UHV surface science measurements of adsorbed molecules and for site-specific valence-band photoemission studies. The special case of thin-film Bragg diffraction XSW
The development of Bragg diffraction XSW from thin films is partially driven by the fact that many crystals can be grown as high quality µm-thick films but not as large-size crystals. Similar to Bragg diffraction from a bulk crystal, Bragg diffraction from a crystalline thin film also generates an X-ray standing wave field. Because the thickness of the film is much less than the extinction depth, kinematical diffraction theory can be used as a good approximation to calculate the intensity of the field. The rocking curve angular width w~1/N, where N is the atom layer thickness of the film. The analytical procedure is fully analogous to that for bulk-reflection XSW. However, the small thickness results in very weak peak reflectivity (typically 0.01%) and consequently very weak (typically 1%) modulation of the XSW induced fluorescence yield from an atom within or above the film. To observe this small modulation above the statistical fluctuation a large number of fluorescence counts must be collected at each angle step of the XSW scan.
X-RAY STANDING WAVES GENERATED BY TOTAL EXTERNAL REFLECTION
While a single-crystal XSW provides a high-resolution probe well-suited for atomic-scale structural determination, this XSW period is too fine of a scale to profile larger, nano structuressuch as the diffuse ion distribution at the solid-liquid interface and organic self-assembled multilayers. To extend the XSW technique to the nanoscale and beyond, one can employ a long-period XSW generated by total external reflection (TER) from a mirror surface or generated by Bragg diffraction from a periodically layered synthetic microstructure (LSM). Because the reflection condition in these two
Preprint for “X-ray Standing Wave Techniques” M.J. Bedzyk, in Encyclopedia of Condensed Matter Physics, edited by F. Bassani, G.L. Liedl, P. Wyder (Elsevier, Oxford, 2005), Vol. 6, p. 330-341.
15
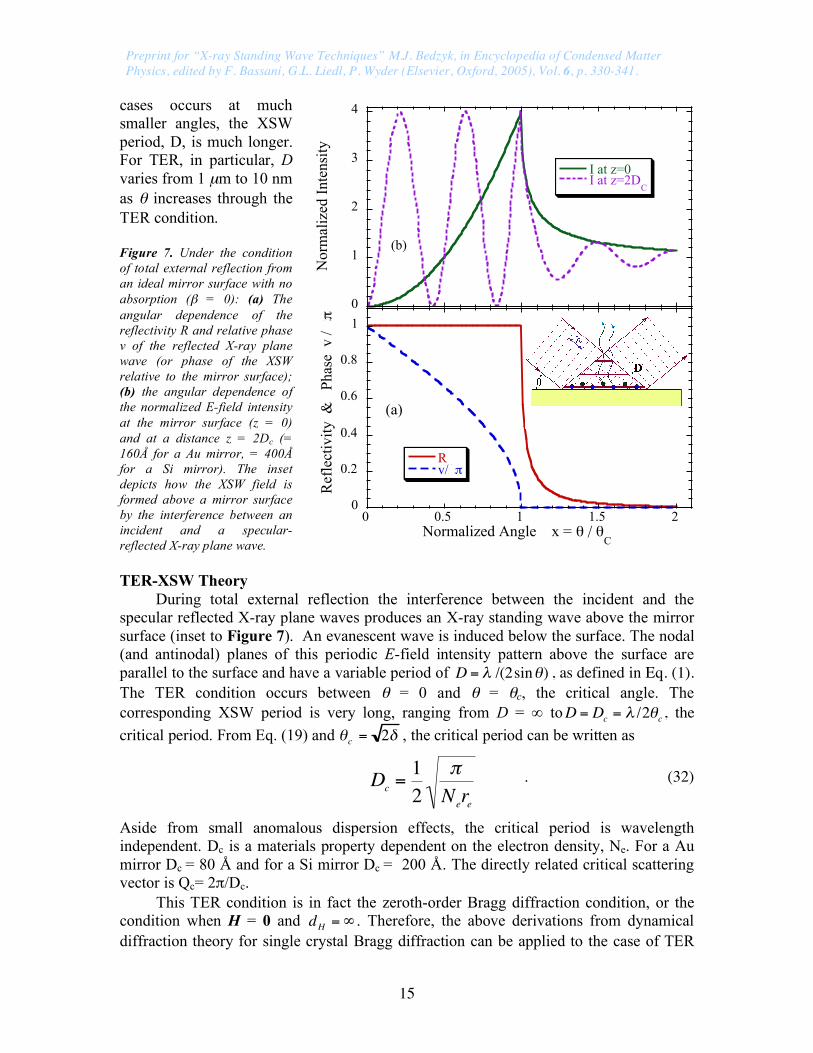
cases occurs at much smaller angles, the XSW period, D, is much longer. For TER, in particular, D varies from 1 µm to 10 nm as θ increases through the TER condition. Figure 7. Under the condition of total external reflection from an ideal mirror surface with no absorption (β = 0): (a) The angular dependence of the reflectivity R and relative phase v of the reflected X-ray plane wave (or phase of the XSW relative to the mirror surface); (b) the angular dependence of the normalized E-field intensity at the mirror surface (z = 0) and at a distance z = 2Dc (= 160Å for a Au mirror, = 400Å for a Si mirror). The inset depicts how the XSW field is formed above a mirror surface by the interference between an incident and a specular-reflected X-ray plane wave. TER-XSW Theory
During total external reflection the interference between the incident and the specular reflected X-ray plane waves produces an X-ray standing wave above the mirror surface (inset to Figure 7). An evanescent wave is induced below the surface. The nodal (and antinodal) planes of this periodic E-field intensity pattern above the surface are parallel to the surface and have a variable period of D = ! /(2sin") , as defined in Eq. (1). The TER condition occurs between θ = 0 and θ = θc, the critical angle. The corresponding XSW period is very long, ranging from D = ∞ to
!
D = Dc
= " /2#c, the
critical period. From Eq. (19) and !c= 2" , the critical period can be written as
!
Dc=1
2
"
Nere
. (32)
Aside from small anomalous dispersion effects, the critical period is wavelength independent. Dc is a materials property dependent on the electron density, Ne. For a Au mirror Dc = 80 Å and for a Si mirror Dc = 200 Å. The directly related critical scattering vector is Qc= 2π/Dc.
This TER condition is in fact the zeroth-order Bragg diffraction condition, or the condition when H = 0 and d
H=! . Therefore, the above derivations from dynamical
diffraction theory for single crystal Bragg diffraction can be applied to the case of TER
0
0.2
0.4
0.6
0.8
1
0 0.5 1 1.5 2
Rv/2π
Ref
lect
ivity
&
Phas
e v
/ 2π
Normalized Angle x = θ / θC
(a)
0
1
2
3
4
I at z=0I at z=2D
C
Nor
mal
ized
Inte
nsity
(b)
Preprint for “X-ray Standing Wave Techniques” M.J. Bedzyk, in Encyclopedia of Condensed Matter Physics, edited by F. Bassani, G.L. Liedl, P. Wyder (Elsevier, Oxford, 2005), Vol. 6, p. 330-341.
16
by substituting F0 for F
H. In which case, Eq. (10) becomes
!
" = # " + i # # " =$2% 2 + &F
0
&F0
, (33)
with the substitutions
!
" # =1$ 2x 2 and " " # = 2x2y , (34)
where x = ! /!c is the normalized angle parameter and y = ! /" is the absorption factor.
From Eq. (8), the complex E-field amplitude ratio becomes
!
ER
E0
= " # ± #2 "1( ) =x " x
2 "1" iy
x + x2 "1" iy
=ER
E0
exp(iv) , (35)
where
!
ER
is the complex amplitude of the reflected plane wave. This amplitude ratio is identical to that derived from classical Fresnel theory. For the simple case of no absorption, where ! = 0 , the reflectivity is
!
R =ER
E0
2
=1, 0 " x "1
8x4 # 8x 3 x
2 #1 + 4x x2 #1 # 8x 2 +1, x >1
$ % &
, (36)
and the phase is
!
v =cos
"1(2x
2 "1), 0 # x #1
0, x >1
$ % &
. (37)
Referring to Figure 7a, the phase at the mirror surface decreases from π to 0 as the mirror is tilted through the total reflection condition. Thus, at the mirror surface, where z = 0 , the reflected plane wave is completely out of phase with the incident plane wave when θ = 0. As the incident angle is increased, the phase decreases smoothly until it is completely in phase at ! = !
c. Therefore, at θ = 0, a standing wave node is at the mirror
surface, and the first antinode is at infinity. As θ increases, the first antinode moves in from infinity toward the mirror surface, until it coincides with the mirror surface upon reaching ! = !
c. At the same time, the second, third, and higher-order antinodes of the
standing wave also move toward the surface, as the period D decreases based on Eq. (1). The normalized E-field intensity above the mirror surface can be expressed as
!
I (" ,z) =E
0+E
R
2
E0
2= 1+R + 2 R cos(v #Qz) . (38)
Figure 7b shows the angular dependence of the E-field intensity at z = 0 (the mirror surface) and at z = 2Dc. The fluorescence signal for an ideally narrow single atomic plane fixed at these heights would have the same angular dependence.
The normalized fluorescence yield from an arbitrary distribution of atoms ρ(z) above the mirror surface can be obtained by integrating over all values of z:

Preprint for “X-ray Standing Wave Techniques” M.J. Bedzyk, in Encyclopedia of Condensed Matter Physics, edited by F. Bassani, G.L. Liedl, P. Wyder (Elsevier, Oxford, 2005), Vol. 6, p. 330-341.
17
Y (!) = I(!,z) "(z) dzz =0
z=#
$ . (39)
With I(θ,z) calculated with Eq. (38), the atom distribution profile ρ(z) can be obtained by assuming a modeled distribution and fitting it to the measured yield Y(θ). For the specific cases of δ-function atom distributions in a plane at z = xD
c, there are x + 1
2 modulations between ! = 0 and ! = !
c. The extra 12 modulation is due to the π phase shift in v.
With TER-XSW, the Fourier transform of an atom distribution is measured over a continuous range in Q = 2π/D, with variable period D ranging from roughly 100 Å to 1 µm. Therefore, TER-XSW is ideally suited to measure surface and interface structures of length scales in the range of 50 to 2000 Å.
The above treatment accurately describes the X-ray E-fields at and above the mirror surface for the simple case of one interface with vacuum (or air). To apply TER-XSW as a probe for studying liquid-solid interfacial structures or organic films deposited on a solid surface, it is necessary to include reflection, refraction, and absorption effects from the layers that lie between the substrate surface and the vacuum (or air). This can be accomplished by making use of Parratt’s recursion formulation to calculate the transmitted and reflected fields at any interface. These same fields can then be calculated at any point within the slab by appropriately accounting for the X-ray absorption and refraction effects on the fields as they travel from the interface to the point. The TER-XSW method is primarily used to profile nanoscale heavy-atom (or -ion) distributions in organic films and at electrified liquid/solid interfaces. X-RAY STANDING WAVES FROM LAYERED SYNTHETIC MICROSTRUCTURES
For Bragg diffraction purposes, a layered-synthetic microstructure (LSM) is fabricated (typically by sputter deposition) to have a depth-periodic layered structure consisting of 10 to 200 layer pairs of alternating high- and low-electron density materials, such as Mo and Si. Sufficient uniformity in layer thickness is obtainable in the range between 10 and 150 Å (d-spacing of fundamental diffraction planes from 20 Å to 300 Å). Because of the rather low number of layer pairs that affect Bragg diffraction, these optical elements (when compared to single crystals) have a significantly wider energy band pass and angular reflection width. The required quality of a LSM is that experimental reflection curves compare well with dynamical diffraction theory, and peak reflectivities are as high as 80%. Therefore, a well-defined XSW can be generated and used to probe structures deposited on an LSM surface with a periodic scale equivalent to the rather large d-spacing. To a good approximation, the first-order Bragg diffraction planes coincide with the centers of the high-density layers of the LSM. Above the surface of the LSM, the XSW period is again defined by Eq. (1). The reflectivity can be calculated by using Parratt’s recursion formulation. This same optical theory can be extended to allow the calculation of the E-field intensity at any position within any of the slabs over an extended angular range that includes TER. Then, Eq. (39) is used to calculate the fluorescence yield. The LSM-XSW method is primarily used to determine atom (or ion) distributions in deposited organic films or at electrified liquid/solid interfaces. As an example the simulated reflectivity and fluorescence yields for a d=180 Å Si/Mo LSM is shown in Figure 8. As can be seen the modulation pattern of the yield is
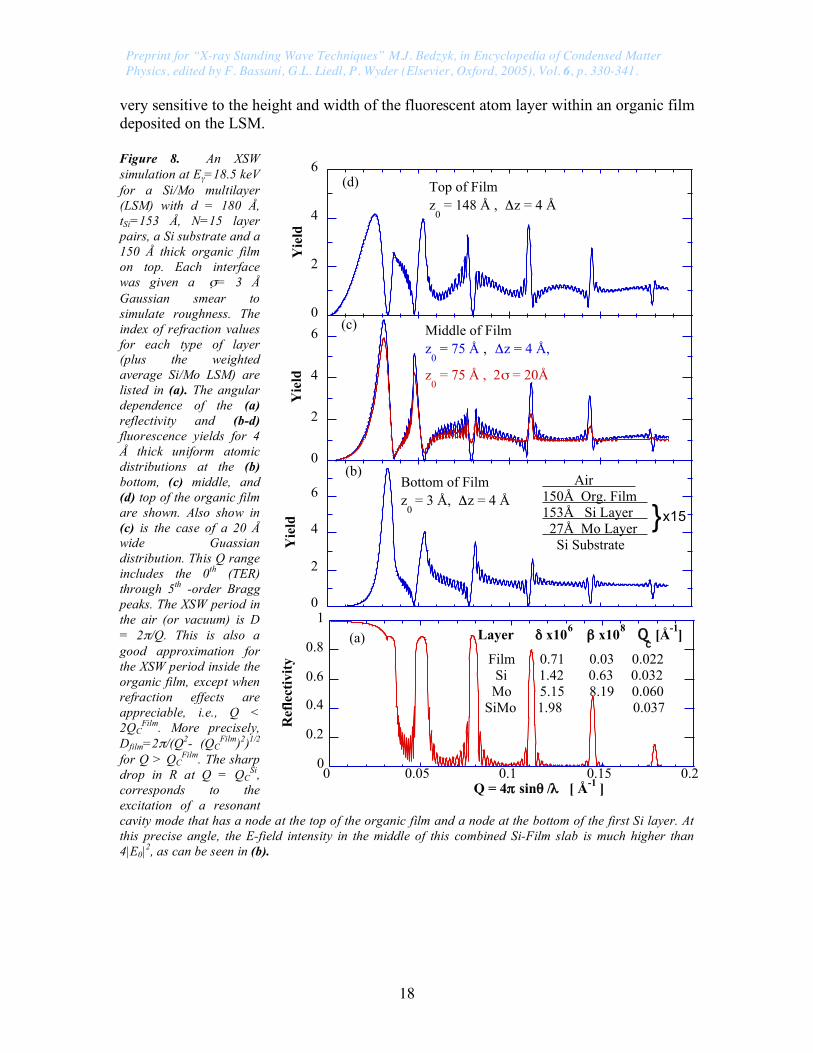
Preprint for “X-ray Standing Wave Techniques” M.J. Bedzyk, in Encyclopedia of Condensed Matter Physics, edited by F. Bassani, G.L. Liedl, P. Wyder (Elsevier, Oxford, 2005), Vol. 6, p. 330-341.
18
very sensitive to the height and width of the fluorescent atom layer within an organic film deposited on the LSM. Figure 8. An XSW simulation at Eγ=18.5 keV for a Si/Mo multilayer (LSM) with d = 180 Å, tSi=153 Å, N=15 layer pairs, a Si substrate and a 150 Å thick organic film on top. Each interface was given a σ = 3 Å Gaussian smear to simulate roughness. The index of refraction values for each type of layer (plus the weighted average Si/Mo LSM) are listed in (a). The angular dependence of the (a) reflectivity and (b-d) fluorescence yields for 4 Å thick uniform atomic distributions at the (b) bottom, (c) middle, and (d) top of the organic film are shown. Also show in (c) is the case of a 20 Å wide Guassian distribution. This Q range includes the 0th (TER) through 5th -order Bragg peaks. The XSW period in the air (or vacuum) is D = 2π/Q. This is also a good approximation for the XSW period inside the organic film, except when refraction effects are appreciable, i.e., Q < 2QC
Film. More precisely, Dfilm=2π/(Q2- (QC
Film)2)1/2 for Q > QC
Film. The sharp drop in R at Q = QC
Si, corresponds to the excitation of a resonant cavity mode that has a node at the top of the organic film and a node at the bottom of the first Si layer. At this precise angle, the E-field intensity in the middle of this combined Si-Film slab is much higher than 4|E0|2, as can be seen in (b).
0
2
4
6
Yie
ld
Top of Filmz
0 = 148 Å , !z = 4 Å
(d)
0
2
4
6
Yie
ld
Middle of Filmz
0 = 75 Å , !z = 4 Å,
z0 = 75 Å , 2" = 20Å
(c)
0
2
4
6
Yie
ld
Bottom of Filmz
0 = 3 Å, !z = 4 Å
(b) Air 150Å Org. Film 153Å Si Layer 27Å Mo Layer Si Substrate
0
0.2
0.4
0.6
0.8
1
0 0.05 0.1 0.15 0.2
Ref
lect
ivit
y
Q = 4# sin$ /% [ Å-1 ]
(a) Layer & x106 ' x10
8 Q
c [Å
-1]
Film 0.71 0.03 0.022 Si 1.42 0.63 0.032 Mo 5.15 8.19 0.060 SiMo 1.98 0.037
}x15

Preprint for “X-ray Standing Wave Techniques” M.J. Bedzyk, in Encyclopedia of Condensed Matter Physics, edited by F. Bassani, G.L. Liedl, P. Wyder (Elsevier, Oxford, 2005), Vol. 6, p. 330-341.
19
FURTHER READING Authier A (2001) Dynamical Theory of X-ray Diffraction. Oxford University Press, New
York Batterman BW, Cole H (1964) Dynamical diffraction of X-rays by perfect crystals. Rev
Mod Phys 36:681-717 Becker RS, Golovchenko JA, Patel JR (1983) X-ray evanescent-wave absorption and
emission. Phys Rev Lett 50:153-156. Bedzyk MJ and Materlik G (1985) Two-beam dynamical diffraction solution of the phase
problem: A determination with X-ray standing waves. Phys Rev B 32:6456-6463 Bedzyk MJ, Bommarito GM, Schildkraut JS (1989) X-ray standing waves at a reflecting
mirror surface. Phys Rev Lett 62:1376-1379 Born M, Wolf E, Bhatia AB (1999) Principles of Optics: Electromagnetic Theory of
Propagation, Interference and Diffraction of Light. New York: Cambridge University Press.
Cheng L, Fenter P, Bedzyk MJ, Sturchio NC (2003) Fourier-expansion solution of atom distributions in a crystal using x-ray standing waves, Phys. Rev. Lett. 90, 255503-1 -4.
Golovchenko JA, Patel JR, Kaplan DR, Cowan PL, Bedzyk MJ (1982) Solution to the surface registration problem using X-ray standing waves. Phys Rev Lett 49:560-563
Parratt LG (1954) Surface studies of solids by total reflection of X-rays. Phys Rev 95:359-369
Tolan M (1999) X-ray scattering from soft-matter thin films, Springer-Verlag, Berlin Vartanyants IA, Kovalchuk MV (2001) Theory and applications of X-ray standing waves
in real crystals. Rep Prog Phys 64:1009-1084 Wang J, Bedzyk MJ, Caffrey M (1992) Resonance-enhanced X-rays in thin-films - a
structure probe for membranes and surface-layers, Science 258: 775-778 Woodruff DP (1998) Normal incidence X-ray standing wave determination of adsorbate
structures. Prog Surf Sci 57:1-60 Zegenhagen J (1993) Surface structure determination with X-ray standing waves. Surf Sci
Rep18:199-271 Zegenhagen J, Kazimirov A, (guest editors) (2004) Focus on X-ray standing waves.
Synchrotron Radiation News 17: 2-53

Preprint for “X-ray Standing Wave Techniques” M.J. Bedzyk, in Encyclopedia of Condensed Matter Physics, edited by F. Bassani, G.L. Liedl, P. Wyder (Elsevier, Oxford, 2005), Vol. 6, p. 330-341.
20
NOMENCLATURE: Anomalous dispersion corrections ......... Δf’ and Δf” Atomic form factor .......... f0(H) Classical electron radius [Å] ..... re Coherent fraction ...... fH Coherent position ...... PH Critical angle [radians] ... θc Critical Period [Å] ..... Dc Critical scattering vector [Å-1] .... Qc Darwin width [radians] ..... w Debye-Waller factor ...... D(H) Diffraction plane spacing [Å] .... d Effective electron density [Å-3] ..... Ne Effective linear absorption coefficient [Å-1] .... µz Effective thickness factor [unitless] .... Z(θ) E-Field amplitude ratio ......... EH/E0 Takeoff emission angle [radians] .... α Extinction length [Å] ....... Λext Gamma scale factor ....... Γ Geometrical factor .... aH Geometrical structure factor .... SH Geometrical phase factor .... sH Incident angle [radians] ........... θ Index of refraction .... n = 1 - δ - iβ linear absorption coefficient [Å-1] ...............µ0 Normalized E-field intensity ...... I Normalized angle parameter ....... η Normalized Atomic distribution function......... ρ(r) Normalized Atomic distribution Fourier Coefficient......... FH Normalized yield ......... Y Ordered fraction ......... C Phase of structure factor [radians] .... φΗ Phase of XSW [radians] ......... v X-ray Photon energy [keV] ......... Eγ Reciprocal lattice vector [Å-1] .......... H Reflectivity ................. R Scattering vector [Å-1] .......... Q Structure factor .................. FH Unit cell atomic position vector [Å] .... r Wave vector [Å-1] .................. K Wavelength [Å] ....................... λ Vibrational amplitude (rms) [Å] ..... <u2
H>1/2 Volume of unit cell [Å3] ..... Vc XSW Period [Å] ..................... D