Embed Size (px)
Citation preview
Coherent Anti-Stokes Raman Scattering (CARS) for Quantitative
Temperature and Concentration Measurements in a High-Pressure Gas
Turbine Combustion Test Rig Robert P. Lucht and Jay P. Gore
Purdue University, W. Lafayette, IN
Supersonics NRA Annual Review Cleveland, OH January 27, 2010
Acknowledgments
• Graduate students Mathew P. Thariyan (PhD), Vijaykumar Ananthanarayanan (M.S., now at Cummins), and Aizaz H. Bhuiyan (PhD), Senior Research Engineer Scott E. Meyer, Senior Research Associate Sameer V. Naik, Postdoc Dr. Ning Chai
• Technical advice from Drs. Nader Rizk, William Cummings, Mohan Razdan, Vic Oechsle, Dan Nickolaus, M. S. Anand, and Duane Smith at Rolls Royce Corporation in Indianapolis, Indiana
• Funding from NASA Glenn under Cooperative Agreement Number NNX07AC90A , technical discussions with Drs. Yolanda Hicks, Clarence Chang, and Randy Locke
Motivation
• To demonstrate dual-pump CARS measurements of CO2, N2 and temperature in the gas turbine combustor over a wide range of simulated supersonic flight conditions.
• To obtain high-quality data in the reacting flow field downstream of the NASA lean direct injection array for comparison with advanced computational models.
Outline of the Presentation
• Optically Accessible Gas Turbine Combustor Facility
• Dual-Pump CARS Measurements: Challenges and Optical System
• Temperature Measurements: PDFs, Mean Profiles, Standard Deviation Profiles
• Conclusions and Accomplishments
• Future Work
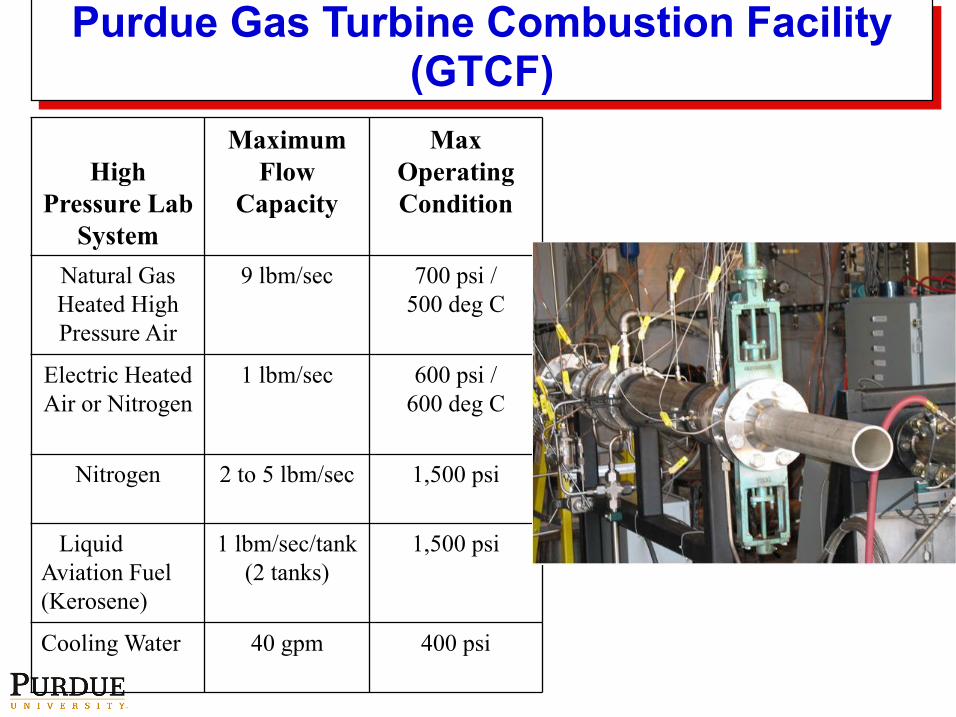
Purdue Gas Turbine Combustion Facility (GTCF)
High Pressure Lab
System
Maximum Flow
Capacity
Max Operating Condition
Natural Gas Heated High Pressure Air
9 lbm/sec 700 psi / 500 deg C
Electric Heated Air or Nitrogen
1 lbm/sec 600 psi / 600 deg C
Nitrogen 2 to 5 lbm/sec 1,500 psi
Liquid Aviation Fuel (Kerosene)
1 lbm/sec/tank (2 tanks)
1,500 psi
Cooling Water 40 gpm 400 psi
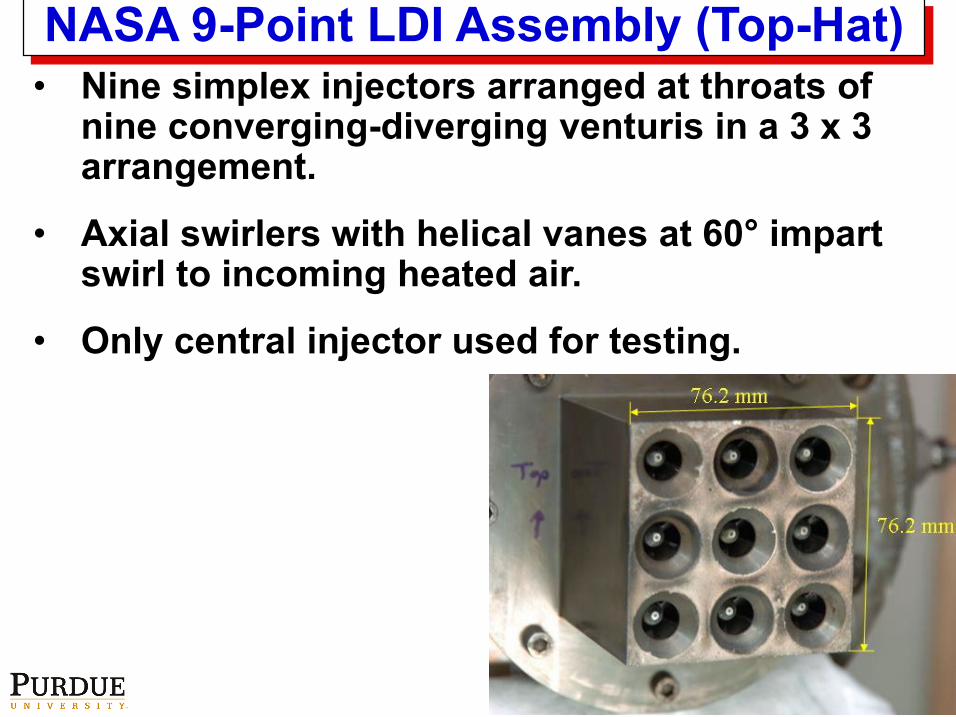
NASA 9-Point LDI Assembly (Top-Hat)• Nine simplex injectors arranged at throats of
nine converging-diverging venturis in a 3 x 3 arrangement.
• Axial swirlers with helical vanes at 60° impart swirl to incoming heated air.
• Only central injector used for testing.
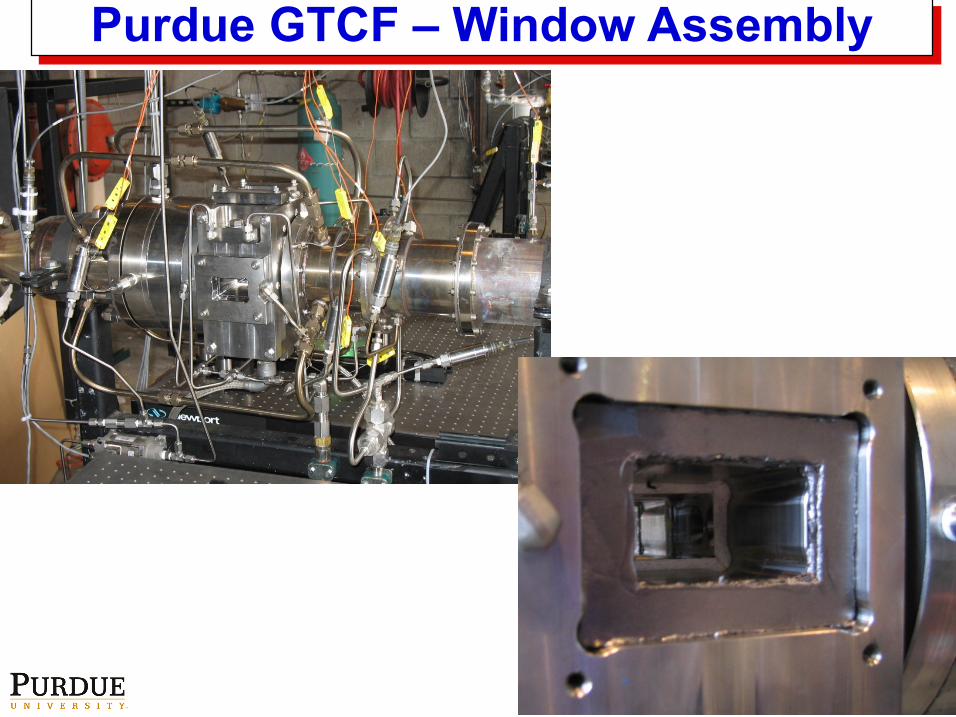
Purdue GTCF – Window Assembly
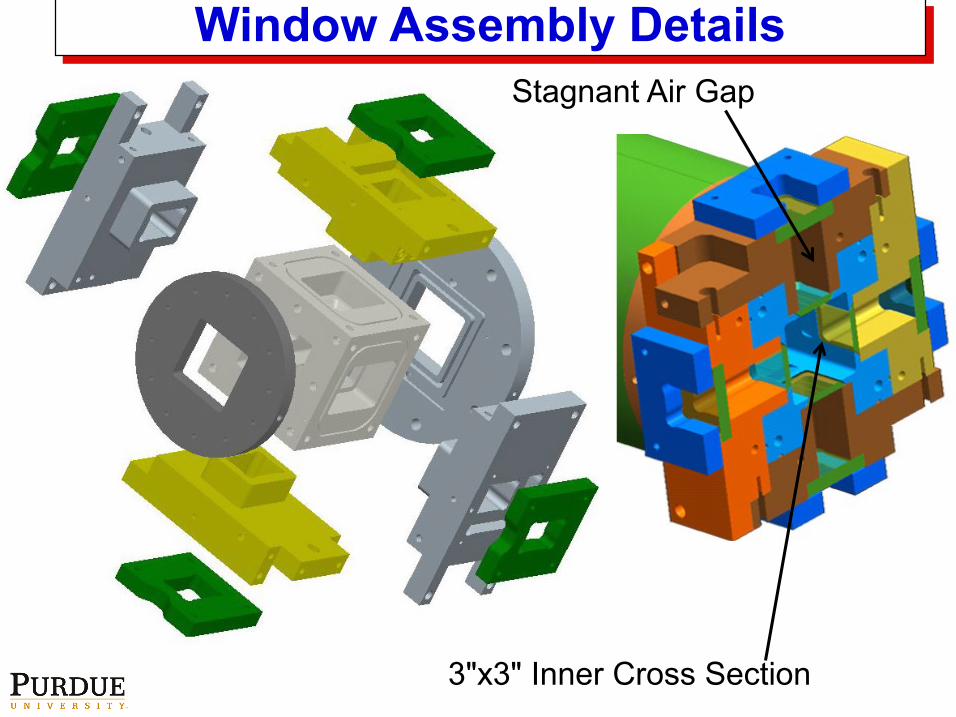
Window Assembly Details
3"x3" Inner Cross Section
Stagnant Air Gap
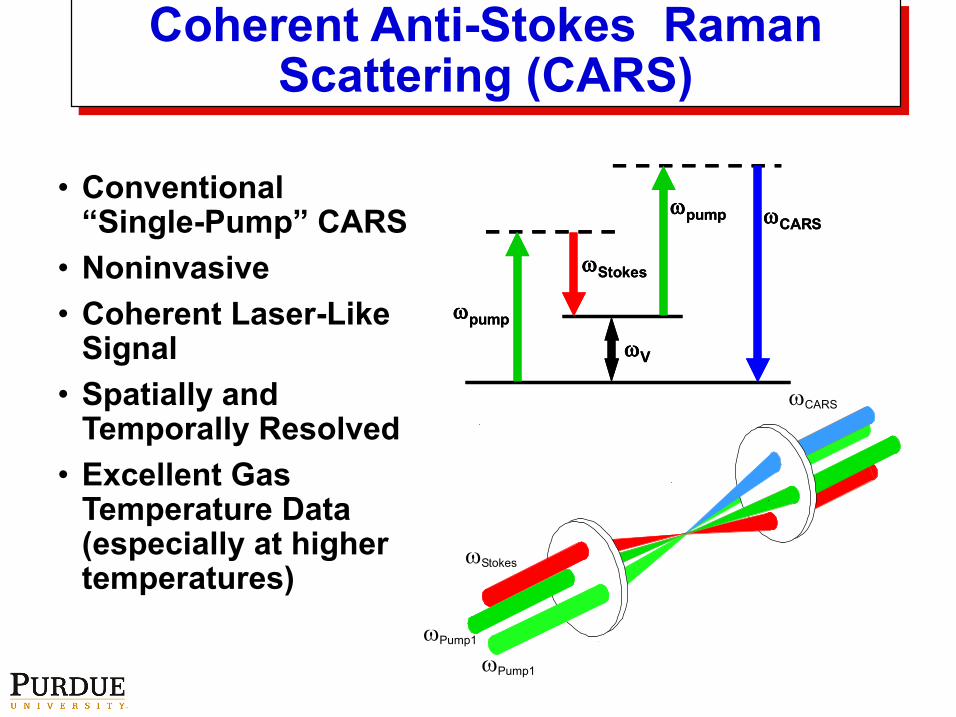
• Conventional “Single-Pump” CARS
• Noninvasive• Coherent Laser-Like
Signal• Spatially and
Temporally Resolved• Excellent Gas
Temperature Data (especially at higher temperatures)
ωpump
ωStokes
ωCARS
ωV
ωpump
ωpump
ωStokes
ωCARS
ωV
ωpump
ωStokes
ωPump1
ωPump1
ωCARS
Coherent Anti-Stokes Raman Scattering (CARS)
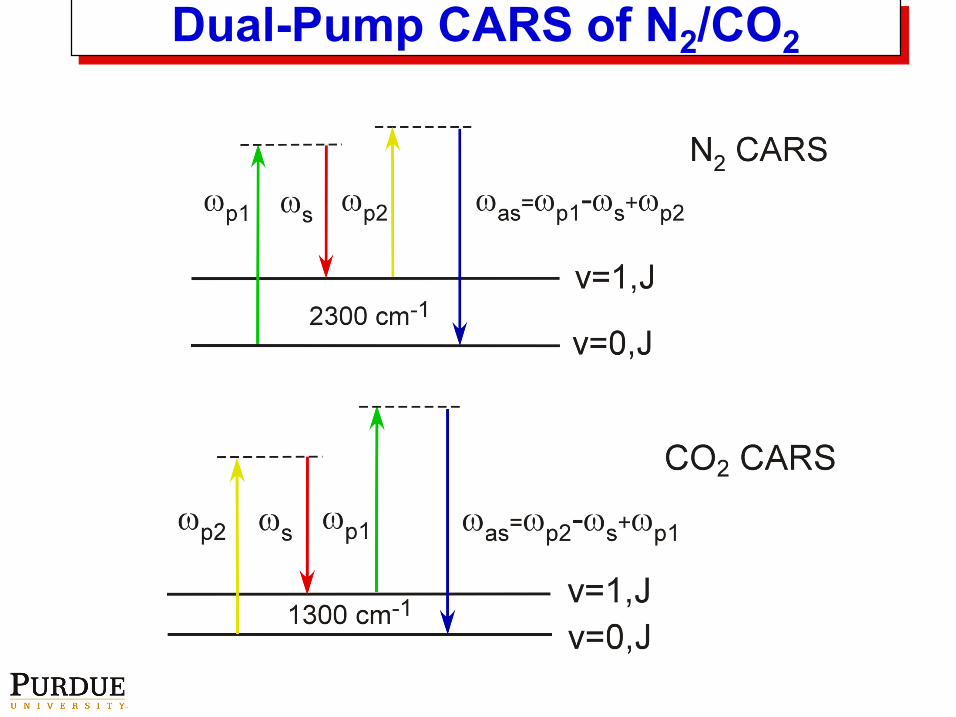
Dual-Pump CARS of N2/CO2
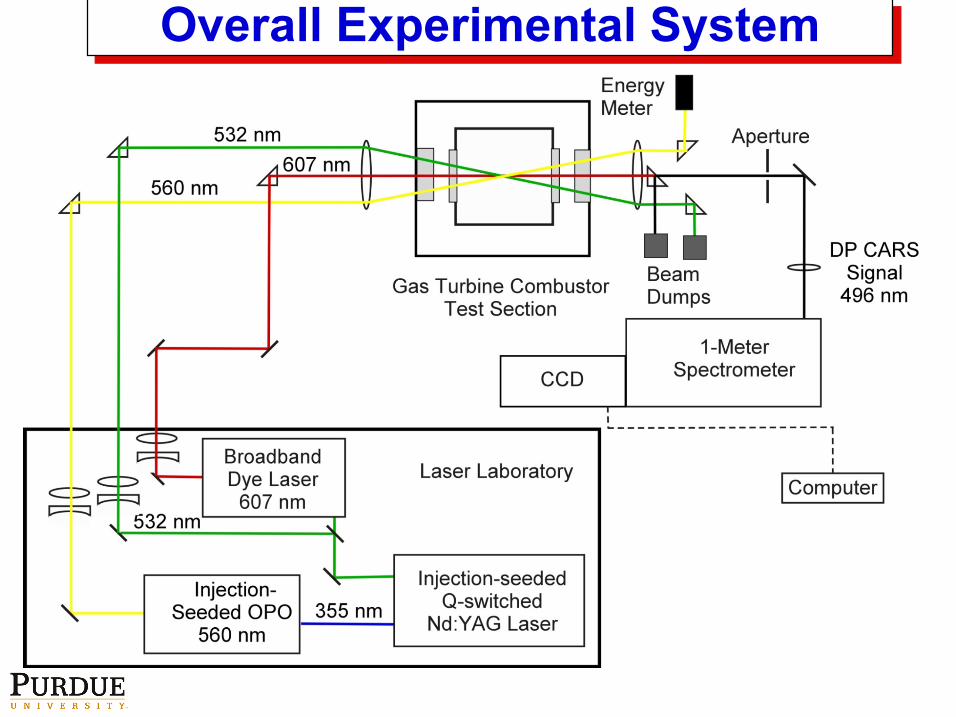
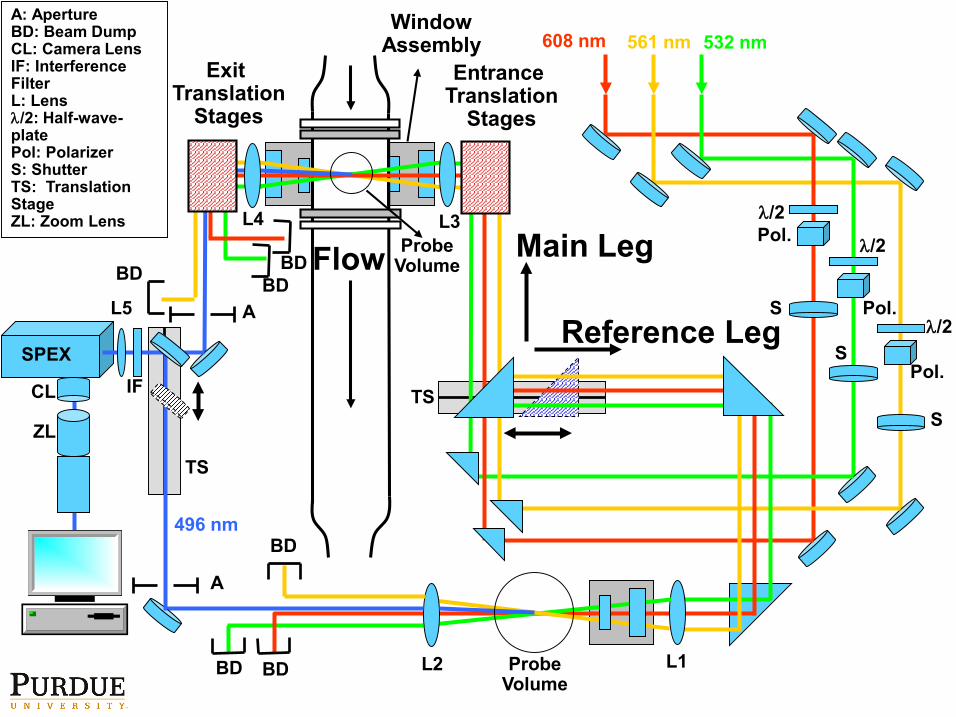
Overall Experimental System
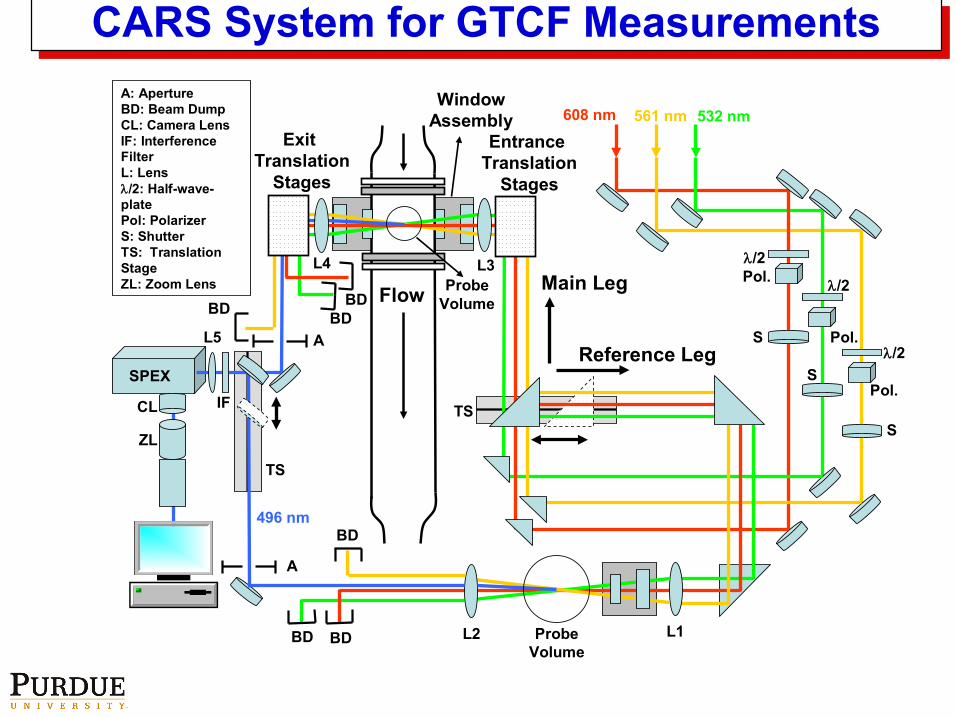
CARS System for GTCF Measurements
SPEX
λ/2Pol.
Pol.
λ/2
λ/2
Pol.
S
S
S
Main Leg
Reference Leg
CL
ZL
Flow
EntranceTranslation
Stages
ExitTranslation
Stages
BD
BDBD
BD BDBD
A: ApertureBD: Beam DumpCL: Camera LensIF: Interference FilterL: Lensλ/2: Half-wave-platePol: PolarizerS: ShutterTS: Translation StageZL: Zoom Lens
L5
L2 L1
L3L4
ProbeVolume
TS
TS
ProbeVolume
A
A
WindowAssembly
IF
608 nm 532 nm561 nm
496 nm
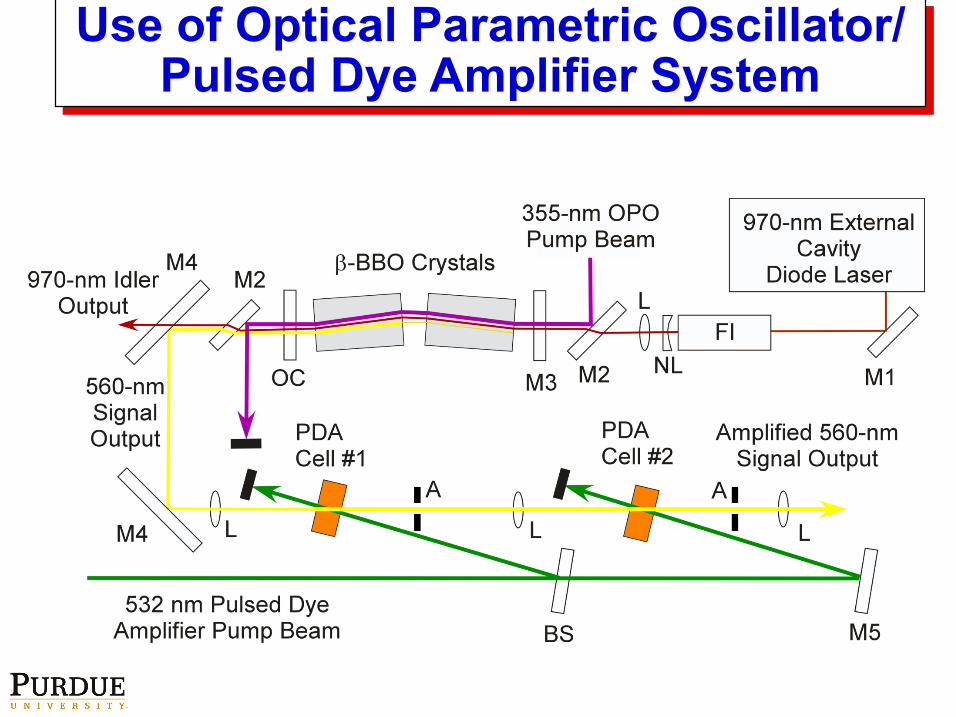
Use of Optical Parametric Oscillator/ Pulsed Dye Amplifier System
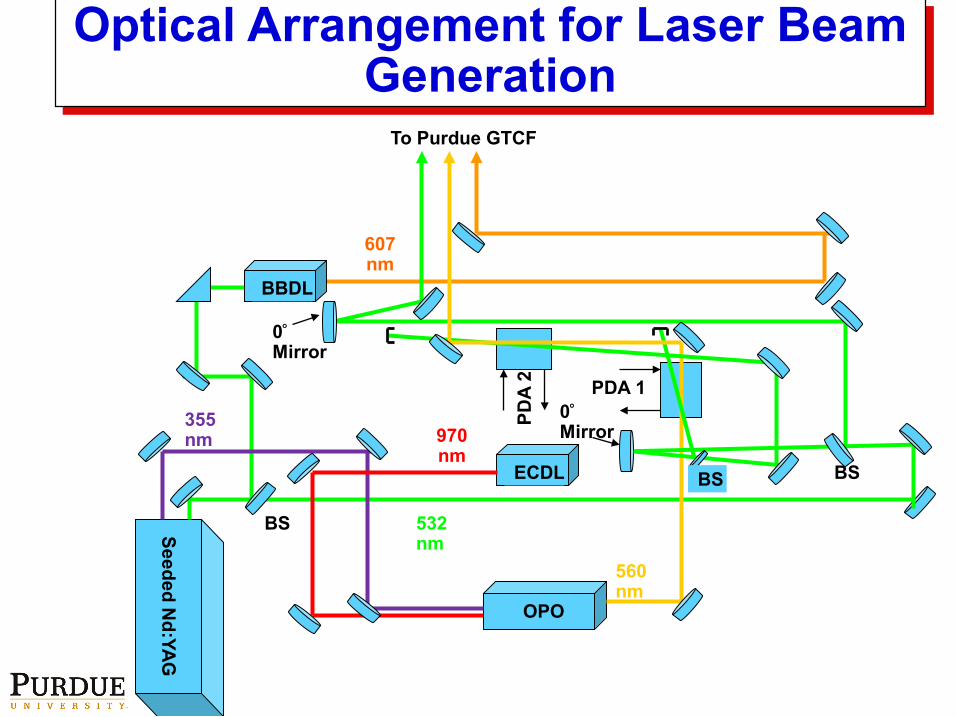
355 nm
OPO
560 nm
607 nm
532 nm
Seeded Nd:YAG
BS
PDA 1
BBDL
ECDL
970 nm
PDA
2
BSBS
0°
Mirror
0°
Mirror
To Purdue GTCF
Optical Arrangement for Laser Beam Generation
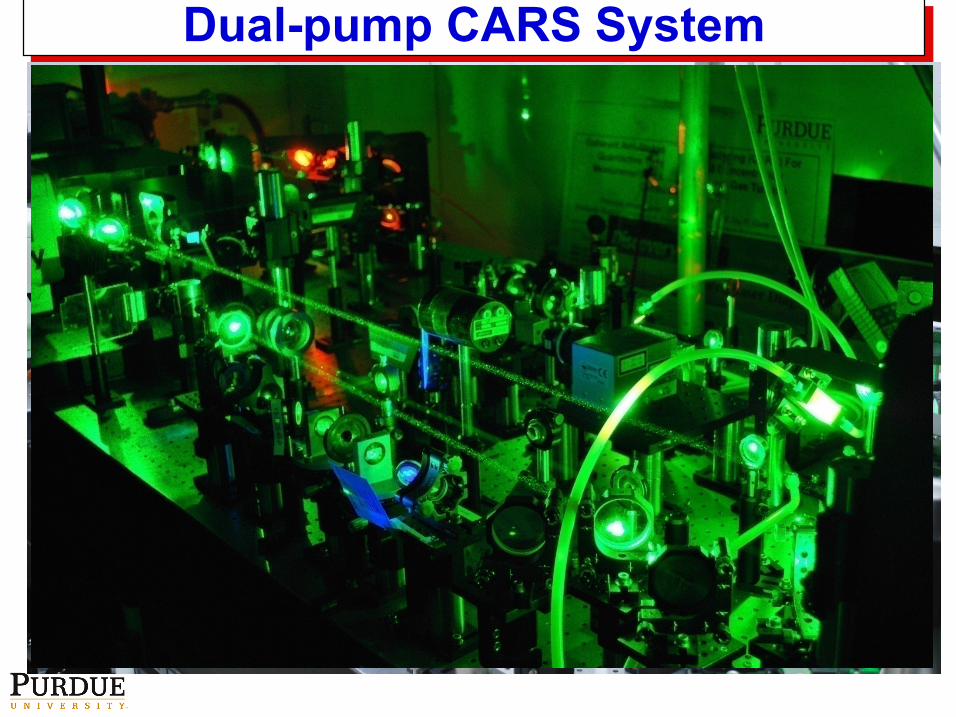
Dual-pump CARS System
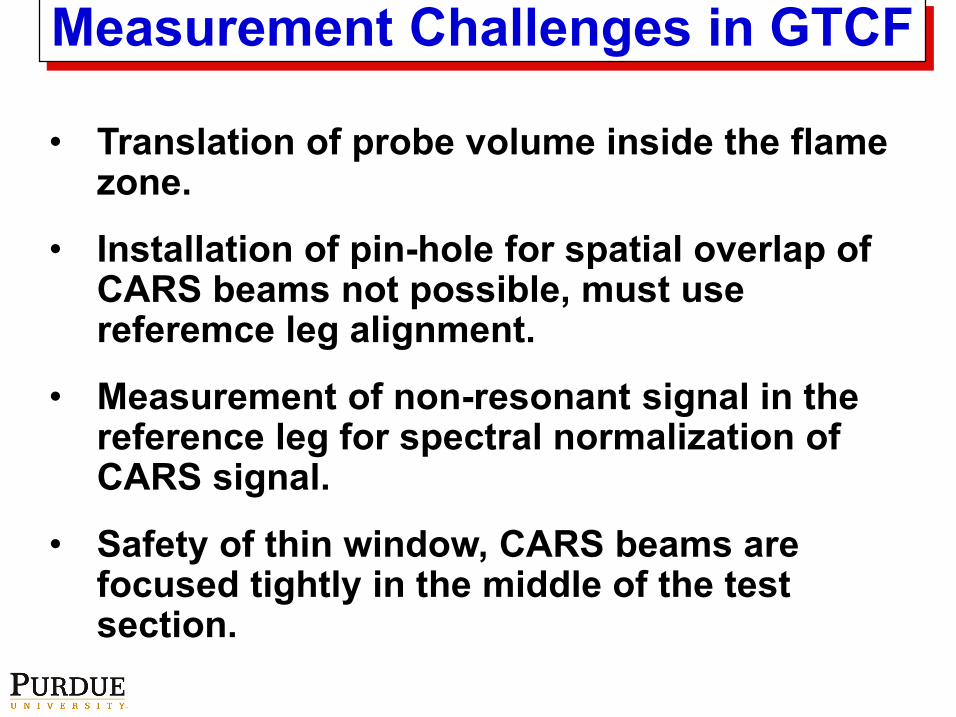
Measurement Challenges in GTCF
• Translation of probe volume inside the flame zone.
• Installation of pin-hole for spatial overlap of CARS beams not possible, must use referemce leg alignment.
• Measurement of non-resonant signal in the reference leg for spectral normalization of CARS signal.
• Safety of thin window, CARS beams are focused tightly in the middle of the test section.
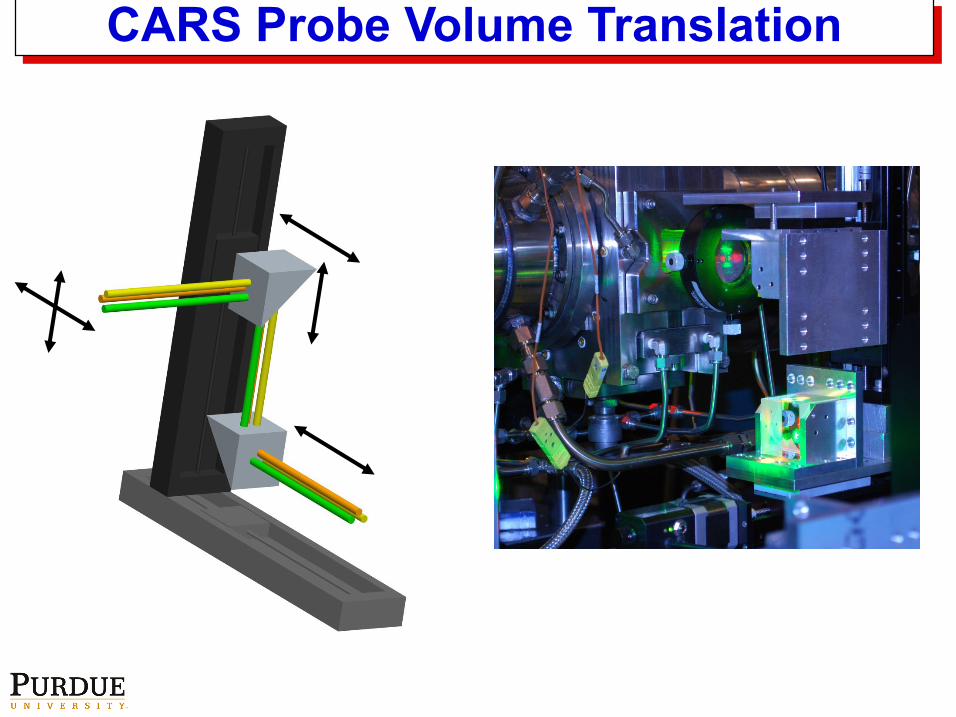
CARS Probe Volume Translation
λ/2SPEX
λ/2Pol.
Pol.
λ/2
Pol.
S
S
S
Main Leg
Reference LegCL
ZL
Flow
EntranceTranslation
Stages
ExitTranslation
Stages
BD
BDBD
BD BDBD
A: ApertureBD: Beam DumpCL: Camera LensIF: Interference FilterL: Lensλ/2: Half-wave-platePol: PolarizerS: ShutterTS: Translation StageZL: Zoom Lens
L5
L2 L1
L3L4
ProbeVolume
TS
TS
ProbeVolume
A
A
WindowAssembly
IF
608 nm 532 nm561 nm
496 nm
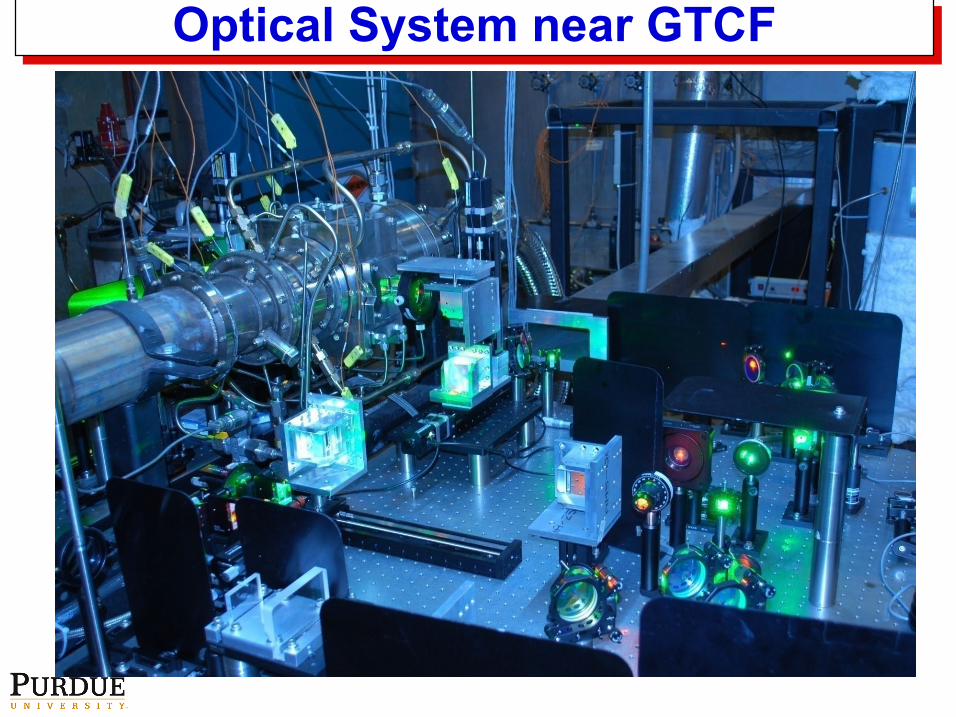
Optical System near GTCF
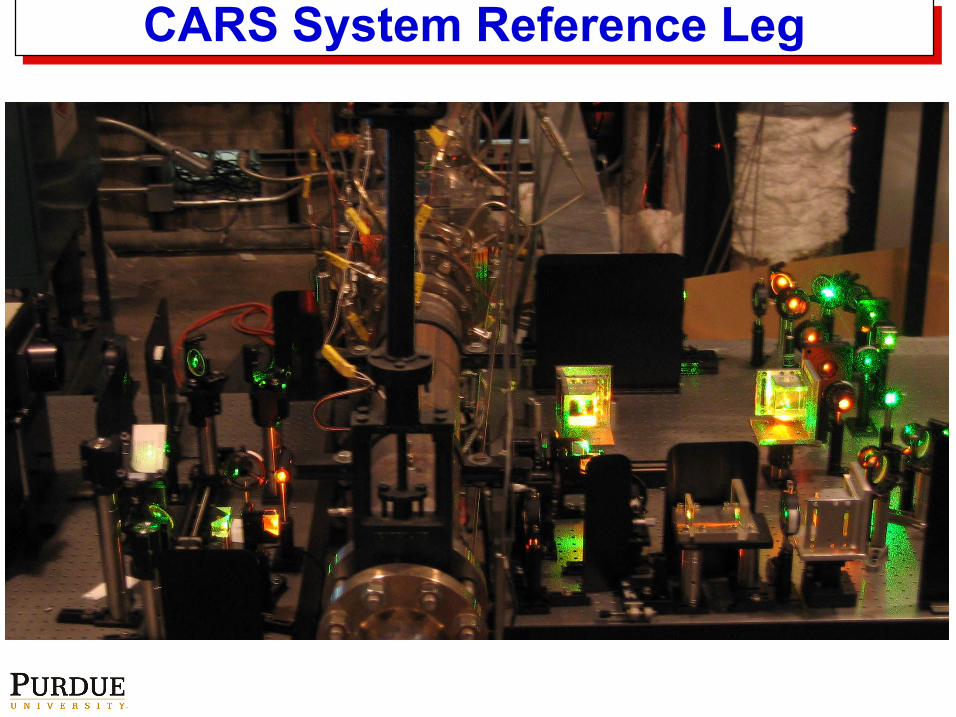
CARS System Reference Leg
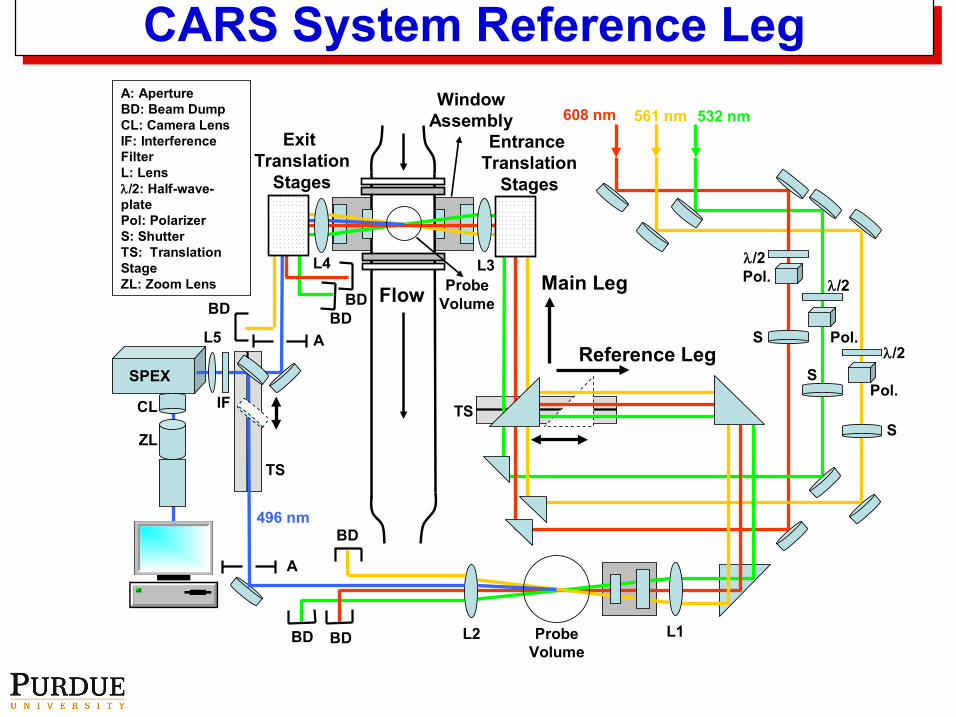
CARS System Reference Leg
SPEX
λ/2Pol.
Pol.
λ/2
λ/2
Pol.
S
S
S
Main Leg
Reference Leg
CL
ZL
Flow
EntranceTranslation
Stages
ExitTranslation
Stages
BD
BDBD
BD BDBD
A: ApertureBD: Beam DumpCL: Camera LensIF: Interference FilterL: Lensλ/2: Half-wave-platePol: PolarizerS: ShutterTS: Translation StageZL: Zoom Lens
L5
L2 L1
L3L4
ProbeVolume
TS
TS
ProbeVolume
A
A
WindowAssembly
IF
608 nm 532 nm561 nm
496 nm
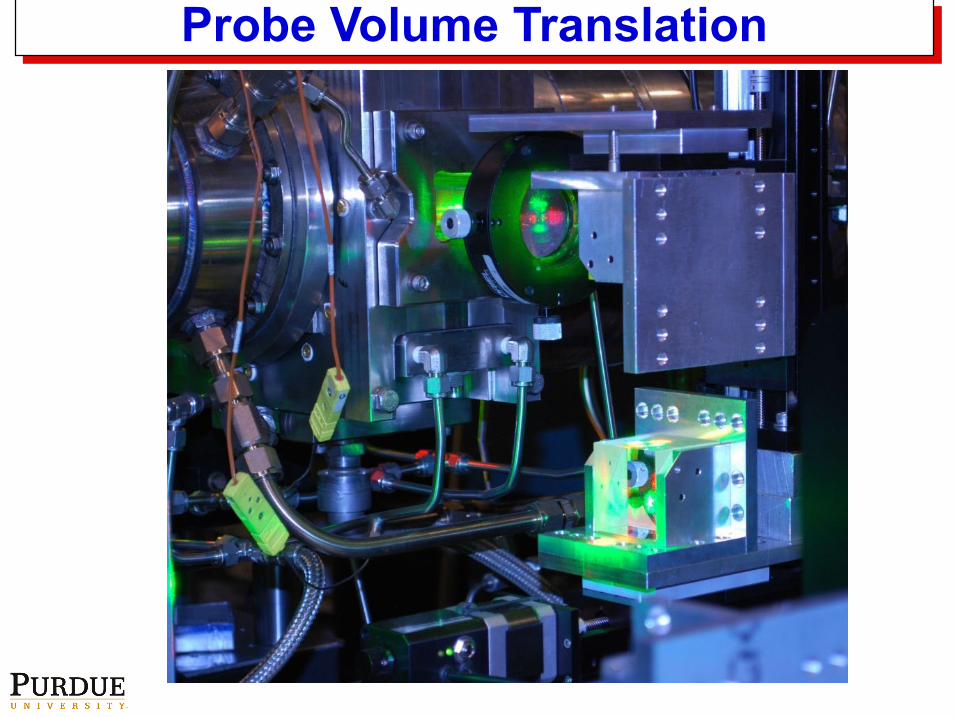
Probe Volume Translation
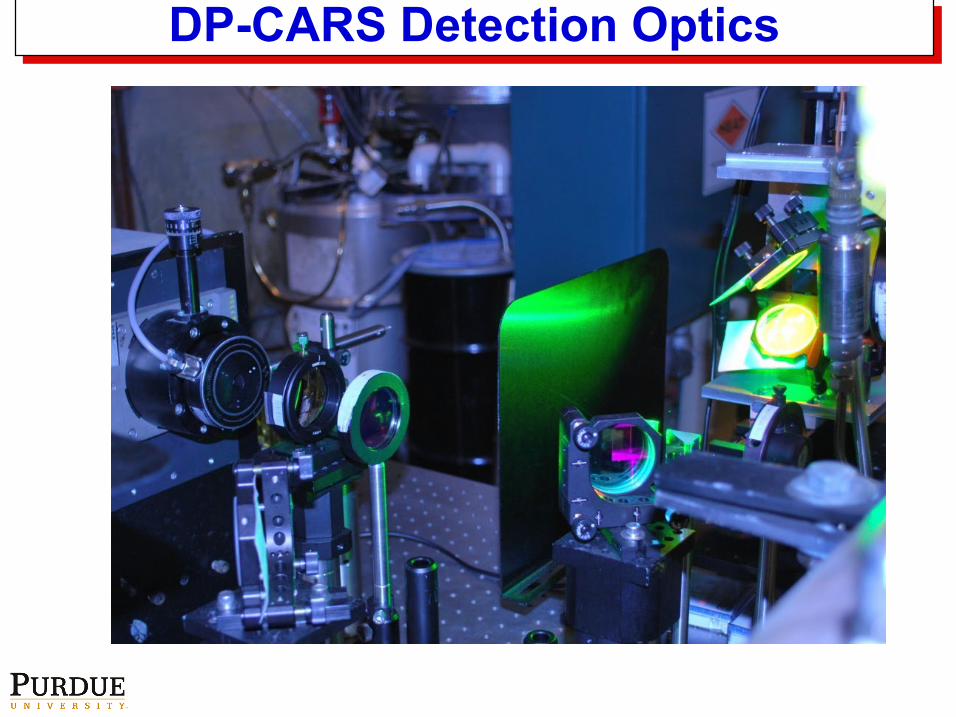
DP-CARS Detection Optics
Raman Shift (cm-1)
1300 1320 1340 1360 1380 1400
(CAR
S In
tens
ity)1/
2 (arb
. uni
ts)
-15
-5
5
15
25
35
45
55
65
75
DataTheoryResidual
T = 1325 KCO2/N2 = 0.079 N2
CO2
N2
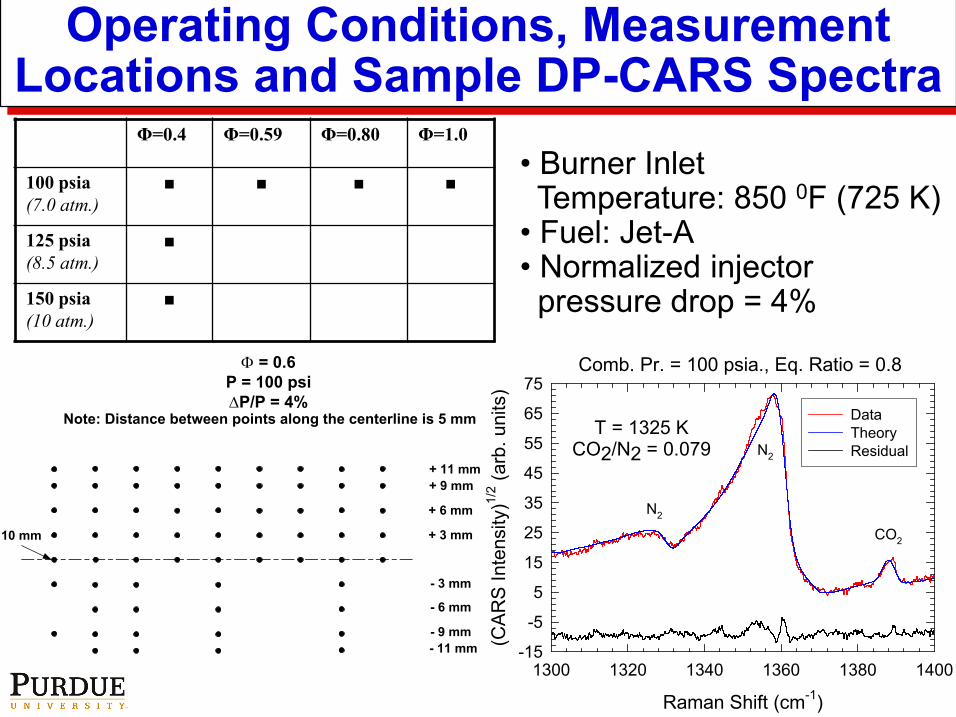
Comb. Pr. = 100 psia., Eq. Ratio = 0.8
Operating Conditions, Measurement Locations and Sample DP-CARS Spectra
Φ=0.4 Φ=0.59 Φ=0.80 Φ=1.0
100 psia(7.0 atm.)
■ ■ ■ ■
125 psia(8.5 atm.)
■
150 psia(10 atm.)
■
+ 3 mm
+ 6 mm
+ 9 mm+ 11 mm
- 3 mm
- 6 mm
- 9 mm- 11 mm
Φ = 0.6P = 100 psi∆P/P = 4%
10 mm
Note: Distance between points along the centerline is 5 mm
• Burner Inlet Temperature: 850 0F (725 K)
• Fuel: Jet-A • Normalized injector pressure drop = 4%
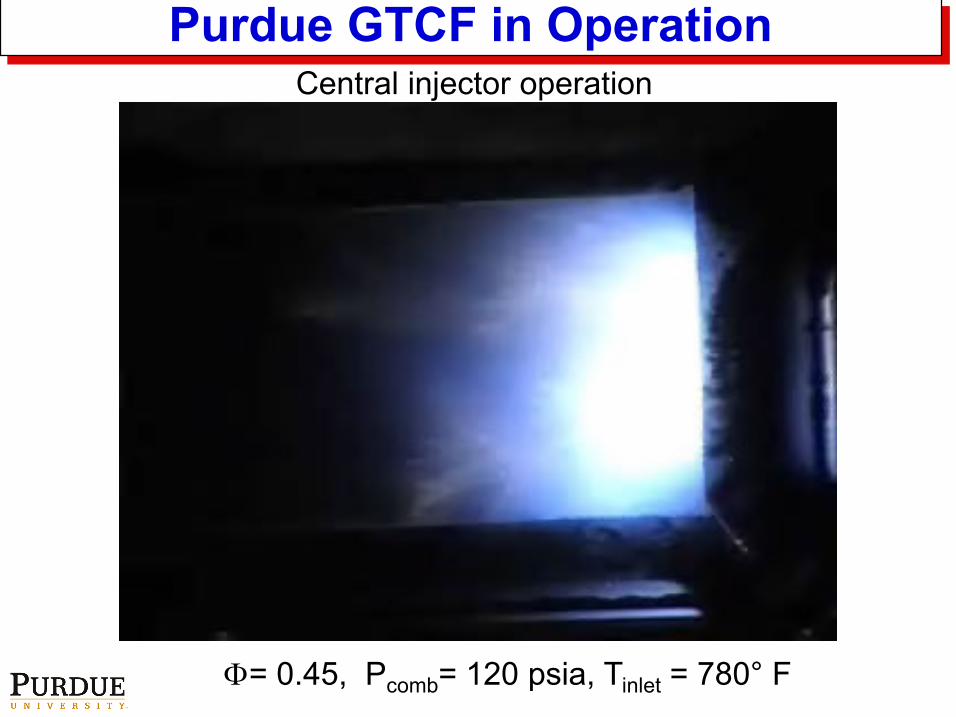
Purdue GTCF in Operation
Φ= 0.45, Pcomb= 120 psia, Tinlet = 780° F
Central injector operation
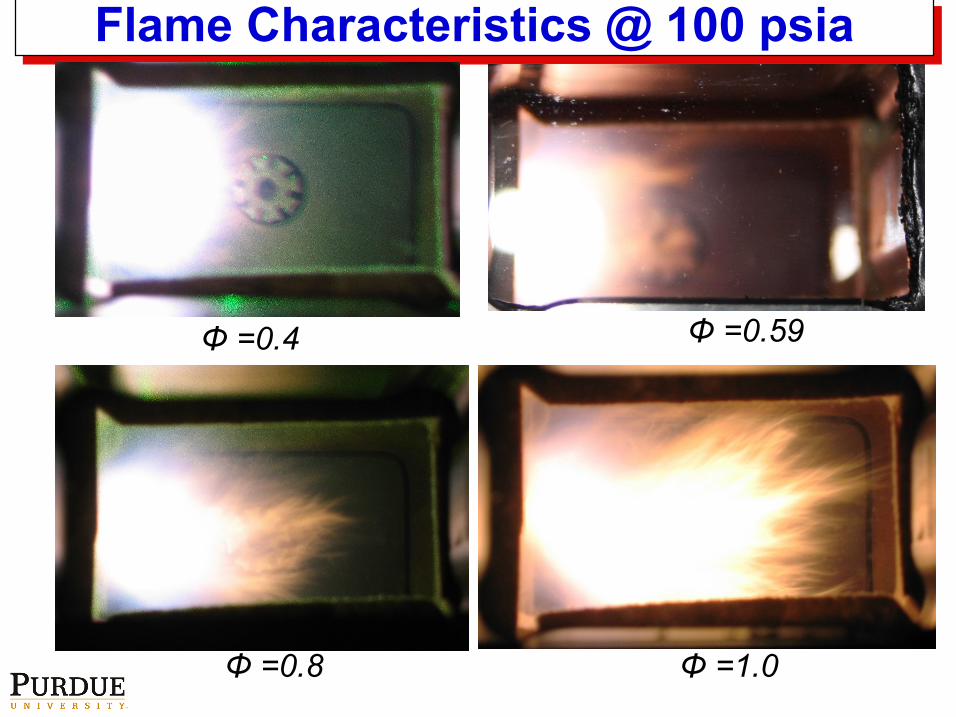
Flame Characteristics @ 100 psia
Φ =0.8 Φ =1.0
Φ =0.4 Φ =0.59
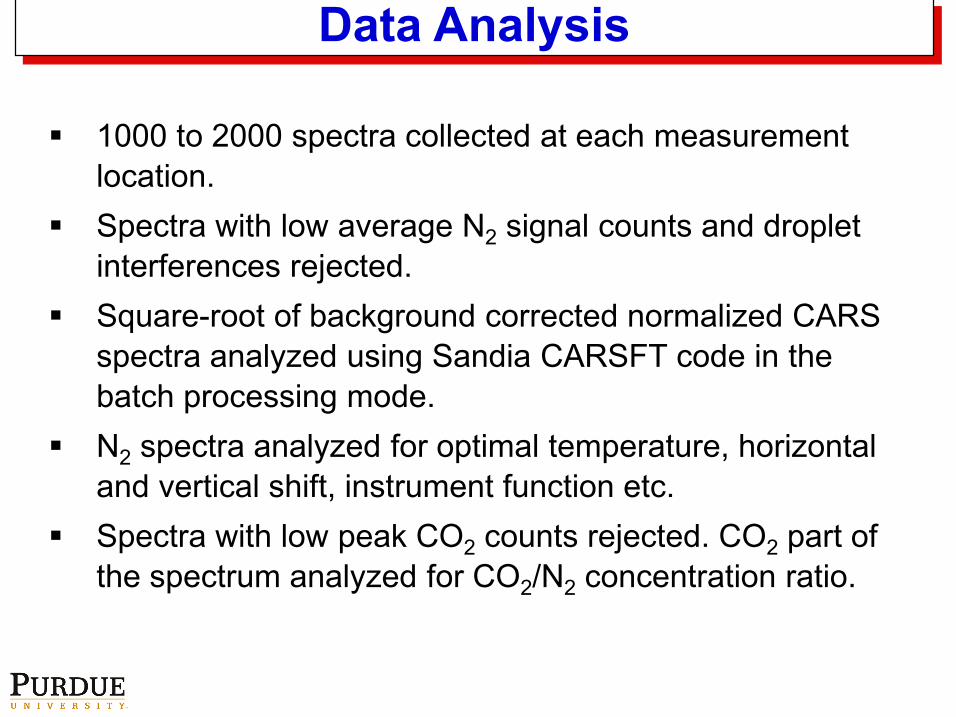
Data Analysis
1000 to 2000 spectra collected at each measurement location.
Spectra with low average N2 signal counts and droplet interferences rejected.
Square-root of background corrected normalized CARS spectra analyzed using Sandia CARSFT code in the batch processing mode.
N2 spectra analyzed for optimal temperature, horizontal and vertical shift, instrument function etc.
Spectra with low peak CO2 counts rejected. CO2 part of the spectrum analyzed for CO2/N2 concentration ratio.
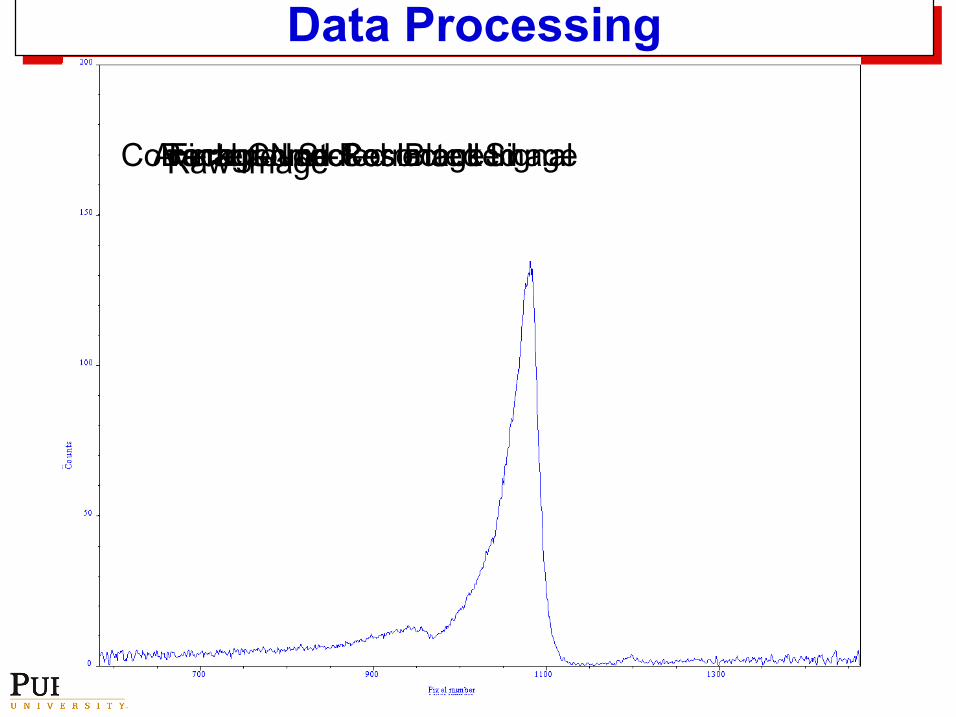
Data Processing
Raw ImageAveraged Stokes BlockedBackground Corrected ImageCorrected Non-Resonant SignalFinal Corrected Image
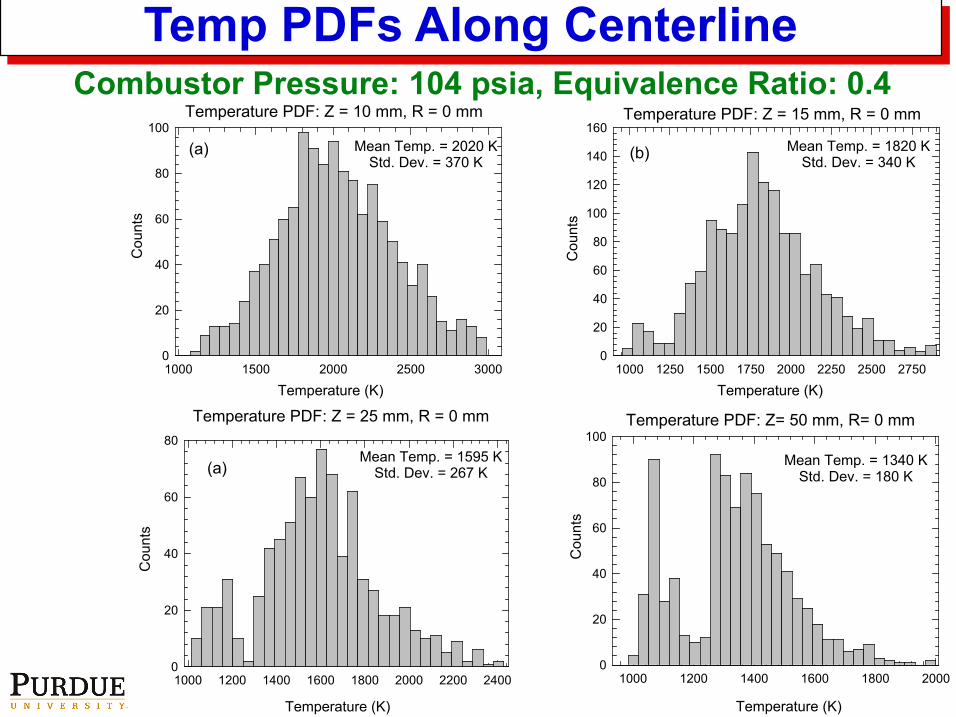
Temp PDFs Along CenterlineTemperature PDF: Z = 15 mm, R = 0 mm
Cou
nts
Temperature (K)1000 1250 1500 1750 2000 2250 2500 2750
0
20
40
60
80
100
120
140
160Mean Temp. = 1820 K
Std. Dev. = 340 K(b)
Temperature PDF: Z = 10 mm, R = 0 mmC
ount
s
Temperature (K)1000 1500 2000 2500 30000
20
40
60
80
100Mean Temp. = 2020 K
Std. Dev. = 370 K(a)
Combustor Pressure: 104 psia, Equivalence Ratio: 0.4
Temperature PDF: Z = 25 mm, R = 0 mm
Cou
nts
Temperature (K)
1000 1200 1400 1600 1800 2000 2200 24000
20
40
60
80Mean Temp. = 1595 K
Std. Dev. = 267 K(a)
Temperature PDF: Z= 50 mm, R= 0 mm
Cou
nts
Temperature (K)
1000 1200 1400 1600 1800 20000
20
40
60
80
100
Mean Temp. = 1340 KStd. Dev. = 180 K
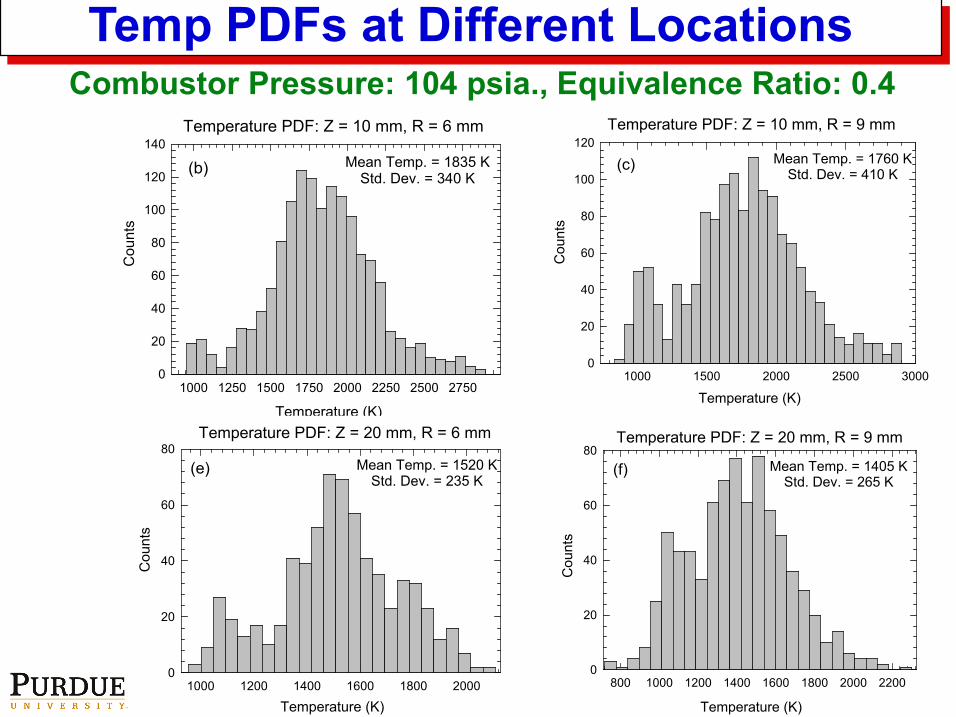
Temp PDFs at Different LocationsCombustor Pressure: 104 psia., Equivalence Ratio: 0.4
Temperature PDF: Z = 10 mm, R = 6 mmC
ount
s
Temperature (K)1000 1250 1500 1750 2000 2250 2500 2750
0
20
40
60
80
100
120
140Mean Temp. = 1835 K
Std. Dev. = 340 K(b)
Temperature PDF: Z = 10 mm, R = 9 mm
Cou
nts
Temperature (K)1000 1500 2000 2500 3000
0
20
40
60
80
100
120Mean Temp. = 1760 K
Std. Dev. = 410 K(c)
Temperature PDF: Z = 20 mm, R = 6 mm
Cou
nts
Temperature (K)1000 1200 1400 1600 1800 2000
0
20
40
60
80Mean Temp. = 1520 K
Std. Dev. = 235 K(e)
Temperature PDF: Z = 20 mm, R = 9 mm
Cou
nts
Temperature (K)
800 1000 1200 1400 1600 1800 2000 22000
20
40
60
80Mean Temp. = 1405 K
Std. Dev. = 265 K(f)
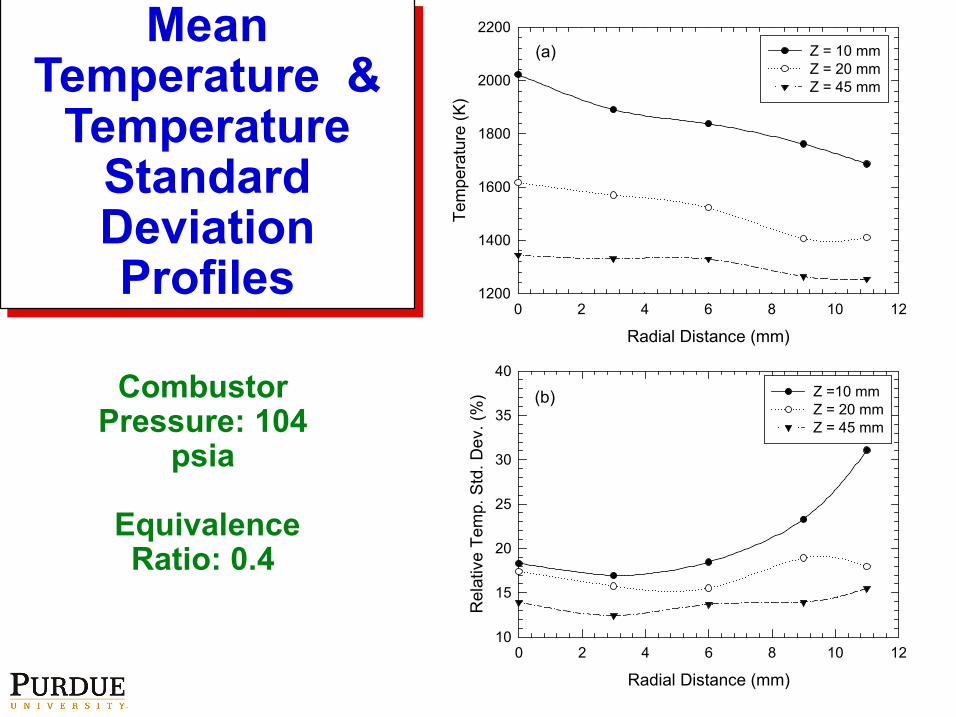
Mean Temperature &
Temperature Standard Deviation Profiles
Combustor Pressure: 104
psia
Equivalence Ratio: 0.4
Radial Distance (mm)0 2 4 6 8 10 12
Tem
pera
ture
(K)
1200
1400
1600
1800
2000
2200Z = 10 mmZ = 20 mmZ = 45 mm
(a)
Radial Distance (mm)0 2 4 6 8 10 12
Rel
ativ
e Te
mp.
Std
. Dev
. (%
)
10
15
20
25
30
35
40Z =10 mmZ = 20 mmZ = 45 mm
(b)
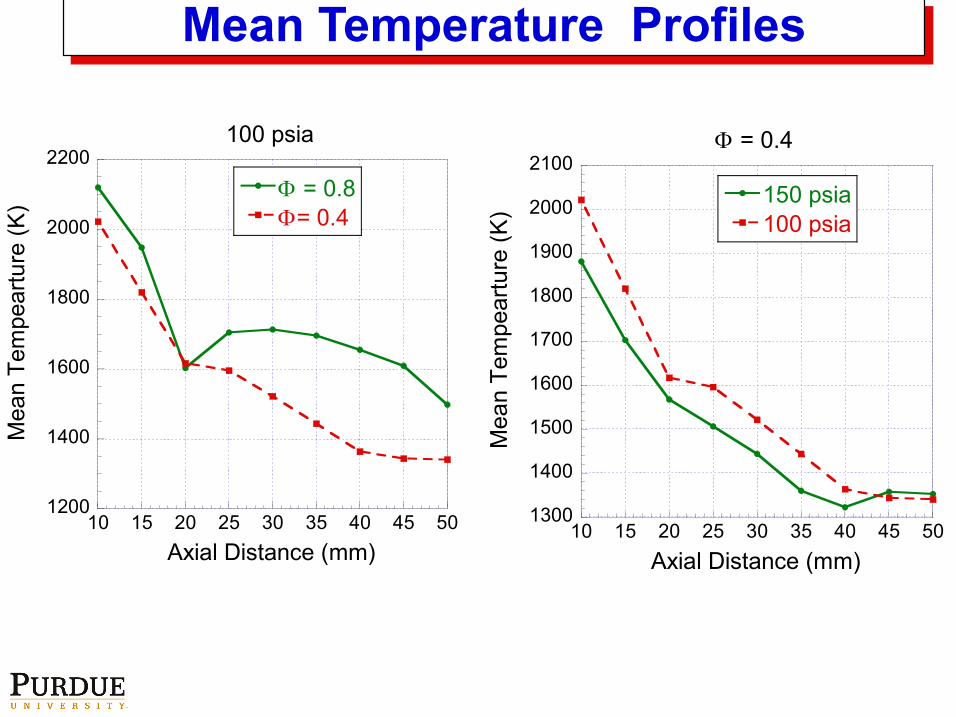
Mean Temperature Profiles
1300
1400
1500
1600
1700
1800
1900
2000
2100
10 15 20 25 30 35 40 45 50
Φ = 0.4
150 psia100 psia
Mea
n Te
mpe
artu
re (K
)
Axial Distance (mm)
1200
1400
1600
1800
2000
2200
10 15 20 25 30 35 40 45 50
100 psia
Φ = 0.8Φ= 0.4
Mea
n Te
mpe
artu
re (K
)
Axial Distance (mm)
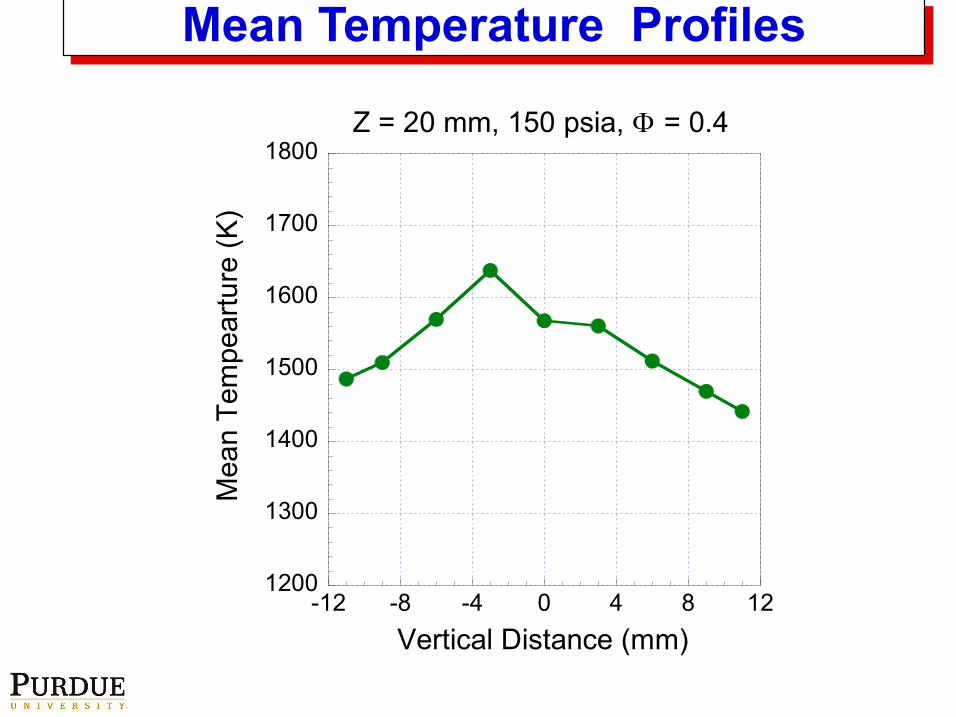
Mean Temperature Profiles
1200
1300
1400
1500
1600
1700
1800
-12 -8 -4 0 4 8 12
Z = 20 mm, 150 psia, Φ = 0.4
Mea
n Te
mpe
artu
re (K
)
Vertical Distance (mm)
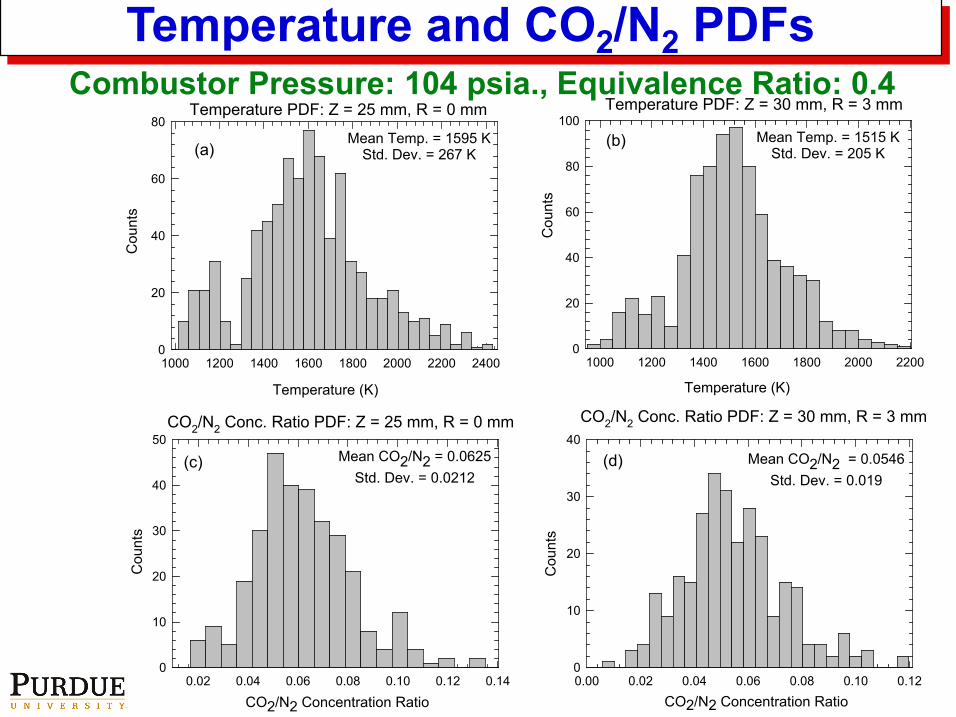
Temperature and CO2/N2 PDFsTemperature PDF: Z = 25 mm, R = 0 mm
Cou
nts
Temperature (K)
1000 1200 1400 1600 1800 2000 2200 24000
20
40
60
80Mean Temp. = 1595 K
Std. Dev. = 267 K(a)
CO2/N2 Conc. Ratio PDF: Z = 25 mm, R = 0 mm
Cou
nts
CO2/N2 Concentration Ratio0.02 0.04 0.06 0.08 0.10 0.12 0.14
0
10
20
30
40
50Mean CO2/N2 = 0.0625
Std. Dev. = 0.0212(c)
Temperature PDF: Z = 30 mm, R = 3 mm
Cou
nts
Temperature (K)
1000 1200 1400 1600 1800 2000 22000
20
40
60
80
100(b) Mean Temp. = 1515 K
Std. Dev. = 205 K
Combustor Pressure: 104 psia., Equivalence Ratio: 0.4
CO2/N2 Concentration Ratio0.00 0.02 0.04 0.06 0.08 0.10 0.12
Cou
nts
0
10
20
30
40Mean CO2/N2 = 0.0546
Std. Dev. = 0.019(d)
CO2/N2 Conc. Ratio PDF: Z = 30 mm, R = 3 mm
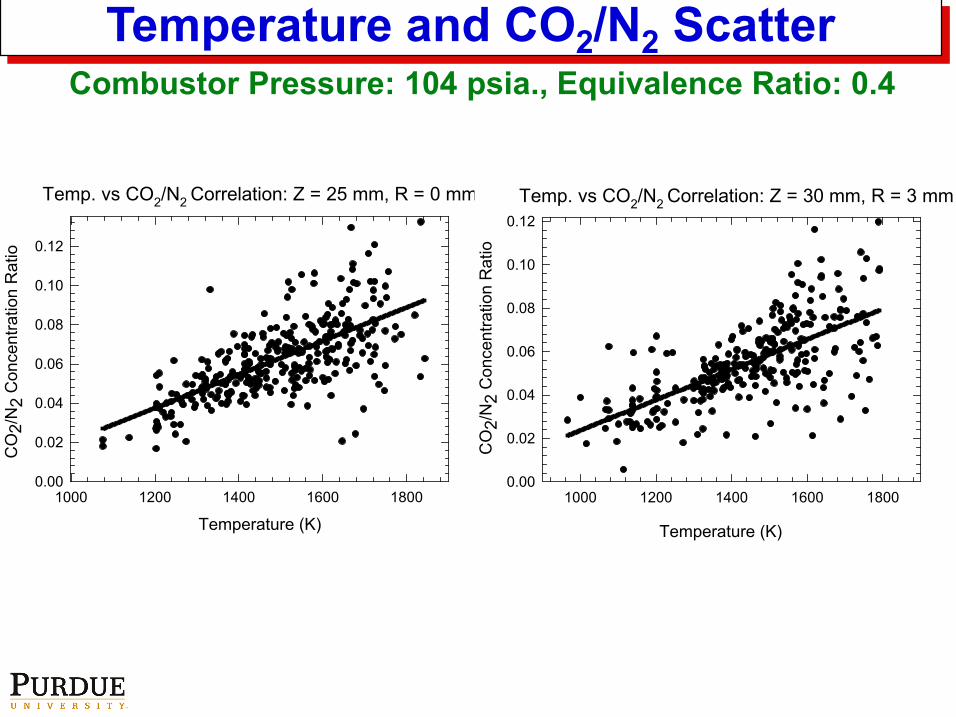
Temperature and CO2/N2 Scatter Combustor Pressure: 104 psia., Equivalence Ratio: 0.4
Temp. vs CO2/N2 Correlation: Z = 25 mm, R = 0 mm
Temperature (K)1000 1200 1400 1600 1800
CO
2/N
2 C
once
ntra
tion
Rat
io
0.00
0.02
0.04
0.06
0.08
0.10
0.12
1000 1200 1400 1600 18000.00
0.02
0.04
0.06
0.08
0.10
0.12Temp. vs CO2/N2 Correlation: Z = 30 mm, R = 3 mm
CO
2/N
2 C
once
ntra
tion
Rat
io
Temperature (K)
Accomplishments and Conclusions
GTCF has been operated at wide range of simulated supersonic flight conditions. The optically accessible GTCF has been operated up at pressures up to150 psia, single-shot dual-pump CARS measurements obtained at all operating conditions.
Approximately 500,000 single-shot spectra were acquired in a test campaign conducted during the summer of 2009. These spectra are being processed to obtain temperature and CO2/N2 concentration ratio values at various equivalence ratios at multiple axial and vertical positions downstream of the LDI injector.
Accomplishments and Conclusions
A new OPO/PDA system was used to generate the 560-nm pump beam in the dual-pump CARS system. Considerable care in allignment was required for all beams to obtain good beam quality in the combustor test cell.
The Zaber translation stages performed well, alignment was maintained over the entire spatial region of interest during the test.
The reference leg was invaluable for alignment and for frequent recording of the nonresonant signal. Alignment was maintained before and after translation of the large 2-inch prisms.
Accomplishments and Conclusions
Data analysis is still in progress. Filtering techniques to remove spectra with signals that were too low have been developed and are still being optimized. .
Experimental results will be compared with computational results obtained from, for example, the National Combustion Code (NCC). The data will be provided in a form decided in collaboration with NASA personnel.
Accomplishments and Conclusions
Estimated uncertainty in temperature measurements : Accuracy: 1-2% Precision: 2-3%
Uncertainty in CO2/N2 ratio measurements : Very dependent on CO2 concentration and on the
temperature, approximately 10% relative standard deviation in the range of 5% CO2 concentation around 1500 K.
Probe volume dimensions: 500 μm along the laser propagation direction. 50 μm perpendicular to the laser direction.
Papers and Presentations
1. Mathew P. Thariyan, Aizaz H. Bhuiyan, Sameer V. Naik, Jay P. Gore, and Robert P. Lucht, “Temperature and CO2 Concentration Measurements in a High-Pressure, Lean Direct Injector Combustor using Dual-Pump CARS,” paper submitted to the 33rd Combustion Symposium.
2. Mathew P. Thariyan, Aizaz H. Bhuiyan, Scott E. Meyer, Sameer V. Naik, Jay P. Gore, and Robert P. Lucht, “Optically Accessible, High-Pressure Gas Turbine Combustion Facility and Dual-Pump CARS System,” paper in preparation for submission to Measurement Science and Technology.
Papers and Presentations3. M. P. Thariyan, V. Ananthanarayanan, A. H. Bhuiyan, S. E. Meyer, S.
V. Naik, J. P. Gore and R. P. Lucht, “Dual-Pump CARS Temperature and Major Species Concentration Measurements in Laminar Counterflow Flames and in a Gas Turbine Combustor Facility,” Paper AIAA-2009-1442, presented at the 47th Aerospace Sciences Meeting, Orlando, Florida, January 5-8, 2009.
4. M. P. Thariyan, A. H. Bhuiyan, N. Chai., S. V. Naik, R. P. Lucht, and J. P. Gore, “Dual-Pump CARS Temperature and Major Species Concentration Measurements in a Gas Turbine Combustor Facility,” Paper AIAA 2009-5052, 45th AIAA/ASME/SAE/ASEE Joint Propulsion Conference & Exhibit, Denver, Colorado, 2-5 August 2009.
5. M. P. Thariyan, A. H. Bhuiyan, N. Chai, S. V. Naik, R. P. Lucht, and J. P. Gore, “Dual-Pump CARS Measurements in a Gas Turbine Combustor Facility Using the NASA 9-point LDI Injector,” Paper AIAA-2010-1401, presented at the 48th Aerospace Sciences Meeting, Orlando, Florida, January 4-7, 2010.
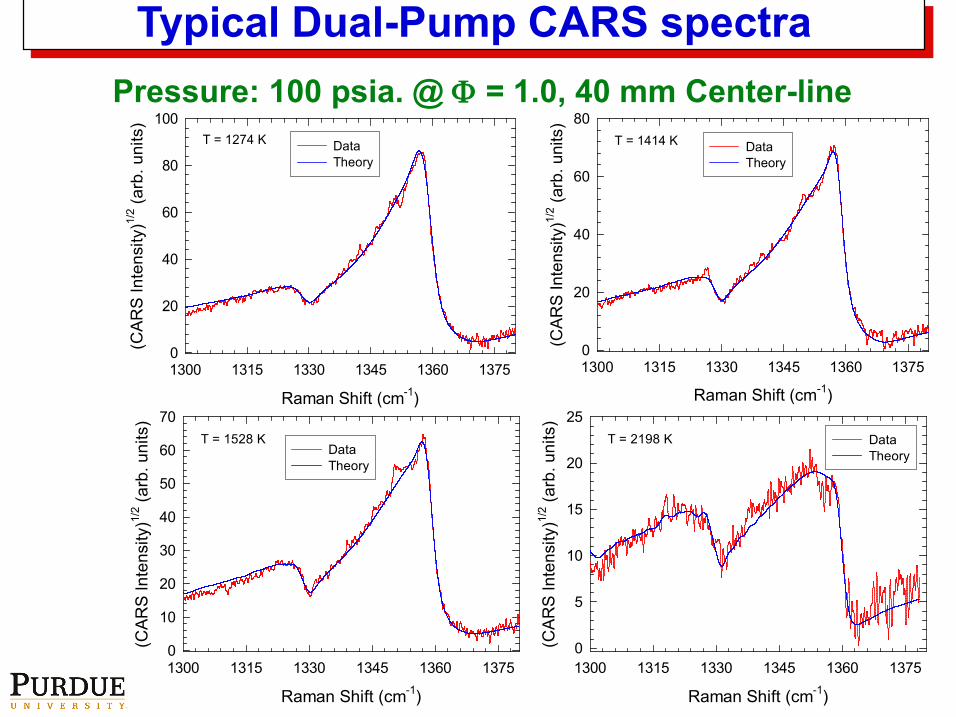
Typical Dual-Pump CARS spectra
Raman Shift (cm-1)
1300 1315 1330 1345 1360 1375
(CAR
S In
tens
ity)1/
2 (arb
. uni
ts)
0
20
40
60
80
DataTheory
T = 1414 K
Raman Shift (cm-1)
1300 1315 1330 1345 1360 1375
(CAR
S In
tens
ity)1/
2 (arb
. uni
ts)
0
20
40
60
80
100
DataTheory
T = 1274 K
Raman Shift (cm-1)
1300 1315 1330 1345 1360 1375
(CAR
S In
tens
ity)1/
2 (arb
. uni
ts)
0
10
20
30
40
50
60
70
DataTheory
T = 1528 K
Raman Shift (cm-1)
1300 1315 1330 1345 1360 1375
(CAR
S In
tens
ity)1/
2 (arb
. uni
ts)
0
5
10
15
20
25DataTheory
T = 2198 K
Pressure: 100 psia. @ Φ = 1.0, 40 mm Center-line
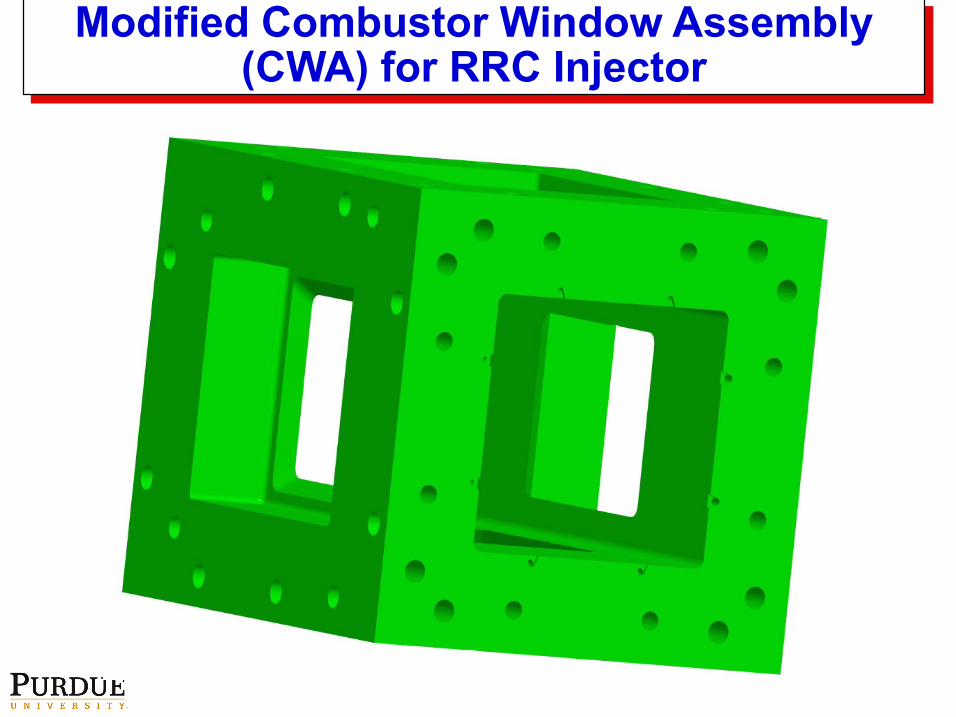
Modified Combustor Window Assembly (CWA) for RRC Injector
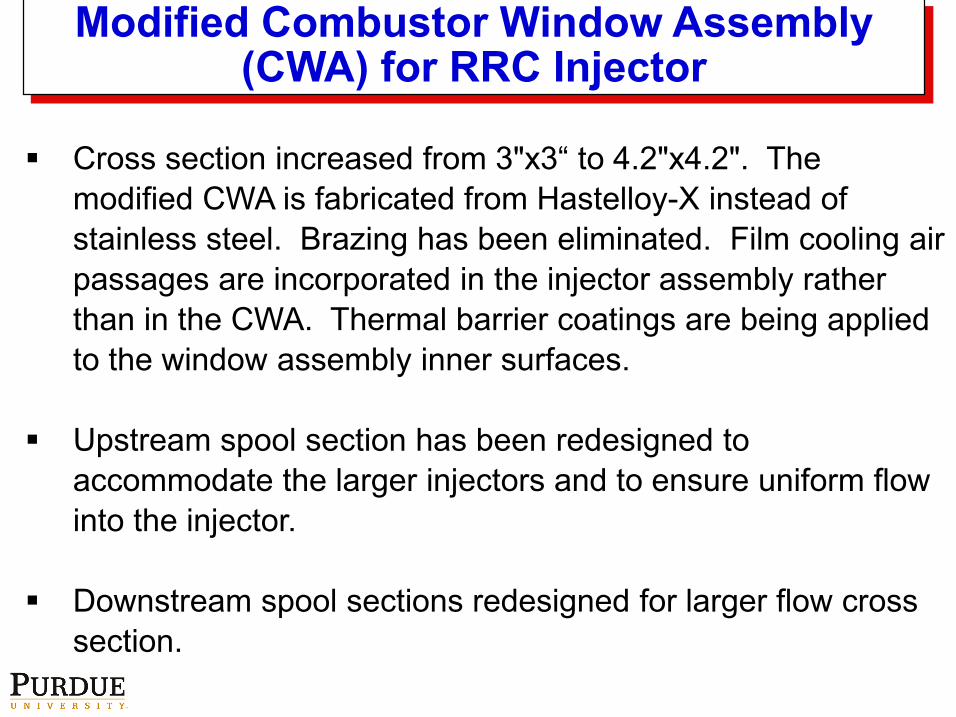
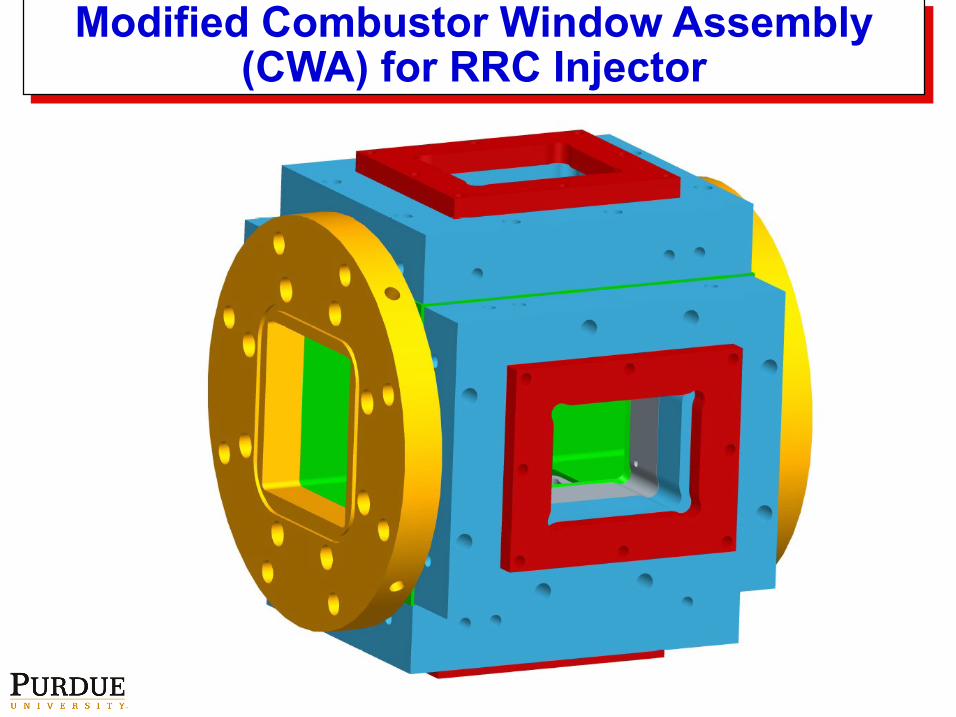
Cross section increased from 3"x3“ to 4.2"x4.2". The modified CWA is fabricated from Hastelloy-X instead of stainless steel. Brazing has been eliminated. Film cooling air passages are incorporated in the injector assembly rather than in the CWA. Thermal barrier coatings are being applied to the window assembly inner surfaces.
Upstream spool section has been redesigned to accommodate the larger injectors and to ensure uniform flow into the injector.
Downstream spool sections redesigned for larger flow cross section.
Modified Combustor Window Assembly (CWA) for RRC Injector
Modified Combustor Window Assembly (CWA) for RRC Injector