Embed Size (px)
Citation preview

Scatter Plots with Your calculator
Section 4-6

Page 636#10
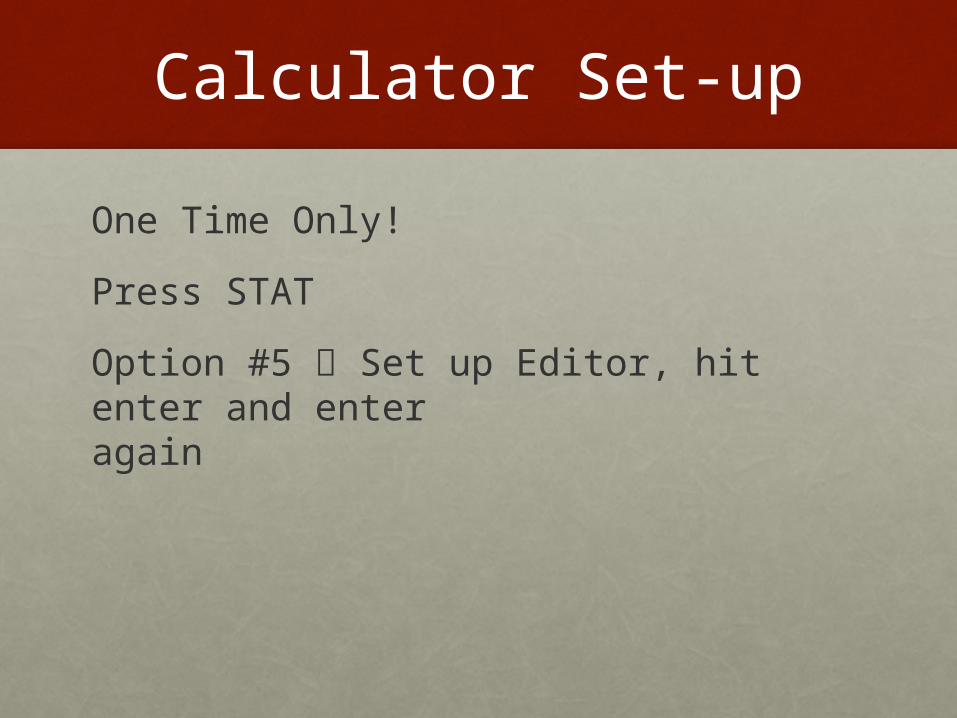
Calculator Set-up
One Time Only!
Press STAT
Option #5 Set up Editor, hit enter and enter again

Clearing Lists
Press STAT again
Option #4 Clear List (enter) then hit 2nd L1, L2, L3, L4, L5, L6 (enter)

Entering Numbers
Press STAT:
#1 EDIT : under L1, type the first number (enter), type second number (enter)…
Right arrow over to Column L2, type first number (enter), type second number (enter)…

Window Range
Determine largest and smallest number in each list
DO NOT REARRANGE LIST!!!
L1 62 ---- 73
L2 115----168
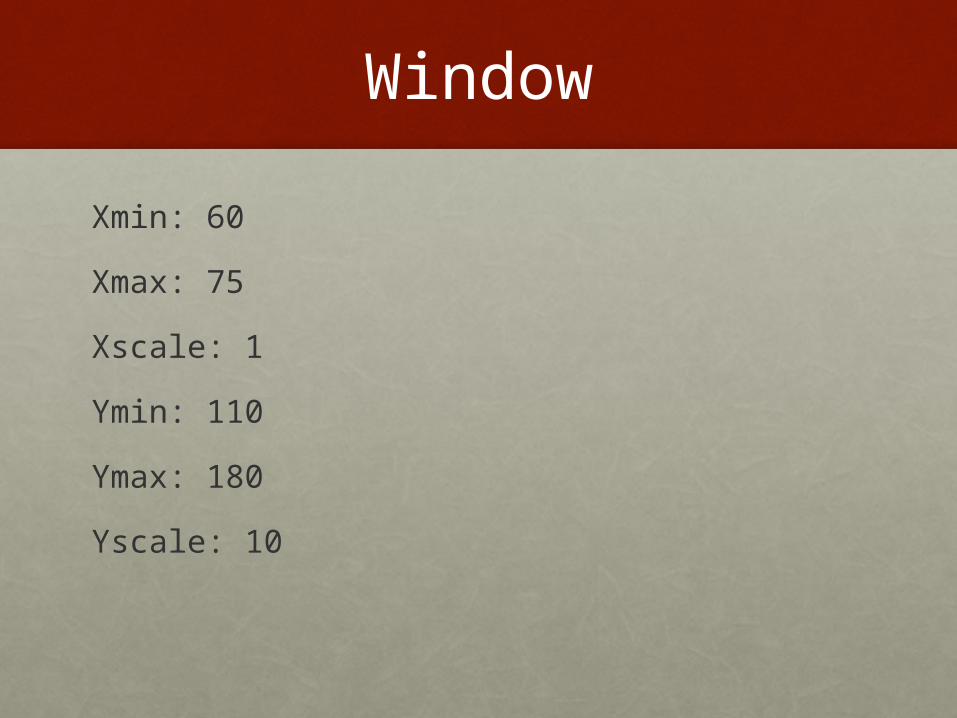
Window
Xmin: 60
Xmax: 75
Xscale: 1
Ymin: 110
Ymax: 180
Yscale: 10

Scatter Plots
Hit 2nd and Y= (Stat Plot)
1: (enter) ON
Type: 1st Option
X list: L1
Y list: L2
Mark: BOX
Graph

Line of Best fit
Hit STAT:
Arrow to the right to the CALC heading
#4 Linreg(ax+b) enter
Linreg(ax+b) L1, L2
a is the slope
b is the y intercept
Check
Hit Y=
Type in your Y=ax+b in the Y1
Make sure that it is the line of best fit and follows the pattern of the points.

Homework
Page 652 #’s 3, 5, 6, 8 and 9