Embed Size (px)
Citation preview
SCARPE: A Technique and Tool for SelectiveCapture and Replay of Program Executions∗
Shrinivas JoshiAdvanced Micro Devices
Alessandro OrsoGeorgia Institute of [email protected]
Abstract
Because of software’s increasing dynamism and the het-erogeneity of execution environments, the results of in-housetesting and maintenance are often not representative of theway the software behaves in the field. To alleviate this prob-lem, we present a technique for capturing and replaying par-tial executions of deployed software. Our technique can beused for various applications, including generation of testcases from user executions and post-mortem dynamic anal-ysis. We present our technique and tool, some possible appli-cations, and a preliminary empirical evaluation that providesinitial evidence of the feasibility of our approach.
1 IntroductionToday’s software is increasingly dynamic, and its complexityis growing, together with the complexity of the environmentsin which it executes. Because modern software can behavequite differently in different environments and configurations,it is difficult to assess its performance and reliability outsidethe actual time and context in which it executes. Therefore,the results of traditional testing and maintenance activities—performed in-house, on a limited number of configurations,and using developer-created inputs—are often not represen-tative of how the software will behave in the field [4, 9, 11].
To help address the limitations of purely in-house ap-proaches, we present a technique for capturing and replay-ing executions of deployed software. Our technique worksby (1) letting users specify a subsystem of interest, (2) auto-matically identifying the boundary between such subsystemand the rest of the application, (3) efficiently capturing at run-time all interactions across this boundary, and (4) replayingthe recorded interactions on the subsystem in isolation.
The technique can be useful for many maintenance tasks.In testing, for instance, the ability to capture and replay ex-ecutions can allow for automatically getting test cases fromusers. Given a deployed program, we could capture user exe-cutions, collect and group them into test suites, and then usesuch test suites for validating the program in the way it is
∗We presented an early version of this work at WODA 2005 [10]. In thispaper, we extend the technique, describe the SCARPE tool, discuss possibleapplications of the approach, and present a more extensive empirical study.
used. For another example, capture and replay would alsoallow for performing dynamic analyses that impose a highoverhead on the execution time. In this case, we could captureexecutions of the uninstrumented program and then performthe expensive analyses off-line, while replaying.
State of the Art. Most existing capture-replay techniquesand tools (e.g., WinRunner [17]) are defined to be used in-house, typically during testing. These techniques cannotbe used in the field, where many additional constraints ap-ply. First, traditional techniques capture complete executions,which may require to record and transfer a huge volume ofdata for each execution. Second, existing techniques typi-cally capture inputs to an application, which can be difficultand may require ad-hoc mechanisms, depending on the waythe application interacts with its environment (e.g., via a net-work, through a GUI). Third, there are issues related to sideeffects. If a captured execution has side effects on the sys-tem on which it runs, which is typically the case, replaying itmay corrupt the system. Furthermore, the environment mayhave changed between capture and replay time, and there isno guarantee that the system will behave in the same wayduring replay. Finally, existing techniques are not concernedwith efficiency because they are not designed to be used on-line or on any kind of deployed software. Therefore, thesetechniques typically impose a huge overhead during capture.
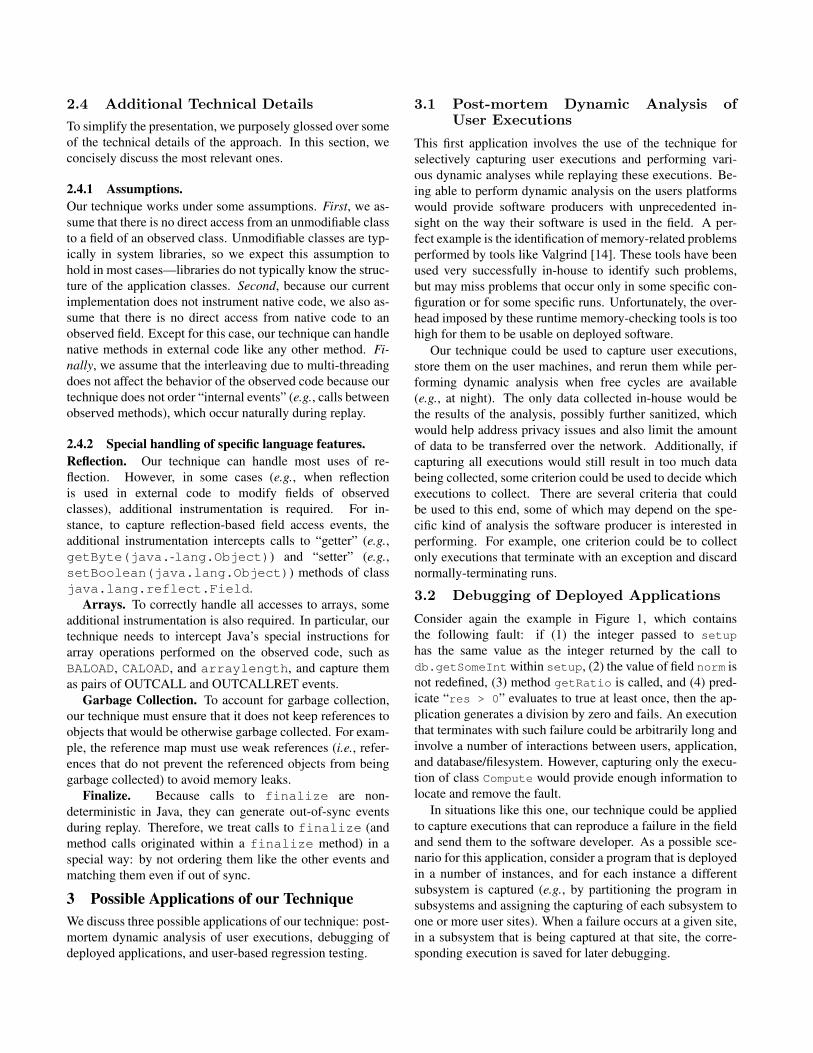
To better illustrate the above issues, Figure 1 shows a soft-ware system that will be used as an example in the rest ofthe paper. The system is a networked, multi-user applicationthat receives inputs from users and performs read and writeaccesses to both a database and the filesystem. The exampleis representative of situations in which capturing all of the in-formation required to replay a whole execution would involvetechnical challenges (e.g., collecting the data that flows fromthe users to the application and vice versa), storage problems(e.g., the technique may have to record consistent portions ofthe database), and privacy issues (e.g., the information pro-vided by the users may be confidential). Using this kind ofapplication as an example lets us stress that many systemsare complex and operate in a varied and complicated envi-ronment. However, the above issues would arise, to differentextents, for most applications (e.g., mail clients, word proces-sors, web servers).
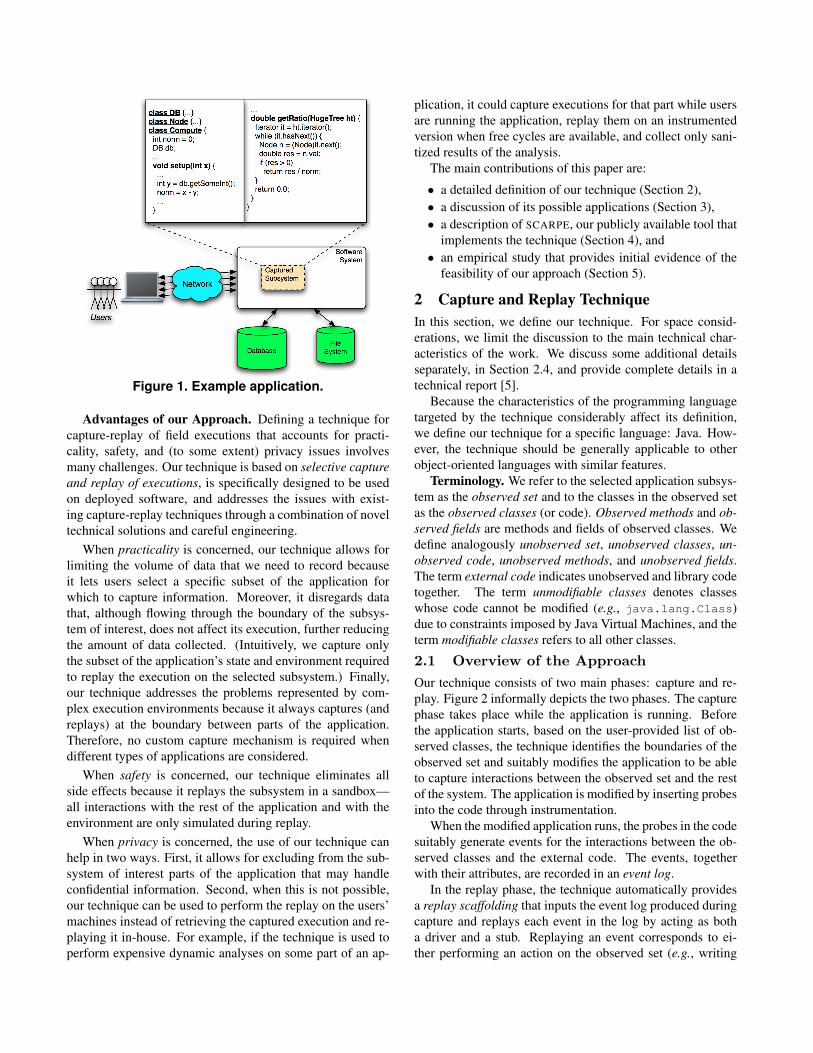
So#t%areSystem
Database.ile
System
CapturedSubsystem
class &' 67778class (ode 67778class Compute 6 int norm : ;< D= db< 777 void setup3int x6 6 777 int y : db7getSomeInt@A< norm : x C y< 777 8
!sers
Det%orE
777 dou7le getRatio3:ugeTree ht6 6 Iterator it : Ft7iterator@A< %File @it7FasDext@AA 6 Dode n : @DodeAit7next@A< double res : n7val< i# @res H ;A return res I norm< 8 return ;7;< 88
Figure 1. Example application.
Advantages of our Approach. Defining a technique forcapture-replay of field executions that accounts for practi-cality, safety, and (to some extent) privacy issues involvesmany challenges. Our technique is based on selective captureand replay of executions, is specifically designed to be usedon deployed software, and addresses the issues with exist-ing capture-replay techniques through a combination of noveltechnical solutions and careful engineering.
When practicality is concerned, our technique allows forlimiting the volume of data that we need to record becauseit lets users select a specific subset of the application forwhich to capture information. Moreover, it disregards datathat, although flowing through the boundary of the subsys-tem of interest, does not affect its execution, further reducingthe amount of data collected. (Intuitively, we capture onlythe subset of the application’s state and environment requiredto replay the execution on the selected subsystem.) Finally,our technique addresses the problems represented by com-plex execution environments because it always captures (andreplays) at the boundary between parts of the application.Therefore, no custom capture mechanism is required whendifferent types of applications are considered.
When safety is concerned, our technique eliminates allside effects because it replays the subsystem in a sandbox—all interactions with the rest of the application and with theenvironment are only simulated during replay.
When privacy is concerned, the use of our technique canhelp in two ways. First, it allows for excluding from the sub-system of interest parts of the application that may handleconfidential information. Second, when this is not possible,our technique can be used to perform the replay on the users’machines instead of retrieving the captured execution and re-playing it in-house. For example, if the technique is used toperform expensive dynamic analyses on some part of an ap-
plication, it could capture executions for that part while usersare running the application, replay them on an instrumentedversion when free cycles are available, and collect only sani-tized results of the analysis.
The main contributions of this paper are:
• a detailed definition of our technique (Section 2),• a discussion of its possible applications (Section 3),• a description of SCARPE, our publicly available tool that
implements the technique (Section 4), and• an empirical study that provides initial evidence of the
feasibility of our approach (Section 5).
2 Capture and Replay TechniqueIn this section, we define our technique. For space consid-erations, we limit the discussion to the main technical char-acteristics of the work. We discuss some additional detailsseparately, in Section 2.4, and provide complete details in atechnical report [5].
Because the characteristics of the programming languagetargeted by the technique considerably affect its definition,we define our technique for a specific language: Java. How-ever, the technique should be generally applicable to otherobject-oriented languages with similar features.
Terminology. We refer to the selected application subsys-tem as the observed set and to the classes in the observed setas the observed classes (or code). Observed methods and ob-served fields are methods and fields of observed classes. Wedefine analogously unobserved set, unobserved classes, un-observed code, unobserved methods, and unobserved fields.The term external code indicates unobserved and library codetogether. The term unmodifiable classes denotes classeswhose code cannot be modified (e.g., java.lang.Class)due to constraints imposed by Java Virtual Machines, and theterm modifiable classes refers to all other classes.
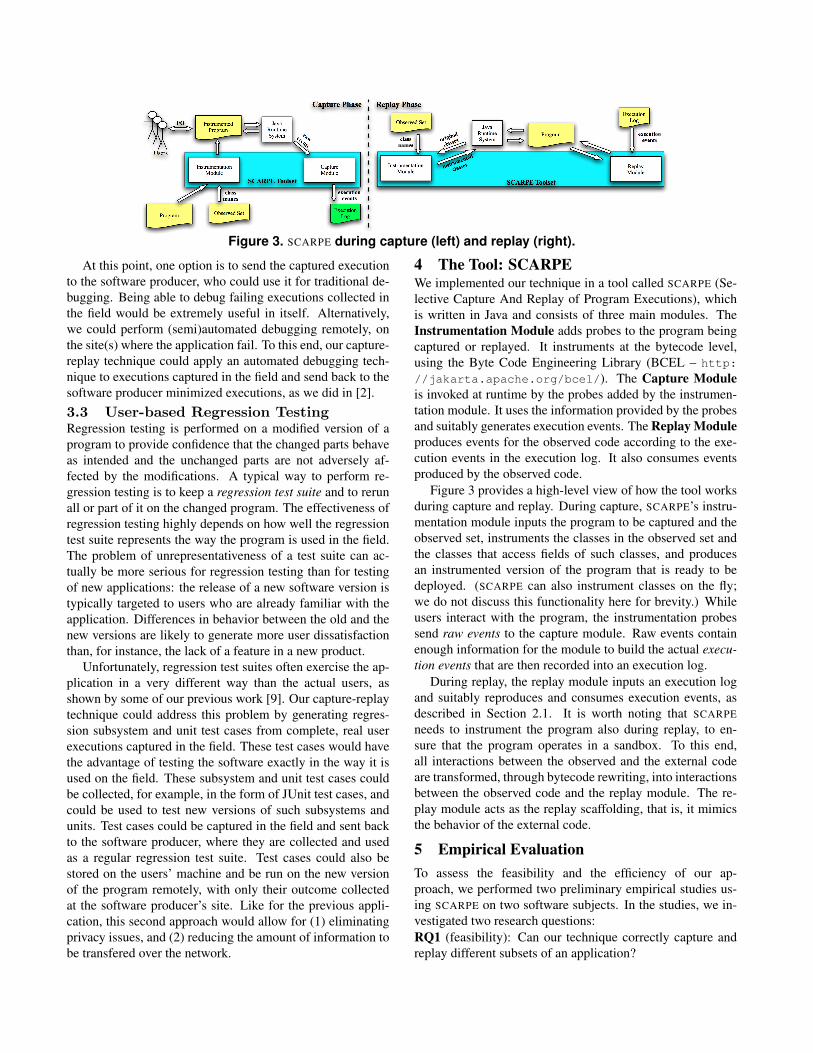
2.1 Overview of the ApproachOur technique consists of two main phases: capture and re-play. Figure 2 informally depicts the two phases. The capturephase takes place while the application is running. Beforethe application starts, based on the user-provided list of ob-served classes, the technique identifies the boundaries of theobserved set and suitably modifies the application to be ableto capture interactions between the observed set and the restof the system. The application is modified by inserting probesinto the code through instrumentation.
When the modified application runs, the probes in the codesuitably generate events for the interactions between the ob-served classes and the external code. The events, togetherwith their attributes, are recorded in an event log.
In the replay phase, the technique automatically providesa replay scaffolding that inputs the event log produced duringcapture and replays each event in the log by acting as botha driver and a stub. Replaying an event corresponds to ei-ther performing an action on the observed set (e.g., writing
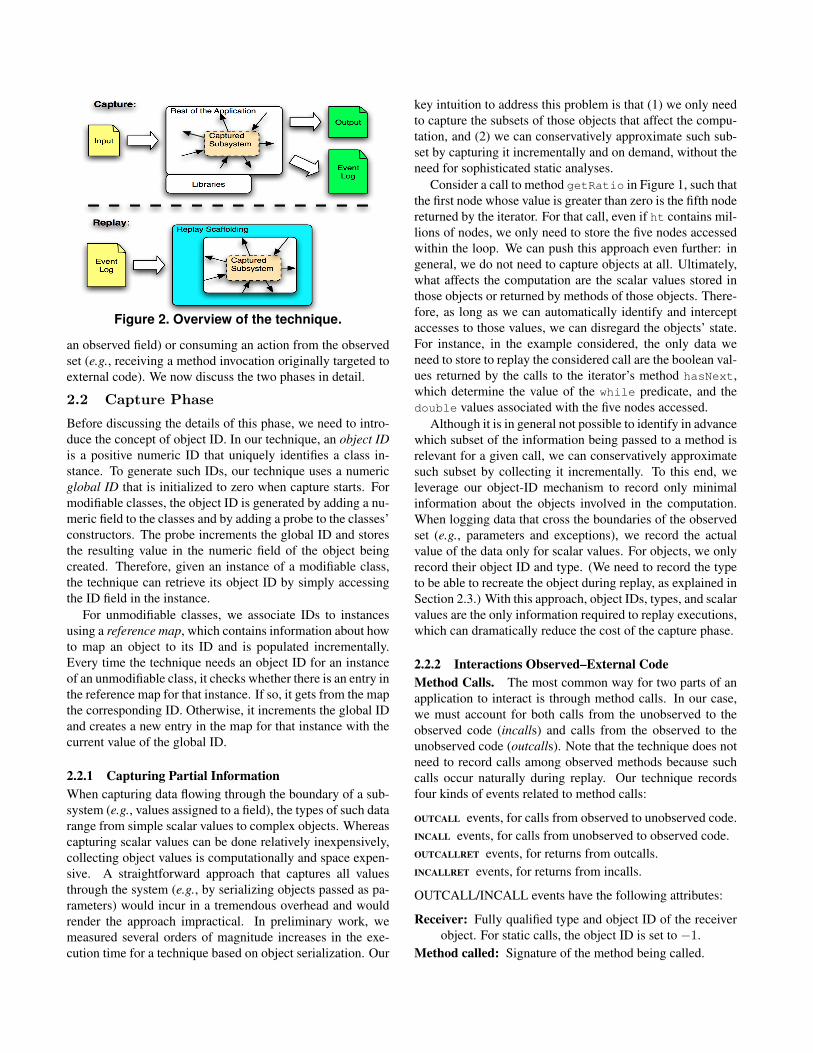
Replay Sca**olding
Rest o* t2e 3pplication
CapturedSubsystem
Libraries
Capture:
Input
Output
Event Log
CapturedSubsystem
Replay:
Event Log
Figure 2. Overview of the technique.
an observed field) or consuming an action from the observedset (e.g., receiving a method invocation originally targeted toexternal code). We now discuss the two phases in detail.
2.2 Capture Phase
Before discussing the details of this phase, we need to intro-duce the concept of object ID. In our technique, an object IDis a positive numeric ID that uniquely identifies a class in-stance. To generate such IDs, our technique uses a numericglobal ID that is initialized to zero when capture starts. Formodifiable classes, the object ID is generated by adding a nu-meric field to the classes and by adding a probe to the classes’constructors. The probe increments the global ID and storesthe resulting value in the numeric field of the object beingcreated. Therefore, given an instance of a modifiable class,the technique can retrieve its object ID by simply accessingthe ID field in the instance.
For unmodifiable classes, we associate IDs to instancesusing a reference map, which contains information about howto map an object to its ID and is populated incrementally.Every time the technique needs an object ID for an instanceof an unmodifiable class, it checks whether there is an entry inthe reference map for that instance. If so, it gets from the mapthe corresponding ID. Otherwise, it increments the global IDand creates a new entry in the map for that instance with thecurrent value of the global ID.
2.2.1 Capturing Partial InformationWhen capturing data flowing through the boundary of a sub-system (e.g., values assigned to a field), the types of such datarange from simple scalar values to complex objects. Whereascapturing scalar values can be done relatively inexpensively,collecting object values is computationally and space expen-sive. A straightforward approach that captures all valuesthrough the system (e.g., by serializing objects passed as pa-rameters) would incur in a tremendous overhead and wouldrender the approach impractical. In preliminary work, wemeasured several orders of magnitude increases in the exe-cution time for a technique based on object serialization. Our
key intuition to address this problem is that (1) we only needto capture the subsets of those objects that affect the compu-tation, and (2) we can conservatively approximate such sub-set by capturing it incrementally and on demand, without theneed for sophisticated static analyses.
Consider a call to method getRatio in Figure 1, such thatthe first node whose value is greater than zero is the fifth nodereturned by the iterator. For that call, even if ht contains mil-lions of nodes, we only need to store the five nodes accessedwithin the loop. We can push this approach even further: ingeneral, we do not need to capture objects at all. Ultimately,what affects the computation are the scalar values stored inthose objects or returned by methods of those objects. There-fore, as long as we can automatically identify and interceptaccesses to those values, we can disregard the objects’ state.For instance, in the example considered, the only data weneed to store to replay the considered call are the boolean val-ues returned by the calls to the iterator’s method hasNext,which determine the value of the while predicate, and thedouble values associated with the five nodes accessed.
Although it is in general not possible to identify in advancewhich subset of the information being passed to a method isrelevant for a given call, we can conservatively approximatesuch subset by collecting it incrementally. To this end, weleverage our object-ID mechanism to record only minimalinformation about the objects involved in the computation.When logging data that cross the boundaries of the observedset (e.g., parameters and exceptions), we record the actualvalue of the data only for scalar values. For objects, we onlyrecord their object ID and type. (We need to record the typeto be able to recreate the object during replay, as explained inSection 2.3.) With this approach, object IDs, types, and scalarvalues are the only information required to replay executions,which can dramatically reduce the cost of the capture phase.
2.2.2 Interactions Observed–External CodeMethod Calls. The most common way for two parts of anapplication to interact is through method calls. In our case,we must account for both calls from the unobserved to theobserved code (incalls) and calls from the observed to theunobserved code (outcalls). Note that the technique does notneed to record calls among observed methods because suchcalls occur naturally during replay. Our technique recordsfour kinds of events related to method calls:
OUTCALL events, for calls from observed to unobserved code.INCALL events, for calls from unobserved to observed code.OUTCALLRET events, for returns from outcalls.INCALLRET events, for returns from incalls.
OUTCALL/INCALL events have the following attributes:
Receiver: Fully qualified type and object ID of the receiverobject. For static calls, the object ID is set to −1.
Method called: Signature of the method being called.
Parameters: A list of elements, one for each parameter. Forscalar parameters, the list contains the actual value ofthe parameters, whereas for object parameters, the listcontains the type of the parameter and the correspondingobject ID (or a zero value, if the parameter is null).
OUTCALLRET and INCALLRET events have only one at-tribute: the value returned. Like call parameters, the attributeis the actual value in the case of scalar values, whereas it isthe type of the value and the corresponding object ID if anobject is returned. To capture OUTCALL events, our tech-nique modifies each observed method by adding a probe be-fore each call to an external method. The signature of themethod called is known statically, whereas the receiver’s typeand object ID and the information about the parameters isgenerally gathered at runtime.
To capture INCALL and INCALLRET events, our tech-nique performs two steps. First, it replaces each public ob-served method m with a proxy method and an actual method.The actual method has the same body as m (modulo someinstrumentation), but has a different signature that takes anadditional parameter of a special type. The proxy method,conversely, has exactly the same signature as m, but a differ-ent implementation. The proxy method (1) creates and logsan appropriate INCALL event, (2) calls the actual method byspecifying the same parameters it received plus the parameterof the special type, (3) collects the value returned by the ac-tual method (if any) and logs an INCALLRET event, and (4)returns to its caller the collected value (if any). In this case,all the information needed to log the events, except for theobject ID and the return value, can be computed statically.
Second, it modifies all calls from observed methods topublic observed methods by adding the additional parame-ter of the special type mentioned above. In this way, we areguaranteed that calls that do not cross the boundaries of theobserved code invoke the actual (and not the proxy) methodand do not log any spurious INCALL or INCALLRET event(these calls and returns occur naturally during replay).
Finally, to capture OUTCALLRET events, our techniqueagain modifies the observed methods: it instruments each callto an external method by adding a probe that stores the valuereturned by the call (if any) and logs it.
Access to Fields. Interactions between different parts of anapplication also occur through field accesses. To accountfor these interactions, our technique records accesses to ob-served fields from unobserved code and accesses from ob-served code to unobserved fields and fields of library classes.For accesses from unobserved code to observed fields, weonly record write accesses—read accesses do not affect thebehavior of the observed classes and are irrelevant for replay.We record three kinds of events for accesses to fields:
OUTREAD events, for read accesses from observed code to un-observed or library fields.
OUTWRITE events, for write accesses from observed code tounobserved or library fields.
INWRITE events, for modifications to an observed field per-formed by external code.
These three events have the following attributes:Receiver: Fully qualified type and object ID of the object
whose field is being read or modified. As before, value−1 is used in the case of access to a static field.
Field Name: Name of the field being accessed.Value: Value being either read from or assigned to the field.
Also in this case, the value corresponds to the actualvalues for scalar fields and to an object ID or zero (fornull) otherwise.
To capture OUTREAD and OUTWRITE events, the tech-nique first analyzes the observed code and identifies all theaccesses to fields of external classes. Then, it adds a probeto each identified access: for read accesses, the probe logsan OUTREAD event with the value being read; for write ac-cesses, the probe logs an OUTWRITE event with the valuebeing written. The information about the field name is com-puted statically and added to the probes, whereas the informa-tion about the type and object ID is computed dynamically.
INWRITE events are captured similarly to OUTWRITEevents. The only difference is that the technique analyzes themodifiable external classes, instead of the observed ones, andinstruments accesses to observed fields.
Exceptions. Exceptions too can cause interactions betweendifferent parts of an application. For example, for the code inFigure 1, if the call to ht.iterator() in method getRatioterminated with an exception, the rest of the code in themethod would not be executed. Not reproducing the excep-tion during replay would result in a complete execution ofthe method, which does not correctly reproduce the recordedbehavior. However, there is no point in getRatio’s code inwhich the fact that an exception has occurred is explicit.
To capture interactions that occur due to exceptions, ourtechnique records two types of events: (1) EXCIN, for ex-ceptions that propagate from external to observed code; and(2) EXCOUT, for exceptions that propagate from observed toexternal code. EXCIN and EXCOUT events have only oneattribute that consists of the type and object ID of the corre-sponding exception. The mechanism to capture exceptions isfairly complex [5]. Intuitively, our techniques captures excep-tions by wrapping relevant methods in try-catch blockthat suitably log exceptions and re-throw them.
2.3 Replay PhaseIn the replay phase, our technique first performs two stepsanalogous in nature to the first two steps of the capture phase:it (1) identifies all the interactions between observed and ex-ternal code, and (2) suitably instruments the application code.Then, it inputs an event log generated during capture and, foreach event, either performs some action on the observed codeor consumes some action coming from the observed code.
2.3.1 Object CreationIn Section 2.2, we discussed how our technique associates ob-ject IDs to objects during capture. Although we use a globalID and a reference map also during replay, the handling ofIDs is different in this case. Unlike the capture phase, whichassociates IDs to objects flowing across the subsystem bound-aries, the replay phase extracts object IDs from the events’attributes and retrieves or creates the corresponding objects.Another difference between the two phases is that, during re-play, all object IDs are stored in a reference map.
Instances of External Classes. Every time the techniqueprocesses an event whose attributes contain an object ID, itlooks for a corresponding entry in the reference map. (Theonly exception is the case of object IDs with values zero or−1, which correspond to null values and static accesses, re-spectively.) If it finds an entry, it retrieves the object associ-ated with that entry and uses it to reproduce the event. Oth-erwise, the technique increments the global counter, creates aplaceholder object of the appropriate type, and creates a newentry in the map for that instance with the current value of theglobal ID. A placeholder object is an object whose type andidentity are meaningful, but whose state (i.e., the actual valueof its fields) is irrelevant. We need to preserve objects’ iden-tity and type during replay for the execution to be type safeand to support some forms of reflection (e.g., instanceof).Our technique uses placeholder constructors to build place-holder objects. For modifiable classes, the placeholder con-structor is a new constructor added by our technique. Theconstructor takes a parameter of a special type, to make surethat its signature does not clash with any existing constructor,and contains only one statement—a call to its superclass’splaceholder constructor.
For unmodifiable classes, our technique searches for asuitable constructor among the existing constructors for theclass. In our current implementation, for simplicity, we hard-code the constructor to be used in these special cases (e.g.,java.lang.Class), but other approaches could be used.
Instances of Observed Classes. The case of observedclasses is simpler. When replaying the incall to a construc-tor, the technique retrieves the object ID associated with theINCALL event, creates the object by calling the constructor(see Section 2.3.2), and adds an entry to the reference mapfor that instance and object ID. Note that, because of the wayin which we replay events, instances will always be createdin the same order. Therefore, we can use object IDs to cor-rectly identify corresponding instances in the capture and re-play phases and correctly reproduce events during replay.
2.3.2 Events ReplayingDuring replay, our technique acts as both a driver and a stub.It provides the scaffolding that mimics the behavior of the ex-ternal code for executing the observed code in isolation. Thereplay scaffolding processes the events in the event log and
passes the control to the observed code for INCALL, OUT-CALLRET, and EXCIN events. When control returns to thescaffolding (e.g., because an incall returns or an exception isthrown), the scaffolding checks whether the event receivedfrom the code matches the next event in the log. If so, it readsthe following event and continues the replay. Otherwise, it re-ports the problem and waits for a decision from the user, whocan either stop the execution or skip the unmatched event andcontinue. The case of events that do not match (out-of-syncevents) can occur only when replaying events on a differentversion of the observed code than the one used during capture(e.g., if the technique is used for regression testing).
Note that, whereas recording INCALL, INWRITE, OUT-CALLRET, and EXCIN events (incoming events) is neces-sary to replay executions, the need for recording the eventsgenerated in the observed code(outgoing events) depends onthe specific use of our technique. For example, if we use thetechnique to generate unit or subsystem test cases for regres-sion testing, outgoing events are useful because they can beused as oracles. For a different example, if we use the tech-nique to compute def-use coverage off-line, we can disregardoutgoing events. For space reason, instead of discussing howour technique replays the various events, we only illustratethe replay of one type of events, OUTCALL events, using theexample code in Figure 1. The mechanisms used to replay allother types of events are discussed in detail in [5].
OUTCALL events are consumed by the replay scaf-folding. Our technique instruments all observed classesso that each call to external classes is divided into twoparts: the invocation of a specific method of the scaffold-ing (consumeCall), whose parameters contain informationabout the call, and an assignment that stores the value re-turned by consumeCall, if any, in the right variable in theobserved code. For example, for the code in Figure 1, state-ment “Iterator it = ht.iterator();” would be re-placed by the code (assuming that classes HugeTree andIterator are defined in package foo):
Object tmp = scaffolding.consumeCall(‘‘foo/HugeTree’’,
< object ID for ht >,
‘‘iterator:()Lfoo/Iterator’’,
< empty array of paramters >);
Iterator it = (Iterator)tmp;
Method consumeCall retrieves the next event from the eventlog and checks whether the event is of type OUTCALL andthe parameters match the attributes of the event. If so, thereplay continues with the next event. Otherwise, if either theevent is of the wrong type or the parameters do not match(e.g., the target of the call differs between capture and replayor a parameter of the outcall does not match the correspond-ing captured parameter), an error is reported to the user.
2.4 Additional Technical DetailsTo simplify the presentation, we purposely glossed over someof the technical details of the approach. In this section, weconcisely discuss the most relevant ones.
2.4.1 Assumptions.Our technique works under some assumptions. First, we as-sume that there is no direct access from an unmodifiable classto a field of an observed class. Unmodifiable classes are typ-ically in system libraries, so we expect this assumption tohold in most cases—libraries do not typically know the struc-ture of the application classes. Second, because our currentimplementation does not instrument native code, we also as-sume that there is no direct access from native code to anobserved field. Except for this case, our technique can handlenative methods in external code like any other method. Fi-nally, we assume that the interleaving due to multi-threadingdoes not affect the behavior of the observed code because ourtechnique does not order “internal events” (e.g., calls betweenobserved methods), which occur naturally during replay.
2.4.2 Special handling of specific language features.Reflection. Our technique can handle most uses of re-flection. However, in some cases (e.g., when reflectionis used in external code to modify fields of observedclasses), additional instrumentation is required. For in-stance, to capture reflection-based field access events, theadditional instrumentation intercepts calls to “getter” (e.g.,getByte(java.-lang.Object)) and “setter” (e.g.,setBoolean(java.lang.Object)) methods of classjava.lang.reflect.Field.
Arrays. To correctly handle all accesses to arrays, someadditional instrumentation is also required. In particular, ourtechnique needs to intercept Java’s special instructions forarray operations performed on the observed code, such asBALOAD, CALOAD, and arraylength, and capture themas pairs of OUTCALL and OUTCALLRET events.
Garbage Collection. To account for garbage collection,our technique must ensure that it does not keep references toobjects that would be otherwise garbage collected. For exam-ple, the reference map must use weak references (i.e., refer-ences that do not prevent the referenced objects from beinggarbage collected) to avoid memory leaks.
Finalize. Because calls to finalize are non-deterministic in Java, they can generate out-of-sync eventsduring replay. Therefore, we treat calls to finalize (andmethod calls originated within a finalize method) in aspecial way: by not ordering them like the other events andmatching them even if out of sync.
3 Possible Applications of our TechniqueWe discuss three possible applications of our technique: post-mortem dynamic analysis of user executions, debugging ofdeployed applications, and user-based regression testing.
3.1 Post-mortem Dynamic Analysis ofUser Executions
This first application involves the use of the technique forselectively capturing user executions and performing vari-ous dynamic analyses while replaying these executions. Be-ing able to perform dynamic analysis on the users platformswould provide software producers with unprecedented in-sight on the way their software is used in the field. A per-fect example is the identification of memory-related problemsperformed by tools like Valgrind [14]. These tools have beenused very successfully in-house to identify such problems,but may miss problems that occur only in some specific con-figuration or for some specific runs. Unfortunately, the over-head imposed by these runtime memory-checking tools is toohigh for them to be usable on deployed software.
Our technique could be used to capture user executions,store them on the user machines, and rerun them while per-forming dynamic analysis when free cycles are available(e.g., at night). The only data collected in-house would bethe results of the analysis, possibly further sanitized, whichwould help address privacy issues and also limit the amountof data to be transferred over the network. Additionally, ifcapturing all executions would still result in too much databeing collected, some criterion could be used to decide whichexecutions to collect. There are several criteria that couldbe used to this end, some of which may depend on the spe-cific kind of analysis the software producer is interested inperforming. For example, one criterion could be to collectonly executions that terminate with an exception and discardnormally-terminating runs.
3.2 Debugging of Deployed Applications
Consider again the example in Figure 1, which containsthe following fault: if (1) the integer passed to setup
has the same value as the integer returned by the call todb.getSomeInt within setup, (2) the value of field norm isnot redefined, (3) method getRatio is called, and (4) pred-icate “res > 0” evaluates to true at least once, then the ap-plication generates a division by zero and fails. An executionthat terminates with such failure could be arbitrarily long andinvolve a number of interactions between users, application,and database/filesystem. However, capturing only the execu-tion of class Compute would provide enough information tolocate and remove the fault.
In situations like this one, our technique could be appliedto capture executions that can reproduce a failure in the fieldand send them to the software developer. As a possible sce-nario for this application, consider a program that is deployedin a number of instances, and for each instance a differentsubsystem is captured (e.g., by partitioning the program insubsystems and assigning the capturing of each subsystem toone or more user sites). When a failure occurs at a given site,in a subsystem that is being captured at that site, the corre-sponding execution is saved for later debugging.
Replay Phase
Observed SetExecution
Log
ReplayModule
Program executionevents
InstrumentationModule
JavaRuntimeSystemoriginal
classes
instrumented
classes
SCARPE Toolset
classnames
Program
InstrumentationModule
SCARPE Toolset
Users
Observed Set
CaptureModule
InstrumentedProgram
JavaRuntimeSystem rawevents
Capture Phase
Execution Log
executionevents
I/O
classnames
Figure 3. SCARPE during capture (left) and replay (right).
At this point, one option is to send the captured executionto the software producer, who could use it for traditional de-bugging. Being able to debug failing executions collected inthe field would be extremely useful in itself. Alternatively,we could perform (semi)automated debugging remotely, onthe site(s) where the application fail. To this end, our capture-replay technique could apply an automated debugging tech-nique to executions captured in the field and send back to thesoftware producer minimized executions, as we did in [2].3.3 User-based Regression TestingRegression testing is performed on a modified version of aprogram to provide confidence that the changed parts behaveas intended and the unchanged parts are not adversely af-fected by the modifications. A typical way to perform re-gression testing is to keep a regression test suite and to rerunall or part of it on the changed program. The effectiveness ofregression testing highly depends on how well the regressiontest suite represents the way the program is used in the field.The problem of unrepresentativeness of a test suite can ac-tually be more serious for regression testing than for testingof new applications: the release of a new software version istypically targeted to users who are already familiar with theapplication. Differences in behavior between the old and thenew versions are likely to generate more user dissatisfactionthan, for instance, the lack of a feature in a new product.
Unfortunately, regression test suites often exercise the ap-plication in a very different way than the actual users, asshown by some of our previous work [9]. Our capture-replaytechnique could address this problem by generating regres-sion subsystem and unit test cases from complete, real userexecutions captured in the field. These test cases would havethe advantage of testing the software exactly in the way it isused on the field. These subsystem and unit test cases couldbe collected, for example, in the form of JUnit test cases, andcould be used to test new versions of such subsystems andunits. Test cases could be captured in the field and sent backto the software producer, where they are collected and usedas a regular regression test suite. Test cases could also bestored on the users’ machine and be run on the new versionof the program remotely, with only their outcome collectedat the software producer’s site. Like for the previous appli-cation, this second approach would allow for (1) eliminatingprivacy issues, and (2) reducing the amount of information tobe transfered over the network.
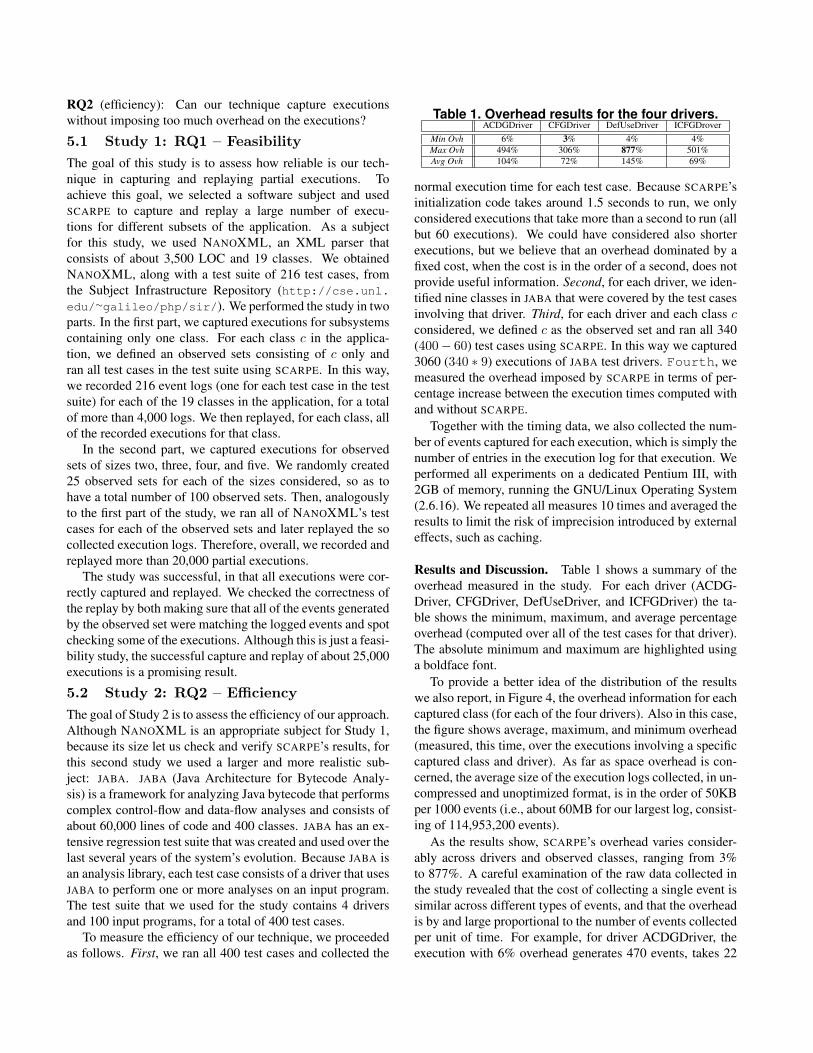
4 The Tool: SCARPEWe implemented our technique in a tool called SCARPE (Se-lective Capture And Replay of Program Executions), whichis written in Java and consists of three main modules. TheInstrumentation Module adds probes to the program beingcaptured or replayed. It instruments at the bytecode level,using the Byte Code Engineering Library (BCEL – http:
//jakarta.apache.org/bcel/). The Capture Moduleis invoked at runtime by the probes added by the instrumen-tation module. It uses the information provided by the probesand suitably generates execution events. The Replay Moduleproduces events for the observed code according to the exe-cution events in the execution log. It also consumes eventsproduced by the observed code.
Figure 3 provides a high-level view of how the tool worksduring capture and replay. During capture, SCARPE’s instru-mentation module inputs the program to be captured and theobserved set, instruments the classes in the observed set andthe classes that access fields of such classes, and producesan instrumented version of the program that is ready to bedeployed. (SCARPE can also instrument classes on the fly;we do not discuss this functionality here for brevity.) Whileusers interact with the program, the instrumentation probessend raw events to the capture module. Raw events containenough information for the module to build the actual execu-tion events that are then recorded into an execution log.
During replay, the replay module inputs an execution logand suitably reproduces and consumes execution events, asdescribed in Section 2.1. It is worth noting that SCARPEneeds to instrument the program also during replay, to en-sure that the program operates in a sandbox. To this end,all interactions between the observed and the external codeare transformed, through bytecode rewriting, into interactionsbetween the observed code and the replay module. The re-play module acts as the replay scaffolding, that is, it mimicsthe behavior of the external code.
5 Empirical EvaluationTo assess the feasibility and the efficiency of our ap-proach, we performed two preliminary empirical studies us-ing SCARPE on two software subjects. In the studies, we in-vestigated two research questions:RQ1 (feasibility): Can our technique correctly capture andreplay different subsets of an application?
RQ2 (efficiency): Can our technique capture executionswithout imposing too much overhead on the executions?
5.1 Study 1: RQ1 – FeasibilityThe goal of this study is to assess how reliable is our tech-nique in capturing and replaying partial executions. Toachieve this goal, we selected a software subject and usedSCARPE to capture and replay a large number of execu-tions for different subsets of the application. As a subjectfor this study, we used NANOXML, an XML parser thatconsists of about 3,500 LOC and 19 classes. We obtainedNANOXML, along with a test suite of 216 test cases, fromthe Subject Infrastructure Repository (http://cse.unl.edu/∼galileo/php/sir/). We performed the study in twoparts. In the first part, we captured executions for subsystemscontaining only one class. For each class c in the applica-tion, we defined an observed sets consisting of c only andran all test cases in the test suite using SCARPE. In this way,we recorded 216 event logs (one for each test case in the testsuite) for each of the 19 classes in the application, for a totalof more than 4,000 logs. We then replayed, for each class, allof the recorded executions for that class.
In the second part, we captured executions for observedsets of sizes two, three, four, and five. We randomly created25 observed sets for each of the sizes considered, so as tohave a total number of 100 observed sets. Then, analogouslyto the first part of the study, we ran all of NANOXML’s testcases for each of the observed sets and later replayed the socollected execution logs. Therefore, overall, we recorded andreplayed more than 20,000 partial executions.
The study was successful, in that all executions were cor-rectly captured and replayed. We checked the correctness ofthe replay by both making sure that all of the events generatedby the observed set were matching the logged events and spotchecking some of the executions. Although this is just a feasi-bility study, the successful capture and replay of about 25,000executions is a promising result.
5.2 Study 2: RQ2 – EfficiencyThe goal of Study 2 is to assess the efficiency of our approach.Although NANOXML is an appropriate subject for Study 1,because its size let us check and verify SCARPE’s results, forthis second study we used a larger and more realistic sub-ject: JABA. JABA (Java Architecture for Bytecode Analy-sis) is a framework for analyzing Java bytecode that performscomplex control-flow and data-flow analyses and consists ofabout 60,000 lines of code and 400 classes. JABA has an ex-tensive regression test suite that was created and used over thelast several years of the system’s evolution. Because JABA isan analysis library, each test case consists of a driver that usesJABA to perform one or more analyses on an input program.The test suite that we used for the study contains 4 driversand 100 input programs, for a total of 400 test cases.
To measure the efficiency of our technique, we proceededas follows. First, we ran all 400 test cases and collected the
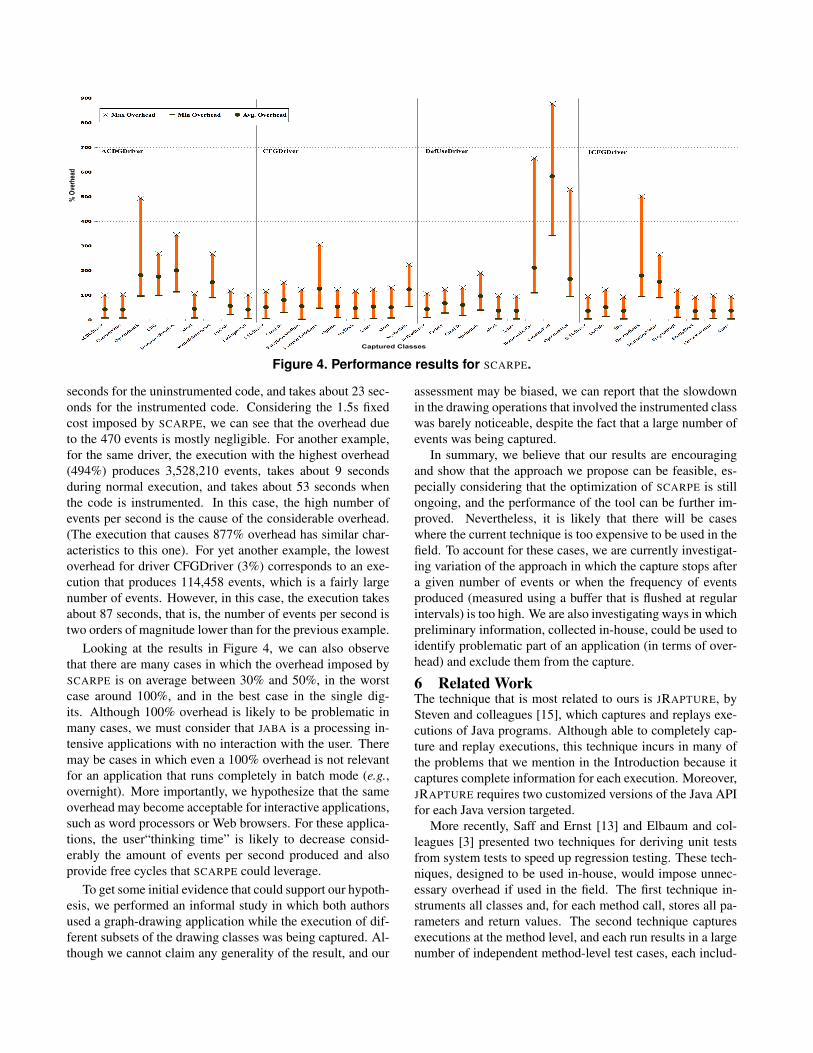
Table 1. Overhead results for the four drivers.ACDGDriver CFGDriver DefUseDriver ICFGDrover
Min Ovh 6% 3% 4% 4%Max Ovh 494% 306% 877% 501%Avg Ovh 104% 72% 145% 69%
normal execution time for each test case. Because SCARPE’sinitialization code takes around 1.5 seconds to run, we onlyconsidered executions that take more than a second to run (allbut 60 executions). We could have considered also shorterexecutions, but we believe that an overhead dominated by afixed cost, when the cost is in the order of a second, does notprovide useful information. Second, for each driver, we iden-tified nine classes in JABA that were covered by the test casesinvolving that driver. Third, for each driver and each class cconsidered, we defined c as the observed set and ran all 340(400− 60) test cases using SCARPE. In this way we captured3060 (340 ∗ 9) executions of JABA test drivers. Fourth, wemeasured the overhead imposed by SCARPE in terms of per-centage increase between the execution times computed withand without SCARPE.
Together with the timing data, we also collected the num-ber of events captured for each execution, which is simply thenumber of entries in the execution log for that execution. Weperformed all experiments on a dedicated Pentium III, with2GB of memory, running the GNU/Linux Operating System(2.6.16). We repeated all measures 10 times and averaged theresults to limit the risk of imprecision introduced by externaleffects, such as caching.
Results and Discussion. Table 1 shows a summary of theoverhead measured in the study. For each driver (ACDG-Driver, CFGDriver, DefUseDriver, and ICFGDriver) the ta-ble shows the minimum, maximum, and average percentageoverhead (computed over all of the test cases for that driver).The absolute minimum and maximum are highlighted usinga boldface font.
To provide a better idea of the distribution of the resultswe also report, in Figure 4, the overhead information for eachcaptured class (for each of the four drivers). Also in this case,the figure shows average, maximum, and minimum overhead(measured, this time, over the executions involving a specificcaptured class and driver). As far as space overhead is con-cerned, the average size of the execution logs collected, in un-compressed and unoptimized format, is in the order of 50KBper 1000 events (i.e., about 60MB for our largest log, consist-ing of 114,953,200 events).
As the results show, SCARPE’s overhead varies consider-ably across drivers and observed classes, ranging from 3%to 877%. A careful examination of the raw data collected inthe study revealed that the cost of collecting a single event issimilar across different types of events, and that the overheadis by and large proportional to the number of events collectedper unit of time. For example, for driver ACDGDriver, theexecution with 6% overhead generates 470 events, takes 22
% O
verh
ead
Captured Classes
Figure 4. Performance results for SCARPE.
seconds for the uninstrumented code, and takes about 23 sec-onds for the instrumented code. Considering the 1.5s fixedcost imposed by SCARPE, we can see that the overhead dueto the 470 events is mostly negligible. For another example,for the same driver, the execution with the highest overhead(494%) produces 3,528,210 events, takes about 9 secondsduring normal execution, and takes about 53 seconds whenthe code is instrumented. In this case, the high number ofevents per second is the cause of the considerable overhead.(The execution that causes 877% overhead has similar char-acteristics to this one). For yet another example, the lowestoverhead for driver CFGDriver (3%) corresponds to an exe-cution that produces 114,458 events, which is a fairly largenumber of events. However, in this case, the execution takesabout 87 seconds, that is, the number of events per second istwo orders of magnitude lower than for the previous example.
Looking at the results in Figure 4, we can also observethat there are many cases in which the overhead imposed bySCARPE is on average between 30% and 50%, in the worstcase around 100%, and in the best case in the single dig-its. Although 100% overhead is likely to be problematic inmany cases, we must consider that JABA is a processing in-tensive applications with no interaction with the user. Theremay be cases in which even a 100% overhead is not relevantfor an application that runs completely in batch mode (e.g.,overnight). More importantly, we hypothesize that the sameoverhead may become acceptable for interactive applications,such as word processors or Web browsers. For these applica-tions, the user“thinking time” is likely to decrease consid-erably the amount of events per second produced and alsoprovide free cycles that SCARPE could leverage.
To get some initial evidence that could support our hypoth-esis, we performed an informal study in which both authorsused a graph-drawing application while the execution of dif-ferent subsets of the drawing classes was being captured. Al-though we cannot claim any generality of the result, and our
assessment may be biased, we can report that the slowdownin the drawing operations that involved the instrumented classwas barely noticeable, despite the fact that a large number ofevents was being captured.
In summary, we believe that our results are encouragingand show that the approach we propose can be feasible, es-pecially considering that the optimization of SCARPE is stillongoing, and the performance of the tool can be further im-proved. Nevertheless, it is likely that there will be caseswhere the current technique is too expensive to be used in thefield. To account for these cases, we are currently investigat-ing variation of the approach in which the capture stops aftera given number of events or when the frequency of eventsproduced (measured using a buffer that is flushed at regularintervals) is too high. We are also investigating ways in whichpreliminary information, collected in-house, could be used toidentify problematic part of an application (in terms of over-head) and exclude them from the capture.
6 Related WorkThe technique that is most related to ours is JRAPTURE, bySteven and colleagues [15], which captures and replays exe-cutions of Java programs. Although able to completely cap-ture and replay executions, this technique incurs in many ofthe problems that we mention in the Introduction because itcaptures complete information for each execution. Moreover,JRAPTURE requires two customized versions of the Java APIfor each Java version targeted.
More recently, Saff and Ernst [13] and Elbaum and col-leagues [3] presented two techniques for deriving unit testsfrom system tests to speed up regression testing. These tech-niques, designed to be used in-house, would impose unnec-essary overhead if used in the field. The first technique in-struments all classes and, for each method call, stores all pa-rameters and return values. The second technique capturesexecutions at the method level, and each run results in a largenumber of independent method-level test cases, each includ-
ing a partial dump of the program state. Although effectivein-house, these techniques would be difficult to use for ourgoals due to the time and space overhead they impose.
Other related techniques perform record and replay fortesting and debugging (e.g., [6, 8, 17]). Also in this case,these techniques are designed to be used in-house, and theoverhead they impose (on space, time, or infrastructure re-quired) is reasonable for their intended use, but would makethem impractical for use on deployed software. In particular,commercial capture-replay tools typically focus on a specificdomain (e.g., GUI-based applications) and require a complexinfrastructure and setup to be used. The few record and re-play techniques that may be efficient enough to be used inthe field (e.g., [6]) require a specialized operating-system orhardware support, which considerably limits their applicabil-ity in the short term.
Other related techniques aim to reproduce the concurrentbehavior of applications (e.g., [1, 7, 12, 16]). Although re-lated, these techniques have different goals and, thus, a dif-ferent set of constraints and tradeoffs. They focus on re-producing, giving the same inputs, the same application be-havior in terms of concurrency-related events, have no needto store input and output values, and do not have efficiencyconstraints (being targeted to debugging). Our technique ismostly concerned with automatically capturing and replay-ing subsystems and has efficiency as a priority because wewant the technique to be usable also on deployed software.
A general difference between our technique and manyother existing techniques is that it works at the applicationlevel, through bytecode rewriting. Because our techniquedoes not require any runtime-system or library support, it canbe used on any platform that provides a standard implementa-tion of the Java Virtual Machine, which improves portabilityand enables the use of the technique on users’ platforms.
7 ConclusionWe have described a technique for partial capture-replay ofuser executions that allows for capturing executions for agiven subsystem and replaying them in a sandbox. We havealso discussed three possible applications of the techniqueand presented a tool, SCARPE, that implements the tech-nique and is freely available (http://www.cc.gatech.edu/∼orso/software.html). Finally, we have presentedan initial empirical evaluation showing that, although there isroom for improvement, the approach is feasible.
Our immediate goal in future work is to improve the im-plementation of SCARPE in terms of performance. This im-provement will be performed in parallel with additional ex-perimentation on more subjects and executions, to further re-fine and extend the approach.
Other future work involves investigating the three applica-tions proposed in the paper. We have already started investi-gating the use of capture-replay techniques for debugging ofdeployed applications and got promising results [2].
AcknowledgmentsThis work was supported in part by NSF awards CCF-0541080 and CCR-0205422 to GA Tech. Bryan Kennedyhelped implementing a first prototype of SCARPE. GreggRothermel provided NANOXML and associated test cases.
References[1] B. Alpern, T. Ngo, J.-D. Choi, and M. Sridharan. Dejavu: Deterministic
java replay debugger for jalapeno java virtual machine. In Proc. ofthe Conf. on Object-Oriented Programming, Systems, Languages, andApplications, pages 165–166, 2000.
[2] J. Clause and A. Orso. A Technique for Enabling and Supporting De-bugging of Field Failures. In Proc. of the 29th Intl. Conf. on SoftwareEngineering, pages 261–270, May 2007.
[3] S. Elbaum, H. N. Chin, M. Dwyer, and J. Dokulil. Carving DifferentialUnit Test Cases from System Test Cases. In Proc. of the 14th Sympo-sium on the Foundations of Software Engineering, Nov. 2006.
[4] S. Elbaum and M. Diep. Profiling Deployed Software: AssessingStrategies and Testing Opportunities. IEEE Transactions on SoftwareEngineering, 31(4):312–327, 2005.
[5] S. Joshi and A. Orso. Capture and Replay of User Executions and itsApplications. Technical Report 2006-04-14, Georgia Tech – College ofComputing, Apr. 2006. http://www.cc.gatech.edu/∼orso/papers/abstracts.html#joshi06apr-tr.
[6] S. King, G. Dunlap, and P. Chen. Debugging operating systems withtime-traveling virtual machines. In Proc. of the Usenix Annual Techni-cal Conf., pages 1–15, Apr. 2005.
[7] R. Konuru, H. Srinivasan, and J.-D. Choi. Deterministic replay of dis-tributed java applications. In In Proc. of the 14th Intl. Parallel & Dis-tributed Processing Symposium, pages 219–228, 2000.
[8] Mercury LoadRunner, 2006. http://www.mercury.com/us/products/performance-center/loadrunner/.
[9] A. Orso, T. Apiwattanapong, and M. J. Harrold. Leveraging field datafor impact analysis and regression testing. In Proc. of the 9th EuropeanSoftware Engineering Conf. and 10th Symposium on the Foundations ofSoftware Engineering, pages 128–137, Sep. 2003.
[10] A. Orso and B. Kennedy. Selective Capture and Replay of ProgramExecutions. In Proc. of the Third Intl. ICSE Workshop on DynamicAnalysis, pages 29–35, May 2005.
[11] C. Pavlopoulou and M. Young. Residual test coverage monitoring. InProc. of the 21st Intl. Conf. on Software Engineering, pages 277–284,May 1999.
[12] M. Russinovich and B. Cogswell. Replay for concurrent non-deterministic shared-memory applications. In Proc. of Conf. on Pro-gramming Languages and Implementation, pages 258–266, 1996.
[13] D. Saff, S. Artzi, J. H. Perkins, and M. D. Ernst. Automatic Test Fac-toring for Java. In Proc. of the 20th Intl. Conf. on Automated SoftwareEngineering, pages 114–123, Nov. 2005.
[14] J. Seward. Valgrind, an Open-Source Memory Debugger for x86-Gnu/Linux, 2002. http://valgrind.kde.org/.
[15] J. Steven, P. Chandra, B. Fleck, and A. Podgurski. jrapture: A cap-ture/replay tool for observation-based testing. In Proc. of the Intl. Sym-posium on Software Testing and Analysis, pages 158–167, Aug. 2000.
[16] K. C. Tai, R. H. Carver, and E. E. Obaid. Debugging concurrent adaprograms by deterministic execution. IEEE Transactions on SoftwareEngineering, 17(1):45–63, 1991.
[17] Mercury WinRunner, 2006. http://www.mercury.com/us/products/quality-center/functional-testing/winrunner.