Embed Size (px)
Citation preview
Scanline forced Delaunay TENs for surface representation
ir. Edward Verbree and prof.dr.ir. Peter van OosteromDepartment of Geodesy – Section GIS-technology
Delft University of Technologythe Netherlands
Commission III, Working Group 3
KEY WORDS: Delaunay Tetrahedron Networks (TEN), TIN, Surface reconstruction
ABSTRACT
The general idea that a Delaunay TIN (DT) is more appropriate than non-Delaunay TINs, due to ‘better’ shaped triangles, might be truefor many applications, but not for height dependent analytical queries. This is because the distribution of the triangle tessellation isdefined in the two-dimensional XY-plane, by ignoring the Z-value in the Delaunay empty circum circle criterion. Alternatively, DataDependent Triangulations (DDT) aim to identify which triangulation of a given function z=f(x,y) over a given set of points will optimizesome quality, i.e. the minimal spatial area of the surface or the volume below the resulting surface. This might be a good approach, butstill there is no certainty the TIN represents the actual surface. Besides that, a 2D-TIN (Delaunay or not) is only capable to solve 2D (or2.5D) data distributions. The reconstruction of the surface given by a set of surface points alone is therefore not unambiguous.
This paper describes a surface reconstruction method based on the scanlines, the lines-of-sight or measurements between the observer (orthe measurement platform) and the target (the measured point). As the scanlines do not belong to the surface, we have to use a ‘real’ 3Dtriangulation construction method, resulting in a Tetrahedronized Irregular Network. This TEN is capable to store all kinds of surface-features (as the target-points) and the scanlines as well. The scanlines are forced to split by adding Steiner points until they are part ofthe Delaunay TEN. This procedure gives us the additional information needed to use the TEN to reconstruct the surface. The method isdemonstrated by the non-trivial case of a set of measured points in a regular square distribution showing the improved surfacereconstruction technique.
1 INTRODUCTION
Triangulated Irregular Networks are commonly used for DigitalTerrain Modeling. These models are needed for severalapplications, in which the height value is often an importantfactor in the calculations and analyses. Visibility computationsand line-of-sight communication problems require an appropriaterepresentation of the ‘real’ terrain-surface.
The advantage of a TIN above other tessellations, like regularsquare grids (RSG), is the possibility to incorporate the exactposition of the measured heightpoints, contourlines and breaklinesinto the model. In that, the actual measurements are wellrepresented. But, one thing we often forget is the fact that thedistribution of the triangle-tessellation is defined in the two-dimensional XY-plane, by ignoring the Z-value in the Delaunayempty circum circle criterion (Lawson, 1977).
The general idea that a Delaunay-TIN is more appropriate thannon-Delaunay TINs because of well-formed triangles might betrue for many applications, but not for height dependentanalytical queries. An alternative is to use a data dependenttriangulation for surface representation (Dyn, 1990). This mightbe a better direction to look for, but still there is no certainty thatthe TIN represents the actual surface. Besides that, a 2D-TIN(Delaunay or not) is only capable to solve 2D or 2.5D datadistributions.
We can however use an additional observation: the scanline. Oneproperty of an observation is the line-of-sight; no surface isallowed between the observation-point and the target-point (theactual point on the surface). Hence, we consider a method fortriangulations forced by scanlines, which means that not only themeasured heightpoints are included into the TIN, but themeasurements as well.
As the scanlines do not contribute to the representation of thesurface, they cannot be treated as the surface features types likebreaklines and contourlines. They could even be perpendicular,which makes it impossible to incorporate them into a 2D TIN. Sowe have to use a ‘real’ 3D triangulation construction method,resulting in a TEN (Tetrahedronized Irregular Network). A TENis also known as a 3D-TIN, indicating the 3D conditions takeninto account at the construction, i.e. in case of a Delaunay TENthe empty circum sphere criterion in contradiction to the emptycircle criterion in the 2D or 2.5D case. This TEN is capable ofstoring all kinds of surface-features, including the scanlines. Thefinal scanline forced TEN gives us the information needed toconstruct the triangles, which will define the surface we arelooking at and the body (volume) of that object as a set oftetrahedrons.
In section 2, we will recall some basics of DelaunayTriangulations (DT) and Data Dependent Triangulations (DDT).Section 3 presents the ideas and some examples for scanlineconstrained TENs in more detail. Section 4 contains some
concluding remarks, where section 5 gives some directions forfurther research.
2 DELAUNAY TRIANGULATIONS AND DATADEPENDENT TRIANGULATIONS
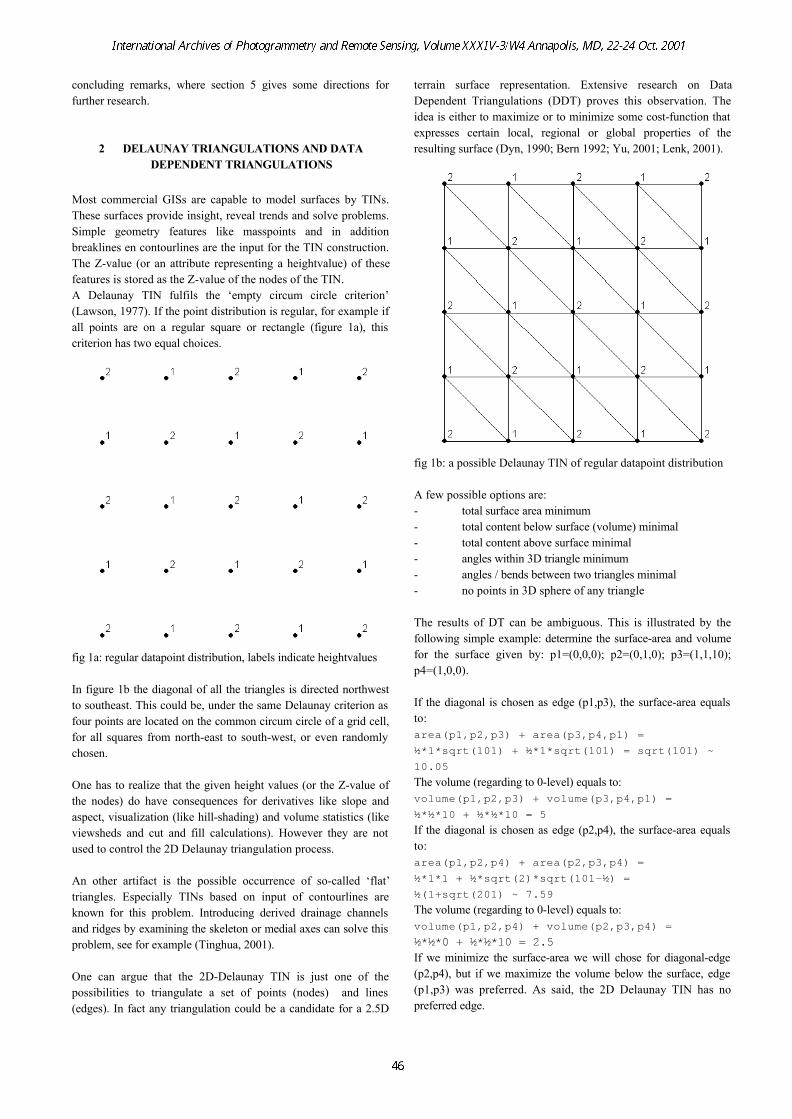
Most commercial GISs are capable to model surfaces by TINs.These surfaces provide insight, reveal trends and solve problems.Simple geometry features like masspoints and in additionbreaklines en contourlines are the input for the TIN construction.The Z-value (or an attribute representing a heightvalue) of thesefeatures is stored as the Z-value of the nodes of the TIN.A Delaunay TIN fulfils the ‘empty circum circle criterion’(Lawson, 1977). If the point distribution is regular, for example ifall points are on a regular square or rectangle (figure 1a), thiscriterion has two equal choices.
fig 1a: regular datapoint distribution, labels indicate heightvalues
In figure 1b the diagonal of all the triangles is directed northwestto southeast. This could be, under the same Delaunay criterion asfour points are located on the common circum circle of a grid cell,for all squares from north-east to south-west, or even randomlychosen.
One has to realize that the given height values (or the Z-value ofthe nodes) do have consequences for derivatives like slope andaspect, visualization (like hill-shading) and volume statistics (likeviewsheds and cut and fill calculations). However they are notused to control the 2D Delaunay triangulation process.
An other artifact is the possible occurrence of so-called ‘flat’triangles. Especially TINs based on input of contourlines areknown for this problem. Introducing derived drainage channelsand ridges by examining the skeleton or medial axes can solve thisproblem, see for example (Tinghua, 2001).
One can argue that the 2D-Delaunay TIN is just one of thepossibilities to triangulate a set of points (nodes) and lines(edges). In fact any triangulation could be a candidate for a 2.5D
terrain surface representation. Extensive research on DataDependent Triangulations (DDT) proves this observation. Theidea is either to maximize or to minimize some cost-function thatexpresses certain local, regional or global properties of theresulting surface (Dyn, 1990; Bern 1992; Yu, 2001; Lenk, 2001).
fig 1b: a possible Delaunay TIN of regular datapoint distribution
A few possible options are:- total surface area minimum- total content below surface (volume) minimal- total content above surface minimal- angles within 3D triangle minimum- angles / bends between two triangles minimal- no points in 3D sphere of any triangle
The results of DT can be ambiguous. This is illustrated by thefollowing simple example: determine the surface-area and volumefor the surface given by: p1=(0,0,0); p2=(0,1,0); p3=(1,1,10);p4=(1,0,0).
If the diagonal is chosen as edge (p1,p3), the surface-area equalsto:area(p1,p2,p3) + area(p3,p4,p1) =½*1*sqrt(101) + ½*1*sqrt(101) = sqrt(101) ~10.05The volume (regarding to 0-level) equals to:volume(p1,p2,p3) + volume(p3,p4,p1) =½*½*10 + ½*½*10 = 5If the diagonal is chosen as edge (p2,p4), the surface-area equalsto:area(p1,p2,p4) + area(p2,p3,p4) =½*1*1 + ½*sqrt(2)*sqrt(101-½) =½(1+sqrt(201) ~ 7.59The volume (regarding to 0-level) equals to:volume(p1,p2,p4) + volume(p2,p3,p4) =½*½*0 + ½*½*10 = 2.5If we minimize the surface-area we will chose for diagonal-edge(p2,p4), but if we maximize the volume below the surface, edge(p1,p3) was preferred. As said, the 2D Delaunay TIN has nopreferred edge.
In this case it could be argued that the 2D Delaunay criterioncould not make the choice and that the better solution is alsoaccording to the criterion. However, it is possible to constructother situation in which the 2D Delaunay solution results in a lessgood 2.5D TIN than a certain alternative; e.g. assume the pointsp1 = (0,1,0), p2 = (1,0,0), p3 = (3,1,0) and p4 = (1,2,10). Thesurface-area on the Delaunay based TIN equal to:½*(sqrt(204) + sqrt(516))which is clearly more thanthe non-Delaunay alternative: 1.5*(1+sqrt(101))
These local optimizations could disregard regional phenomena,like ridges and faults, and as long a projection is made to the XY-plane, no overhanging cliffs or other disturbances are possible.And these disturbances could be the surface-phenomena we arelooking for, like (near) vertical walls of buildings or viaducts.We will therefor forget for the moment the data independent (like2D Delaunay TINs) and data dependent TIN and concentrate onDelaunay 3D-TINs or TENs for surface reconstruction.
3. SCANLINE FORCED TRIANGULATION
Height datapoints are more and more collected by laserscanningfrom a platform at an airplane or helicopter, but scanning from aground platform is also possible. The result of this process is apoint cloud of target-points. To calculate these target-points, theposition of the observer (i.e. the laser itself) has to be known andthus the scanline between the observer point and the target point.In our approach we will use these scanlines for the reconstructionof the surface at an increasing complexity demonstrated by a1.5D, 2D and a 2.5D scenario.
3.1 1.5D Case
In exploring this problem, first a step back was taken as weconsider the 1.5 scenario, where 1D-points are taken, and togetherwith the height value and the scanline a surface is reconstructed.This could be quite trivial to do, because we can order thedatapoints on their X-value. But as, later on, in two dimensionsthis is not straightforward, we have to use an algorithm, whichwill not take this ordering as a precondition.
The aim of the algorithm is to find the object and boundarydefined by a set of heightpoints and scanlines The volume isbounded by the points left and right of the dataset, both given theheightvalue of zero. The scanlines are shortened to a given valueabove the most extreme heightvalue, and for these examplesdropped as perpendiculars.
We will give the algorithm in pseudo-code:
Algorithm ‘Scanline_TIN’step 1: Construct TINinput target-pointscreate ‘scanline forced’ Delaunay TIN
step 2: Transform Edgesfor each scanline get target-point-A
create list of connected scanlines for each connected scanline get target-point-B create edge(target-point-A, target-point-B) end forend for
Step 1: Construct TIN
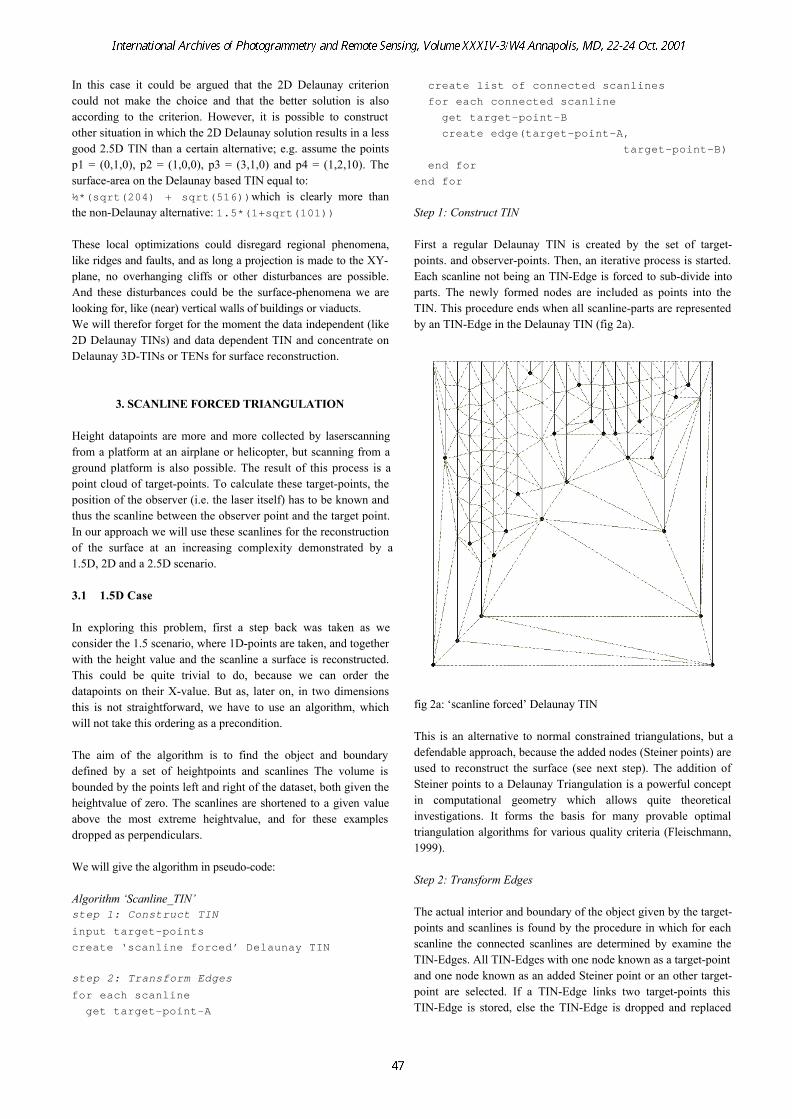
First a regular Delaunay TIN is created by the set of target-points. and observer-points. Then, an iterative process is started.Each scanline not being an TIN-Edge is forced to sub-divide intoparts. The newly formed nodes are included as points into theTIN. This procedure ends when all scanline-parts are representedby an TIN-Edge in the Delaunay TIN (fig 2a).
fig 2a: ‘scanline forced’ Delaunay TIN
This is an alternative to normal constrained triangulations, but adefendable approach, because the added nodes (Steiner points) areused to reconstruct the surface (see next step). The addition ofSteiner points to a Delaunay Triangulation is a powerful conceptin computational geometry which allows quite theoreticalinvestigations. It forms the basis for many provable optimaltriangulation algorithms for various quality criteria (Fleischmann,1999).
Step 2: Transform Edges
The actual interior and boundary of the object given by the target-points and scanlines is found by the procedure in which for eachscanline the connected scanlines are determined by examine theTIN-Edges. All TIN-Edges with one node known as a target-pointand one node known as an added Steiner point or an other target-point are selected. If a TIN-Edge links two target-points thisTIN-Edge is stored, else the TIN-Edge is dropped and replaced
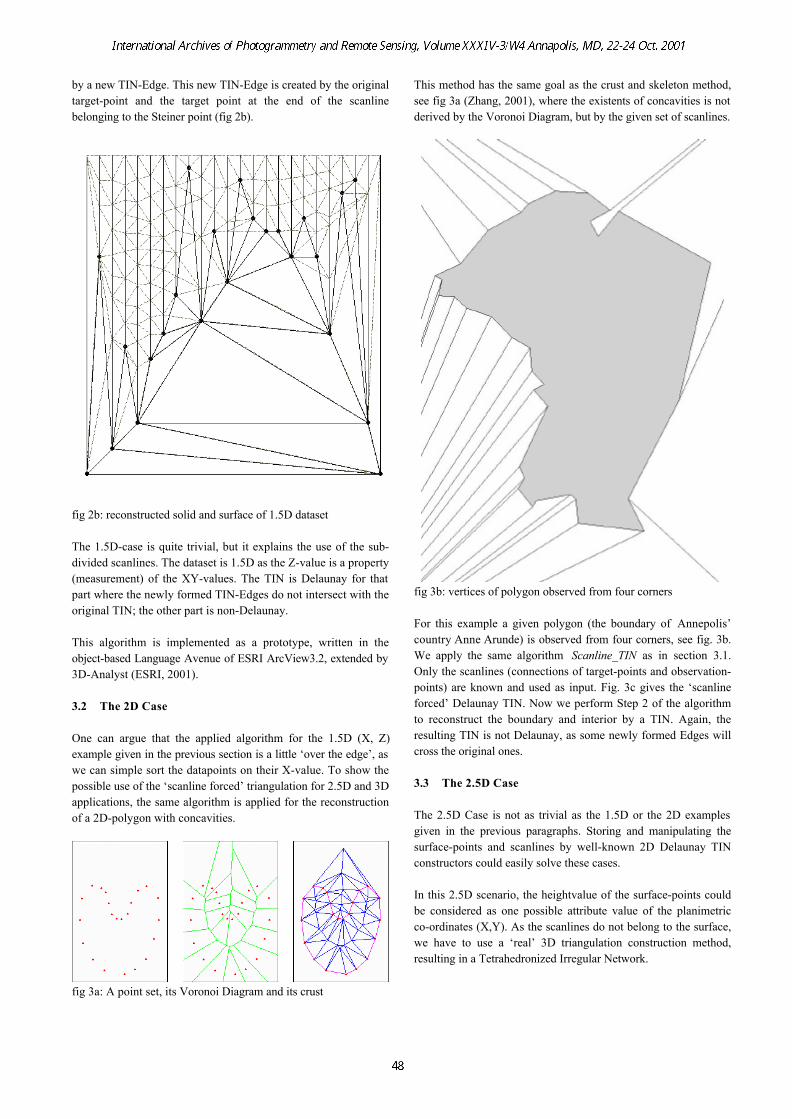
by a new TIN-Edge. This new TIN-Edge is created by the originaltarget-point and the target point at the end of the scanlinebelonging to the Steiner point (fig 2b).
fig 2b: reconstructed solid and surface of 1.5D dataset
The 1.5D-case is quite trivial, but it explains the use of the sub-divided scanlines. The dataset is 1.5D as the Z-value is a property(measurement) of the XY-values. The TIN is Delaunay for thatpart where the newly formed TIN-Edges do not intersect with theoriginal TIN; the other part is non-Delaunay.
This algorithm is implemented as a prototype, written in theobject-based Language Avenue of ESRI ArcView3.2, extended by3D-Analyst (ESRI, 2001).
3.2 The 2D Case
One can argue that the applied algorithm for the 1.5D (X, Z)example given in the previous section is a little ‘over the edge’, aswe can simple sort the datapoints on their X-value. To show thepossible use of the ‘scanline forced’ triangulation for 2.5D and 3Dapplications, the same algorithm is applied for the reconstructionof a 2D-polygon with concavities.
fig 3a: A point set, its Voronoi Diagram and its crust
This method has the same goal as the crust and skeleton method,see fig 3a (Zhang, 2001), where the existents of concavities is notderived by the Voronoi Diagram, but by the given set of scanlines.
fig 3b: vertices of polygon observed from four corners
For this example a given polygon (the boundary of Annepolis’country Anne Arunde) is observed from four corners, see fig. 3b.We apply the same algorithm Scanline_TIN as in section 3.1.Only the scanlines (connections of target-points and observation-points) are known and used as input. Fig. 3c gives the ‘scanlineforced’ Delaunay TIN. Now we perform Step 2 of the algorithmto reconstruct the boundary and interior by a TIN. Again, theresulting TIN is not Delaunay, as some newly formed Edges willcross the original ones.
3.3 The 2.5D Case
The 2.5D Case is not as trivial as the 1.5D or the 2D examplesgiven in the previous paragraphs. Storing and manipulating thesurface-points and scanlines by well-known 2D Delaunay TINconstructors could easily solve these cases.
In this 2.5D scenario, the heightvalue of the surface-points couldbe considered as one possible attribute value of the planimetricco-ordinates (X,Y). As the scanlines do not belong to the surface,we have to use a ‘real’ 3D triangulation construction method,resulting in a Tetrahedronized Irregular Network.
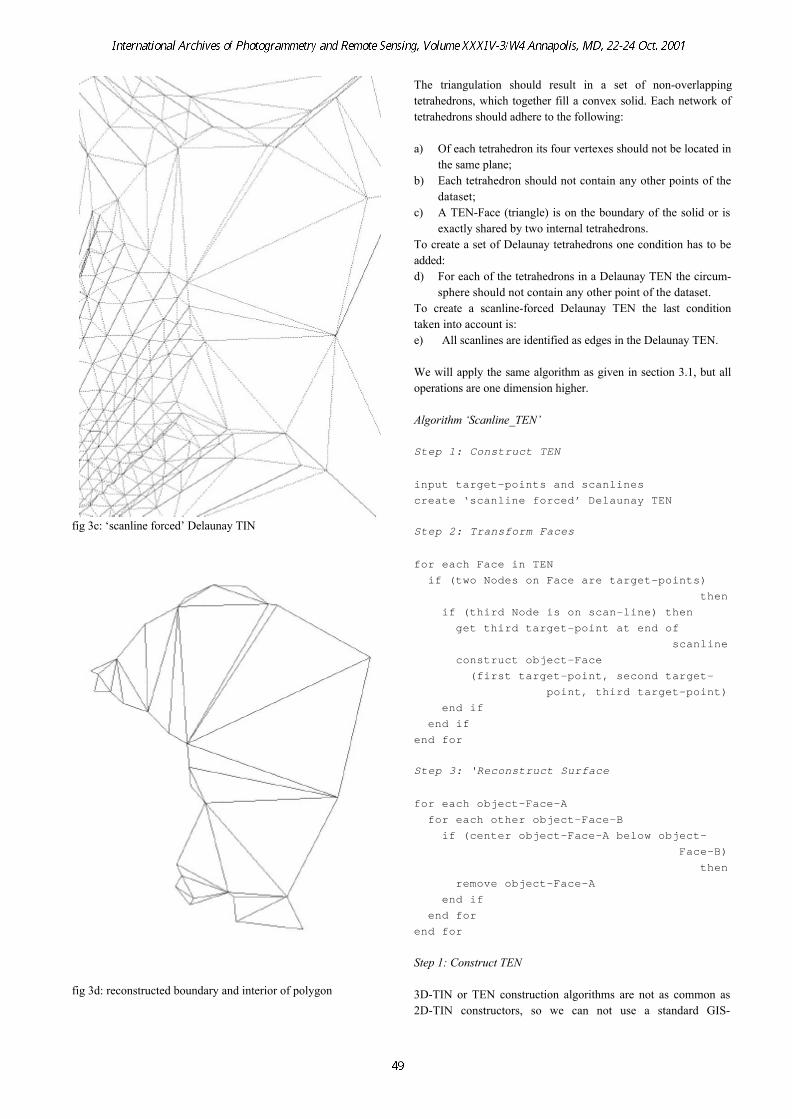
fig 3c: ‘scanline forced’ Delaunay TIN
fig 3d: reconstructed boundary and interior of polygon
The triangulation should result in a set of non-overlappingtetrahedrons, which together fill a convex solid. Each network oftetrahedrons should adhere to the following:
a) Of each tetrahedron its four vertexes should not be located inthe same plane;
b) Each tetrahedron should not contain any other points of thedataset;
c) A TEN-Face (triangle) is on the boundary of the solid or isexactly shared by two internal tetrahedrons.
To create a set of Delaunay tetrahedrons one condition has to beadded:d) For each of the tetrahedrons in a Delaunay TEN the circum-
sphere should not contain any other point of the dataset.To create a scanline-forced Delaunay TEN the last conditiontaken into account is:e) All scanlines are identified as edges in the Delaunay TEN.
We will apply the same algorithm as given in section 3.1, but alloperations are one dimension higher.
Algorithm ‘Scanline_TEN’
Step 1: Construct TEN
input target-points and scanlinescreate ‘scanline forced’ Delaunay TEN
Step 2: Transform Faces
for each Face in TEN if (two Nodes on Face are target-points) then if (third Node is on scan-line) then get third target-point at end of scanline construct object-Face (first target-point, second target- point, third target-point) end if end ifend for
Step 3: ‘Reconstruct Surface
for each object-Face-A for each other object-Face-B if (center object-Face-A below object- Face-B) then remove object-Face-A end if end forend for
Step 1: Construct TEN
3D-TIN or TEN construction algorithms are not as common as2D-TIN constructors, so we can not use a standard GIS-
environment. Recent developments in Computational GeometryAlgorithms Library (CGAL, 2001) are promising, but we haveused an own 3D implementation of the incremental pointalgorithm, given in (Lee, 1980).
This same program is used by one of the authors to createanimated time series (Kraak, 1992). Here an interface to thisprogram is written in the object-based language Avenue to controlthe program and visualize the results in ArcView 3.2 (ESRI,2001).
To be Delaunay, the scanlines are divided until each part is anedge in the TEN, in contradiction to a constrained TEN, where theDelaunay-criterion is loosen to hold the scanline as one part.However, some objects exists that can not be divided intotetrahedrons without adding extra Steiner vertices (Eppstein,2001).The obtained Delaunay TEN holds many possible boundarysolutions. We will use the added ‘Steiner’ vertices at the scanlinesto reconstruct the surface as in the 1.5D example.
The volume of the object is controlled by an added ground pointat a given height value for each target-point.
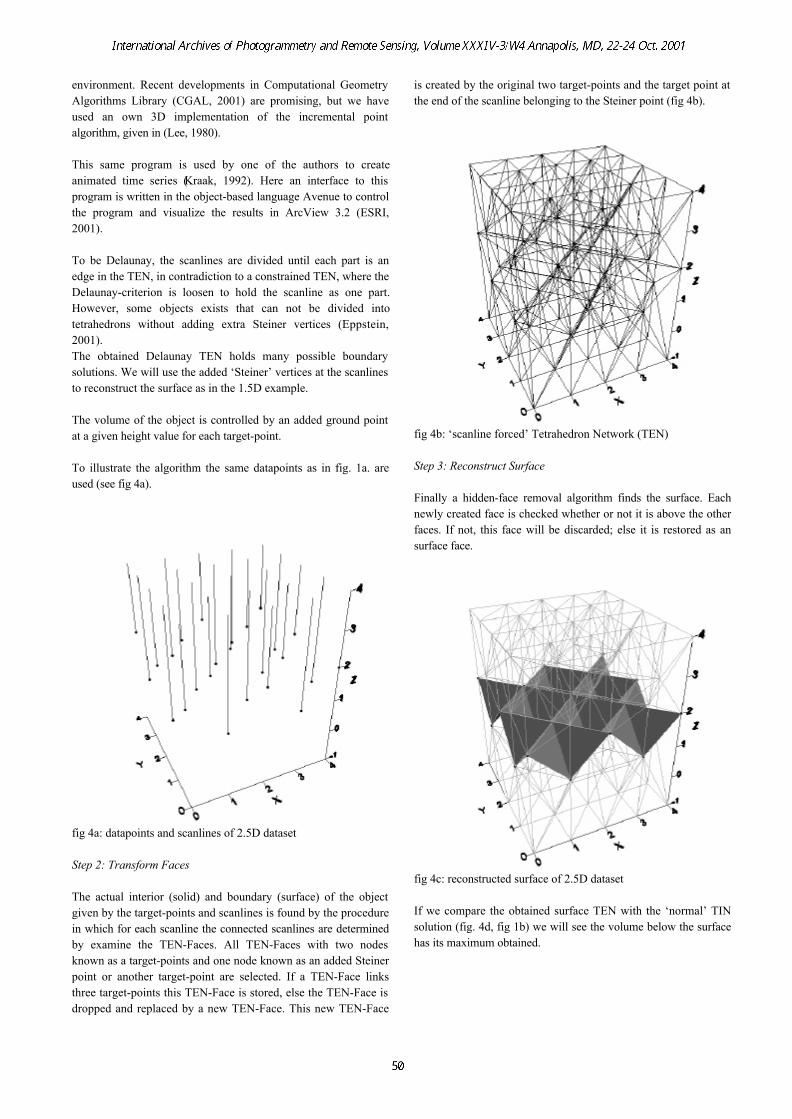
To illustrate the algorithm the same datapoints as in fig. 1a. areused (see fig 4a).
fig 4a: datapoints and scanlines of 2.5D dataset
Step 2: Transform Faces
The actual interior (solid) and boundary (surface) of the objectgiven by the target-points and scanlines is found by the procedurein which for each scanline the connected scanlines are determinedby examine the TEN-Faces. All TEN-Faces with two nodesknown as a target-points and one node known as an added Steinerpoint or another target-point are selected. If a TEN-Face linksthree target-points this TEN-Face is stored, else the TEN-Face isdropped and replaced by a new TEN-Face. This new TEN-Face
is created by the original two target-points and the target point atthe end of the scanline belonging to the Steiner point (fig 4b).
fig 4b: ‘scanline forced’ Tetrahedron Network (TEN)
Step 3: Reconstruct Surface
Finally a hidden-face removal algorithm finds the surface. Eachnewly created face is checked whether or not it is above the otherfaces. If not, this face will be discarded; else it is restored as ansurface face.
fig 4c: reconstructed surface of 2.5D dataset
If we compare the obtained surface TEN with the ‘normal’ TINsolution (fig. 4d, fig 1b) we will see the volume below the surfacehas its maximum obtained.
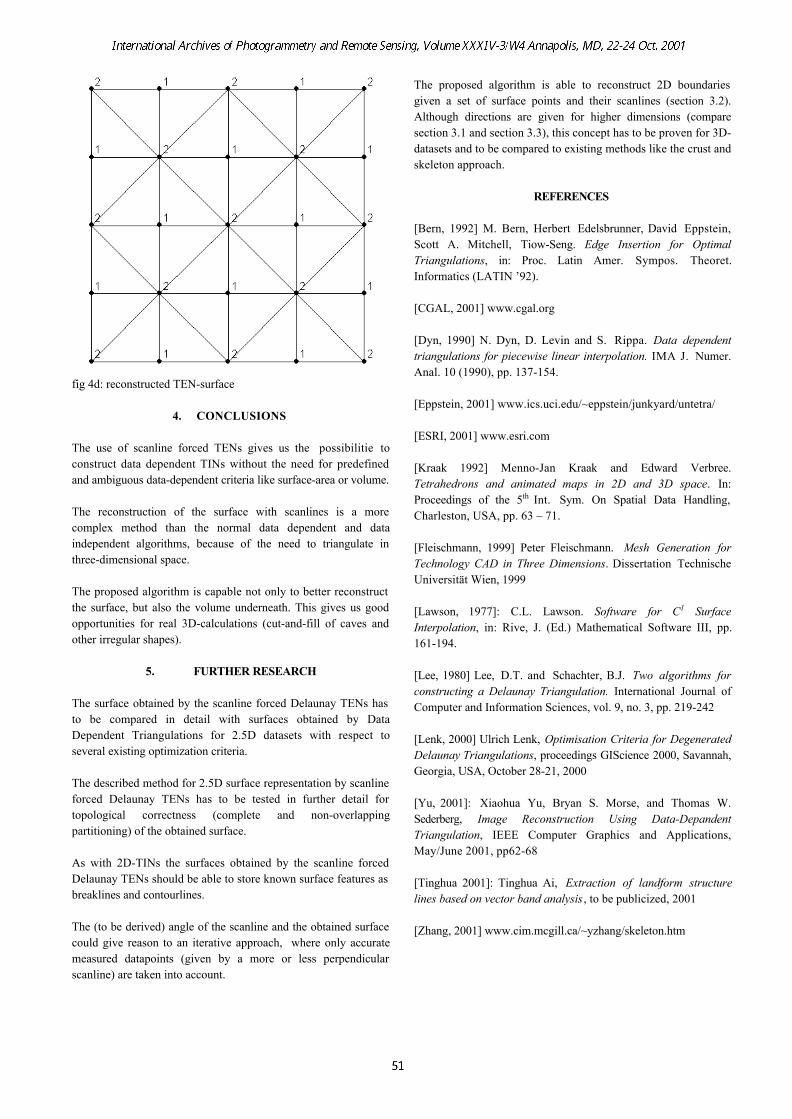
fig 4d: reconstructed TEN-surface
4. CONCLUSIONS
The use of scanline forced TENs gives us the possibilitie toconstruct data dependent TINs without the need for predefinedand ambiguous data-dependent criteria like surface-area or volume.
The reconstruction of the surface with scanlines is a morecomplex method than the normal data dependent and dataindependent algorithms, because of the need to triangulate inthree-dimensional space.
The proposed algorithm is capable not only to better reconstructthe surface, but also the volume underneath. This gives us goodopportunities for real 3D-calculations (cut-and-fill of caves andother irregular shapes).
5. FURTHER RESEARCH
The surface obtained by the scanline forced Delaunay TENs hasto be compared in detail with surfaces obtained by DataDependent Triangulations for 2.5D datasets with respect toseveral existing optimization criteria.
The described method for 2.5D surface representation by scanlineforced Delaunay TENs has to be tested in further detail fortopological correctness (complete and non-overlappingpartitioning) of the obtained surface.
As with 2D-TINs the surfaces obtained by the scanline forcedDelaunay TENs should be able to store known surface features asbreaklines and contourlines.
The (to be derived) angle of the scanline and the obtained surfacecould give reason to an iterative approach, where only accuratemeasured datapoints (given by a more or less perpendicularscanline) are taken into account.
The proposed algorithm is able to reconstruct 2D boundariesgiven a set of surface points and their scanlines (section 3.2).Although directions are given for higher dimensions (comparesection 3.1 and section 3.3), this concept has to be proven for 3D-datasets and to be compared to existing methods like the crust andskeleton approach.
REFERENCES
[Bern, 1992] M. Bern, Herbert Edelsbrunner, David Eppstein,Scott A. Mitchell, Tiow-Seng. Edge Insertion for OptimalTriangulations, in: Proc. Latin Amer. Sympos. Theoret.Informatics (LATIN ’92).
[CGAL, 2001] www.cgal.org
[Dyn, 1990] N. Dyn, D. Levin and S. Rippa. Data dependenttriangulations for piecewise linear interpolation. IMA J. Numer.Anal. 10 (1990), pp. 137-154.
[Eppstein, 2001] www.ics.uci.edu/~eppstein/junkyard/untetra/
[ESRI, 2001] www.esri.com
[Kraak 1992] Menno-Jan Kraak and Edward Verbree.Tetrahedrons and animated maps in 2D and 3D space. In:Proceedings of the 5th Int. Sym. On Spatial Data Handling,Charleston, USA, pp. 63 – 71.
[Fleischmann, 1999] Peter Fleischmann. Mesh Generation forTechnology CAD in Three Dimensions. Dissertation TechnischeUniversität Wien, 1999
[Lawson, 1977]: C.L. Lawson. Software for C1 SurfaceInterpolation, in: Rive, J. (Ed.) Mathematical Software III, pp.161-194.
[Lee, 1980] Lee, D.T. and Schachter, B.J. Two algorithms forconstructing a Delaunay Triangulation. International Journal ofComputer and Information Sciences, vol. 9, no. 3, pp. 219-242
[Lenk, 2000] Ulrich Lenk, Optimisation Criteria for DegeneratedDelaunay Triangulations, proceedings GIScience 2000, Savannah,Georgia, USA, October 28-21, 2000
[Yu, 2001]: Xiaohua Yu, Bryan S. Morse, and Thomas W.Sederberg, Image Reconstruction Using Data-DepandentTriangulation, IEEE Computer Graphics and Applications,May/June 2001, pp62-68
[Tinghua 2001]: Tinghua Ai, Extraction of landform structurelines based on vector band analysis , to be publicized, 2001
[Zhang, 2001] www.cim.mcgill.ca/~yzhang/skeleton.htm


![Using Transactions in Delaunay Mesh Generation2. Delaunay Mesh Generation A Delaunay mesh is a mesh over a set of points which satisfies the Delaunay property [4]. This property,](https://img.pdfslide.us/doc/110x75/5e78132d55760c30656ba589/using-transactions-in-delaunay-mesh-generation-2-delaunay-mesh-generation-a-delaunay.jpg)