Embed Size (px)
Citation preview
| METHODS AND PROCEDURES | 1
Scaling the TIMSS and PIRLS 2011 Achievement Data
Pierre FoyBradley Brossman
Joseph Galia
OverviewThe TIMSS and PIRLS assessments cover a wide range of topics in reading, mathematics, and science and, in the case of TIMSS, at two grade levels. Given this broad coverage in each assessment, a matrix-sampling booklet design (see Chapter 4 of the PIRLS 2011 Assessment Framework and Chapter 4 of TIMSS 2011 Assessment Frameworks) is used such that each student is administered only a subset of the entire PIRLS reading item pool or the TIMSS mathematics and science item pools. Given the complexities of the data collection and the need to have student scores on the entire assessments for analysis and reporting purposes, TIMSS and PIRLS rely on item response theory (IRT) scaling to describe student achievement on the assessments and to provide accurate measures of trends. As each student responded to only a part of the assessment item pool, the TIMSS and PIRLS scaling approach uses multiple imputation — or “plausible values” — methodology to obtain proficiency scores in reading (for PIRLS) and in mathematics and science (for TIMSS) for all students. To enhance the reliability of the student scores, the TIMSS and PIRLS scaling approach uses “conditioning”, a process in which student responses to the items are combined with information about students’ backgrounds.
This scaling section begins with a general description of the scaling approach and its use of plausible values. It then describes the concurrent calibration method used specifically to measure trends. Next, it explains how the proficiency scores are generated through the use of conditioning and describes the process of transforming the proficiency scores to place them on the metrics used to measure trends.
| METHODS AND PROCEDURES2 | SCALINGTHETIMSSANDPIRLS2011ACHIEVEMENTDATA
TheTIMSS andPIRLSScalingMethodologyThe IRT scaling approach used for TIMSS and PIRLS was developed originally by Educational Testing Service (ETS) for use in the U.S. National Assessment of Educational Progress (NAEP). It is based on psychometric models that were first used in the field of educational measurement in the 1950s and are now used extensively in large-scale surveys, test construction, and computer adaptive testing.
The analysis of the TIMSS and PIRLS assessment data utilized three distinct IRT models. All three models are “latent variable” models. Latent variable models describe the probability that a student will respond in a specific way to an item depending on the student’s proficiency, which is an unobserved — or “latent” — trait, and various characteristics — or “parameters” — of the item.
The decision as to which IRT model to use depended upon the item type and the scoring procedure. The TIMSS and PIRLS assessments include both multiple choice and constructed response items. The multiple choice items were scored dichotomously as either correct or incorrect. Depending on the scoring guide, a constructed response item was scored either dichotomously, as correct or incorrect, or polytomously for partial credit. Accordingly, a three-parameter model was used for multiple choice items, and a two-parameter model was used for the constructed response items that were scored dichotomously. A partial credit model was used with the constructed response items that were scored polytomously.
ProficiencyEstimationUsingPlausibleValuesMost cognitive testing assesses the performance of individual students for the purposes of diagnosis, selection, or placement. Regardless of the measurement model used, whether classical test theory or item response theory, the accuracy of these measurements can be improved — that is, the amount of measurement error can be reduced — by increasing the number of items given to the individual. Thus, it is common to see achievement tests designed to provide information on individual students that contain more than 70 items. Since the uncertainty associated with estimates of individual student ability is negligible under these conditions, the distribution of student ability, or its joint distribution with other variables, can be approximated using each individual student’s estimated ability.
METHODS AND PROCEDURES | SCALINGTHETIMSSANDPIRLS2011ACHIEVEMENTDATA | 3
For the estimation of proficiencies in large populations, more efficient estimates can be obtained from a matrix-sampling design such as that used in TIMSS and PIRLS. This design solicits relatively few responses from each sampled student while maintaining a wide range of content representation when responses are aggregated across all students. With this approach, the advantage of estimating population characteristics more efficiently is offset to some degree by the inability to make precise statements about individuals. Indeed, the uncertainty associated with individual student ability estimates becomes too large to be ignored.
Plausible values methodology was developed as a way to address this issue. Instead of first computing estimates of individual student abilities and then aggregating these to estimate population parameters, the plausible values approach with conditioning uses all available data — student responses to the items they were administered together with all background data — to estimate directly the characteristics of student populations and subpopulations. Although these directly estimated population characteristics could be used for reporting purposes, the plausible values approach generates multiple imputed scores (Rubin, 1987), called plausible values, from the estimated ability distributions and uses these in analyses and reporting. By conditioning on all the available background data while generating the plausible values, relationships between these background variables and the estimated proficiencies are appropriately accounted for in the plausible values. Because of this, analyses conducted using plausible values provide an accurate representation of these underlying relationships. A more detailed description of the technical details involved in the scaling can be found in TIMSS and PIRLS 2011 Achievement Scaling Methodology.
Plausible values are not intended to be estimates of individual student scores, but rather are imputed scores for like students — students with similar response patterns and background characteristics in the sampled population — that may be used to estimate population characteristics correctly. When the underlying model is correctly specified, plausible values provide consistent estimates of population characteristics, even though they are generally biased estimates of the proficiencies of the individuals with whom they are associated. Taking the average of the plausible values does not yield suitable estimates of individual student scores.
| METHODS AND PROCEDURES4 | SCALINGTHETIMSSANDPIRLS2011ACHIEVEMENTDATA
ImplementingtheTIMSS andPIRLSScalingProceduresThe application of IRT scaling and plausible values methodology to the data from the TIMSS and PIRLS assessments involves four major tasks: calibrating the achievement items (estimating model parameters for each item), creating principal components from the student questionnaire data for use in conditioning — the Learning to Read Survey data also are included for PIRLS, generating proficiency scores for reading, mathematics, and science, and placing these proficiency scores on the metrics used to report trend results from previous assessments. PIRLS and prePIRLS each have a single scale for overall reading, whereas TIMSS has separate scales for mathematics and science at both fourth and eighth grades. The scaling procedures also generate proficiency scores for the subdomains of the overall subjects: the purposes for reading and the processes of comprehension for PIRLS, and the content and cognitive domains of mathematics and science for TIMSS.
LinkingAssessmentsCycleswithConcurrentCalibrationThe metric of the TIMSS reporting scales for overall mathematics and science at each grade level were originally established in TIMSS 1995 by setting the mean of the national average scores for all countries that participated in TIMSS 1995 to 500 and the standard deviation to 100. Similarly, the metric of the PIRLS reading scale was established in PIRLS 2001. To enable measurement of trends over time, achievement data from successive TIMSS and PIRLS assessments were transformed to these same metrics. This is done by concurrently scaling the data from each successive assessment with the data from the previous assessment—a process known as “concurrent calibration”—and applying linear transformations to place the results from each successive assessment on the same scale as the results from the previous assessment. This procedure enables TIMSS to measure trends across all five assessment cycles (1995, 1999, 2003, 2007, and 2011) and PIRLS to measure trends across its three cycles (2001, 2006, 2011).
The first step in linking the assessments for trend scaling is to estimate (“calibrate”) the item parameters for the items in the current assessment through a concurrent calibration of the data from the current assessment and from the previous assessment. In 2011, the TIMSS concurrent calibration consisted of
METHODS AND PROCEDURES | SCALINGTHETIMSSANDPIRLS2011ACHIEVEMENTDATA | 5
combining achievement data from the 2011 and 2007 assessments, and the PIRLS concurrent calibration process combined the 2011 and 2006 PIRLS achievement data.
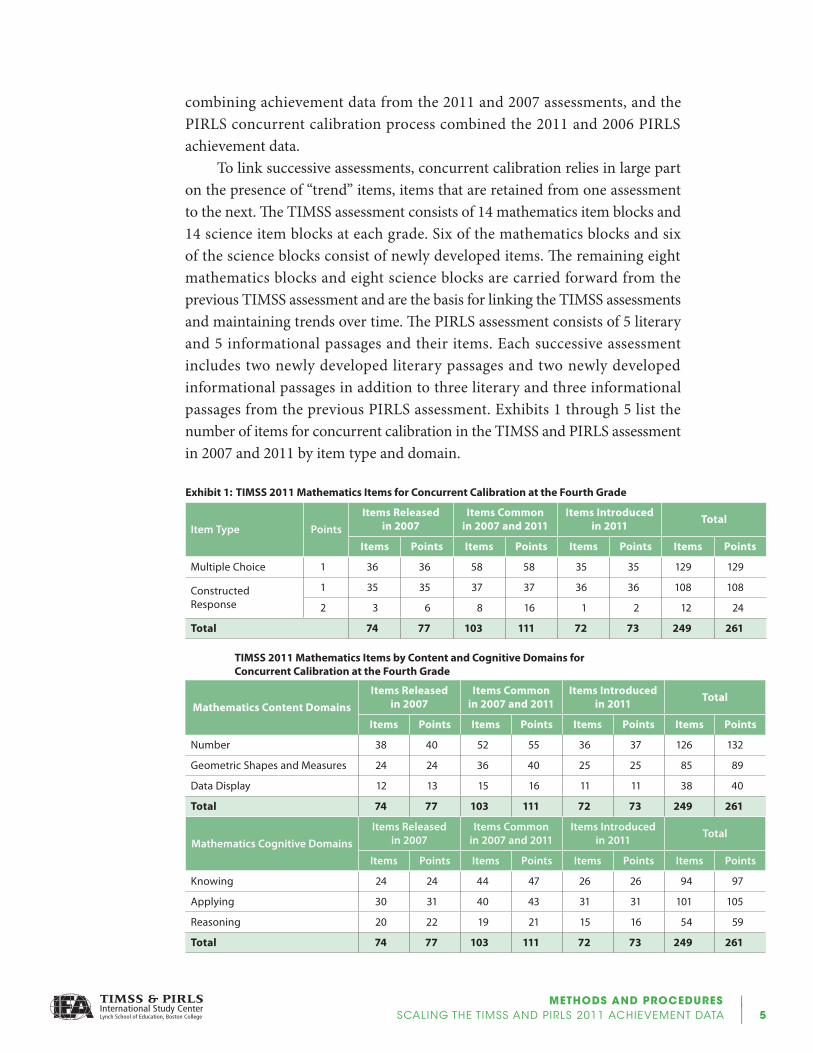
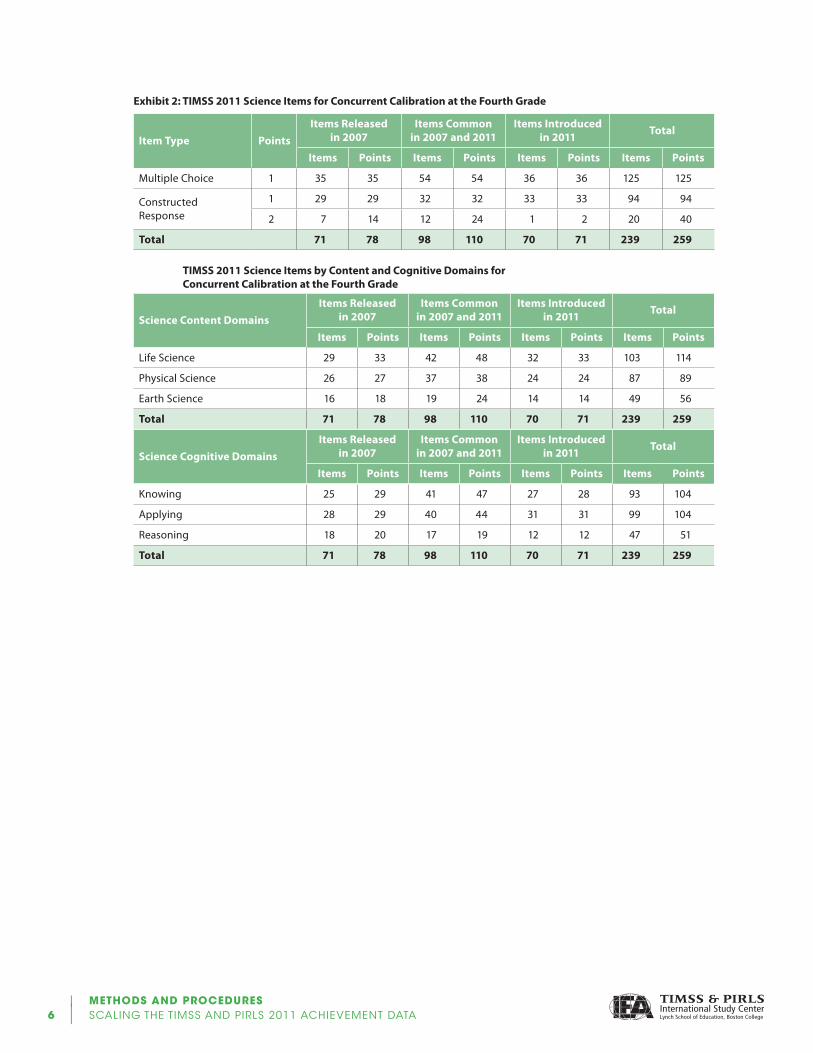
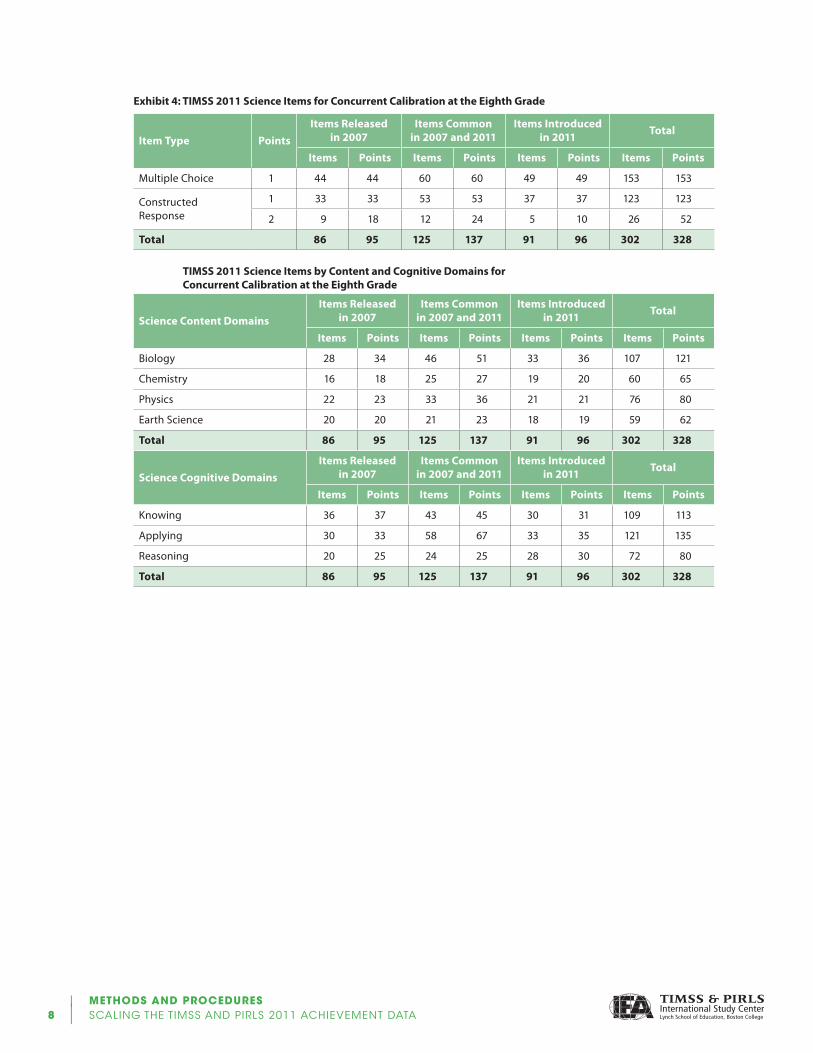
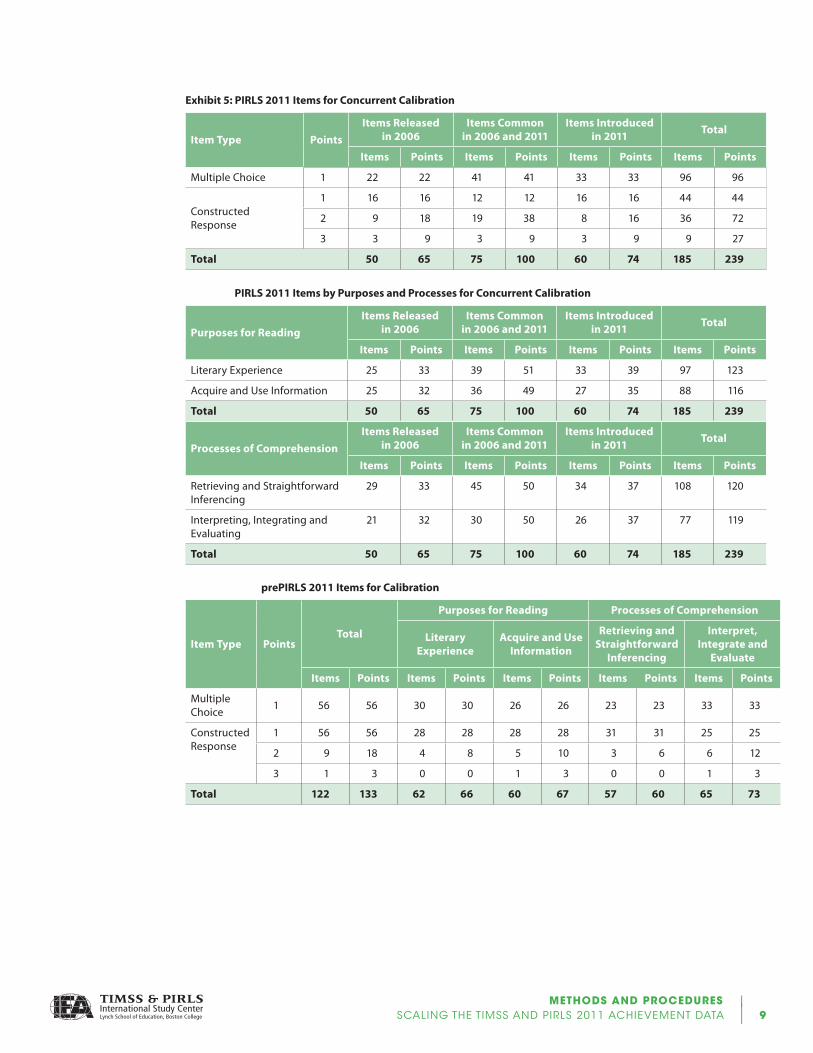
To link successive assessments, concurrent calibration relies in large part on the presence of “trend” items, items that are retained from one assessment to the next. The TIMSS assessment consists of 14 mathematics item blocks and 14 science item blocks at each grade. Six of the mathematics blocks and six of the science blocks consist of newly developed items. The remaining eight mathematics blocks and eight science blocks are carried forward from the previous TIMSS assessment and are the basis for linking the TIMSS assessments and maintaining trends over time. The PIRLS assessment consists of 5 literary and 5 informational passages and their items. Each successive assessment includes two newly developed literary passages and two newly developed informational passages in addition to three literary and three informational passages from the previous PIRLS assessment. Exhibits 1 through 5 list the number of items for concurrent calibration in the TIMSS and PIRLS assessment in 2007 and 2011 by item type and domain.
Exhibit 1: TIMSS 2011 Mathematics Items for Concurrent Calibration at the Fourth Grade
Item Type PointsItems Released
in 2007Items Common
in 2007 and 2011Items Introduced
in 2011 Total
Items Points Items Points Items Points Items Points
Multiple Choice 1 36 36 58 58 35 35 129 129
Constructed Response
1 35 35 37 37 36 36 108 108
2 3 6 8 16 1 2 12 24
Total 74 77 103 111 72 73 249 261
TIMSS 2011 Mathematics Items by Content and Cognitive Domains for Concurrent Calibration at the Fourth Grade
Mathematics Content DomainsItems Released
in 2007Items Common
in 2007 and 2011Items Introduced
in 2011 Total
Items Points Items Points Items Points Items Points
Number 38 40 52 55 36 37 126 132
Geometric Shapes and Measures 24 24 36 40 25 25 85 89
Data Display 12 13 15 16 11 11 38 40
Total 74 77 103 111 72 73 249 261
Mathematics Cognitive DomainsItems Released
in 2007Items Common
in 2007 and 2011Items Introduced
in 2011 Total
Items Points Items Points Items Points Items Points
Knowing 24 24 44 47 26 26 94 97
Applying 30 31 40 43 31 31 101 105
Reasoning 20 22 19 21 15 16 54 59
Total 74 77 103 111 72 73 249 261
| METHODS AND PROCEDURES6 | SCALINGTHETIMSSANDPIRLS2011ACHIEVEMENTDATA
Exhibit 2: TIMSS 2011 Science Items for Concurrent Calibration at the Fourth Grade
Item Type PointsItems Released
in 2007Items Common
in 2007 and 2011Items Introduced
in 2011 Total
Items Points Items Points Items Points Items Points
Multiple Choice 1 35 35 54 54 36 36 125 125
Constructed Response
1 29 29 32 32 33 33 94 94
2 7 14 12 24 1 2 20 40
Total 71 78 98 110 70 71 239 259
TIMSS 2011 Science Items by Content and Cognitive Domains for Concurrent Calibration at the Fourth Grade
Science Content DomainsItems Released
in 2007Items Common
in 2007 and 2011Items Introduced
in 2011 Total
Items Points Items Points Items Points Items Points
Life Science 29 33 42 48 32 33 103 114
Physical Science 26 27 37 38 24 24 87 89
Earth Science 16 18 19 24 14 14 49 56
Total 71 78 98 110 70 71 239 259
Science Cognitive DomainsItems Released
in 2007Items Common
in 2007 and 2011Items Introduced
in 2011 Total
Items Points Items Points Items Points Items Points
Knowing 25 29 41 47 27 28 93 104
Applying 28 29 40 44 31 31 99 104
Reasoning 18 20 17 19 12 12 47 51
Total 71 78 98 110 70 71 239 259

METHODS AND PROCEDURES | SCALINGTHETIMSSANDPIRLS2011ACHIEVEMENTDATA | 7
Exhibit 3: TIMSS 2011 Mathematics Items for Concurrent Calibration at the Eighth Grade
Item Type PointsItems Released
in 2007Items Common
in 2007 and 2011Items Introduced
in 2011 Total
Items Points Items Points Items Points Items Points
Multiple Choice 1 50 50 66 66 52 52 168 168
Constructed Response
1 27 27 45 45 37 37 109 109
2 11 22 13 26 2 4 26 52
Total 88 99 124 137 91 93 303 329
TIMSS 2011 Mathematics Items by Content and Cognitive Domains for Concurrent Calibration at the Eighth Grade
Mathematics Content DomainsItems Released
in 2007Items Common
in 2007 and 2011Items Introduced
in 2011 Total
Items Points Items Points Items Points Items Points
Number 32 37 30 34 31 32 93 103
Algebra 17 18 46 51 23 24 86 93
Geometry 22 23 24 26 18 18 64 67
Data and chance 17 21 24 26 19 19 60 66
Total 88 99 124 137 91 93 303 329
Mathematics Cognitive DomainsItems Released
in 2007Items Common
in 2007 and 2011Items Introduced
in 2011 Total
Items Points Items Points Items Points Items Points
Knowing 28 28 52 54 27 27 107 109
Applying 45 50 42 48 42 43 129 141
Reasoning 15 21 30 35 22 23 67 79
Total 88 99 124 137 91 93 303 329
| METHODS AND PROCEDURES8 | SCALINGTHETIMSSANDPIRLS2011ACHIEVEMENTDATA
Exhibit 4: TIMSS 2011 Science Items for Concurrent Calibration at the Eighth Grade
Item Type PointsItems Released
in 2007Items Common
in 2007 and 2011Items Introduced
in 2011 Total
Items Points Items Points Items Points Items Points
Multiple Choice 1 44 44 60 60 49 49 153 153
Constructed Response
1 33 33 53 53 37 37 123 123
2 9 18 12 24 5 10 26 52
Total 86 95 125 137 91 96 302 328
TIMSS 2011 Science Items by Content and Cognitive Domains for Concurrent Calibration at the Eighth Grade
Science Content DomainsItems Released
in 2007Items Common
in 2007 and 2011Items Introduced
in 2011 Total
Items Points Items Points Items Points Items Points
Biology 28 34 46 51 33 36 107 121
Chemistry 16 18 25 27 19 20 60 65
Physics 22 23 33 36 21 21 76 80
Earth Science 20 20 21 23 18 19 59 62
Total 86 95 125 137 91 96 302 328
Science Cognitive DomainsItems Released
in 2007Items Common
in 2007 and 2011Items Introduced
in 2011 Total
Items Points Items Points Items Points Items Points
Knowing 36 37 43 45 30 31 109 113
Applying 30 33 58 67 33 35 121 135
Reasoning 20 25 24 25 28 30 72 80
Total 86 95 125 137 91 96 302 328
METHODS AND PROCEDURES | SCALINGTHETIMSSANDPIRLS2011ACHIEVEMENTDATA | 9
Exhibit 5: PIRLS 2011 Items for Concurrent Calibration
Item Type PointsItems Released
in 2006Items Common
in 2006 and 2011Items Introduced
in 2011 Total
Items Points Items Points Items Points Items Points
Multiple Choice 1 22 22 41 41 33 33 96 96
Constructed Response
1 16 16 12 12 16 16 44 44
2 9 18 19 38 8 16 36 72
3 3 9 3 9 3 9 9 27
Total 50 65 75 100 60 74 185 239
PIRLS 2011 Items by Purposes and Processes for Concurrent Calibration
Purposes for ReadingItems Released
in 2006Items Common
in 2006 and 2011Items Introduced
in 2011 Total
Items Points Items Points Items Points Items Points
Literary Experience 25 33 39 51 33 39 97 123
Acquire and Use Information 25 32 36 49 27 35 88 116
Total 50 65 75 100 60 74 185 239
Processes of ComprehensionItems Released
in 2006Items Common
in 2006 and 2011Items Introduced
in 2011 Total
Items Points Items Points Items Points Items Points
Retrieving and Straightforward Inferencing
29 33 45 50 34 37 108 120
Interpreting, Integrating and Evaluating
21 32 30 50 26 37 77 119
Total 50 65 75 100 60 74 185 239
prePIRLS 2011 Items for Calibration
Item Type PointsTotal
Purposes for Reading Processes of Comprehension
Literary Experience
Acquire and Use Information
Retrieving and Straightforward
Inferencing
Interpret, Integrate and
Evaluate
Items Points Items Points Items Points Items Points Items Points
Multiple Choice 1 56 56 30 30 26 26 23 23 33 33
Constructed Response
1 56 56 28 28 28 28 31 31 25 25
2 9 18 4 8 5 10 3 6 6 12
3 1 3 0 0 1 3 0 0 1 3
Total 122 133 62 66 60 67 57 60 65 73
| METHODS AND PROCEDURES10 | SCALINGTHETIMSSANDPIRLS2011ACHIEVEMENTDATA
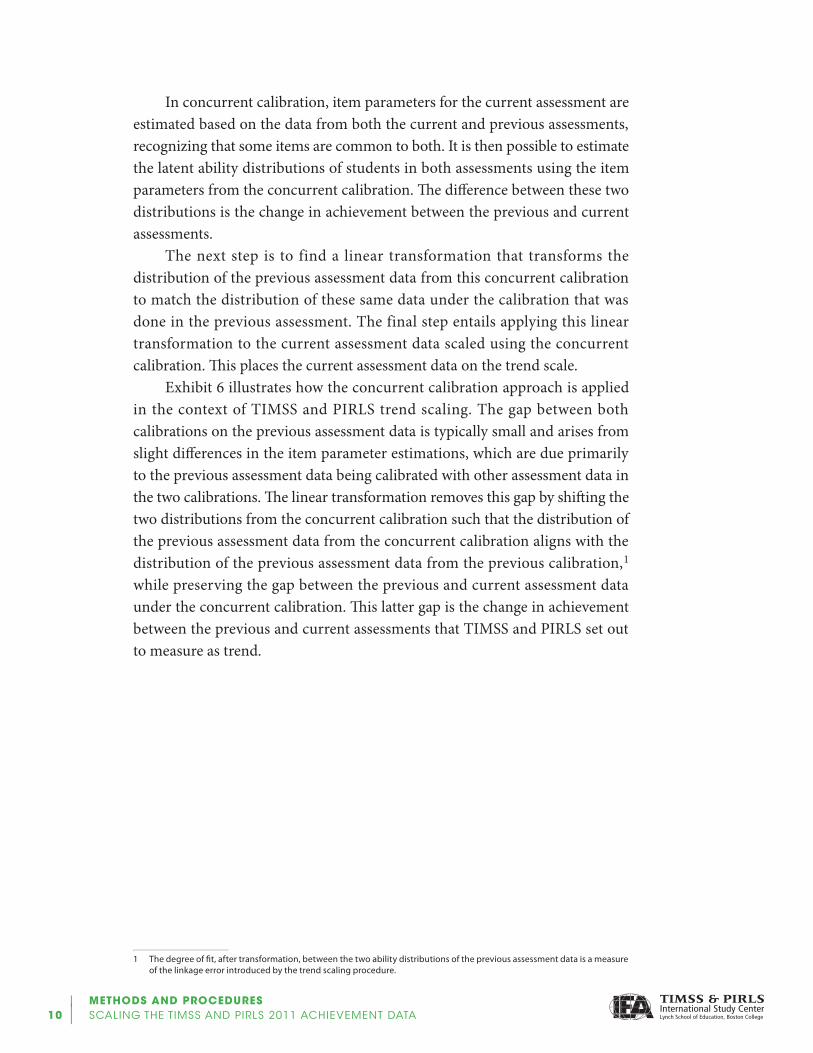
In concurrent calibration, item parameters for the current assessment are estimated based on the data from both the current and previous assessments, recognizing that some items are common to both. It is then possible to estimate the latent ability distributions of students in both assessments using the item parameters from the concurrent calibration. The difference between these two distributions is the change in achievement between the previous and current assessments.
The next step is to find a linear transformation that transforms the distribution of the previous assessment data from this concurrent calibration to match the distribution of these same data under the calibration that was done in the previous assessment. The final step entails applying this linear transformation to the current assessment data scaled using the concurrent calibration. This places the current assessment data on the trend scale.
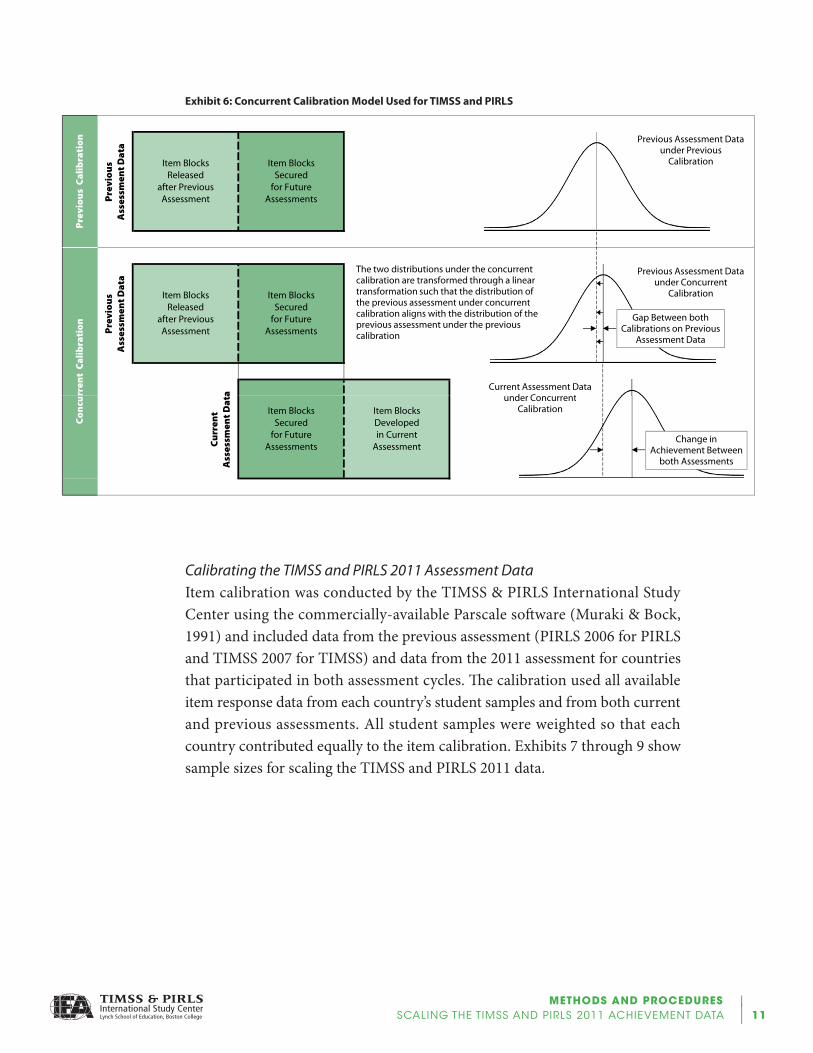
Exhibit 6 illustrates how the concurrent calibration approach is applied in the context of TIMSS and PIRLS trend scaling. The gap between both calibrations on the previous assessment data is typically small and arises from slight differences in the item parameter estimations, which are due primarily to the previous assessment data being calibrated with other assessment data in the two calibrations. The linear transformation removes this gap by shifting the two distributions from the concurrent calibration such that the distribution of the previous assessment data from the concurrent calibration aligns with the distribution of the previous assessment data from the previous calibration,1 while preserving the gap between the previous and current assessment data under the concurrent calibration. This latter gap is the change in achievement between the previous and current assessments that TIMSS and PIRLS set out to measure as trend.
1 The degree of fit, after transformation, between the two ability distributions of the previous assessment data is a measure of the linkage error introduced by the trend scaling procedure.
METHODS AND PROCEDURES | SCALINGTHETIMSSANDPIRLS2011ACHIEVEMENTDATA | 11
Exhibit 6: Concurrent Calibration Model Used for TIMSS and PIRLSP
revi
ou
sA
sses
smen
t Dat
aP
revi
ou
sA
sses
smen
t Dat
a
a
Item BlocksReleased
after PreviousAssessment
Item BlocksSecured
for FutureAssessments
Item BlocksReleased
after PreviousAssessment
Item BlocksSecured
for FutureAssessments
Pre
vio
us
Cal
ibra
tio
nrr
ent
Cal
ibra
tio
n
The two distributions under the concurrent calibration are transformed through a linear transformation such that the distribution of the previous assessment under concurrent calibration aligns with the distribution of the previous assessment under the previous calibration
Previous Assessment Data under Previous
Calibration
Previous Assessment Dataunder Concurrent
Calibration
Current Assessment Datad C t
Gap Between both Calibrations on Previous
Assessment Data
Cu
rren
tA
sses
smen
t Dat
a
Item BlocksSecured
for FutureAssessments
Item BlocksDevelopedin Current
Assessment
Co
ncu under Concurrent
Calibration
Change inAchievement Between
both Assessments
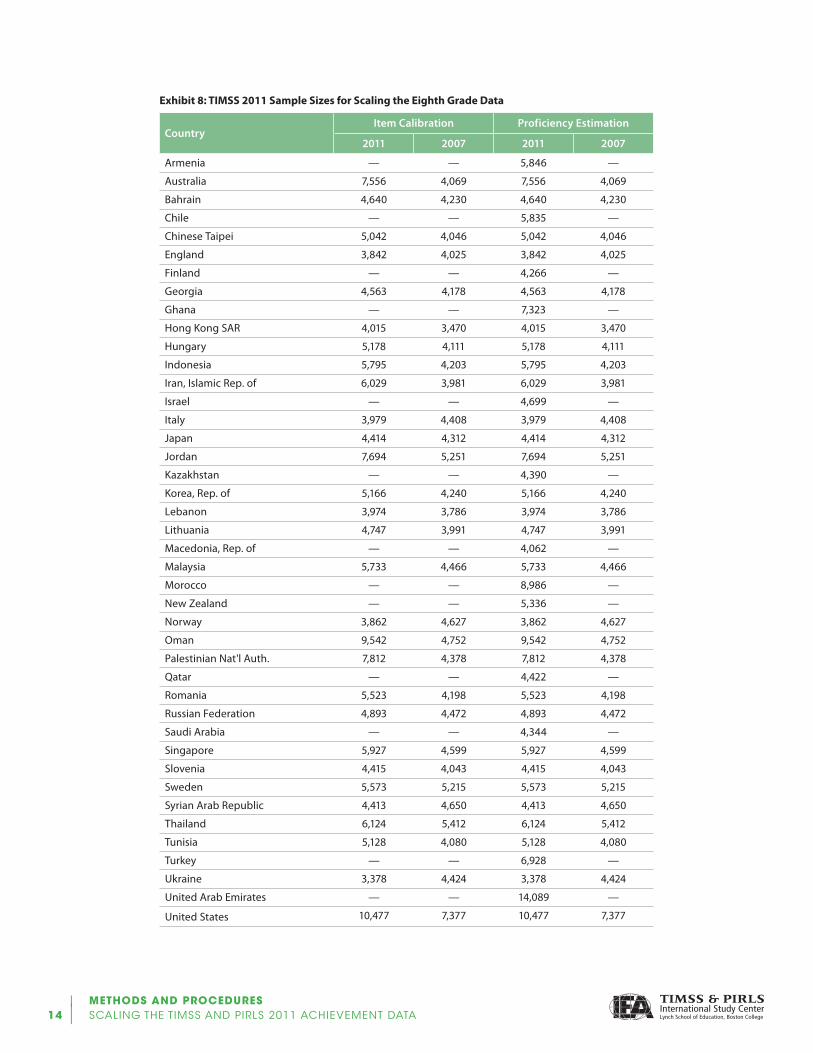
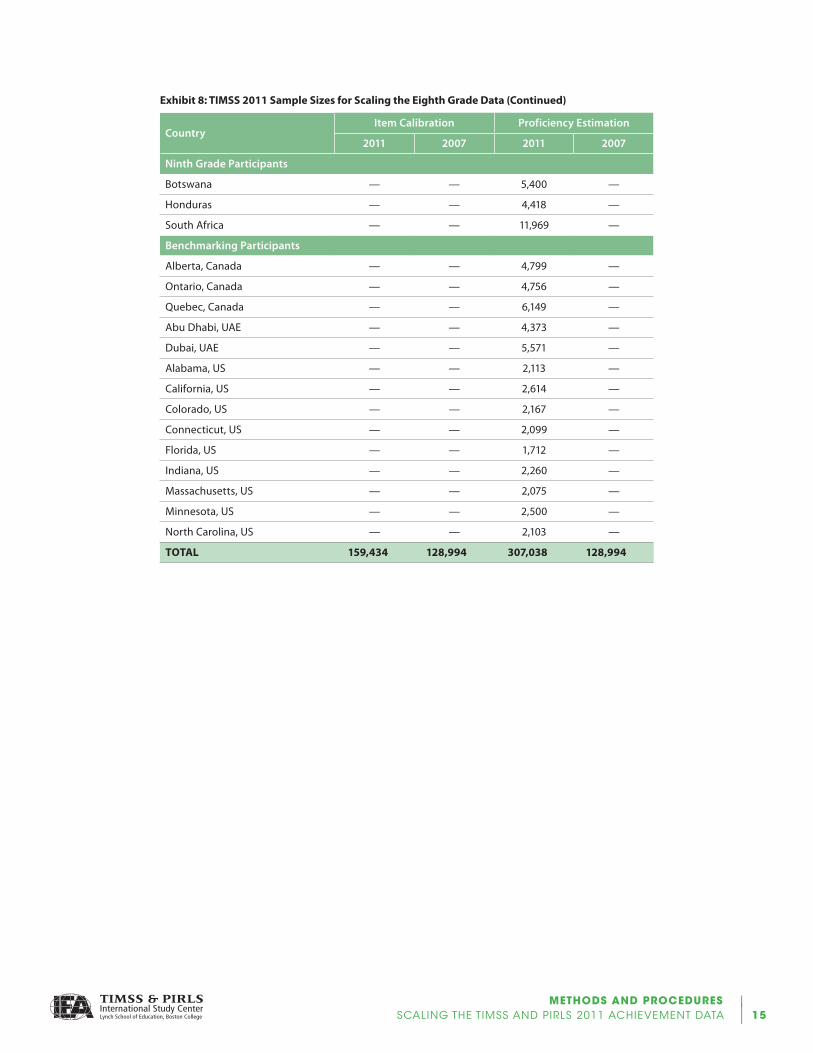
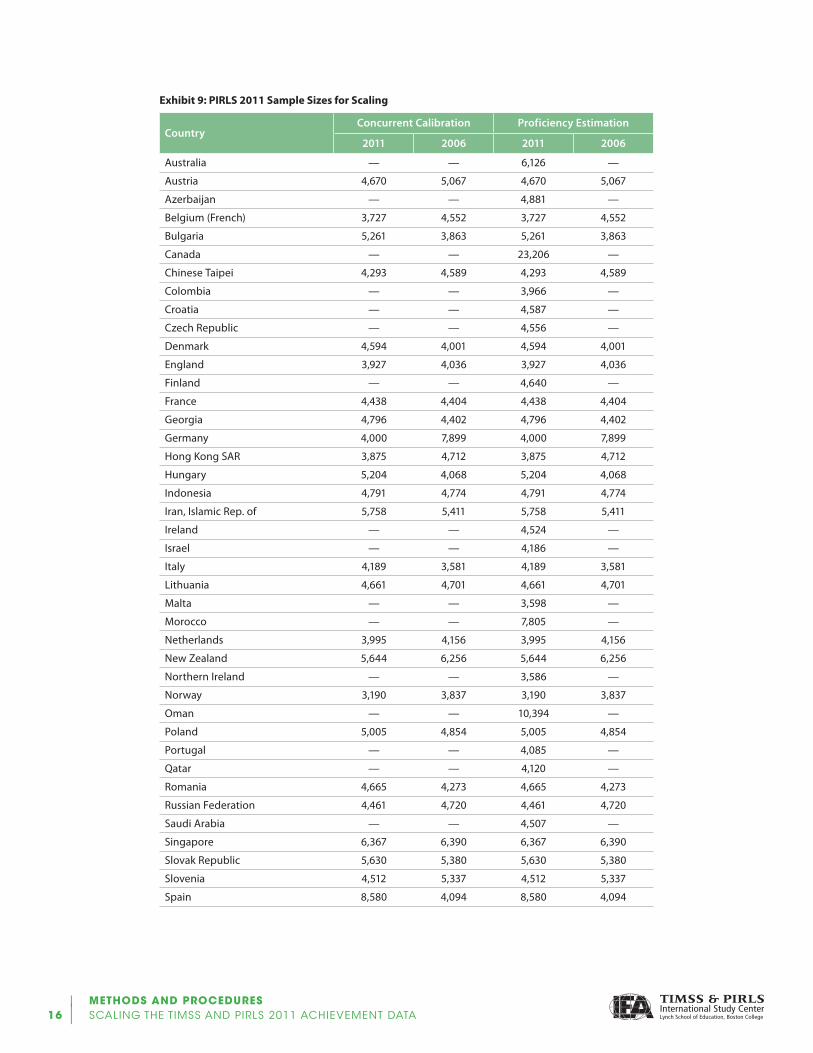
Calibrating the TIMSS and PIRLS 2011 Assessment DataItem calibration was conducted by the TIMSS & PIRLS International Study Center using the commercially-available Parscale software (Muraki & Bock, 1991) and included data from the previous assessment (PIRLS 2006 for PIRLS and TIMSS 2007 for TIMSS) and data from the 2011 assessment for countries that participated in both assessment cycles. The calibration used all available item response data from each country’s student samples and from both current and previous assessments. All student samples were weighted so that each country contributed equally to the item calibration. Exhibits 7 through 9 show sample sizes for scaling the TIMSS and PIRLS 2011 data.

| METHODS AND PROCEDURES12 | SCALINGTHETIMSSANDPIRLS2011ACHIEVEMENTDATA
Exhibit 7: TIMSS 2011 Sample Sizes for Scaling the Fourth Grade Data
CountryConcurrent Calibration Proficiency Estimation
2011 2007 2011 2007
Armenia — — 5,146 —
Australia 6,146 4,108 6,146 4,108
Austria 4,668 4,859 4,668 4,859
Azerbaijan — — 4,882 —
Bahrain — — 4,083 —
Belgium (Flemish) — — 4,849 —
Chile — — 5,585 —
Chinese Taipei 4,284 4,131 4,284 4,131
Croatia — — 4,584 —
Czech Republic 4,578 4,235 4,578 4,235
Denmark 3,987 3,519 3,987 3,519
England 3,397 4,316 3,397 4,316
Finland — — 4,638 —
Georgia 4,799 4,108 4,799 4,108
Germany 3,995 5,200 3,995 5,200
Hong Kong SAR 3,957 3,791 3,957 3,791
Hungary 5,204 4,048 5,204 4,048
Iran, Islamic Rep. of 5,760 3,833 5,760 3,833
Ireland — — 4,560 —
Italy 4,200 4,470 4,200 4,470
Japan 4,411 4,487 4,411 4,487
Kazakhstan — — 4,382 —
Korea, Rep. of — — 4,334 —
Kuwait — — 4,142 —
Lithuania 4,688 3,980 4,688 3,980
Malta — — 3,607 —
Morocco — — 7,841 —
Netherlands 3,229 3,349 3,229 3,349
New Zealand 5,572 4,940 5,572 4,940
Northern Ireland — — 3,571 —
Norway 3,121 4,108 3,121 4,108
Oman — — 10,411 —
Poland — — 5,027 —
Portugal — — 4,042 —
Qatar — — 4,117 —
Romania — — 4,673 —
Russian Federation 4,467 4,464 4,467 4,464
Saudi Arabia — — 4,515 —
Serbia — — 4,379 —
Singapore 6,368 5,041 6,368 5,041
Slovak Republic 5,616 4,963 5,616 4,963
METHODS AND PROCEDURES | SCALINGTHETIMSSANDPIRLS2011ACHIEVEMENTDATA | 13
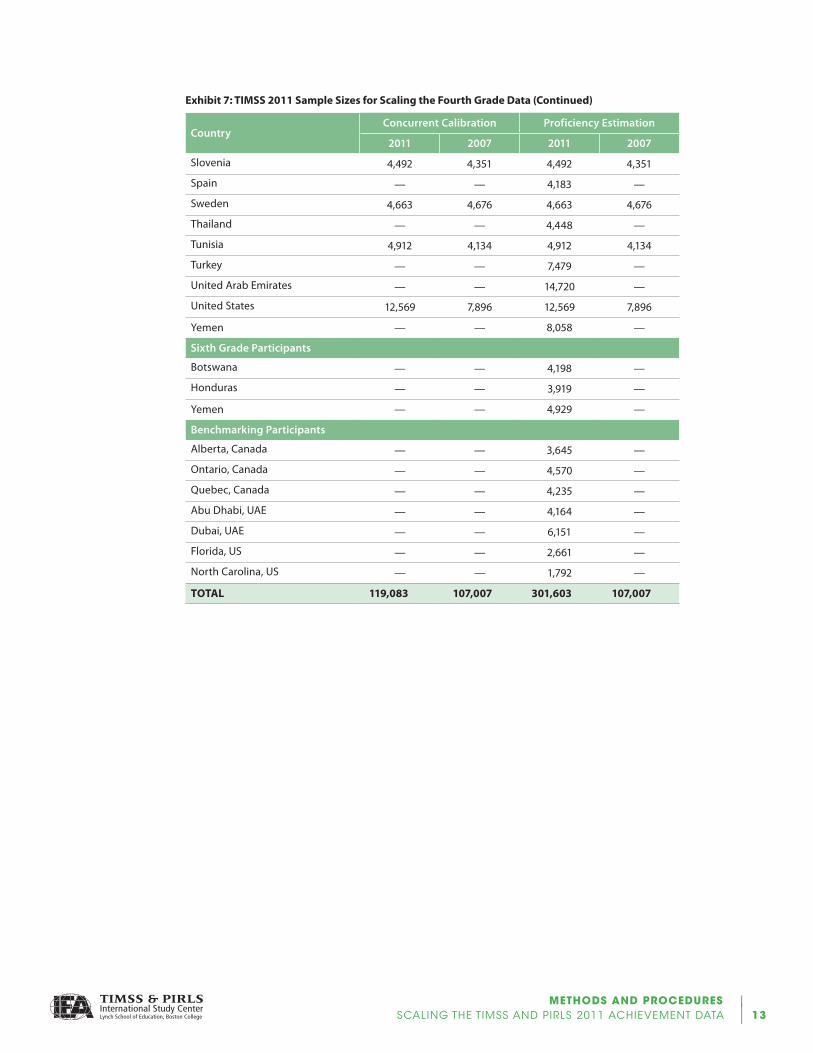
Exhibit 7: TIMSS 2011 Sample Sizes for Scaling the Fourth Grade Data (Continued)
CountryConcurrent Calibration Proficiency Estimation
2011 2007 2011 2007
Slovenia 4,492 4,351 4,492 4,351
Spain — — 4,183 —
Sweden 4,663 4,676 4,663 4,676
Thailand — — 4,448 —
Tunisia 4,912 4,134 4,912 4,134
Turkey — — 7,479 —
United Arab Emirates — — 14,720 —
United States 12,569 7,896 12,569 7,896
Yemen — — 8,058 —
Sixth Grade Participants
Botswana — — 4,198 —
Honduras — — 3,919 —
Yemen — — 4,929 —
Benchmarking Participants
Alberta, Canada — — 3,645 —
Ontario, Canada — — 4,570 —
Quebec, Canada — — 4,235 —
Abu Dhabi, UAE — — 4,164 —
Dubai, UAE — — 6,151 —
Florida, US — — 2,661 —
North Carolina, US — — 1,792 —
TOTAL 119,083 107,007 301,603 107,007
| METHODS AND PROCEDURES14 | SCALINGTHETIMSSANDPIRLS2011ACHIEVEMENTDATA
Exhibit 8: TIMSS 2011 Sample Sizes for Scaling the Eighth Grade Data
CountryItem Calibration Proficiency Estimation
2011 2007 2011 2007
Armenia — — 5,846 —
Australia 7,556 4,069 7,556 4,069
Bahrain 4,640 4,230 4,640 4,230
Chile — — 5,835 —
Chinese Taipei 5,042 4,046 5,042 4,046
England 3,842 4,025 3,842 4,025
Finland — — 4,266 —
Georgia 4,563 4,178 4,563 4,178
Ghana — — 7,323 —
Hong Kong SAR 4,015 3,470 4,015 3,470
Hungary 5,178 4,111 5,178 4,111
Indonesia 5,795 4,203 5,795 4,203
Iran, Islamic Rep. of 6,029 3,981 6,029 3,981
Israel — — 4,699 —
Italy 3,979 4,408 3,979 4,408
Japan 4,414 4,312 4,414 4,312
Jordan 7,694 5,251 7,694 5,251
Kazakhstan — — 4,390 —
Korea, Rep. of 5,166 4,240 5,166 4,240
Lebanon 3,974 3,786 3,974 3,786
Lithuania 4,747 3,991 4,747 3,991
Macedonia, Rep. of — — 4,062 —
Malaysia 5,733 4,466 5,733 4,466
Morocco — — 8,986 —
New Zealand — — 5,336 —
Norway 3,862 4,627 3,862 4,627
Oman 9,542 4,752 9,542 4,752
Palestinian Nat'l Auth. 7,812 4,378 7,812 4,378
Qatar — — 4,422 —
Romania 5,523 4,198 5,523 4,198
Russian Federation 4,893 4,472 4,893 4,472
Saudi Arabia — — 4,344 —
Singapore 5,927 4,599 5,927 4,599
Slovenia 4,415 4,043 4,415 4,043
Sweden 5,573 5,215 5,573 5,215
Syrian Arab Republic 4,413 4,650 4,413 4,650
Thailand 6,124 5,412 6,124 5,412
Tunisia 5,128 4,080 5,128 4,080
Turkey — — 6,928 —
Ukraine 3,378 4,424 3,378 4,424
United Arab Emirates — — 14,089 —
United States 10,477 7,377 10,477 7,377
METHODS AND PROCEDURES | SCALINGTHETIMSSANDPIRLS2011ACHIEVEMENTDATA | 15
Exhibit 8: TIMSS 2011 Sample Sizes for Scaling the Eighth Grade Data (Continued)
CountryItem Calibration Proficiency Estimation
2011 2007 2011 2007
Ninth Grade Participants
Botswana — — 5,400 —
Honduras — — 4,418 —
South Africa — — 11,969 —
Benchmarking Participants
Alberta, Canada — — 4,799 —
Ontario, Canada — — 4,756 —
Quebec, Canada — — 6,149 —
Abu Dhabi, UAE — — 4,373 —
Dubai, UAE — — 5,571 —
Alabama, US — — 2,113 —
California, US — — 2,614 —
Colorado, US — — 2,167 —
Connecticut, US — — 2,099 —
Florida, US — — 1,712 —
Indiana, US — — 2,260 —
Massachusetts, US — — 2,075 —
Minnesota, US — — 2,500 —
North Carolina, US — — 2,103 —
TOTAL 159,434 128,994 307,038 128,994
| METHODS AND PROCEDURES16 | SCALINGTHETIMSSANDPIRLS2011ACHIEVEMENTDATA
Exhibit 9: PIRLS 2011 Sample Sizes for Scaling
CountryConcurrent Calibration Proficiency Estimation
2011 2006 2011 2006
Australia — — 6,126 —
Austria 4,670 5,067 4,670 5,067
Azerbaijan — — 4,881 —
Belgium (French) 3,727 4,552 3,727 4,552
Bulgaria 5,261 3,863 5,261 3,863
Canada — — 23,206 —
Chinese Taipei 4,293 4,589 4,293 4,589
Colombia — — 3,966 —
Croatia — — 4,587 —
Czech Republic — — 4,556 —
Denmark 4,594 4,001 4,594 4,001
England 3,927 4,036 3,927 4,036
Finland — — 4,640 —
France 4,438 4,404 4,438 4,404
Georgia 4,796 4,402 4,796 4,402
Germany 4,000 7,899 4,000 7,899
Hong Kong SAR 3,875 4,712 3,875 4,712
Hungary 5,204 4,068 5,204 4,068
Indonesia 4,791 4,774 4,791 4,774
Iran, Islamic Rep. of 5,758 5,411 5,758 5,411
Ireland — — 4,524 —
Israel — — 4,186 —
Italy 4,189 3,581 4,189 3,581
Lithuania 4,661 4,701 4,661 4,701
Malta — — 3,598 —
Morocco — — 7,805 —
Netherlands 3,995 4,156 3,995 4,156
New Zealand 5,644 6,256 5,644 6,256
Northern Ireland — — 3,586 —
Norway 3,190 3,837 3,190 3,837
Oman — — 10,394 —
Poland 5,005 4,854 5,005 4,854
Portugal — — 4,085 —
Qatar — — 4,120 —
Romania 4,665 4,273 4,665 4,273
Russian Federation 4,461 4,720 4,461 4,720
Saudi Arabia — — 4,507 —
Singapore 6,367 6,390 6,367 6,390
Slovak Republic 5,630 5,380 5,630 5,380
Slovenia 4,512 5,337 4,512 5,337
Spain 8,580 4,094 8,580 4,094
METHODS AND PROCEDURES | SCALINGTHETIMSSANDPIRLS2011ACHIEVEMENTDATA | 17
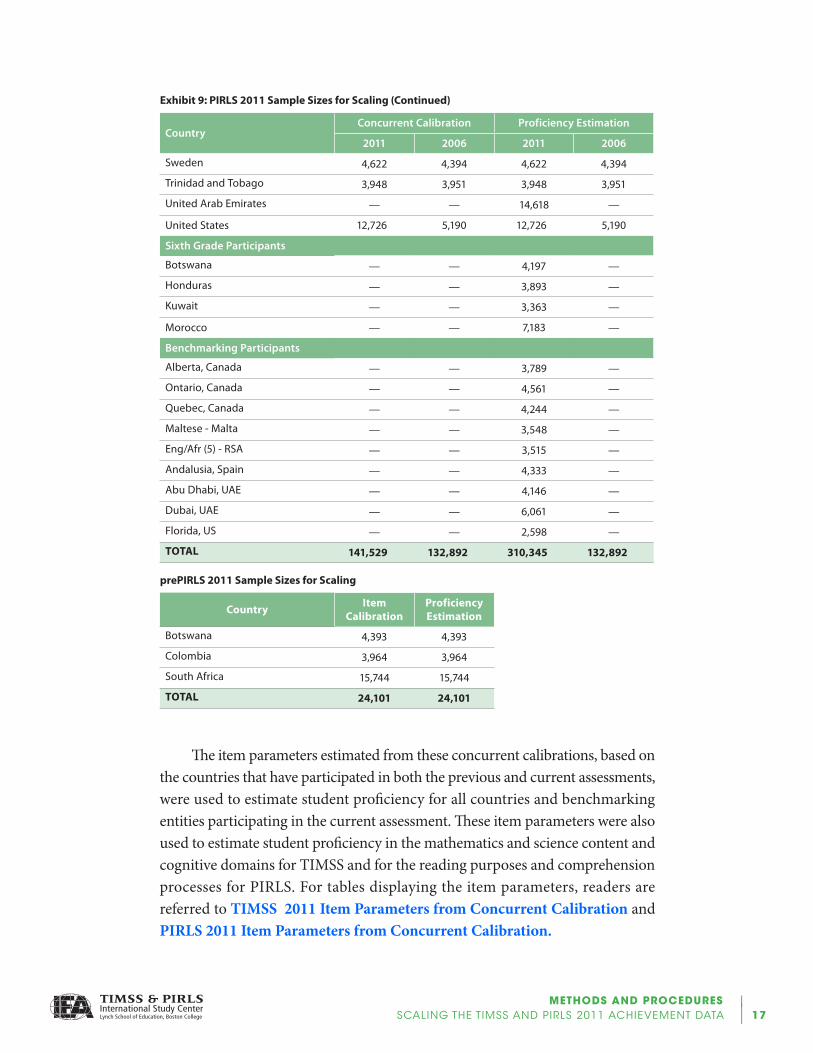
Exhibit 9: PIRLS 2011 Sample Sizes for Scaling (Continued)
CountryConcurrent Calibration Proficiency Estimation
2011 2006 2011 2006
Sweden 4,622 4,394 4,622 4,394
Trinidad and Tobago 3,948 3,951 3,948 3,951
United Arab Emirates — — 14,618 —
United States 12,726 5,190 12,726 5,190
Sixth Grade Participants
Botswana — — 4,197 —
Honduras — — 3,893 —
Kuwait — — 3,363 —
Morocco — — 7,183 —
Benchmarking Participants
Alberta, Canada — — 3,789 —
Ontario, Canada — — 4,561 —
Quebec, Canada — — 4,244 —
Maltese - Malta — — 3,548 —
Eng/Afr (5) - RSA — — 3,515 —
Andalusia, Spain — — 4,333 —
Abu Dhabi, UAE — — 4,146 —
Dubai, UAE — — 6,061 —
Florida, US — — 2,598 —
TOTAL 141,529 132,892 310,345 132,892
prePIRLS 2011 Sample Sizes for Scaling
Country Item Calibration
Proficiency Estimation
Botswana 4,393 4,393
Colombia 3,964 3,964
South Africa 15,744 15,744
TOTAL 24,101 24,101
The item parameters estimated from these concurrent calibrations, based on the countries that have participated in both the previous and current assessments, were used to estimate student proficiency for all countries and benchmarking entities participating in the current assessment. These item parameters were also used to estimate student proficiency in the mathematics and science content and cognitive domains for TIMSS and for the reading purposes and comprehension processes for PIRLS. For tables displaying the item parameters, readers are referred to TIMSS 2011 Item Parameters from Concurrent Calibration and PIRLS 2011 Item Parameters from Concurrent Calibration.
| METHODS AND PROCEDURES18 | SCALINGTHETIMSSANDPIRLS2011ACHIEVEMENTDATA
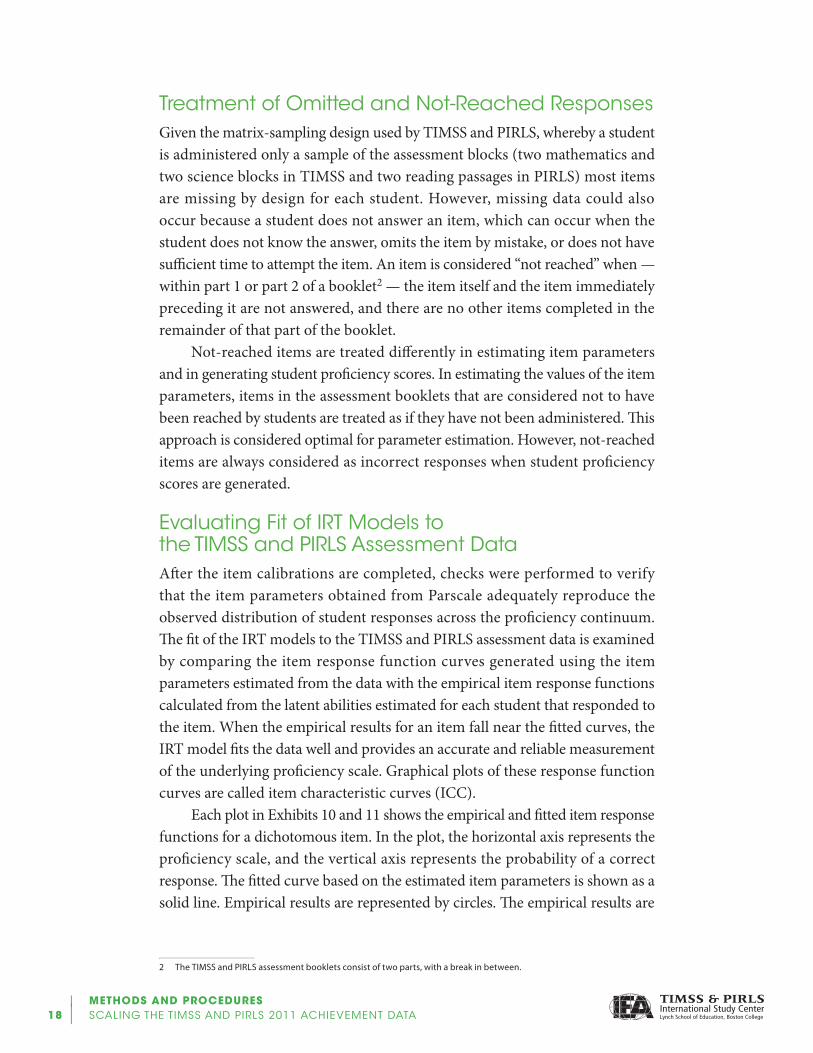
TreatmentofOmittedandNot-ReachedResponsesGiven the matrix-sampling design used by TIMSS and PIRLS, whereby a student is administered only a sample of the assessment blocks (two mathematics and two science blocks in TIMSS and two reading passages in PIRLS) most items are missing by design for each student. However, missing data could also occur because a student does not answer an item, which can occur when the student does not know the answer, omits the item by mistake, or does not have sufficient time to attempt the item. An item is considered “not reached” when — within part 1 or part 2 of a booklet2 — the item itself and the item immediately preceding it are not answered, and there are no other items completed in the remainder of that part of the booklet.
Not-reached items are treated differently in estimating item parameters and in generating student proficiency scores. In estimating the values of the item parameters, items in the assessment booklets that are considered not to have been reached by students are treated as if they have not been administered. This approach is considered optimal for parameter estimation. However, not-reached items are always considered as incorrect responses when student proficiency scores are generated.
EvaluatingFitofIRTModelstotheTIMSS andPIRLSAssessmentDataAfter the item calibrations are completed, checks were performed to verify that the item parameters obtained from Parscale adequately reproduce the observed distribution of student responses across the proficiency continuum. The fit of the IRT models to the TIMSS and PIRLS assessment data is examined by comparing the item response function curves generated using the item parameters estimated from the data with the empirical item response functions calculated from the latent abilities estimated for each student that responded to the item. When the empirical results for an item fall near the fitted curves, the IRT model fits the data well and provides an accurate and reliable measurement of the underlying proficiency scale. Graphical plots of these response function curves are called item characteristic curves (ICC).
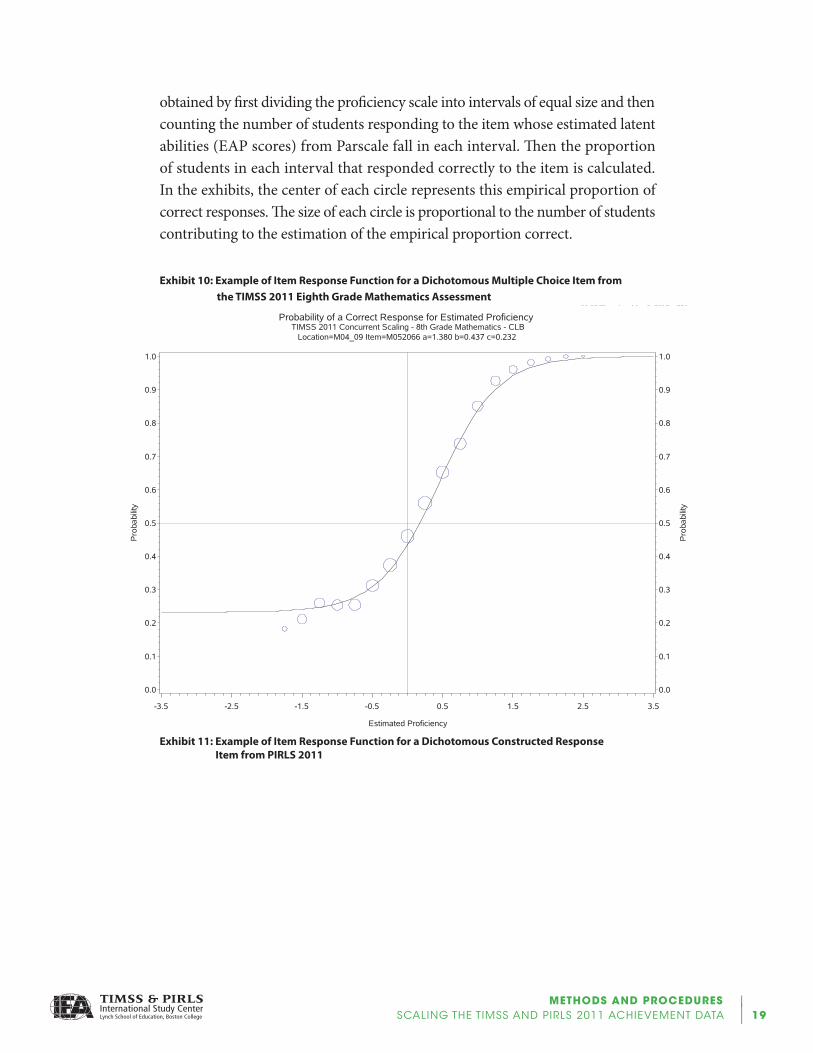
Each plot in Exhibits 10 and 11 shows the empirical and fitted item response functions for a dichotomous item. In the plot, the horizontal axis represents the proficiency scale, and the vertical axis represents the probability of a correct response. The fitted curve based on the estimated item parameters is shown as a solid line. Empirical results are represented by circles. The empirical results are
2 The TIMSS and PIRLS assessment booklets consist of two parts, with a break in between.
METHODS AND PROCEDURES | SCALINGTHETIMSSANDPIRLS2011ACHIEVEMENTDATA | 19
obtained by first dividing the proficiency scale into intervals of equal size and then counting the number of students responding to the item whose estimated latent abilities (EAP scores) from Parscale fall in each interval. Then the proportion of students in each interval that responded correctly to the item is calculated. In the exhibits, the center of each circle represents this empirical proportion of correct responses. The size of each circle is proportional to the number of students contributing to the estimation of the empirical proportion correct.
Exhibit 10: Example of Item Response Function for a Dichotomous Multiple Choice Item from the TIMSS 2011 Eighth Grade Mathematics Assessment
01:03 Thursday, May 3, 2012 23601:03 Thursday, May 3, 2012 236
Prob
abilit
y
0.0
0.1
0.2
0.3
0.4
0.5
0.6
0.7
0.8
0.9
1.0
Estimated Proficiency
-3.5 -2.5 -1.5 -0.5 0.5 1.5 2.5 3.5
Prob
abilit
y0.0
0.1
0.2
0.3
0.4
0.5
0.6
0.7
0.8
0.9
1.0
Probability of a Correct Response for Estimated ProficiencyTIMSS 2011 Concurrent Scaling - 8th Grade Mathematics - CLB
Location=M04_09 Item=M052066 a=1.380 b=0.437 c=0.232
Exhibit 11: Example of Item Response Function for a Dichotomous Constructed Response Item from PIRLS 2011

| METHODS AND PROCEDURES20 | SCALINGTHETIMSSANDPIRLS2011ACHIEVEMENTDATA
18:41 Friday, June 8, 2012 14118:41 Friday, June 8, 2012 141
Prob
abilit
y
0.0
0.1
0.2
0.3
0.4
0.5
0.6
0.7
0.8
0.9
1.0
Estimated Proficiency
-3.5 -2.5 -1.5 -0.5 0.5 1.5 2.5 3.5
Prob
abilit
y
0.0
0.1
0.2
0.3
0.4
0.5
0.6
0.7
0.8
0.9
1.0
Probability of a Correct Response for Estimated ProficiencyPIRLS 2011 Concurrent Scaling - Reading - CLB
Item=R31M16C a=1.085 b=-0.031
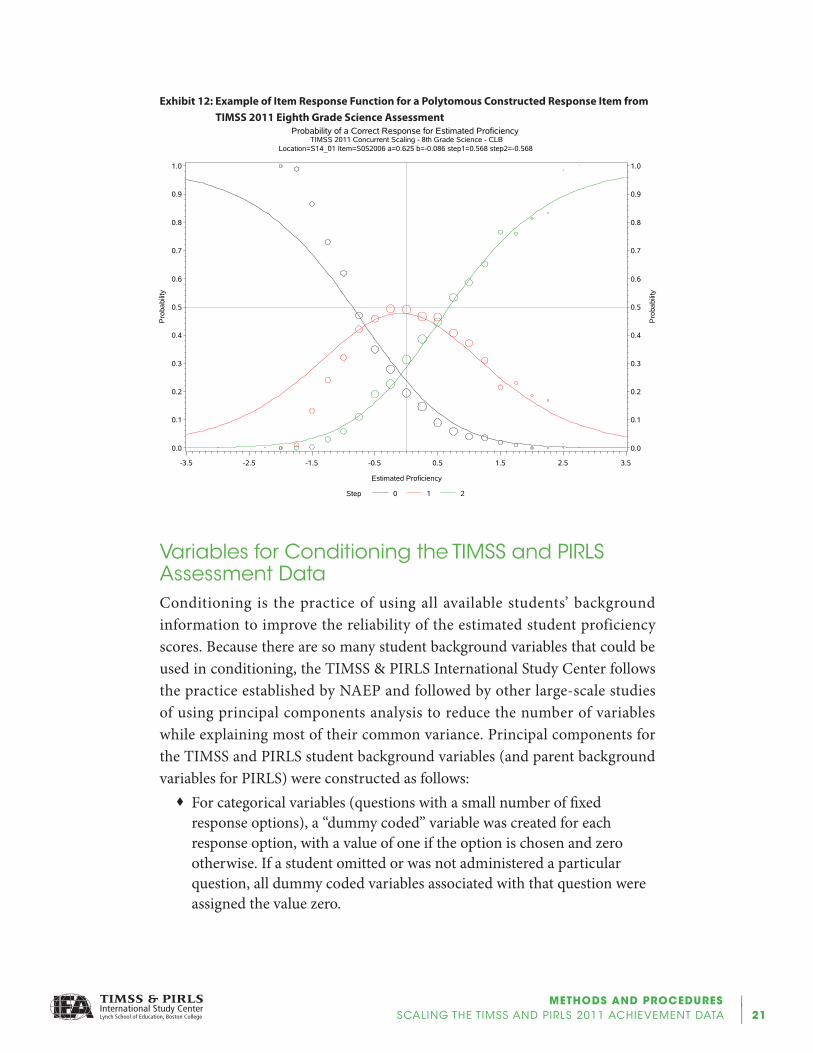
The plot in Exhibits 12 shows the empirical and fitted item response functions for polytomous items. Similar to the dichotomous item plots, the horizontal axis represents the proficiency scale, but in this example the vertical axis represents the probability of having a response in a given response category. The fitted curves based on the estimated item parameters are shown as solid lines and again the empirical results are represented by circles. The interpretation of the circles is the same as in Exhibit10 and Exhibit 11. The curve starting at the top left of the chart plots the probability of a score of zero on the item. This probability decreases as proficiency increases. The bell-shaped curve shows the probability of a score of one point—partial credit, starting low for low-ability students, reaching a maximum for medium-ability students, and decreasing for high-ability students. The curve ending at the top right corner of the chart shows the probability of a score of two points—full credit, starting low for low-ability students and increasing as proficiency increases.
METHODS AND PROCEDURES | SCALINGTHETIMSSANDPIRLS2011ACHIEVEMENTDATA | 21
Exhibit 12: Example of Item Response Function for a Polytomous Constructed Response Item from TIMSS 2011 Eighth Grade Science Assessment 01:03 Thursday, May 3, 2012 28801:03 Thursday, May 3, 2012 288
Prob
abilit
y
0.0
0.1
0.2
0.3
0.4
0.5
0.6
0.7
0.8
0.9
1.0
Estimated Proficiency
-3.5 -2.5 -1.5 -0.5 0.5 1.5 2.5 3.5
Prob
abilit
y
0.0
0.1
0.2
0.3
0.4
0.5
0.6
0.7
0.8
0.9
1.0
Probability of a Correct Response for Estimated ProficiencyTIMSS 2011 Concurrent Scaling - 8th Grade Science - CLB
Location=S14_01 Item=S052006 a=0.625 b=-0.086 step1=0.568 step2=-0.568
Step 0 1 2
VariablesforConditioningtheTIMSS andPIRLSAssessmentDataConditioning is the practice of using all available students’ background information to improve the reliability of the estimated student proficiency scores. Because there are so many student background variables that could be used in conditioning, the TIMSS & PIRLS International Study Center follows the practice established by NAEP and followed by other large-scale studies of using principal components analysis to reduce the number of variables while explaining most of their common variance. Principal components for the TIMSS and PIRLS student background variables (and parent background variables for PIRLS) were constructed as follows:
� For categorical variables (questions with a small number of fixed response options), a “dummy coded” variable was created for each response option, with a value of one if the option is chosen and zero otherwise. If a student omitted or was not administered a particular question, all dummy coded variables associated with that question were assigned the value zero.
| METHODS AND PROCEDURES22 | SCALINGTHETIMSSANDPIRLS2011ACHIEVEMENTDATA
� Background variables with numerous response options (such as year of birth) were recoded using criterion scaling.3 This was done by replacing the response option with the mean interim achievement score of all students choosing that option. Criterion scaling maximizes the correlation between the scaled variable and achievement. For PIRLS, the interim achievement score was the overall reading EAP (expected a-priori) achievement score produced from the item calibration. For TIMSS, the interim achievement score was the average of the mathematics and science EAP scores produced from the item calibrations.
� Separately for each country, all the dummy-coded and criterion-scaled variables were included in a principal components analysis. Those principal components accounting for 90 percent of the variance of the background variables were retained for use as conditioning variables.4 Because the principal components analysis was performed separately for each country, different numbers of principal components were required to account for 90% of the common variance in each country’s background variables.
In addition to the principal components, student gender (dummy coded), the language of the test (dummy coded), an indicator of the classroom in the school to which a student belongs (criterion scaled), and an optional country-specific variable (dummy coded) were included as primary conditioning variables, thereby accounting for most of the variance between students and preserving the between- and within-classrooms variance structure in the scaling model. For information on principle components conditioning, readers are referred to TIMSS 2011 Conditioning Models for Concurrent Calibration and PIRLS 2011 Conditioning Models for Concurrent Calibration.
GeneratingIRTProficiencyScoresfortheTIMSS andPIRLSAssessmentDataEducational Testing Service’s MGROUP program (Sheehan, 1985) was used to generate the IRT proficiency scores. This program takes as input the students’ responses to the items they were given, the item parameters estimated at the calibration stage, and the conditioning variables, and generates as output the plausible values that represent student proficiency. A useful feature of MGROUP is its ability to perform multi-dimensional scaling using the responses to all items across the proficiency scales and the correlations among the scales to
3 The process of generating criterion-scaled variables is described in Beaton (1969).
4 The number of principal components retained is limited to no more than 5% of a country’s student sample size, thereby reducing the percentage of variance accounted for, to avoid over-specification of the conditioning model.
METHODS AND PROCEDURES | SCALINGTHETIMSSANDPIRLS2011ACHIEVEMENTDATA | 23
improve the reliability of each individual scale. TIMSS capitalizes on this feature to simultaneously estimate overall mathematics and overall science proficiency scales using a two-dimensional MGROUP run.
The multi-dimensional scaling feature of MGROUP also was used to generate proficiency scores for the TIMSS and PIRLS 2011 subdomains. For PIRLS, a two-dimensional analysis using the item parameters estimated for the overall reading scale and the same conditioning variables, generated proficiency scores for the literary and informational purposes for reading. A second two-dimensional analysis generated proficiency scores for two processes of comprehension: retrieval and simple inferencing and interpreting and integrating. For TIMSS, multidimensional analyses using the item parameters estimated for the overall mathematics and overall science scales and the same conditioning variables were used in the estimation of proficiency scores for the mathematics and science content and cognitive domains. At fourth grade, the content domain scaling used a three-dimensional model to estimate proficiency scores for the three content domains in both mathematics and science. At eighth grade, the content domain scaling required a four-dimensional model because of the four content domains in each subject. A series of three-dimensional models were used for scaling the three cognitive domains in mathematics and science at fourth and eighth grades.
In addition to generating plausible values on the overall reading, mathematics, and science scales for the 2011 assessment data, the item parameters estimated at the calibration stage also were used to generate plausible values for the previous assessments (PIRLS 2006 and TIMSS 2007) for the countries included in the concurrent calibration. These additional plausible values were used to establish the linear transformation necessary to place the 2011 assessment data on the appropriate trend scales.
TransformingtheOverallScorestoMeasureTrendsTo provide results for the 2011 assessments that are comparable to results from previous assessments, the 2011 proficiency scores (plausible values) — for overall mathematics and overall science in TIMSS and overall reading in PIRLS — has to be transformed to the TIMSS and PIRLS achievement scales used for measuring trends. This was accomplished through two successive linear transformations as part of the concurrent calibration approach.
For TIMSS, the first step was to transform the means and standard deviations of the mathematics and science 2007 scores produced in 2011—
| METHODS AND PROCEDURES24 | SCALINGTHETIMSSANDPIRLS2011ACHIEVEMENTDATA
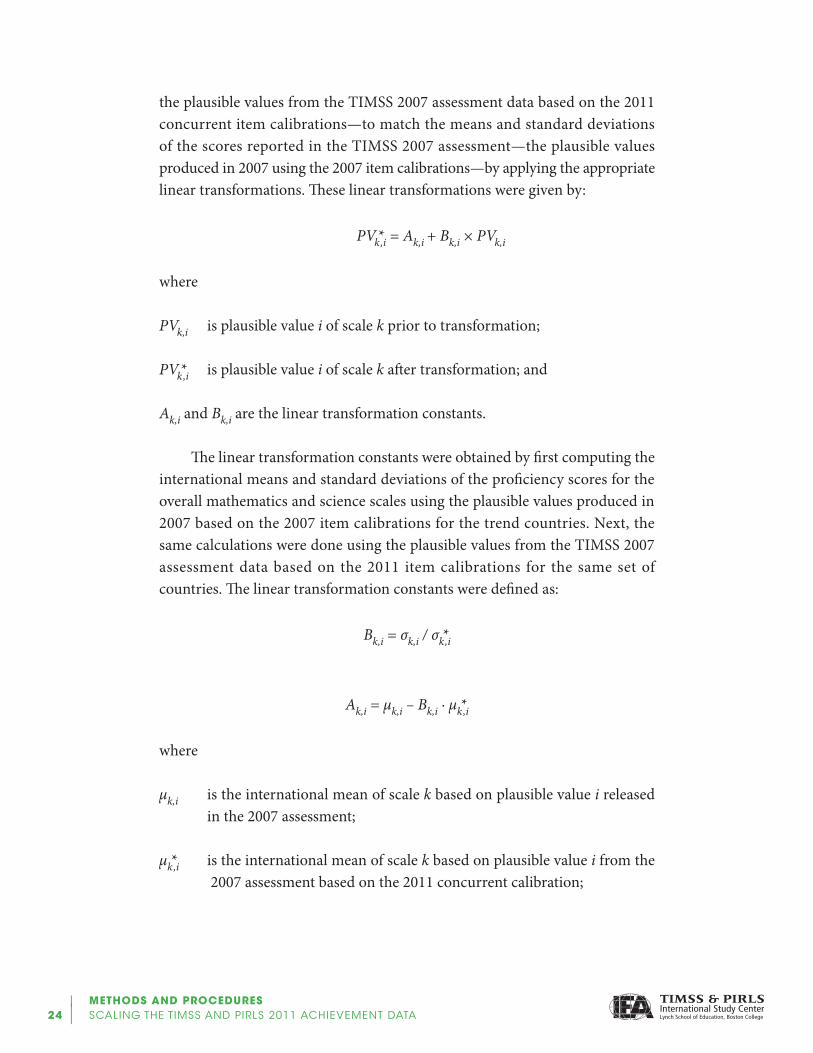
the plausible values from the TIMSS 2007 assessment data based on the 2011 concurrent item calibrations—to match the means and standard deviations of the scores reported in the TIMSS 2007 assessment—the plausible values produced in 2007 using the 2007 item calibrations—by applying the appropriate linear transformations. These linear transformations were given by:
PVk*,i = Ak,i + Bk,i × PVk,i
where
PVk,i is plausible value i of scale k prior to transformation;
PVk*,i is plausible value i of scale k after transformation; and
Ak,i and Bk,i are the linear transformation constants.
The linear transformation constants were obtained by first computing the international means and standard deviations of the proficiency scores for the overall mathematics and science scales using the plausible values produced in 2007 based on the 2007 item calibrations for the trend countries. Next, the same calculations were done using the plausible values from the TIMSS 2007 assessment data based on the 2011 item calibrations for the same set of countries. The linear transformation constants were defined as:
Bk,i = σk,i / σk*,i
Ak,i = μk,i – Bk,i ∙ μk*,i
where
μk,i is the international mean of scale k based on plausible value i released in the 2007 assessment;
μk*,i is the international mean of scale k based on plausible value i from the 2007 assessment based on the 2011 concurrent calibration;

METHODS AND PROCEDURES | SCALINGTHETIMSSANDPIRLS2011ACHIEVEMENTDATA | 25
σk,i is the international standard deviation of scale k based on plausible value i released in the 2007 assessment;
σk*,i is the international standard deviation of scale k based on plausible value i from the 2007 assessment based on the 2011 concurrent calibration.
There are five sets of transformation constants for each scale, one for each plausible value.
A similar procedure was followed to place the PIRLS 2011 data on the PIRLS achievement scale.
Exhibit 13: TIMSS 2011 Linear Transformation Constants for Achievement Scores at the Fourth Grade
Overall Mathematics
TIMSS 2007 Published Scores
TIMSS 2007 Re-scaled Scores
Ak,i Bk,i
Mean Standard Deviation Mean Standard
Deviation
PV1 509.77881 98.27104 –0.06956 1.04438 516.32438 94.09515
PV2 509.88650 98.20761 –0.06919 1.04119 516.41272 94.32281
PV3 510.18829 97.68089 –0.06890 1.04833 516.60847 93.17783
PV4 509.74968 98.39131 –0.06850 1.04637 516.19085 94.03151
PV5 509.65364 97.92636 –0.06738 1.04057 515.99456 94.10840
Overall Science
TIMSS 2007 Published Scores
TIMSS 2007 Re-scaled Scores
Ak,i Bk,i
Mean Standard Deviation Mean Standard
Deviation
PV1 514.12943 98.38115 –0.03563 1.02478 517.54968 96.00185
PV2 512.58575 98.91409 –0.03307 1.02325 515.78221 96.66627
PV3 512.54643 99.45460 –0.03887 1.02803 516.30725 96.74254
PV4 512.38909 99.01887 –0.03413 1.02356 515.69084 96.73934
PV5 513.82328 98.76119 –0.03446 1.02502 517.14339 96.35051
| METHODS AND PROCEDURES26 | SCALINGTHETIMSSANDPIRLS2011ACHIEVEMENTDATA
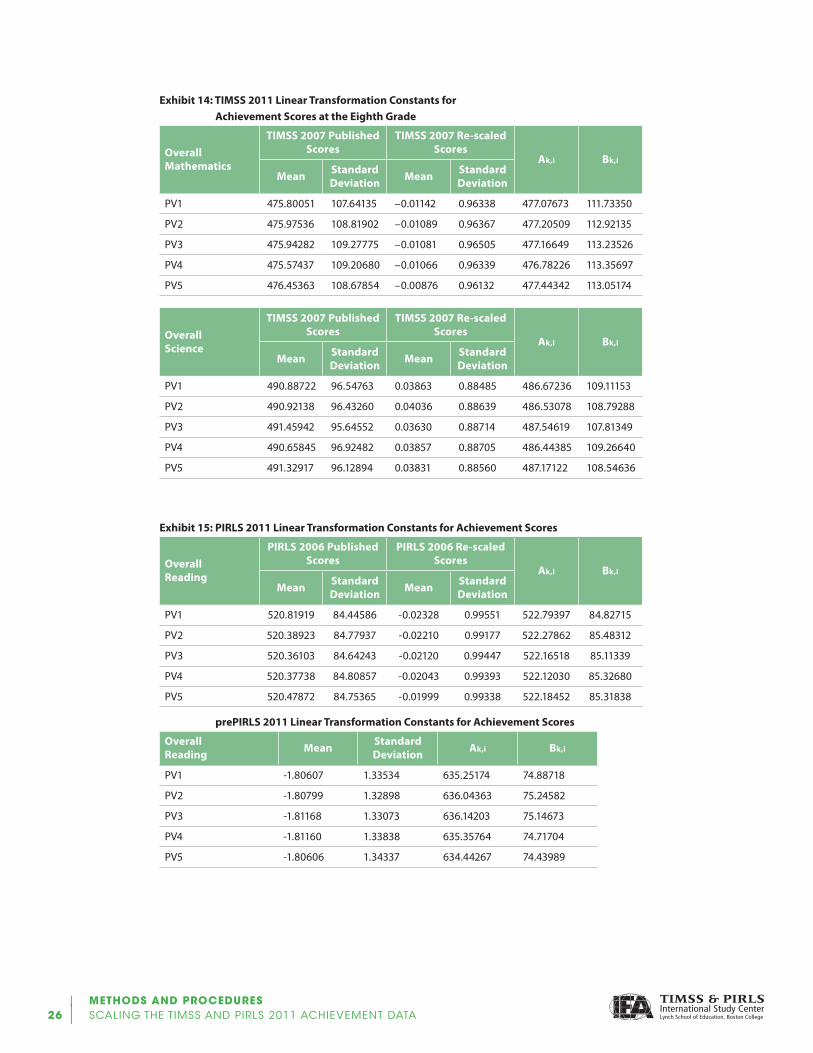
Exhibit 14: TIMSS 2011 Linear Transformation Constants for Achievement Scores at the Eighth Grade
Overall Mathematics
TIMSS 2007 Published Scores
TIMSS 2007 Re-scaled Scores
Ak,i Bk,i
Mean Standard Deviation Mean Standard
Deviation
PV1 475.80051 107.64135 –0.01142 0.96338 477.07673 111.73350
PV2 475.97536 108.81902 –0.01089 0.96367 477.20509 112.92135
PV3 475.94282 109.27775 –0.01081 0.96505 477.16649 113.23526
PV4 475.57437 109.20680 –0.01066 0.96339 476.78226 113.35697
PV5 476.45363 108.67854 –0.00876 0.96132 477.44342 113.05174
Overall Science
TIMSS 2007 Published Scores
TIMSS 2007 Re-scaled Scores
Ak,i Bk,i
Mean Standard Deviation Mean Standard
Deviation
PV1 490.88722 96.54763 0.03863 0.88485 486.67236 109.11153
PV2 490.92138 96.43260 0.04036 0.88639 486.53078 108.79288
PV3 491.45942 95.64552 0.03630 0.88714 487.54619 107.81349
PV4 490.65845 96.92482 0.03857 0.88705 486.44385 109.26640
PV5 491.32917 96.12894 0.03831 0.88560 487.17122 108.54636
Exhibit 15: PIRLS 2011 Linear Transformation Constants for Achievement Scores
Overall Reading
PIRLS 2006 Published Scores
PIRLS 2006 Re-scaled Scores
Ak,i Bk,i
Mean Standard Deviation Mean Standard
Deviation
PV1 520.81919 84.44586 -0.02328 0.99551 522.79397 84.82715
PV2 520.38923 84.77937 -0.02210 0.99177 522.27862 85.48312
PV3 520.36103 84.64243 -0.02120 0.99447 522.16518 85.11339
PV4 520.37738 84.80857 -0.02043 0.99393 522.12030 85.32680
PV5 520.47872 84.75365 -0.01999 0.99338 522.18452 85.31838
prePIRLS 2011 Linear Transformation Constants for Achievement Scores
Overall Reading Mean Standard
Deviation Ak,i Bk,i
PV1 -1.80607 1.33534 635.25174 74.88718
PV2 -1.80799 1.32898 636.04363 75.24582
PV3 -1.81168 1.33073 636.14203 75.14673
PV4 -1.81160 1.33838 635.35764 74.71704
PV5 -1.80606 1.34337 634.44267 74.43989
METHODS AND PROCEDURES | SCALINGTHETIMSSANDPIRLS2011ACHIEVEMENTDATA | 27
Once these linear transformation constants were established, they were applied to the overall proficiency scores — reading for PIRLS and mathematics and science for TIMSS — for all participating countries and benchmarking participants. This provided student achievement scores for the 2011 TIMSS and PIRLS assessments that are directly comparable to the scores from all previous assessments.
The linear transformation constants for the overall scales also were applied to each of the subdomains. For PIRLS, the transformation constants for the overall reading scale were applied to the proficiency scores of the two purposes for reading and the two processes of comprehension. Likewise, the transformation constants for TIMSS mathematics were applied to the proficiency scores of the mathematics content domains and the cognitive domains, and the transformation constants for TIMSS science were applied to the proficiency scores of the science content domains and cognitive domains. In this approach to measuring trends, achievement changes over time are established in the context of achievement in each subject overall. Trends are not established separately for each content or cognitive domains; rather differential changes in performance in the domain are considered in the light of trends in the subject overall.
Scaling the prePIRLS 2011 Achievement DataprePIRLS is a reading assessment modeled on the same framework as PIRLS, and it is intended for populations of readers that would find the PIRLS assessment too challenging. In 2011, three countries took part in the first prePIRLS assessment; one of those countries, Colombia, chose to administer both the prePIRLS and PIRLS assessments to the same sample of students.
With prePIRLS in its first assessment cycle and with only three participating countries, a special scaling approach was required to make the best use of the limited data available. Because Colombia administered both PIRLS and prePIRLS to the same fourth grade students, it was possible to use the Colombian data as a link between the two assessments. Preliminary analyses based on scaling the PIRLS and prePIRLS data from Colombia together revealed a high latent correlation (0.91) between the two assessments. This was considered sufficient evidence of a single construct of reading achievement underlying both assessments to justify a combined scaling of PIRLS and prePIRLS together.
Much like the normal TIMSS and PIRLS scaling procedures, the prePIRLS
| METHODS AND PROCEDURES28 | SCALINGTHETIMSSANDPIRLS2011ACHIEVEMENTDATA
scaling approach involved the same four tasks of calibrating the achievement items, creating principal components, generating proficiency scores, and placing these proficiency scores on a new prePIRLS reading achievement scale. However, for prePIRLS the item calibration step involved a concurrent calibration of the prePIRLS data from its three countries (Botswana, Colombia, and South Africa) together with the PIRLS data from all of the PIRLS 2011 countries, including Colombia. In this concurrent calibration, the PIRLS items had item parameters fixed at the values previously estimated from the main PIRLS 2011 concurrent calibration. This linking was possible because the Colombian data included both PIRLS and prePIRLS achievement data for the same sample of students. Not only did this link the two assessments by placing the prePIRLS item parameters on the same scale as the PIRLS items, but also provided added robustness to the estimation of the prePIRLS item parameters.
The conditioning for prePIRLS was done in exactly the same way as for PIRLS, as was the estimation of proficiency scores using the MGROUP software. This included scores for overall reading, for the two purposes for reading, and the two processes of comprehension. Although the prePIRLS item calibration established a link between the PIRLS and prePIRLS scales, because this was done on the basis of data from just one country it was considered premature to use the PIRLS-prePIRLS link to establish the metric for the prePIRLS scale. Instead, the linear transformations to determine the prePIRLS reading metric were set to produce an average of 500 and standard deviation of 100 across the three participating countries. These same linear transformations also were applied to the purposes and processes subdomains.
ReferencesMuraki, E., & Bock, R.D. (1991). PARSCALE: Parameter scaling of rating data. Chicago, IL:
Scientific Software, Inc.
Rubin, D.B. (1987). Multiple imputation for nonresponse in surveys. New York: John Wiley & Sons.
Sheehan, K.M. (1985). M-Group: Estimation of group effects in multivariate models. [Software Version 3.2] Princeton, NJ: Educational Testing Service.