Embed Size (px)
Citation preview
Scaling Properties of Delay Tolerant Networks with Correlated Motion Patterns
Uichin Lee, Bell Labs/Alcatel-Lucent
Soon Y. Oh, Mario Gerla (UCLA)Kang-Won Lee (IBM T.J. Watson Research)
2 | CHANTS’09 | Sept. 2009 Alcatel-Lucent
Key DTN Metric: Pair-wise Inter-contact Time
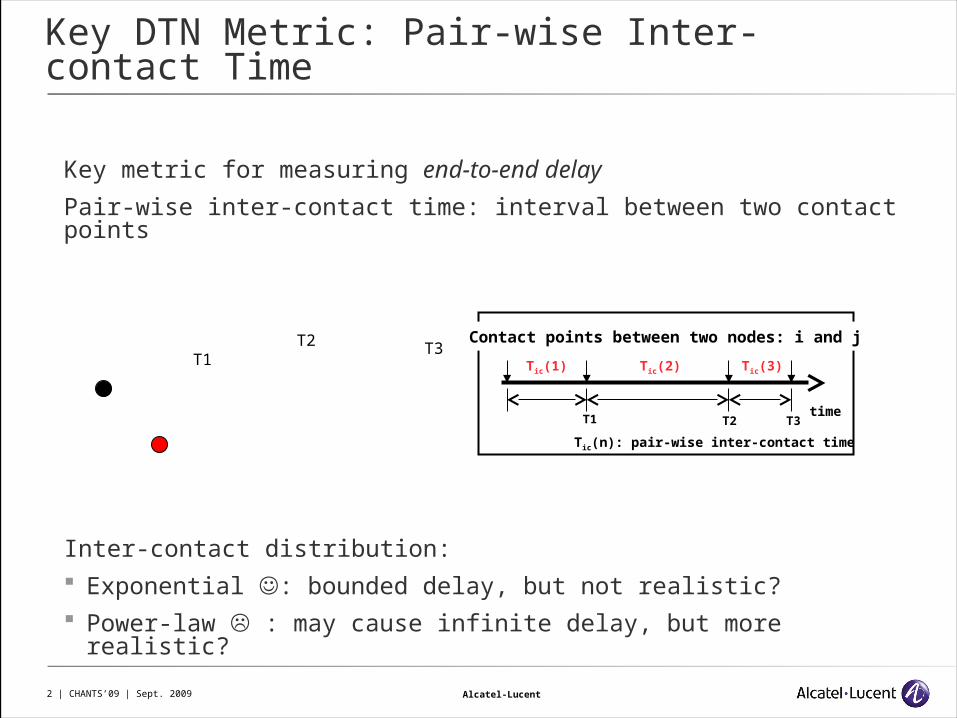
Key metric for measuring end-to-end delay
Pair-wise inter-contact time: interval between two contact points
Inter-contact distribution: Exponential : bounded delay, but not realistic? Power-law : may cause infinite delay, but more realistic?
T1T2 T3
Contact points between two nodes: i and j
Tic(n): pair-wise inter-contact time
time
Tic(1)
T1
Tic(2)
T2
Tic(3)
T3
3 | CHANTS’09 | Sept. 2009 Alcatel-Lucent
Two-phase Inter-contact Time
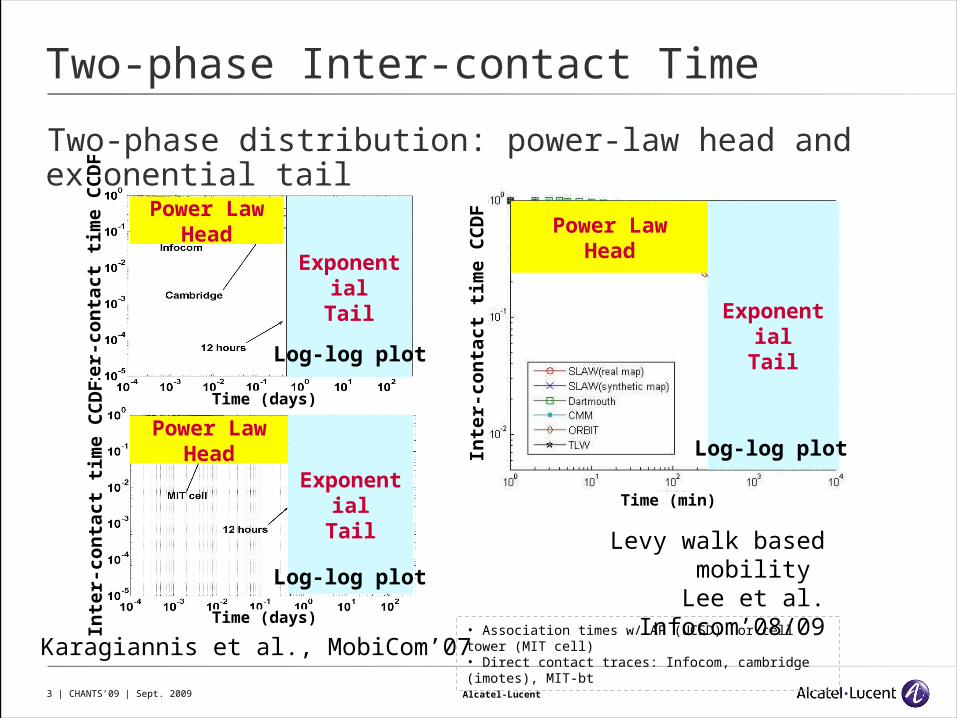
Two-phase distribution: power-law head and exponential tail
Levy walk based mobility Lee et al. Infocom’08/09
Inte
r-con
tact
tim
e C
CD
FTime (min)
Power LawHead
ExponentialTail
Power LawHead
Inte
r-con
tact
tim
e C
CD
FIn
ter-
con
tact
tim
e C
CD
F
ExponentialTail
ExponentialTail
Karagiannis et al., MobiCom’07• Association times w/ AP (UCSD) or cell tower (MIT cell)• Direct contact traces: Infocom, cambridge (imotes), MIT-bt
Power LawHead
Log-log plot
Log-log plot
Time (days)
Time (days)
Log-log plot
4 | CHANTS’09 | Sept. 2009 Alcatel-Lucent
Two-phase Inter-contact Time
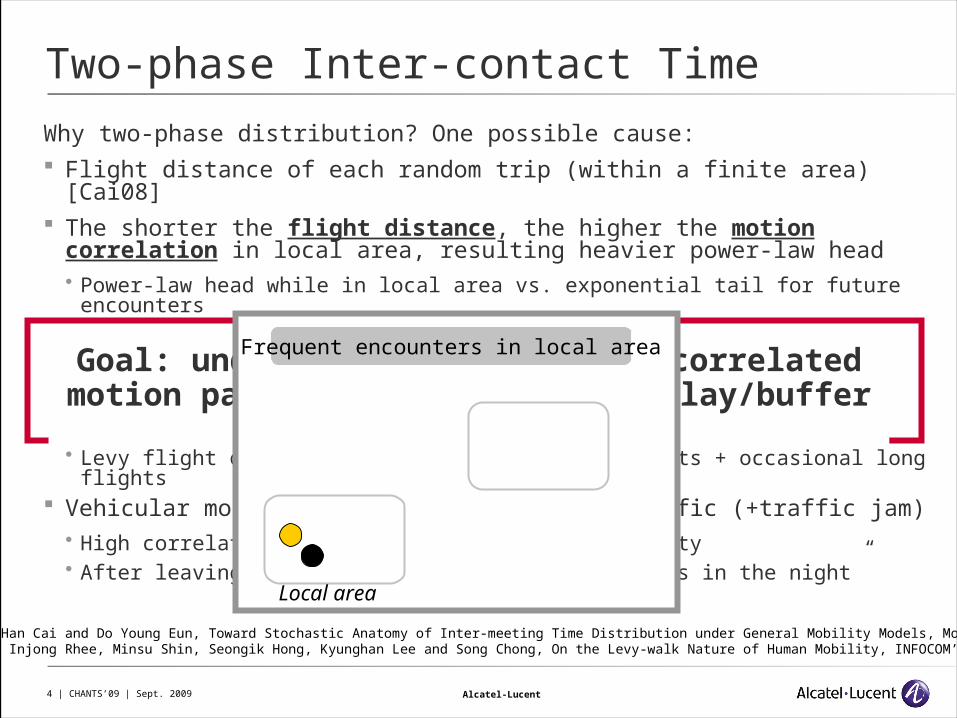
Why two-phase distribution? One possible cause: Flight distance of each random trip (within a finite area) [Cai08] The shorter the flight distance, the higher the motion
correlation in local area, resulting heavier power-law head Power-law head while in local area vs. exponential tail for future
encounters
Examples of motion correlation: Manhattan sightseers: In Time Square, sightseers tend to bump
into each other; and then depart for other sights Levy flight of human walks [Rhee08]: short flights + occasional long
flights Vehicular mobility: constrained by road traffic (+traffic jam)
High correlation among vehicles in close proximity After leaving locality, vehicles meet like “ships in the night”
*Cai08: Han Cai and Do Young Eun, Toward Stochastic Anatomy of Inter-meeting Time Distribution under General Mobility Models, MobiHoc’08*Rhee08: Injong Rhee, Minsu Shin, Seongik Hong, Kyunghan Lee and Song Chong, On the Levy-walk Nature of Human Mobility, INFOCOM’08
Goal: understanding impacts of correlated motion patterns on throughput/delay/buffer
scaling properties
Frequent encounters in local area
Local area
5 | CHANTS’09 | Sept. 2009 Alcatel-Lucent
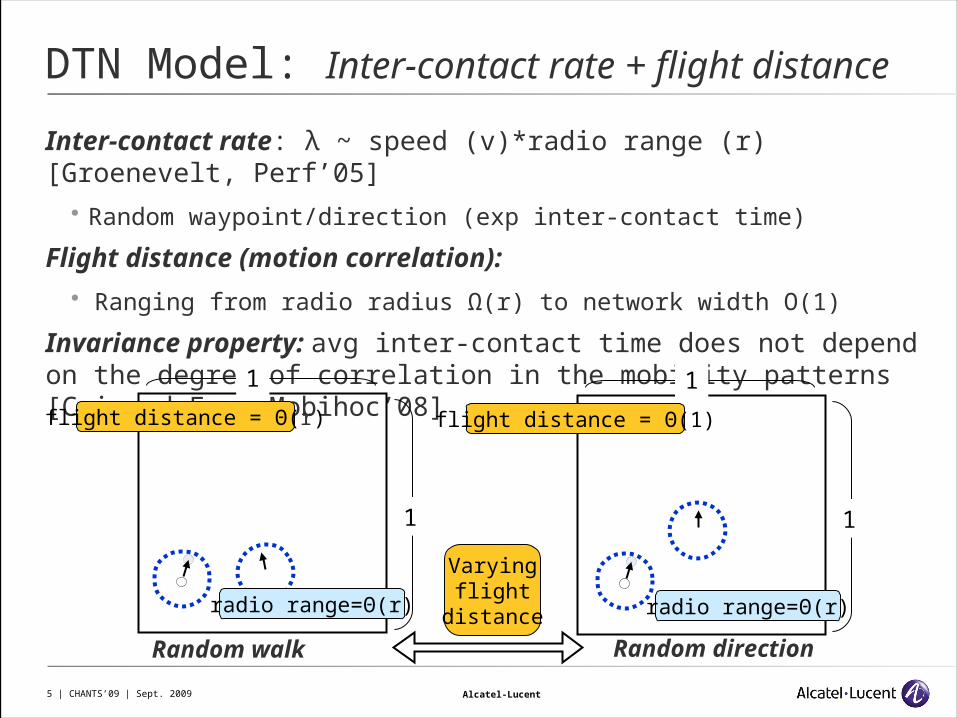
DTN Model: Inter-contact rate + flight distance
Inter-contact rate: λ ~ speed (v)*radio range (r) [Groenevelt, Perf’05]
Random waypoint/direction (exp inter-contact time)
Flight distance (motion correlation):
Ranging from radio radius Ω(r) to network width O(1)
Invariance property: avg inter-contact time does not depend on the degree of correlation in the mobility patterns [Cai and Eun, Mobihoc’08]
1
1
flight distance = Θ(1)
Random directionRandom walk
1
1
flight distance = Θ(r)
radio range=Θ(r)radio range=Θ(r)
Varyingflight
distance
6 | CHANTS’09 | Sept. 2009 Alcatel-Lucent
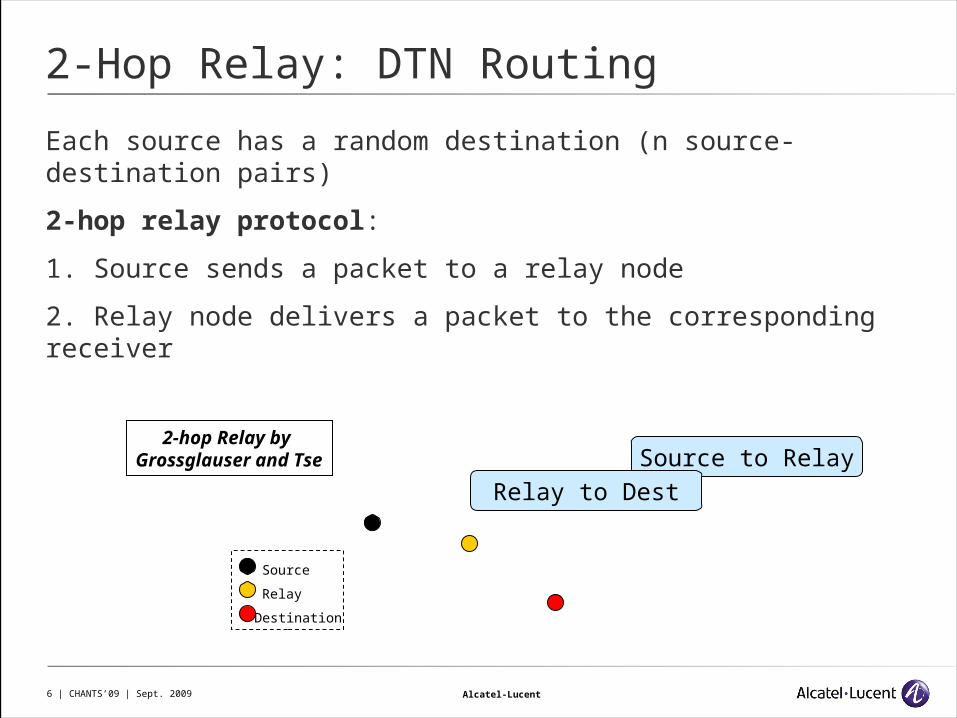
2-Hop Relay: DTN Routing
Each source has a random destination (n source-destination pairs)
2-hop relay protocol:
1. Source sends a packet to a relay node
2. Relay node delivers a packet to the corresponding receiver
2-hop Relay by Grossglauser and Tse
Source
Relay
Destination
Source to Relay
Relay to Dest
7 | CHANTS’09 | Sept. 2009 Alcatel-Lucent
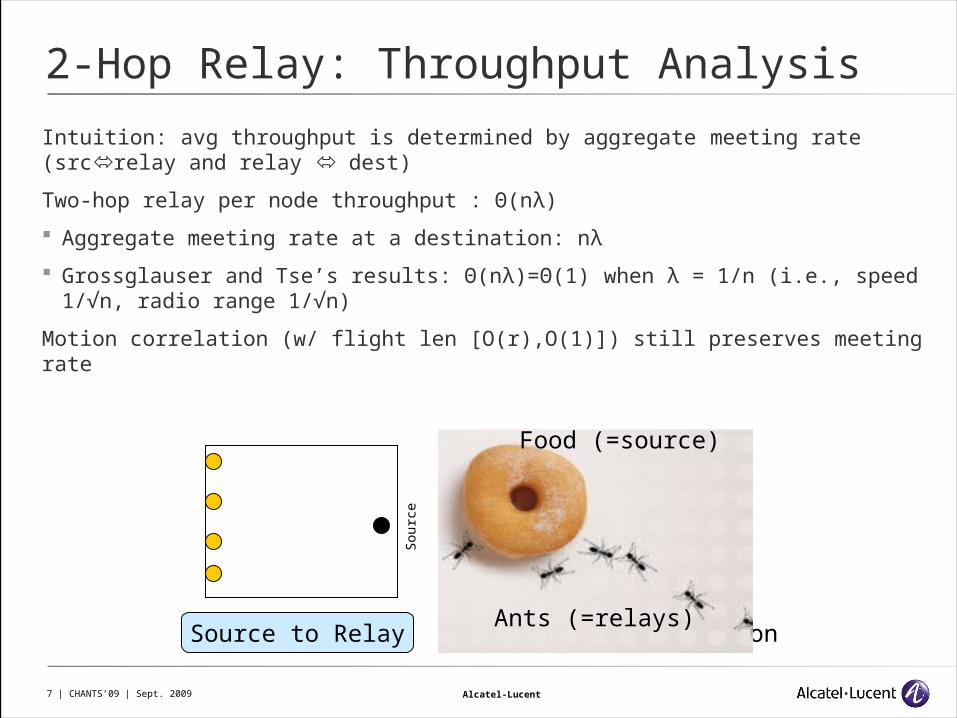
2-Hop Relay: Throughput Analysis
Intuition: avg throughput is determined by aggregate meeting rate (srcrelay and relay dest)
Two-hop relay per node throughput : Θ(nλ)
Aggregate meeting rate at a destination: nλ
Grossglauser and Tse’s results: Θ(nλ)=Θ(1) when λ = 1/n (i.e., speed 1/√n, radio range 1/√n)
Motion correlation (w/ flight len [O(r),O(1)]) still preserves meeting rate
Source to Relay Relay to Destination
Sou
rce
Des
tinat
ion
Food (=source)
Ants (=relays)
8 | CHANTS’09 | Sept. 2009 Alcatel-Lucent
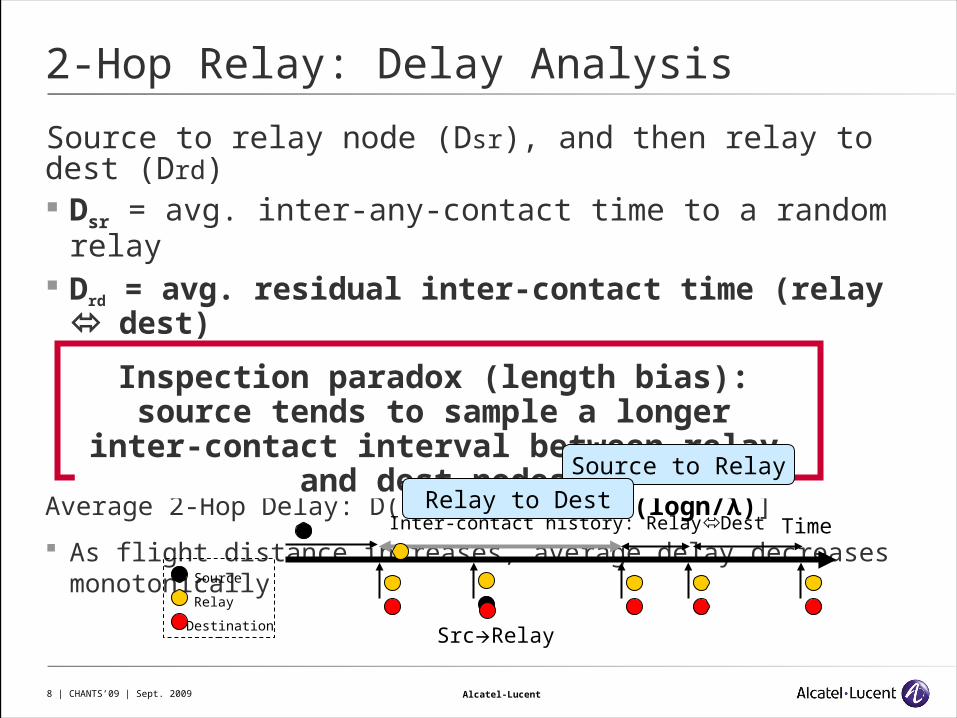
2-Hop Relay: Delay Analysis
Source to relay node (Dsr), and then relay to dest (Drd) Dsr = avg. inter-any-contact time to a random relay Drd = avg. residual inter-contact time (relay
dest) Mean residual inter-contact time (Drd) = E[T2] / 2E[T]
>> T is a random variable for inter-contact time
Random Direction (RD): E[T2] = O(1/λ2) Drd=O(1/λ)
Random Walk (RW): E[T2] = O(logn*1/λ2) Drd=O(logn/λ)
Average 2-Hop Delay: D(n) = [O(1/λ), O(logn/λ)]
As flight distance increases, average delay decreases monotonically
Inspection paradox (length bias): source tends to sample a longer inter-
contact interval between relay and dest nodes
Time
SrcRelay
Inter-contact history: RelayDest
Source
Relay
Destination
Source to Relay
Relay to Dest
9 | CHANTS’09 | Sept. 2009 Alcatel-Lucent
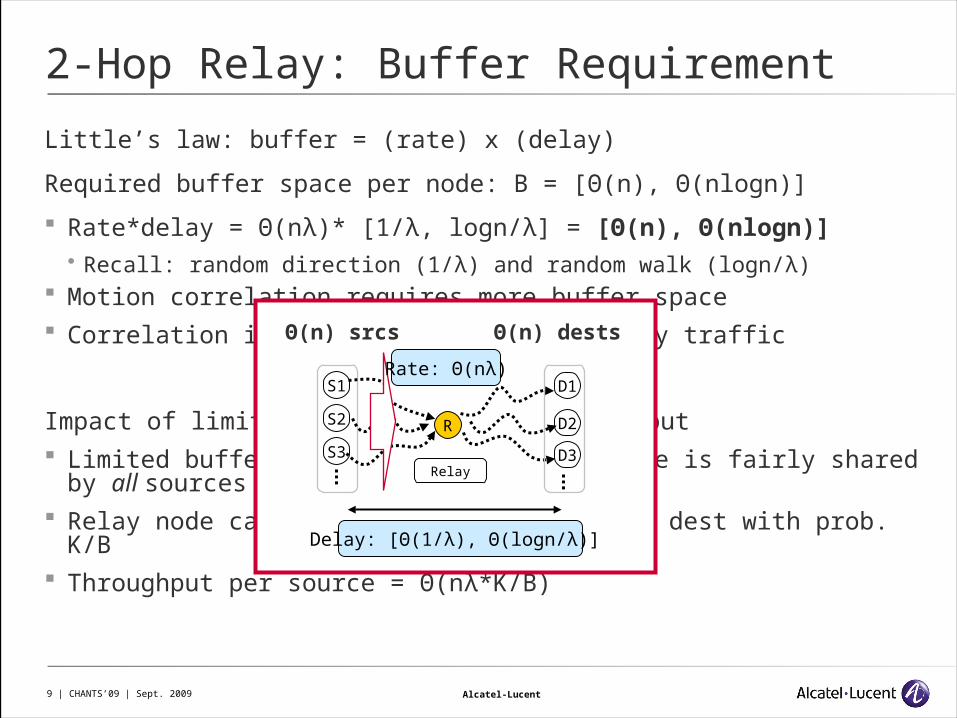
2-Hop Relay: Buffer Requirement
Little’s law: buffer = (rate) x (delay)
Required buffer space per node: B = [Θ(n), Θ(nlogn)]
Rate*delay = Θ(nλ)* [1/λ, logn/λ] = [Θ(n), Θ(nlogn)] Recall: random direction (1/λ) and random walk (logn/λ)
Motion correlation requires more buffer space Correlation increases burstiness of relay traffic
Impact of limited buffer space on throughput Limited buffer of Θ(K) at each relay node is fairly shared by all
sources Relay node carries a packet to a certain dest with prob. K/B Throughput per source = Θ(nλ*K/B)
Delay: [Θ(1/λ), Θ(logn/λ)]
S1
S2 R
Θ(n) srcs
RelayS3
D1
D2
D3
Θ(n) dests
Rate: Θ(nλ)
10 | CHANTS’09 | Sept. 2009 Alcatel-Lucent
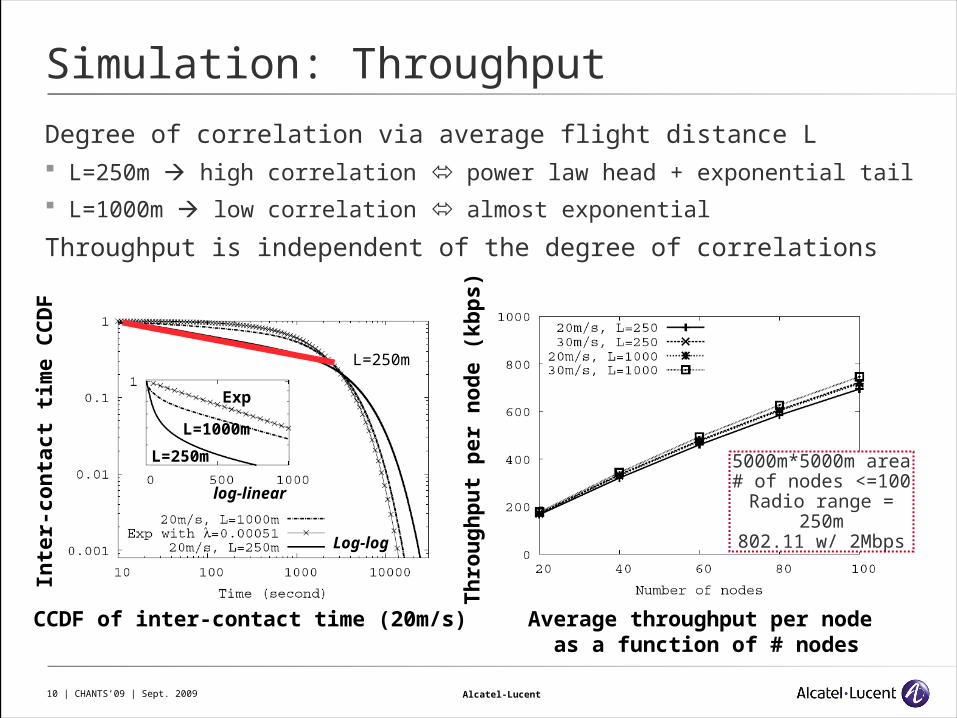
Simulation: Throughput
Degree of correlation via average flight distance L L=250m high correlation power law head + exponential tail L=1000m low correlation almost exponential
Throughput is independent of the degree of correlations
Average throughput per node as a function of # nodes
Th
rou
gh
pu
t p
er
nod
e (
kb
ps)
5000m*5000m area
# of nodes <=100Radio range =
250m802.11 w/ 2Mbps
CCDF of inter-contact time (20m/s)
L=250m
log-linear
L=1000m
L=250m
Exp
Inte
r-con
tact
tim
e C
CD
F
Log-log
11 | CHANTS’09 | Sept. 2009 Alcatel-Lucent
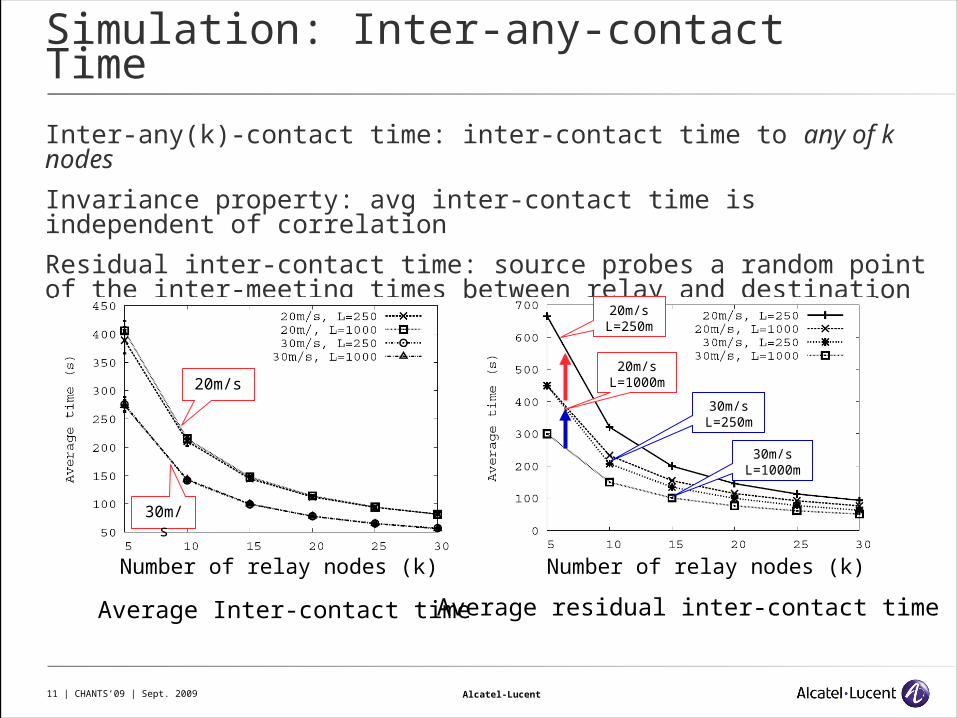
Simulation: Inter-any-contact Time
Inter-any(k)-contact time: inter-contact time to any of k nodes
Invariance property: avg inter-contact time is independent of correlation
Residual inter-contact time: source probes a random point of the inter-meeting times between relay and destination
Average Inter-contact time Average residual inter-contact time
20m/s
30m/s
20m/sL=250m
20m/sL=1000m
30m/sL=250m
30m/sL=1000m
Number of relay nodes (k) Number of relay nodes (k)
12 | CHANTS’09 | Sept. 2009 Alcatel-Lucent
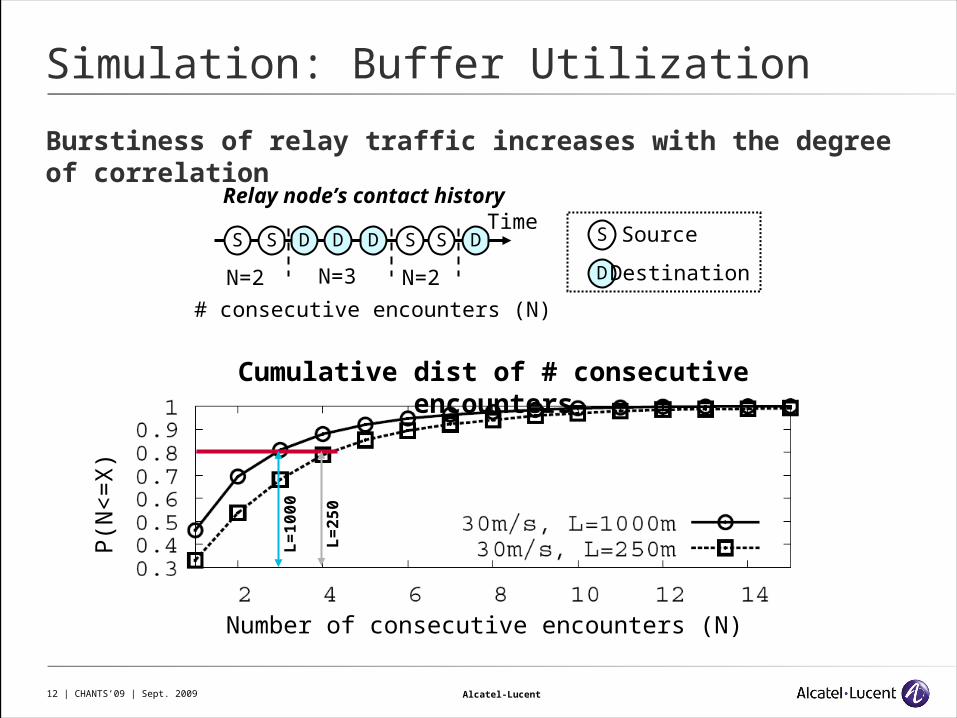
Simulation: Buffer Utilization
Burstiness of relay traffic increases with the degree of correlation
S S D D D S S D
N=3 N=2
Relay node’s contact historyTime
# consecutive encounters (N)
S Source
D DestinationN=2
Cumulative dist of # consecutive encounters
L=
25
0
L=
10
00
Number of consecutive encounters (N)
P(N
<=
X)
13 | CHANTS’09 | Sept. 2009 Alcatel-Lucent
Conclusion
Impact of correlated motion patterns on DTN scaling properties
DTN model: inter-contact rate + motion correlation via flight distance
Flight distance of Ω(r); i.e., min travel distance ~ one’s radio range Considered mobility ranges from Random Walk to Random Direction
Main results:
Throughput is independent of motion correlation Delay monotonically increases with the degree of correlation Buffer requirement also increases with the degree of correlation Correlation increases burstiness of relay traffic
Future work:
Applying results to DTN multicast scenarios Scaling properties of inter-domain DTN scenarios