Embed Size (px)
Citation preview
ARTICLE IN PRESS
0378-4371/$ - se
doi:10.1016/j.ph
�CorrespondE-mail addr
Physica A 363 (2006) 96–103
www.elsevier.com/locate/physa
Scaling laws in urban supply networks
Christian Kuhnerta,�, Dirk Helbinga,b, Geoffrey B. Westc
aInstitute for Transport & Economics, Dresden University of Technology, Andreas-Schubert-Str. 23, 01062 Dresden, GermanybCollegium Budapest—Institute for Advanced Study, Szentharomsag u. 2, 1014 Budapest, Hungary
cThe Santa Fe Institute, 1399 Hyde Park Road, Santa Fe, NM 87501, USA
Available online 17 February 2006
Abstract
In previous work, it has been proposed that urban structures may be understood as a result of self-organization
principles. In particular, researchers have identified fractal structures of public transportation networks and land use
patterns. Here, we will study spatial distribution systems for energy, fuel, medical, and food supply. It is found that these
systems show power-law scaling as well, when the number of ‘‘supply stations’’ is plotted over the population size.
Surprisingly, only some supply systems display a linear scaling with population size. Others show sublinear or superlinear
scaling. We suggest an interpretation regarding the kind of scaling law that is expected in dependence of the function and
constraints of the respective supply system.
r 2006 Elsevier B.V. All rights reserved.
Keywords: Supply network; Scaling; Power law; Urban agglomerations
1. Introduction
The classical view of the spatio-temporal evolution of cities in developed countries is that urban spaces arethe result of (centralized) urban planning. After the advent of complex systems’ theory, however, people havestarted to interpret city structures as a result of self-organization processes. In fact, although the dynamics ofurban agglomerations is a consequence of many human decisions, these are often guided by optimizationgoals, requirements, or boundary conditions (such as topographic ones). Therefore, it appears promising toview urban planning decisions as results of the existing structures and upcoming ones (e.g. when a new freewaywill lead closeby in the near future). Within such an approach, it would not be surprising anymore if urbanevolution could be understood as a result of self-organization.
In fact, already in the 19th century, it was proposed that the migration streams between cities can beunderstood by a ‘‘gravity law’’ [1,2], according to which the relevant variables for migration activities are thepopulation sizes of the origin and destination town and the distance between them. According to this, citygrowth could be solely understood as a result of the birth and death rates and migration activities [3].
Maybe even more intriguing is the existence of Zipf’s law [4], according to which the population sizes ofcities are inversely proportional to their rank. It also implies that the number of cities of a given size is
e front matter r 2006 Elsevier B.V. All rights reserved.
ysa.2006.01.058
ing author.
ess: [email protected] (C. Kuhnert).
ARTICLE IN PRESSC. Kuhnert et al. / Physica A 363 (2006) 96–103 97
approximately inversely proportional to their size N, implying a power law
pðNÞ / N�1 (1)
of the size distribution. Among the many different approaches trying to explain Zipf’s law (e.g. Refs. [5–7]),the one by Gabaix [8] surprises by its simplicity. According to him, the simplest stochastic model withmultiplicative noise xiðtÞ, namely
dNi
dt¼ ½Aþ xiðtÞ�NiðtÞ (2)
is able to generate Zipf’s distribution. In agreement with ‘‘Gibrat’s law’’ [9,10], it assumes that the growth ratesAiðtÞ ¼ Aþ xiðtÞ are stochastically distributed and varying around a characteristic value A independent of the(population) size NiðtÞ of a city i. These days, scientists attempt to explain the different attractiveness of cities,i.e., the time-dependent values AiðtÞ through other variables such as productivity, natural resources, quality oflife, etc.
Another interesting point is the discovery of self-similar structures in urban systems. For example,Christaller suggested a theory of central places [11], according to which cities are (self-)organized in ahierarchical way: metropoles are surrounded by a hexagonal ‘‘ring’’ of medium-sized cities, each of these by aring of smaller towns, etc. Later on, the Collaborative Research Project ‘‘Natural Constructions’’1 studiedurban patterns from the perspective of self-organization theory. For example, street systems were comparedwith the water transport systems within leaves of plants and analyzed for quantities such as the reachabilityand average detours. Moreover, public transportation systems were found to show self-similar, fractal features[12]. The same applies to urban boundaries and urban sprawl [7,12–15]. Usage patterns of public transportnetworks [16] and road networks [17] show power-law distributions as well.
The EU project ISCOM involving biological physicists, geographers, and scientists of other disciplinescontinues this line of research and goes beyond previous results by trying to identify the mechanisms behindself-similar urban structures and their scaling laws. This is encouraged by the successful derivation ofempirically observed scaling laws for quantities like metabolic rates, maximal population growth, life-spans,gross photosynthetic rates, trunk diameters, etc. in biological systems [18–20]. The underlying theory is basedon the determination of self-similar, tree-like arterial and other supply systems, which minimize energydissipation under the constraint of space-covering supply.
In this contribution, we will focus on the question whether scaling laws exist for urban supply systems. Ifyes, what are their exponents? In Section 2, we start with describing our data sources. Section 3 discusses ourdata evaluation procedure and compares different statistical evaluation procedures such as linear andlogarithmic binning. Section 4 presents the scaling laws found for different supply systems. Finally, Section 5summarizes our results and tries to give an interpretation of the findings.
2. Data sources
We have studied supply systems of cities in different European countries and analyzed, on the one hand,variables related to the electric energy supply in Germany and, on the other hand, data about so-called ‘‘Pointsof interest’’ of several European countries.
Our investigation of energy data is based on information by the German Electricity Association [21] for thetime period of January to December 2002. The electric energy relates to the power plant of the respectivecommune, while the population size is taken for the administrative area of the city or municipality the powerplant is located in. The population sizes Ni for the population spatial units stem from the German FederalStatistical Office [22] and are based on census data with cut-off date December 2001. Within the countries ofinvestigation, the number of inhabitants of cities usually does not vary dramatically, so that these data shouldalso be applicable to a few years before and after. For large cities such as Berlin, Munich, Bremen, Hannover,or Bremerhaven, there was sometimes more than one enterprise listed. It could also happen that an
1It was the ‘‘Sonderforschungsbereich 230’’ of the German Research Foundation (DFG), in which urban planners and architects,
construction engineers, biologists, physicists, and philosophers were involved.
ARTICLE IN PRESSC. Kuhnert et al. / Physica A 363 (2006) 96–10398
superregional supplier had its headquarter in a small city. Such cases have been removed from the data set toavoid outliers.
Moreover, data of urban supply networks have become increasingly available during the last years. In thispaper, we have evaluated point-of-interest (POI) data of the year 2002 provided by Teleatlasr. These datawere gathered for commercial route guidance and geo-information systems. A potential problem for ourevaluation, however, was the different definition of the administrative areas in different countries. In somecountries, they were almost on the level of municipalities, in other countries they contained larger areas. Tohave comparable data, we included in our evaluation only data of statistical areas with more than 50,000inhabitants and population densities greater than 1000 people per square kilometer. The first conditionexcluded the small towns and villages as they often represent administrative units rather than naturally growncities. The second restriction excluded large rural areas.
Another potential problem was that, while some POI variables Y i had a coverage of over 90% according toinformation by Teleatlasr, the coverage for others was not complete. We have, therefore, focussed on datasets which were large enough and either close to complete or a good statistical representation. In contrast, wehave excluded variables and countries, for which the data appeared to be a non-representative sample or forwhich the sample was too small (as for countries like Luxembourg or Belgium). Both was reflected by a largedata scattering, which discouraged to make any fit to the data, and by large confidence intervals that did notallow for any reasonable conclusions. Generally speaking, we neglected variables if the square of thecorrelation coefficient regarding the population of the cities was smaller than 0.75.
3. Data evaluation procedure
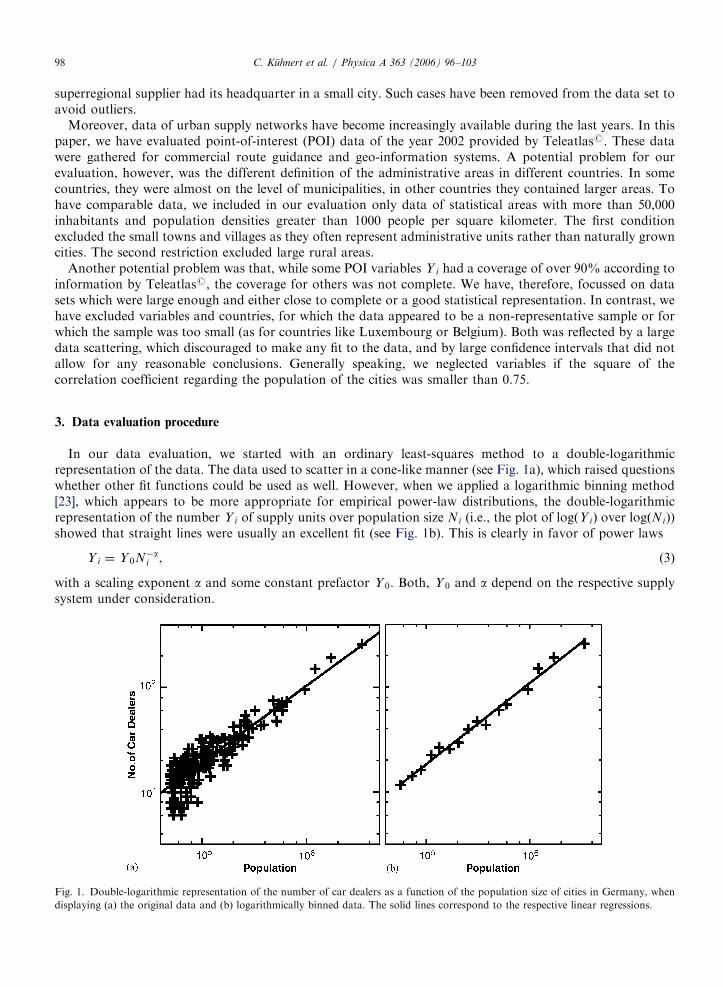
In our data evaluation, we started with an ordinary least-squares method to a double-logarithmicrepresentation of the data. The data used to scatter in a cone-like manner (see Fig. 1a), which raised questionswhether other fit functions could be used as well. However, when we applied a logarithmic binning method[23], which appears to be more appropriate for empirical power-law distributions, the double-logarithmicrepresentation of the number Y i of supply units over population size Ni (i.e., the plot of logðY iÞ over logðNiÞ)showed that straight lines were usually an excellent fit (see Fig. 1b). This is clearly in favor of power laws
Y i ¼ Y 0N�ai , (3)
with a scaling exponent a and some constant prefactor Y 0. Both, Y 0 and a depend on the respective supplysystem under consideration.
Fig. 1. Double-logarithmic representation of the number of car dealers as a function of the population size of cities in Germany, when
displaying (a) the original data and (b) logarithmically binned data. The solid lines correspond to the respective linear regressions.
ARTICLE IN PRESS
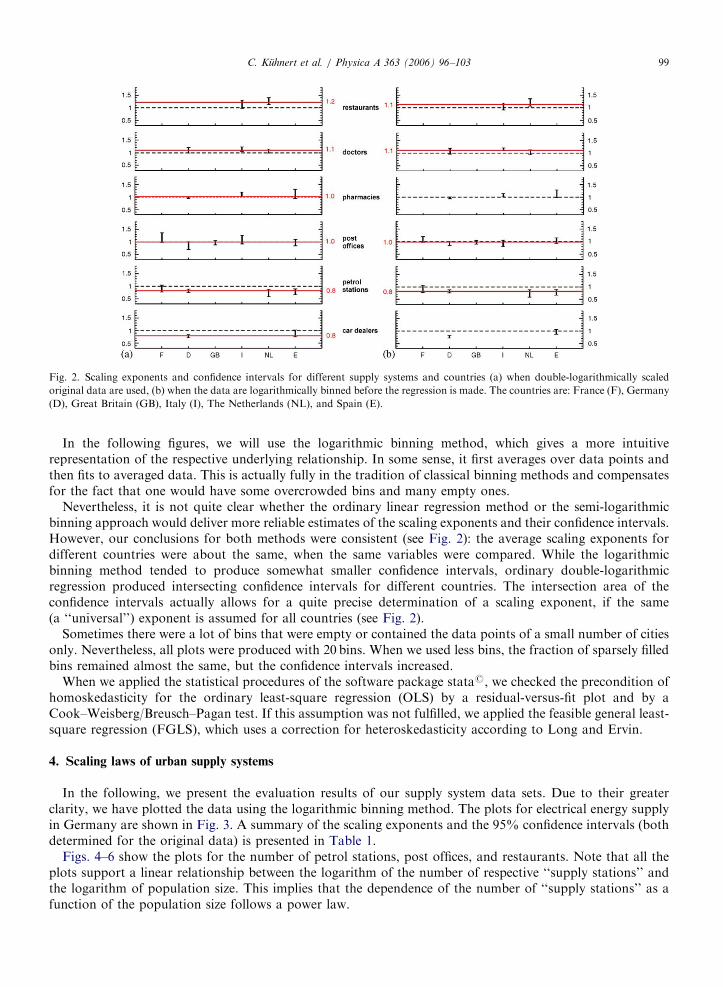
Fig. 2. Scaling exponents and confidence intervals for different supply systems and countries (a) when double-logarithmically scaled
original data are used, (b) when the data are logarithmically binned before the regression is made. The countries are: France (F), Germany
(D), Great Britain (GB), Italy (I), The Netherlands (NL), and Spain (E).
C. Kuhnert et al. / Physica A 363 (2006) 96–103 99
In the following figures, we will use the logarithmic binning method, which gives a more intuitiverepresentation of the respective underlying relationship. In some sense, it first averages over data points andthen fits to averaged data. This is actually fully in the tradition of classical binning methods and compensatesfor the fact that one would have some overcrowded bins and many empty ones.
Nevertheless, it is not quite clear whether the ordinary linear regression method or the semi-logarithmicbinning approach would deliver more reliable estimates of the scaling exponents and their confidence intervals.However, our conclusions for both methods were consistent (see Fig. 2): the average scaling exponents fordifferent countries were about the same, when the same variables were compared. While the logarithmicbinning method tended to produce somewhat smaller confidence intervals, ordinary double-logarithmicregression produced intersecting confidence intervals for different countries. The intersection area of theconfidence intervals actually allows for a quite precise determination of a scaling exponent, if the same(a ‘‘universal’’) exponent is assumed for all countries (see Fig. 2).
Sometimes there were a lot of bins that were empty or contained the data points of a small number of citiesonly. Nevertheless, all plots were produced with 20 bins. When we used less bins, the fraction of sparsely filledbins remained almost the same, but the confidence intervals increased.
When we applied the statistical procedures of the software package statar, we checked the precondition ofhomoskedasticity for the ordinary least-square regression (OLS) by a residual-versus-fit plot and by aCook–Weisberg/Breusch–Pagan test. If this assumption was not fulfilled, we applied the feasible general least-square regression (FGLS), which uses a correction for heteroskedasticity according to Long and Ervin.
4. Scaling laws of urban supply systems
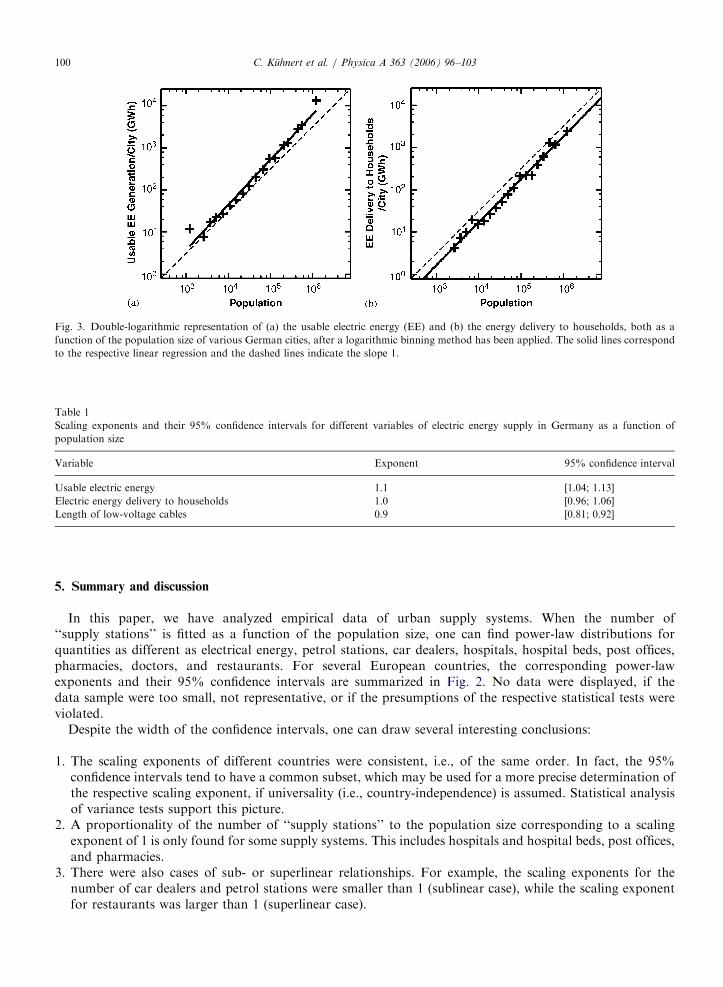
In the following, we present the evaluation results of our supply system data sets. Due to their greaterclarity, we have plotted the data using the logarithmic binning method. The plots for electrical energy supplyin Germany are shown in Fig. 3. A summary of the scaling exponents and the 95% confidence intervals (bothdetermined for the original data) is presented in Table 1.
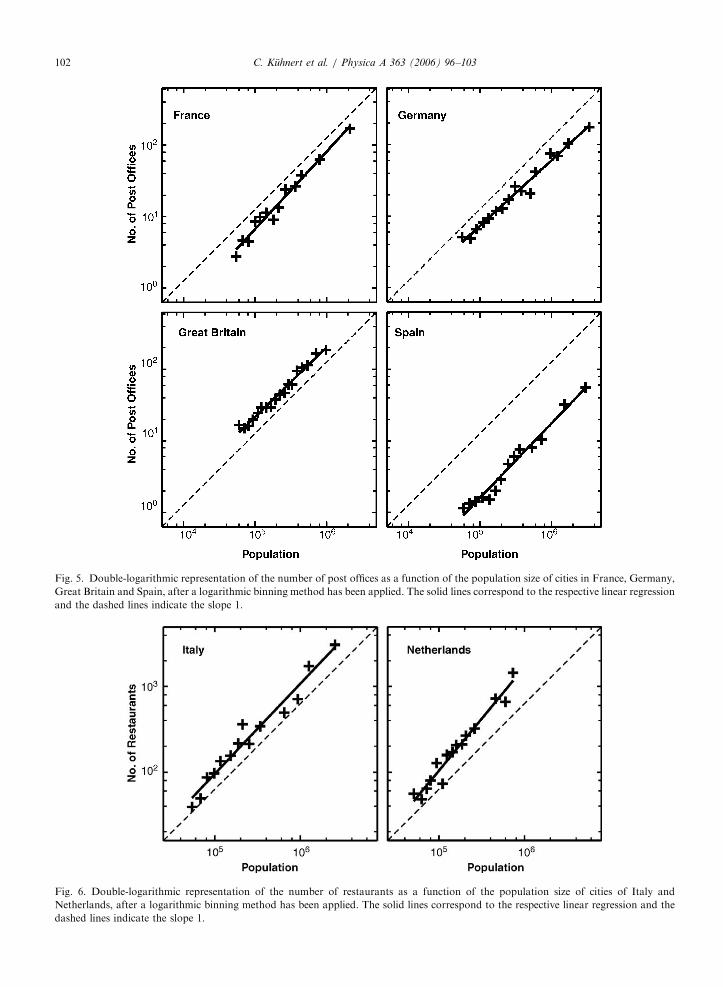
Figs. 4–6 show the plots for the number of petrol stations, post offices, and restaurants. Note that all theplots support a linear relationship between the logarithm of the number of respective ‘‘supply stations’’ andthe logarithm of population size. This implies that the dependence of the number of ‘‘supply stations’’ as afunction of the population size follows a power law.
ARTICLE IN PRESS
Fig. 3. Double-logarithmic representation of (a) the usable electric energy (EE) and (b) the energy delivery to households, both as a
function of the population size of various German cities, after a logarithmic binning method has been applied. The solid lines correspond
to the respective linear regression and the dashed lines indicate the slope 1.
Table 1
Scaling exponents and their 95% confidence intervals for different variables of electric energy supply in Germany as a function of
population size
Variable Exponent 95% confidence interval
Usable electric energy 1.1 [1.04; 1.13]
Electric energy delivery to households 1.0 [0.96; 1.06]
Length of low-voltage cables 0.9 [0.81; 0.92]
C. Kuhnert et al. / Physica A 363 (2006) 96–103100
5. Summary and discussion
In this paper, we have analyzed empirical data of urban supply systems. When the number of‘‘supply stations’’ is fitted as a function of the population size, one can find power-law distributions forquantities as different as electrical energy, petrol stations, car dealers, hospitals, hospital beds, post offices,pharmacies, doctors, and restaurants. For several European countries, the corresponding power-lawexponents and their 95% confidence intervals are summarized in Fig. 2. No data were displayed, if thedata sample were too small, not representative, or if the presumptions of the respective statistical tests wereviolated.
Despite the width of the confidence intervals, one can draw several interesting conclusions:
1.
The scaling exponents of different countries were consistent, i.e., of the same order. In fact, the 95%confidence intervals tend to have a common subset, which may be used for a more precise determination ofthe respective scaling exponent, if universality (i.e., country-independence) is assumed. Statistical analysisof variance tests support this picture.2.
A proportionality of the number of ‘‘supply stations’’ to the population size corresponding to a scalingexponent of 1 is only found for some supply systems. This includes hospitals and hospital beds, post offices,and pharmacies.3.
There were also cases of sub- or superlinear relationships. For example, the scaling exponents for thenumber of car dealers and petrol stations were smaller than 1 (sublinear case), while the scaling exponentfor restaurants was larger than 1 (superlinear case).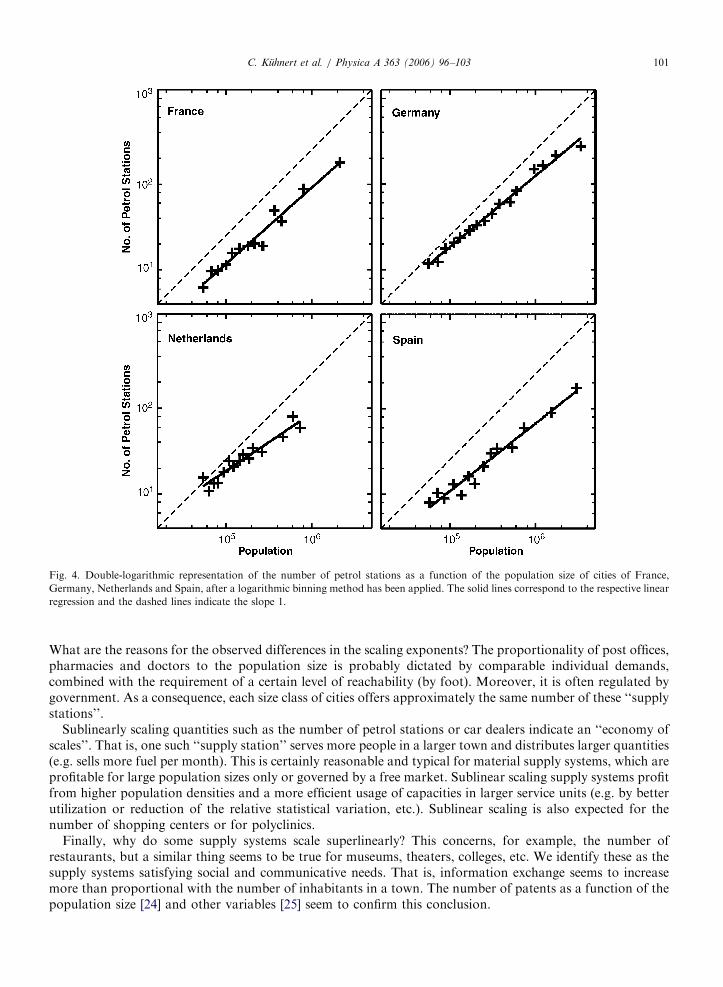
ARTICLE IN PRESS
Fig. 4. Double-logarithmic representation of the number of petrol stations as a function of the population size of cities of France,
Germany, Netherlands and Spain, after a logarithmic binning method has been applied. The solid lines correspond to the respective linear
regression and the dashed lines indicate the slope 1.
C. Kuhnert et al. / Physica A 363 (2006) 96–103 101
What are the reasons for the observed differences in the scaling exponents? The proportionality of post offices,pharmacies and doctors to the population size is probably dictated by comparable individual demands,combined with the requirement of a certain level of reachability (by foot). Moreover, it is often regulated bygovernment. As a consequence, each size class of cities offers approximately the same number of these ‘‘supplystations’’.
Sublinearly scaling quantities such as the number of petrol stations or car dealers indicate an ‘‘economy ofscales’’. That is, one such ‘‘supply station’’ serves more people in a larger town and distributes larger quantities(e.g. sells more fuel per month). This is certainly reasonable and typical for material supply systems, which areprofitable for large population sizes only or governed by a free market. Sublinear scaling supply systems profitfrom higher population densities and a more efficient usage of capacities in larger service units (e.g. by betterutilization or reduction of the relative statistical variation, etc.). Sublinear scaling is also expected for thenumber of shopping centers or for polyclinics.
Finally, why do some supply systems scale superlinearly? This concerns, for example, the number ofrestaurants, but a similar thing seems to be true for museums, theaters, colleges, etc. We identify these as thesupply systems satisfying social and communicative needs. That is, information exchange seems to increasemore than proportional with the number of inhabitants in a town. The number of patents as a function of thepopulation size [24] and other variables [25] seem to confirm this conclusion.
ARTICLE IN PRESS
Fig. 5. Double-logarithmic representation of the number of post offices as a function of the population size of cities in France, Germany,
Great Britain and Spain, after a logarithmic binning method has been applied. The solid lines correspond to the respective linear regression
and the dashed lines indicate the slope 1.
Fig. 6. Double-logarithmic representation of the number of restaurants as a function of the population size of cities of Italy and
Netherlands, after a logarithmic binning method has been applied. The solid lines correspond to the respective linear regression and the
dashed lines indicate the slope 1.
C. Kuhnert et al. / Physica A 363 (2006) 96–103102
ARTICLE IN PRESSC. Kuhnert et al. / Physica A 363 (2006) 96–103 103
Acknowledgments
This study has been partially supported by the EU project ISCOM and the DFG project He2789/5-1. Theauthors would like to thank Luis Bettencourt, Jose Lobo, and Denise Pumain for inspiring discussions. Theyare also grateful to the VDEW for the data of the German electricity suppliers. Moreover, they acknowledgethe data evaluation efforts of Markus Winkelmann in a previous stage of this study.
References
[1] E. Ravenstein, The Geographical Magazine III (1876) 173–177, 201–206, 229–233.
[2] G.K. Zipf, Am. Sociol. Rev. 11 (1946) 677.
[3] W. Weidlich, G. Haag (Eds.), Interregional Migration, Springer, Berlin, 1988.
[4] G.K. Zipf, Human Behaviour and the Principle of Least Effort: An Introduction to Human Ecology, Addison-Wesley, Cambridge,
MA, 1949.
[5] J. Steindl, Random Processes and the Growth of Firms, Hafner, New York, 1965.
[6] H. Simon, Biometrika XLII (1955) 425.
[7] F. Schweitzer (Ed.), Self-Organization of Complex Structures: From Individual to Collective Dynamics, Gordon and Breach,
London, 1997.
[8] X. Gabaix, Q. J. Econ. 114 (3) (1999) 739.
[9] R. Gibrat, Les Inegalites Economiques, Librairie du Recueil Sirey, Paris, 1931.
[10] J. Sutton, J. Econ. Lit. XXXV (1997) 40.
[11] W. Christaller, Die zentralen Orte in Suddeutschland, Wissenschaftliche Buchgesellschaft, Darmstadt, 1980.
[12] P. Frankhauser, La Fractalite des Structrures [sic] Urbaines, Anthropos, Paris, 1994.
[13] E. Schaur, Ungeplante Siedlungen/Non-Planned Settlements, Kramer, Stuttgart, 1991.
[14] H.A. Makse, S. Havlin, H.E. Stanley, Nature 377 (1995) 608.
[15] M. Batty, P. Longley, Fractal Cities: A Geometry of Form and Function, Academic Press, London, San Diego, 1994.
[16] J.A. Ho"yst, J. Sienkiewicz, A. Fronczak, P. Fronczak, K. Suchecki, Phys. Stat. Mech. Appl. 351 (2005) 167.
[17] S. Lammer, B. Gehlsen, D. Helbing, Scaling laws in the spatial structure of urban road networks, in this special issue of Physica A.
[18] G.B. West, J.H. Brown, B.J. Enquist, Science 276 (1997) 122.
[19] G.B. West, W.H. Woodruft, J.H. Brown, Proc. Natl. Acad. Sci. USA 99 (2002) 2473.
[20] B.J. Enquist, J.H. Brown, G.B. West, Nature 395 (1998) 163.
[21] Verband der Elektrizitatswirtschaft, Jahresdaten der Stromversorger 2002, VWEW Energieverlag GmbH, Frankfurt am Main,
Heidelberg, 2003.
[22] Statistische Amter des Bundes und der Lander, Statistik lokal. Daten fur die Gemeinden und Kreise Deutschlands (CD-ROM) 2003.
[23] O.B. McManus, A.L. Blatz, K.L. Magleby, Pflugers Arch. Eur. J. Physiol. 410 (1987) 530.
[24] D. Strumsky, J. Lobo, L. Fleming, Santa Fe Institute Working Paper 05-02-004, 2005.
[25] D. Pumain, F. Paulus, C. Vacchiani, J. Lobo, An evolutionary theory for urban scaling laws, Cybergeo, 2005, submitted for
publication.