Embed Size (px)
DESCRIPTION
Scaling factors that relate human health costs to PM 2.5 exposures using available data . David R. Brown Sc.D. Environment and Human Health NESCAUM. COST IN $. PROBABILITY OF A LOSS . COST IN $. PROBABILITY OF A LOSS . TOTAL COST IN $. A. C. B. PROBABILITY OF A LOSS . 2. - PowerPoint PPT Presentation
Citation preview

Scaling factors that relate human health costs to PM 2.5 exposures using available data
David R. Brown Sc.D.Environment and Human Health
NESCAUM

PROBABILITY OF A LOSS
COST IN $

PROBABILITY OF A LOSS
COST IN $

PROBABILITY OF A LOSS
TOTALCOST IN $
AB
C

PROBABILITY OF ASTHMA HOSPITALIZATION in CONNECTICUT
COST IN $
Of ASTHMA
hospitalization 1
2

Available scaling information
• plausible link between the exposures and disease.
• characterization of PM 2.5 exposures • the incidence and prevalence of the
diseases related to PM 2.5 • Size of population at risk

Results from the Harvard Six-cities study: All Cause Mortality Rates most
exposed to least exposed City Fine Particles
• All cause death 1.26 (1.08-1.47)• Lung Cancer 1.37 (0.81-2.31)• Cardio pulmonary 1.37 (1.11-1.68)• Other causes 1.01 (0.79-1.30)• Range of exposure 11-29.6 ug/m3• Dockery, NEJM 1993; 329: 1753-1759

Health actions from exposures of 2 hours or less.
• Peters etal. pm 2.5 & myocardial infarction– 1.48 odds ratio 2 hr after 25ug/m3 increase– 1.69 odds ratio 1 day after 20ug/m3 increase
• Gent etal. Severe asthma & O3, pm 2.5– 35% increase wheeze 1 hr after 50ppb O3 inc.– 47% increase in chest tightness 1 hr after.– 1.24 odds ratio Chest tightness 12-18ug/m3
pm

PM 2.5 New Haven, Hartford and Waterbury (ug/m3)
June daily average
0.0010.0020.0030.0040.0050.0060.0070.00
5/29 6/3 6/8 6/13 6/18 6/23 6/28 7/3

Hourly Fine Aerosol
0
10
20
30
40
50
60
ug/m
3
This 3-month long series of hourly observations would be collapsed to a single value… 9.2 ug/m3… Totally obscuring any “structure” or other “content” within the data set (Carmine Dibattista, CT DEP). (22% of days each year exceed 30 ug/m3 for 6 hours)

Hospitalizations and costs for Connecticut 1998
• 8,264 heart attacks• 9,835 Congestive
heart failures• 3,715 Asthma• 8,352 Chronic
obstructive pulmonary diseases
• $ 15,858 per heart attack
• $9,256 per Congestive heart failure admission
• $ 5,138 per asthma admission
• $ 6,876 per Chronic obstructive pulmonary disease

Adult diesel soot impacts Bridgeport, Stamford Norwalk
• 69 premature deaths• 121 non fatal heart attacks• 1,503 Asthma attacks• 8,820 workdays lost• 46 cases of chronic bronchitiswww.cat.us/projects/diersel

O3 and PM2.5 Non-attainmentOzone and PM 2.5 non-attainment

Number and % of adults and children with specific pre-existing disease conditions living in the northeastern U.S.
Age group and health condition Prevalence rate (%)
Number of persons (millions)
≥18 yrs 31.19 Chronic bronchitis (past 12 months) 3.9 1.22 Hypertension (ever) 17.9 5.58 Heart disease (ever) 10.4 3.24 Diabetes (ever) 6.2 1.93 0-17 yrs 10.13 Respiratory allergies (past 12 months) 12.2 1.24 Asthma (ever) 14.8 1.50 Sinusitis (past 12 months) 14.7 4.58 Asthma (ever) 12.8 3.99
Draft NESCAUM material submitted to EHP/JAWMA

0102030405060708090
100
65 60 55 50 45 40 35 30 25 20
Daily average (98th percentile) PM2.5 (µg/m3)
Popu
latio
n (%
)
12
13
14
15
Annual mean PM2.5 (µg/m3)
Percent of total NESCAUM population that would benefit from compliance with alternative annual/daily PM2.5 standards.
Draft NESCAUM material submitted to EHP/JAWMA
02468
101214161820
15/65 15/40 15/35 15/30 15/25 15/20
Annual/Daily PM2.5 Standards (µg/m3)
Popu
latio
n (%
)
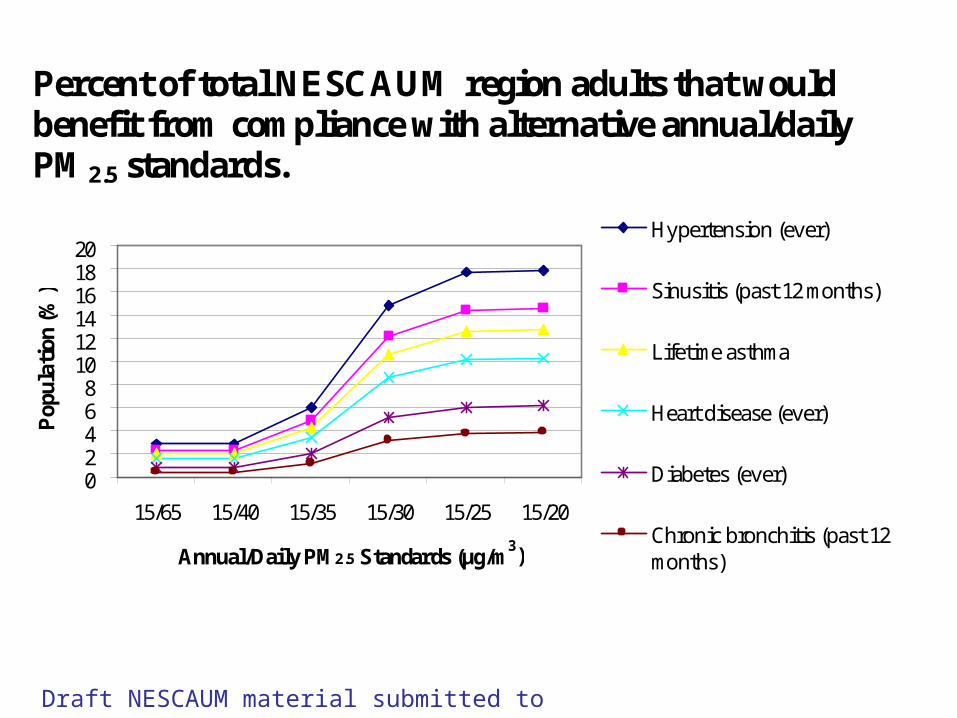
Hypertension (ever)
Sinusitis (past 12 months)
Lifetime asthma
Heart disease (ever)
Diabetes (ever)
Chronic bronchitis (past 12months)
Percent of total NESCAUM region adults that would benefit from compliance with alternative annual/daily PM2.5 standards.
Draft NESCAUM material submitted to EHP/JAWMA

PROBABILITY OF A LOSS
TOTALCOST IN $
AB
C
Scale Y axis.
$ 10’s MM
Scale X axis;
Number of 6 hour episodes that exceed 30 ug/m3

PROBABILITY OF A LOSS
TOTALCOST IN $
AB
C
Scale Y axis.
$ 10’s MM
Scale X axis;
Number of 6 hour episodes that exceed 30 ug/m3
25%10% 20%
$30 MM
Savings
Program costs
RISK 5%

SummaryFour things needed are available,
1) characterization of PM 2.5 exposures, 2) the incidence and prevalence of the
diseases related to PM 2.5, 3) plausible link between the exposures and
disease and, 4) a systematic tool to evaluate practical
policy decisions