Embed Size (px)
Citation preview

Scaling Biomass Measurements for Examining MODIS Derived Vegetation Products
Matthew C. Reeves and Maosheng Zhao
Numerical Terradynamic Simulation GroupUniversity of Montana
Missoula, MT
Objectives…
Part 1: Discuss conversion of plot level biomass measurements to regional scales
Part 2: Characterize effectiveness of MODIS products for monitoring grassland vegetation
Part 1
Scaling Biomass Measurements
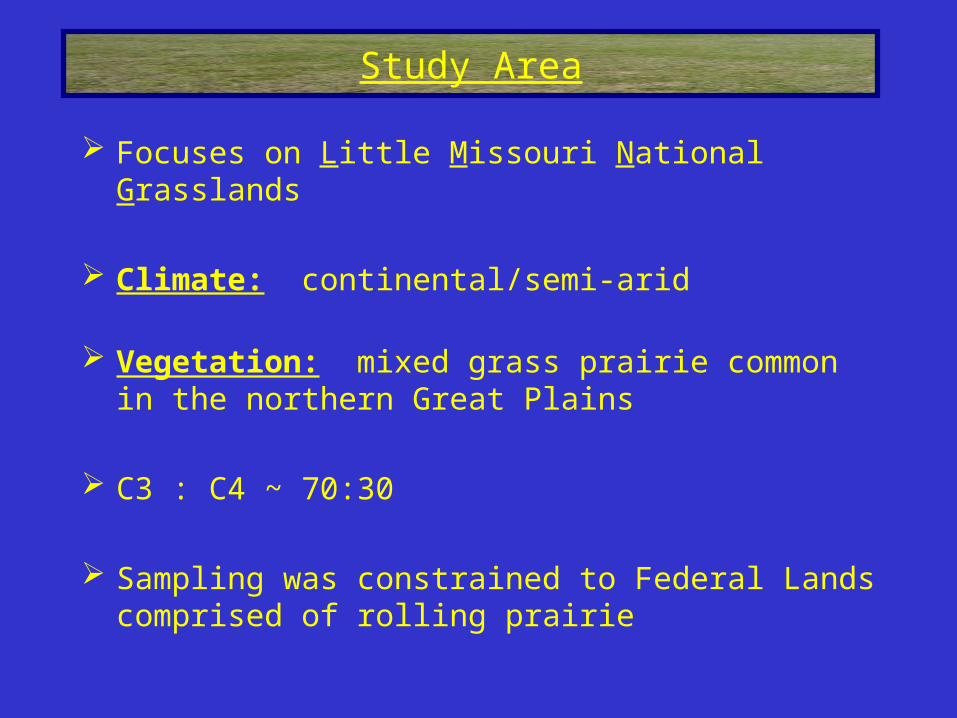
Focuses on Little Missouri National Grasslands
Climate: continental/semi-arid
Vegetation: mixed grass prairie common in the northern Great Plains
C3 : C4 ~ 70:30
Sampling was constrained to Federal Lands comprised of rolling prairie
Study Area

Little Missouri National Grasslands
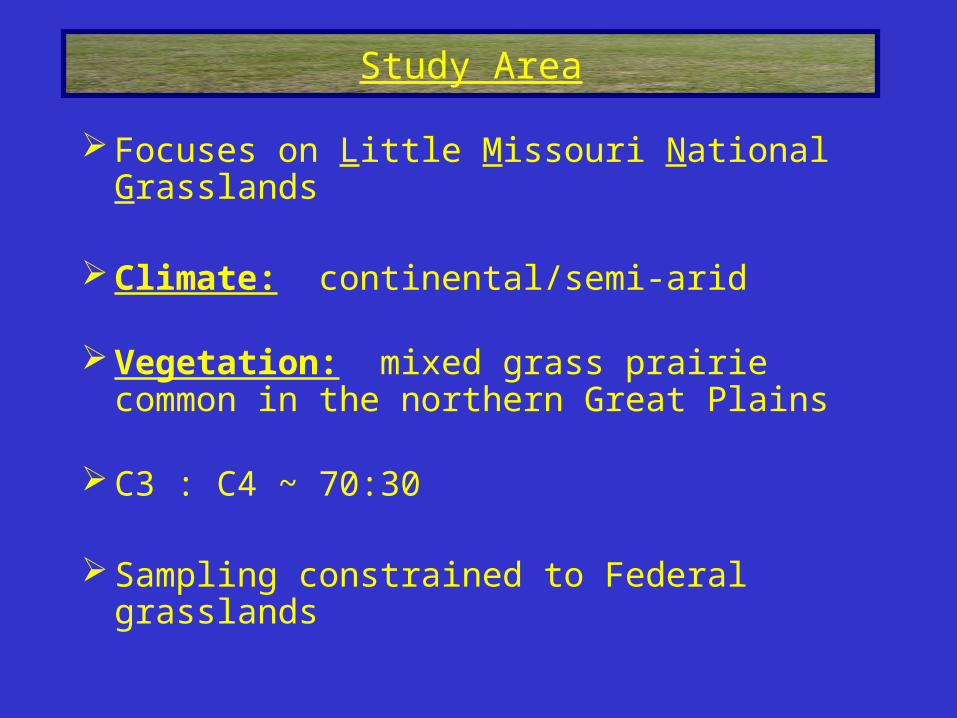
Focuses on Little Missouri National Grasslands
Climate: continental/semi-arid
Vegetation: mixed grass prairie common in the northern Great Plains
C3 : C4 ~ 70:30
Sampling constrained to Federal grasslands
Study Area
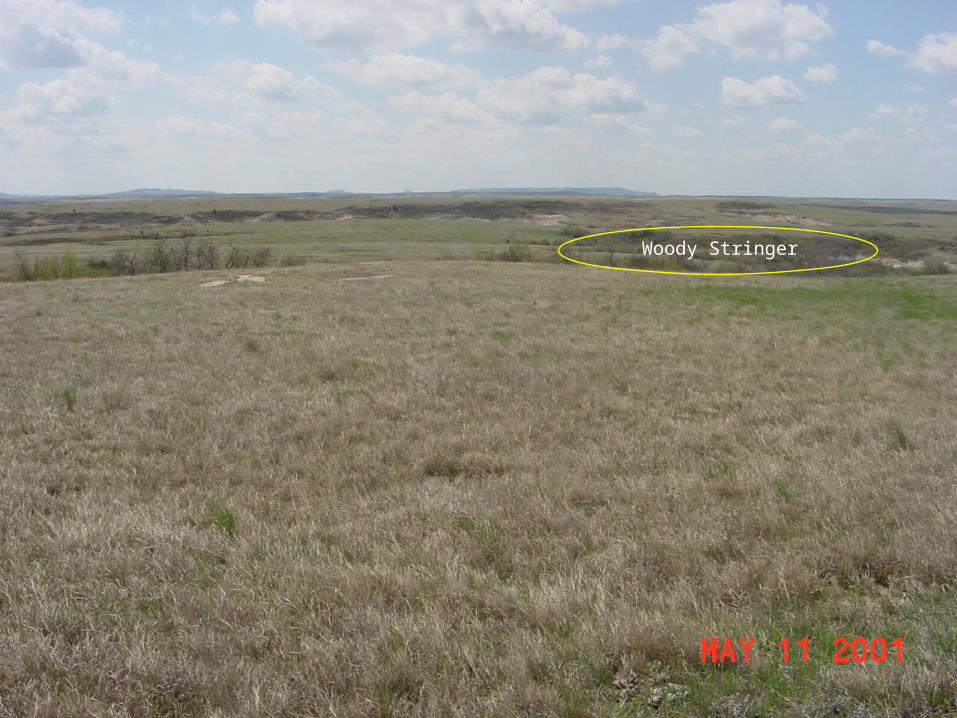
Woody Stringer
Methods…Collecting and Processing Field Measurements
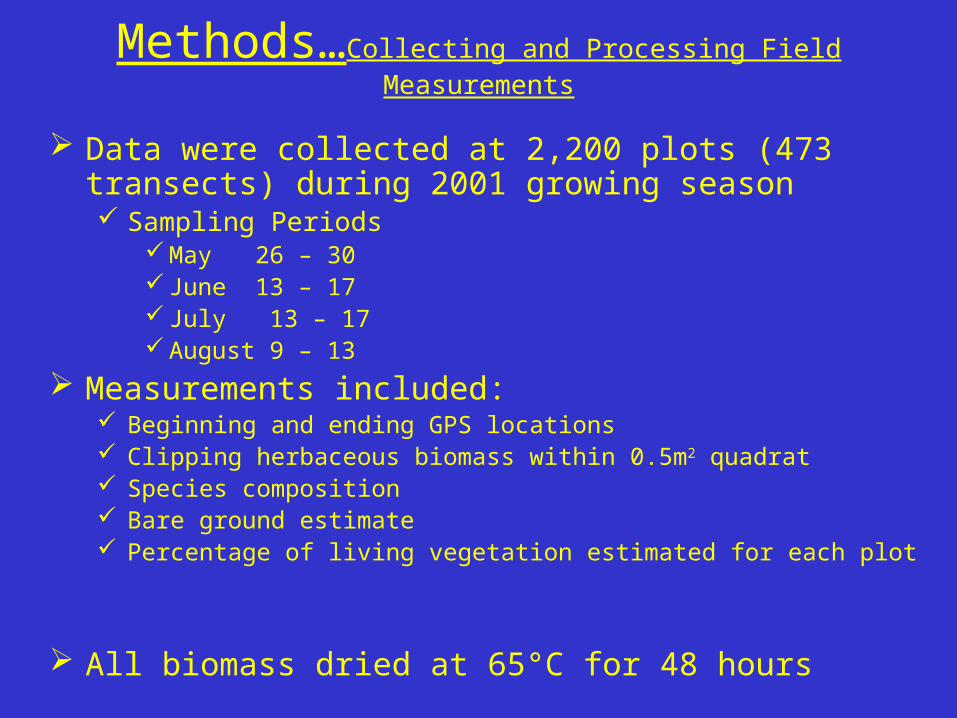
Data were collected at 2,200 plots (473 transects) during 2001 growing season Sampling Periods
May 26 – 30 June 13 – 17 July 13 – 17 August 9 – 13
Measurements included: Beginning and ending GPS locations Clipping herbaceous biomass within 0.5m2 quadrat Species composition Bare ground estimate Percentage of living vegetation estimated for each plot
All biomass dried at 65°C for 48 hours
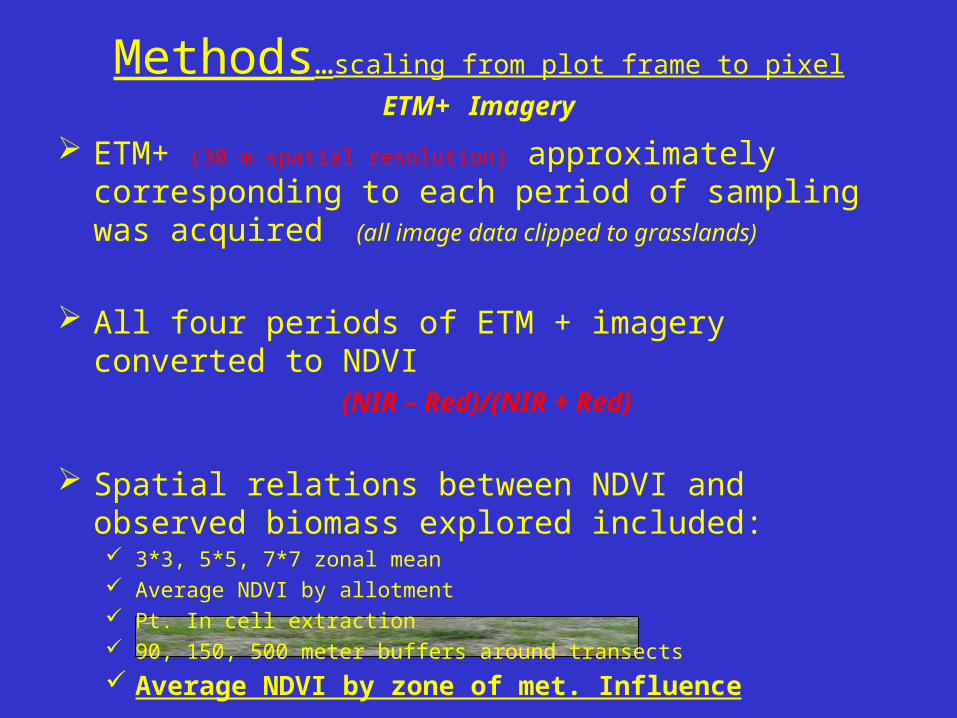
ETM+ (30 m spatial resolution) approximately corresponding to each period of sampling was acquired (all image data clipped to grasslands)
All four periods of ETM + imagery converted to NDVI(NIR – Red)/(NIR + Red)
Spatial relations between NDVI and observed biomass explored included: 3*3, 5*5, 7*7 zonal mean Average NDVI by allotment Pt. In cell extraction 90, 150, 500 meter buffers around transects
Average NDVI by zone of met. Influence
Methods…scaling from plot frame to pixel
ETM+ Imagery
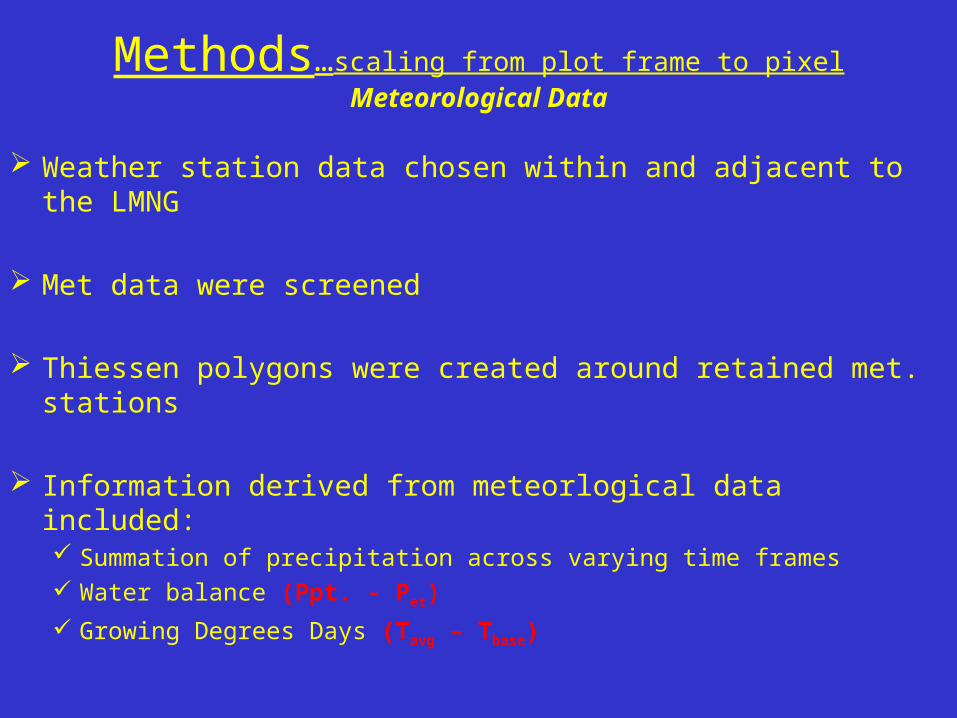
Methods…scaling from plot frame to pixelMeteorological Data
Weather station data chosen within and adjacent to the LMNG
Met data were screened
Thiessen polygons were created around retained met. stations
Information derived from meteorlogical data included: Summation of precipitation across varying time frames Water balance (Ppt. - Pet)
Growing Degrees Days (Tavg – Tbase)
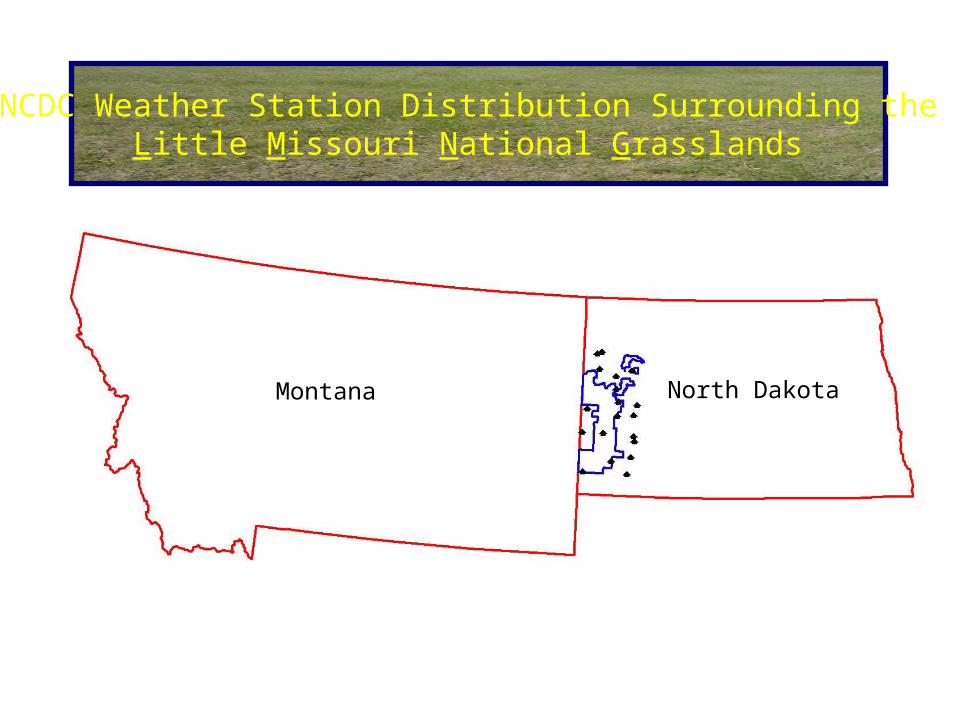
NCDC Weather Station Distribution Surrounding the Little Missouri National Grasslands
Montana North Dakota
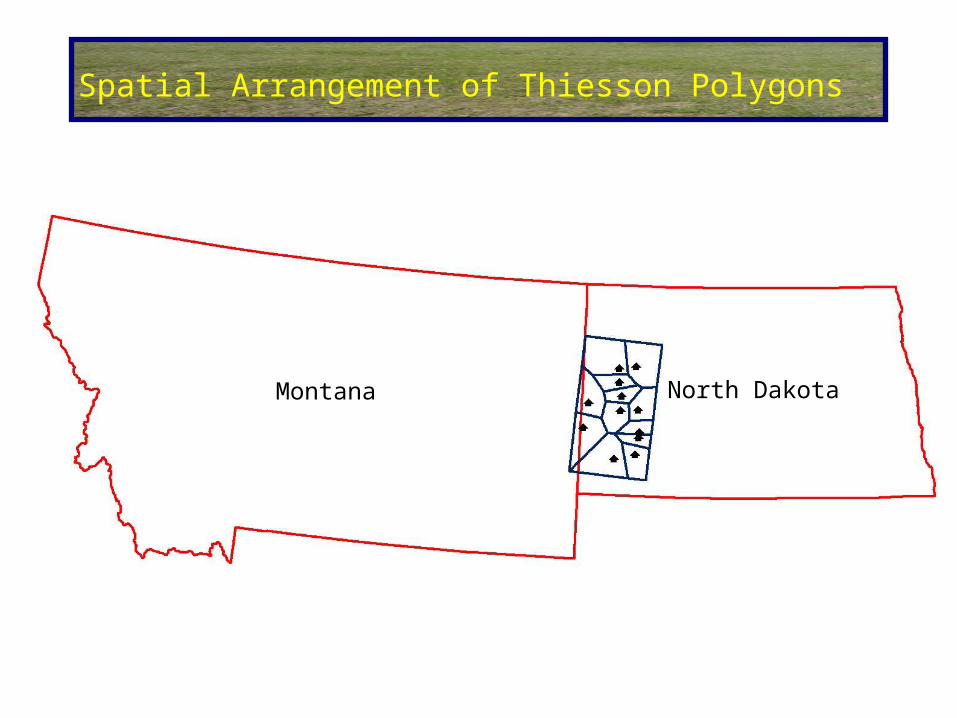
Spatial Arrangement of Thiesson Polygons
Montana North Dakota
Montana North Dakota
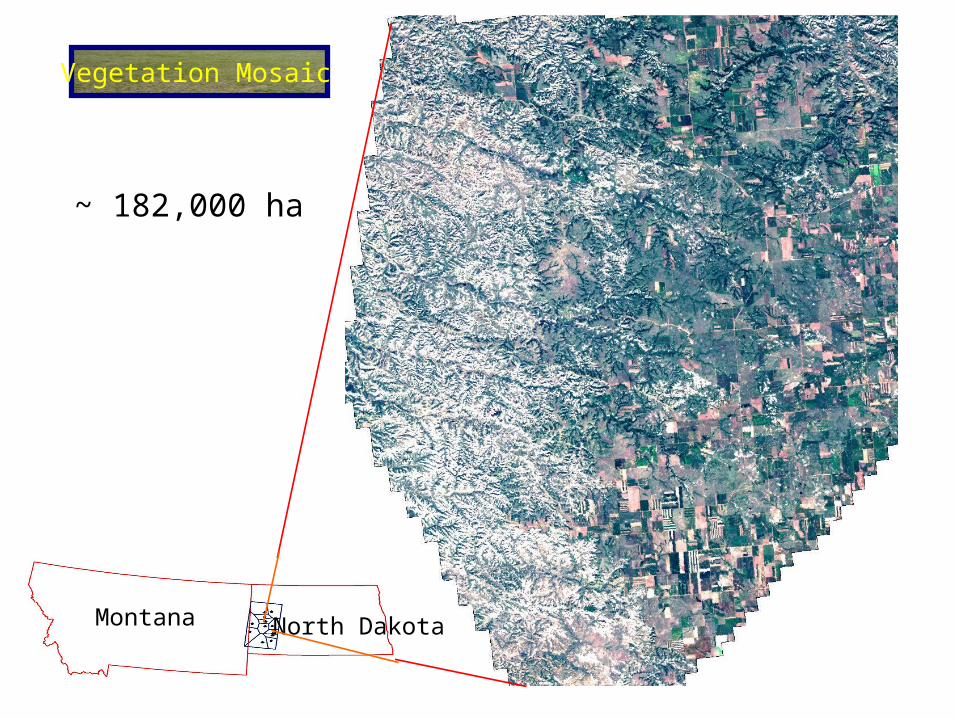
Vegetation Mosaic
~ 182,000 ha
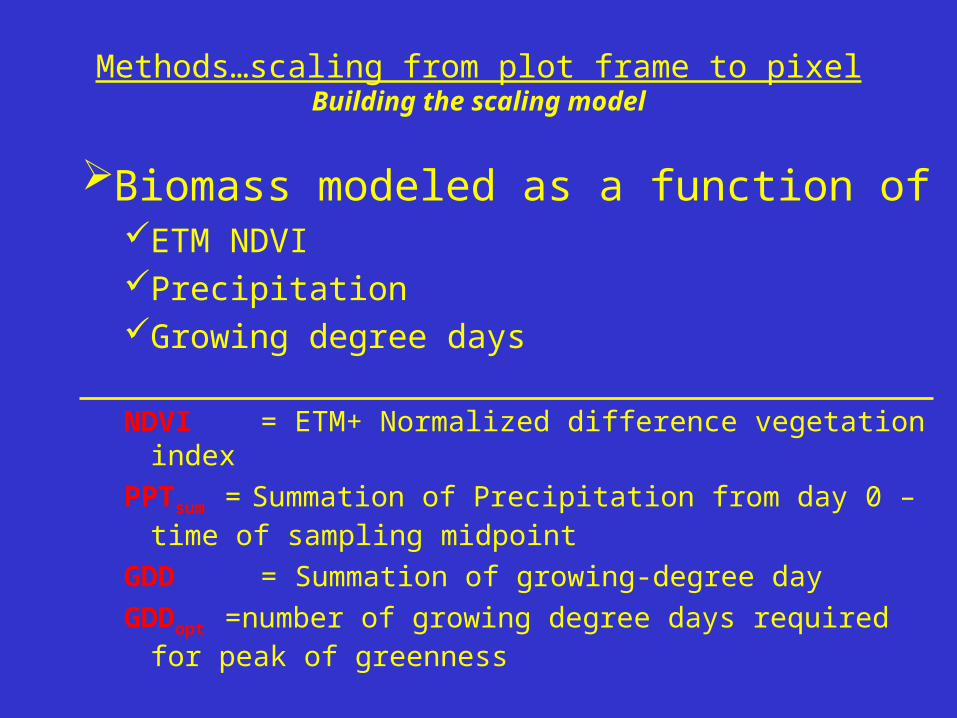
Biomass modeled as a function of ETM NDVIPrecipitation Growing degree days
NDVI = ETM+ Normalized difference vegetation index
PPTsum = Summation of Precipitation from day 0 – time of sampling midpoint
GDD = Summation of growing-degree day
GDDopt =number of growing degree days required for peak of greenness
Methods…scaling from plot frame to pixelBuilding the scaling model
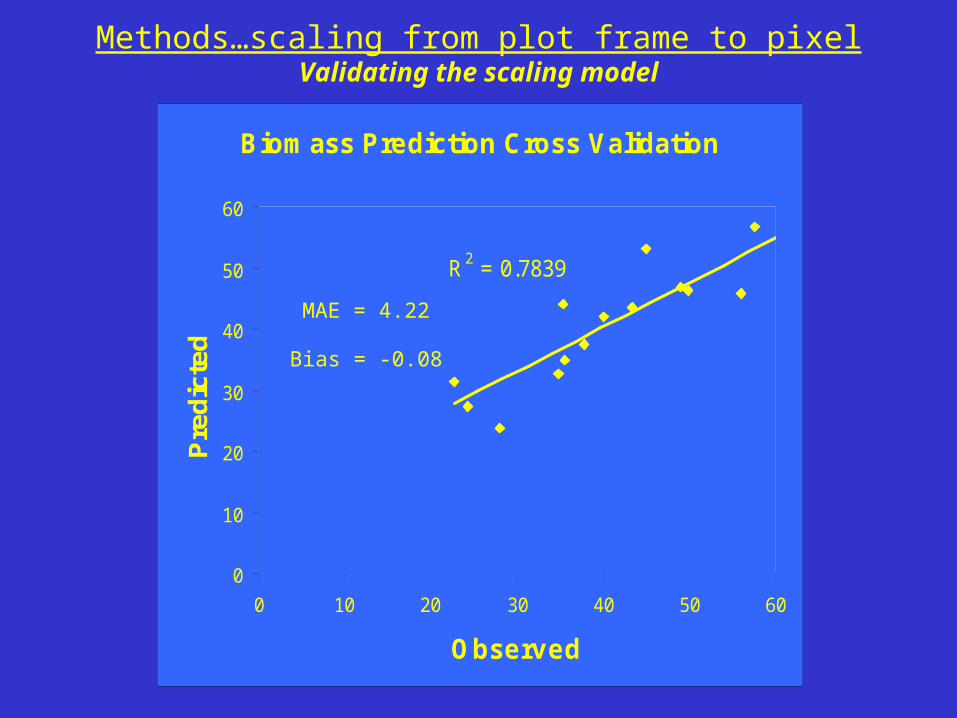
Methods…scaling from plot frame to pixelValidating the scaling model
Biomass Prediction Cross Validation
R2 = 0.7839
0
10
20
30
40
50
60
0 10 20 30 40 50 60
Observed
Pre
dic
ted
MAE = 4.22
Bias = -0.08

Results…Regional Biomass prediction
Mean Biomass in the Little Missouri National Grasslands
550
650
750
850
950
1050
1150
148 167 197 223
Sampling period midpoint
Ab
ov
e g
rou
nd
ph
oto
sy
nth
es
izin
g
(bio
ma
ss
(k
g h
a-1
)
Influence of C4 species
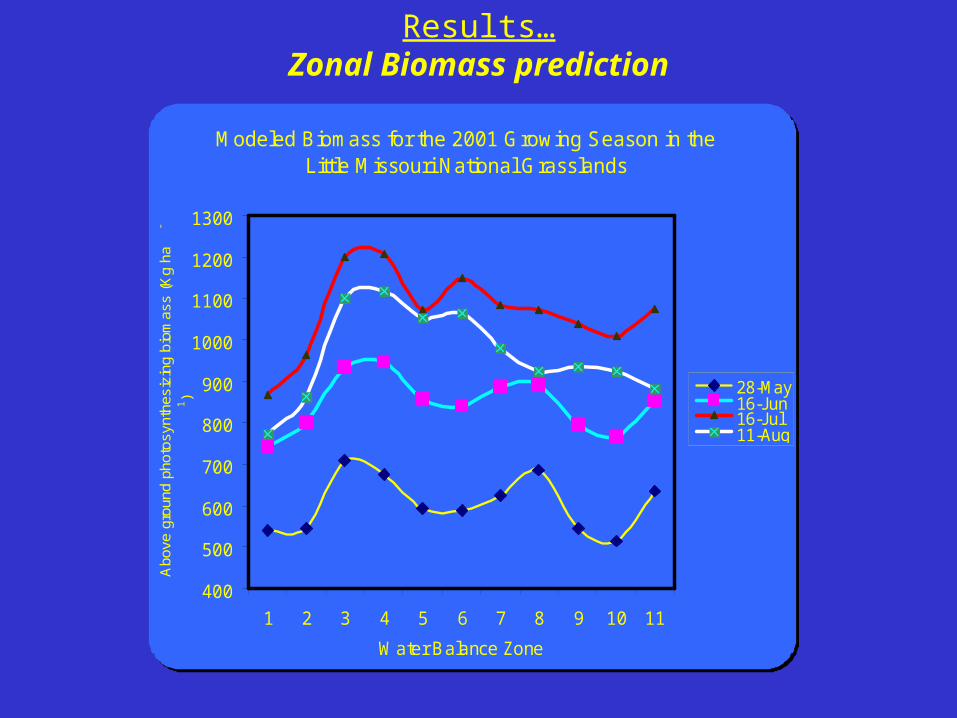
Results…Zonal Biomass prediction
Modeled Biomass for the 2001 Growing Season in the Little Missouri National Grasslands
400
500
600
700
800
900
1000
1100
1200
1300
1 2 3 4 5 6 7 8 9 10 11
Water Balance Zone
Abo
ve g
roun
d ph
otos
ynth
esiz
ing
biom
ass
(Kg
ha-
1 )
28-May16-Jun16-Jul11-Aug
Part 2
Comparing and Characterizing MODIS Data
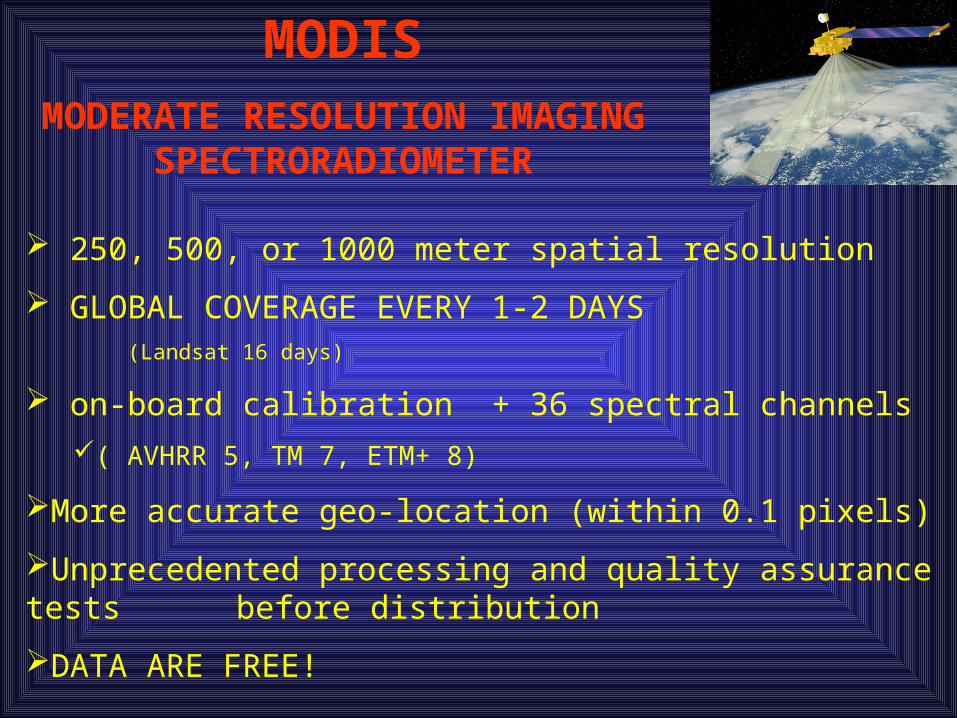
250, 500, or 1000 meter spatial resolution
GLOBAL COVERAGE EVERY 1-2 DAYS (Landsat 16 days)
on-board calibration + 36 spectral channels
( AVHRR 5, TM 7, ETM+ 8)
More accurate geo-location (within 0.1 pixels)
Unprecedented processing and quality assurance tests before distribution
DATA ARE FREE!
MODISMODERATE RESOLUTION IMAGING
SPECTRORADIOMETER
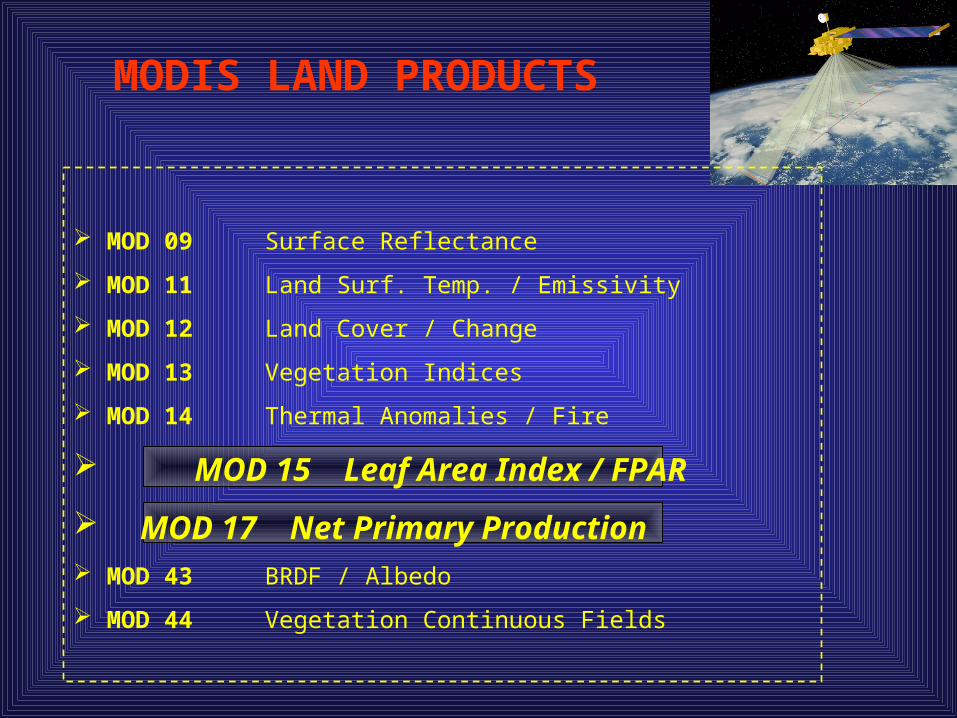
MOD 09 Surface Reflectance
MOD 11 Land Surf. Temp. / Emissivity
MOD 12 Land Cover / Change
MOD 13 Vegetation Indices
MOD 14 Thermal Anomalies / Fire
MOD 15 Leaf Area Index / FPAR
MOD 17 Net Primary Production MOD 43 BRDF / Albedo
MOD 44 Vegetation Continuous Fields
MODIS LAND PRODUCTS
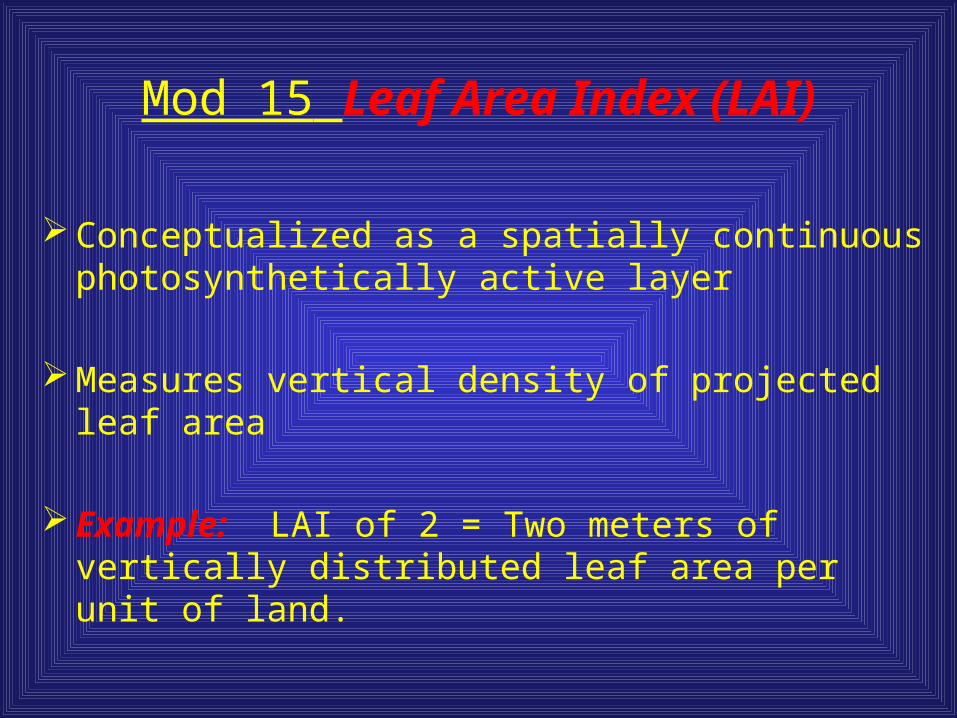
Mod 15 Leaf Area Index (LAI)
Conceptualized as a spatially continuous photosynthetically active layer
Measures vertical density of projected leaf area
Example: LAI of 2 = Two meters of vertically distributed leaf area per unit of land.
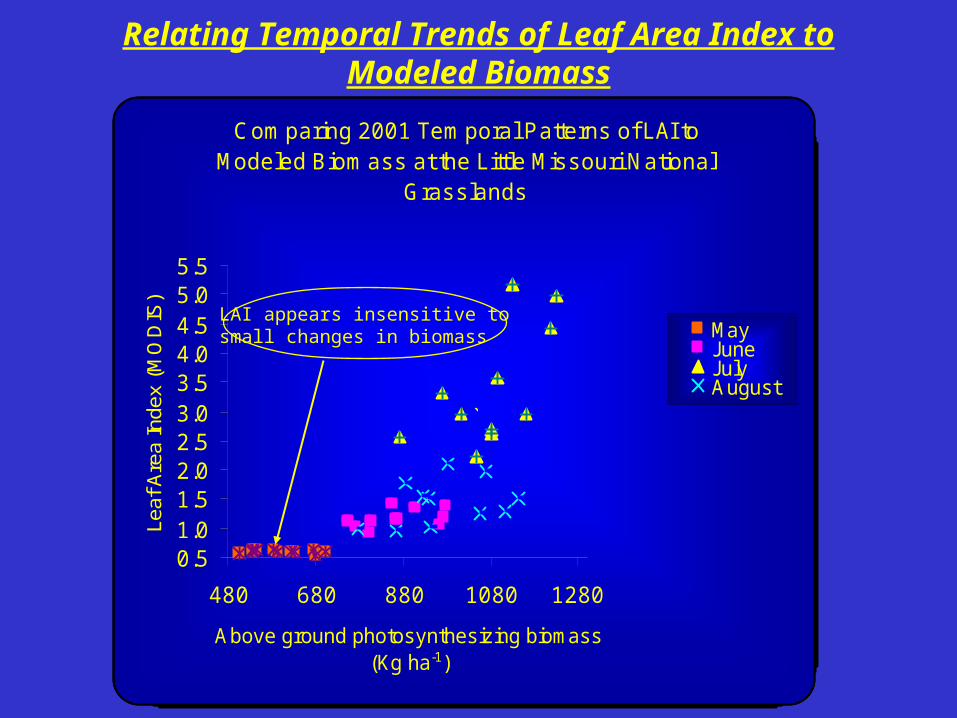
Relating Temporal Trends of Leaf Area Index to Modeled Biomass
Com paring 2001 Tem poral Patterns of LAI to Modeled Biom ass at the Little Missouri National
Grass lands
0.51.01.52.02.53.03.54.04.55.05.5
480 680 880 1080 1280
Above ground photosynthesizing biomass (Kg ha-1)
Leaf
Are
a In
dex
(MO
DIS
)
MayJuneJulyAugust``
`
LAI appears insensitive to small changes in biomass
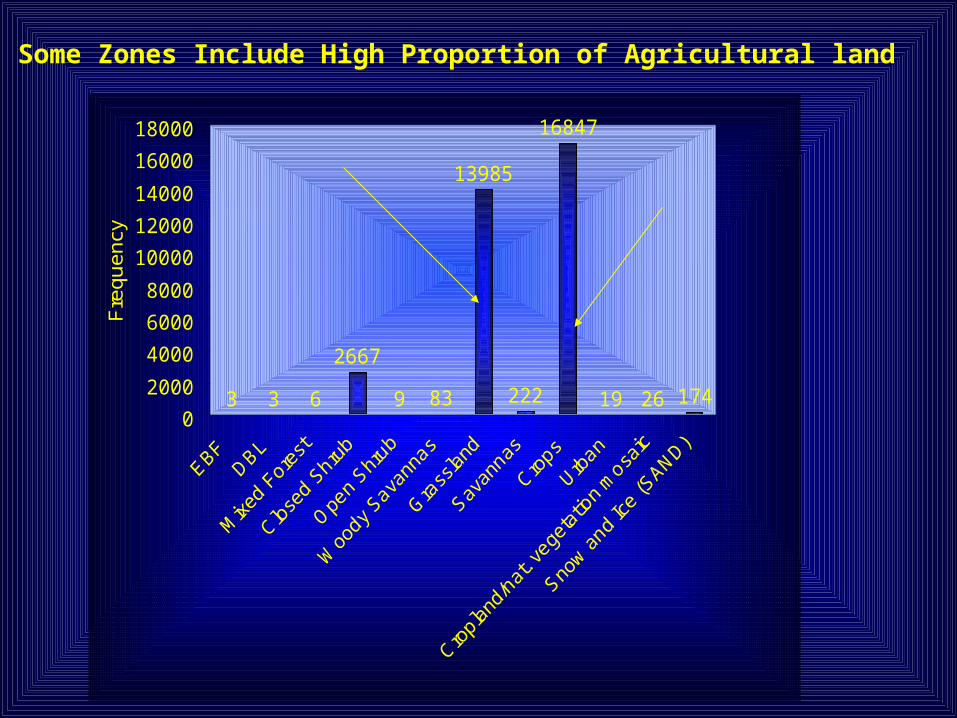
3 3 6
2667
9 83
13985
222
16847
19 26 1740
2000
4000
6000
8000
10000
12000
14000
16000
18000F
req
ue
ncy
Some Zones Include High Proportion of Agricultural land
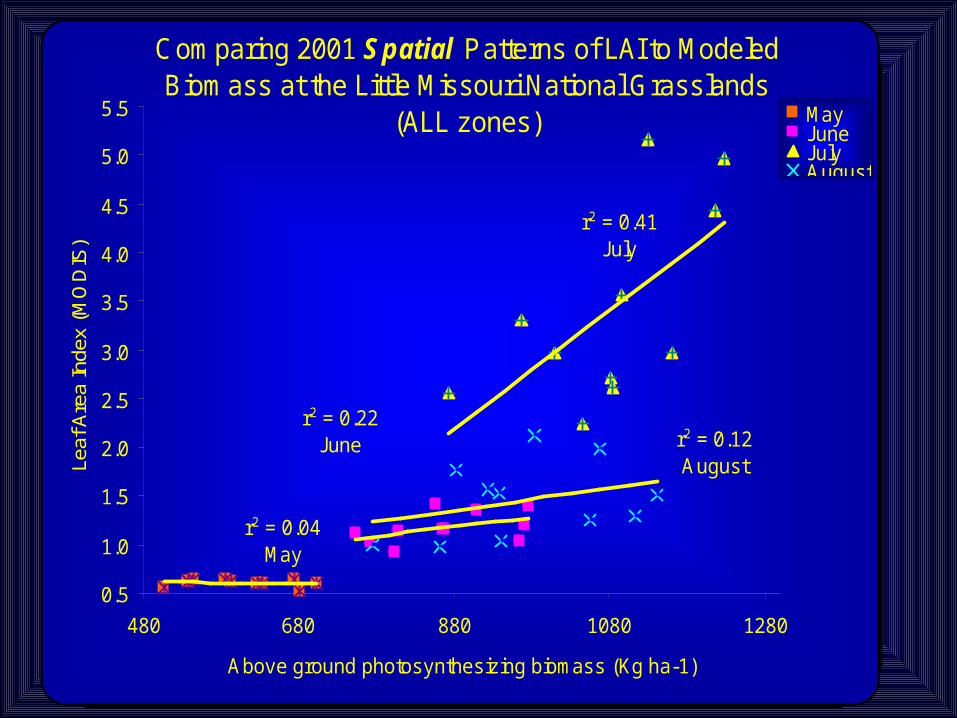
Comparing 2001 Spatial Patterns of LAI to Modeled Biomass at the Little Missouri National Grasslands
(ALL zones)
r2 = 0.04May
r2 = 0.22June r2 = 0.12
August
r2 = 0.41July
0.5
1.0
1.5
2.0
2.5
3.0
3.5
4.0
4.5
5.0
5.5
480 680 880 1080 1280
Above ground photosynthesizing biomass (Kg ha-1)
Leaf
Are
a In
dex
(MO
DIS
)
MayJuneJulyAugust
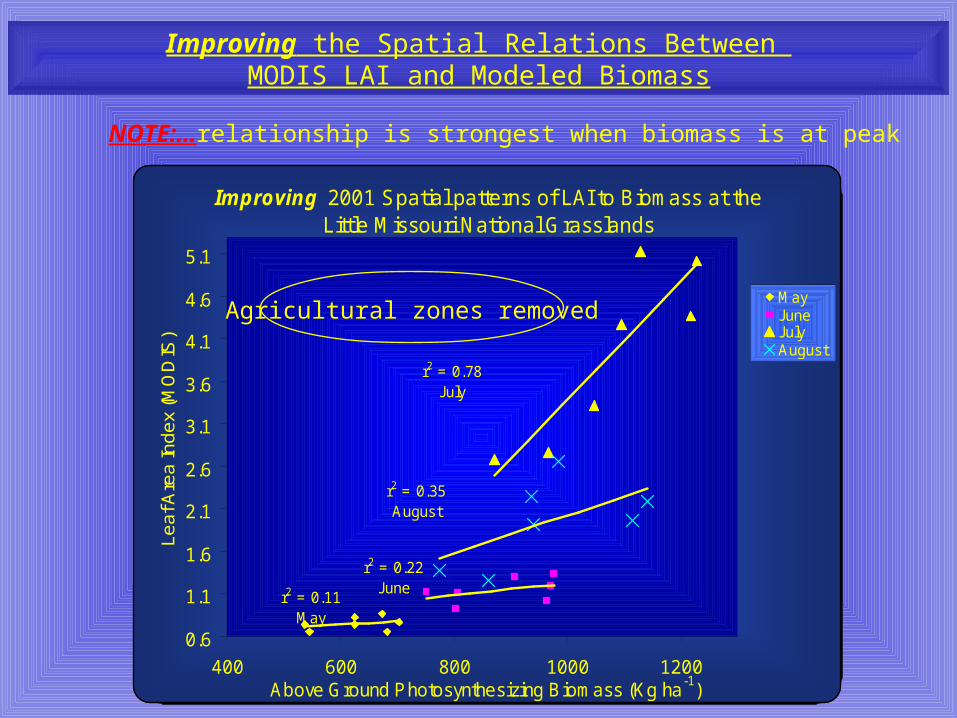
Improving the Spatial Relations Between MODIS LAI and Modeled Biomass
Improving 2001 Spatial patterns of LAI to Biomass at the Little Missouri National Grasslands
r2 = 0.78July
r2 = 0.35August
r2 = 0.22June
r2 = 0.11May
0.6
1.1
1.6
2.1
2.6
3.1
3.6
4.1
4.6
5.1
400 600 800 1000 1200Above Ground Photosynthesizing Biomass (Kg ha -1)
Le
af A
rea
Ind
ex
(MO
DIS
)
MayJuneJulyAugust
Agricultural zones removed
NOTE:…relationship is strongest when biomass is at peak
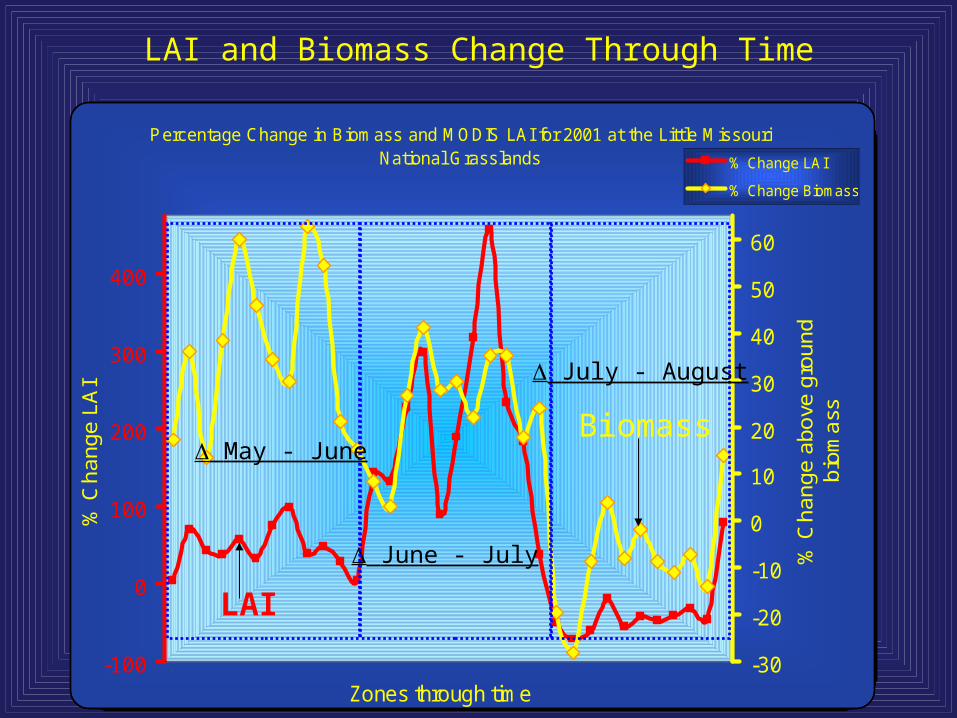
LAI and Biomass Change Through Time
Percentage Change in Biomass and MODIS LAI for 2001 at the Little Missouri National Grasslands
-100
0
100
200
300
400
1
Zones through time
% C
ha
ng
e L
AI
-30
-20
-10
0
10
20
30
40
50
60
% C
ha
ng
e a
bo
ve g
rou
nd
b
iom
ass
% Change LAI
% Change Biomass
May - June
June - July
July - August
LAI
Biomass
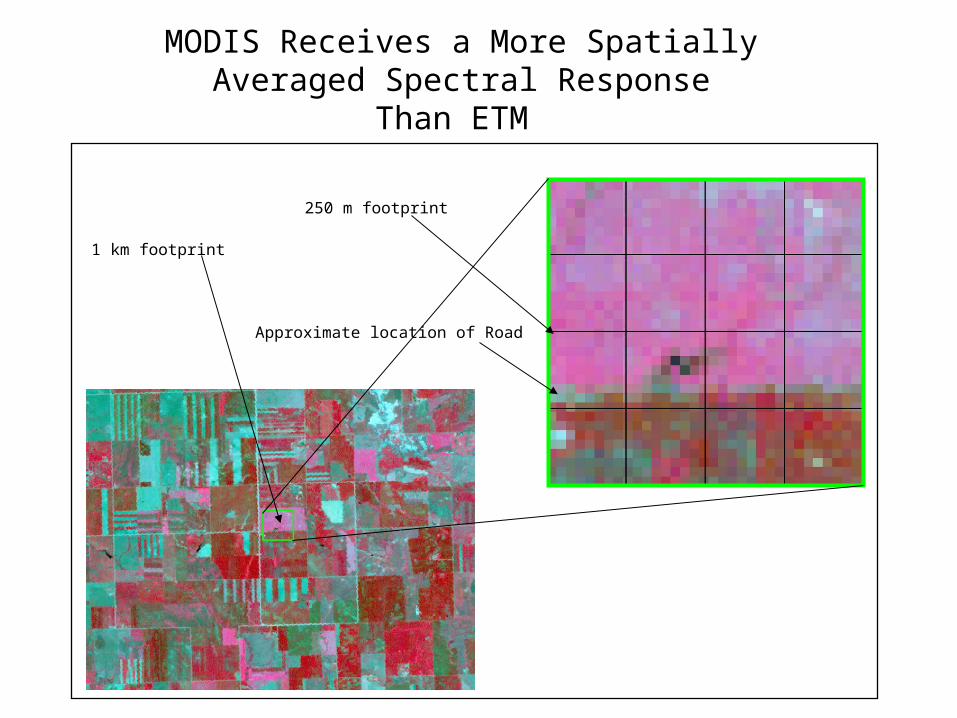
250 m footprint
1 km footprint
Approximate location of Road
MODIS Receives a More Spatially Averaged Spectral Response
Than ETM

Conclusions
1. Reliable conversion of plot level measurements to landscape scales possible
2. Spatial patterns of MODIS LAI are tightly linked with biomass
3. Temporal Trajectory of LAI with biomass is reliable
4. Comparing LAI with biomass is inherently difficult
5. Success of smaller regional studies depends on: intimate local knowledge Relatively large differences in biomass in a given time frame