Embed Size (px)
Citation preview
Scaling and Warping in Time Series Querying
Dear Reader: This file contains larger, full color versions of the images in “Scaling and Warping in Time Series Querying”. In addition, there are some extra experiments which we could not fit into the paper.
0 10 20 30 40 50 60 70 80
Euclidean
DTW
Uniform Scaling
SWM
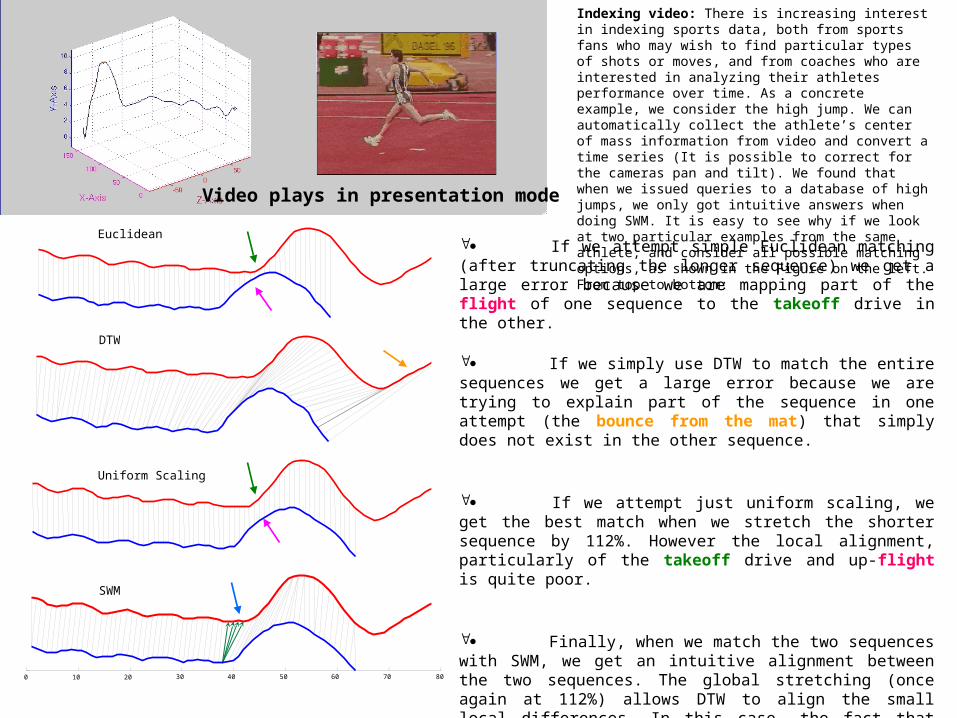
If we attempt simple Euclidean matching (after truncating the longer sequence) we get a large error because we are mapping part of the flight of one sequence to the takeoff drive in the other.
If we simply use DTW to match the entire sequences we get a large error because we are trying to explain part of the sequence in one attempt (the bounce from the mat) that simply does not exist in the other sequence.
If we attempt just uniform scaling, we get the best match when we stretch the shorter sequence by 112%. However the local alignment, particularly of the takeoff drive and up-flight is quite poor.
Finally, when we match the two sequences with SWM, we get an intuitive alignment between the two sequences. The global stretching (once again at 112%) allows DTW to align the small local differences. In this case, the fact that DTW needed to map a single point on time series onto 4 points in the other time series suggests an important local difference in one of these sequences. Inspection of the original videos suggest that the athlete misjudged his approach and attempted a clumsy correction just before his takeoff drive.
Indexing video: There is increasing interest in indexing sports data, both from sports fans who may wish to find particular types of shots or moves, and from coaches who are interested in analyzing their athletes performance over time. As a concrete example, we consider the high jump. We can automatically collect the athlete’s center of mass information from video and convert a time series (It is possible to correct for the cameras pan and tilt). We found that when we issued queries to a database of high jumps, we only got intuitive answers when doing SWM. It is easy to see why if we look at two particular examples from the same athlete, and consider all possible matching options, as shown in the Figure on the left. From top to bottom: Video plays in presentation mode
0 20 40 60 80 100 120 140
C = candidatematch
Q = query
0 20 40 60 80 100 120
C
Q (rescaled 1.54 )
0 20 40 60 80 100 120 140
happ
y
happ
y
happ
y
happ
y
birt
h
birt
h
birt
hbirt
h
-day
-day
-day
-day
to
to to you
you
you
dear
----
- C
Q (rescaled 1.40)
140
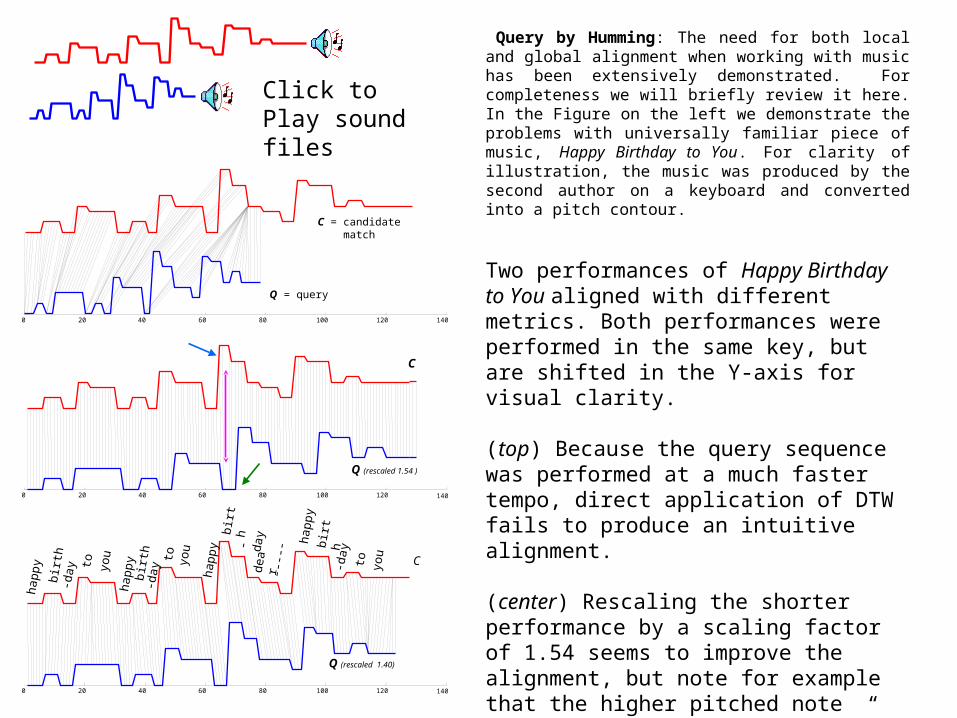
Query by Humming: The need for both local and global alignment when working with music has been extensively demonstrated. For completeness we will briefly review it here. In the Figure on the left we demonstrate the problems with universally familiar piece of music, Happy Birthday to You. For clarity of illustration, the music was produced by the second author on a keyboard and converted into a pitch contour.
Two performances of Happy Birthday to You aligned with different metrics. Both performances were performed in the same key, but are shifted in the Y-axis for visual clarity.
(top) Because the query sequence was performed at a much faster tempo, direct application of DTW fails to produce an intuitive alignment.
(center) Rescaling the shorter performance by a scaling factor of 1.54 seems to improve the alignment, but note for example that the higher pitched note produced on the third “birth..” of the candidate is forced to align with the lower note of the third “happy..” in the query.
(bottom) Only the application of both uniform scaling and DTW produces the correct alignment.
Click to Play sound files
0 50 100 150 200 250-2
0
2
4
6Time series in gray and query in blue
0 50 100 150 200 250-2
-1
0
1
2
3Query, and scaling bounds in green
0 50 100 150 200 250-2
-1
0
1
2
3Time series, and SWM bounds in red
0 50 100 150 200 250-2
0
2
4
6The lower bound!!
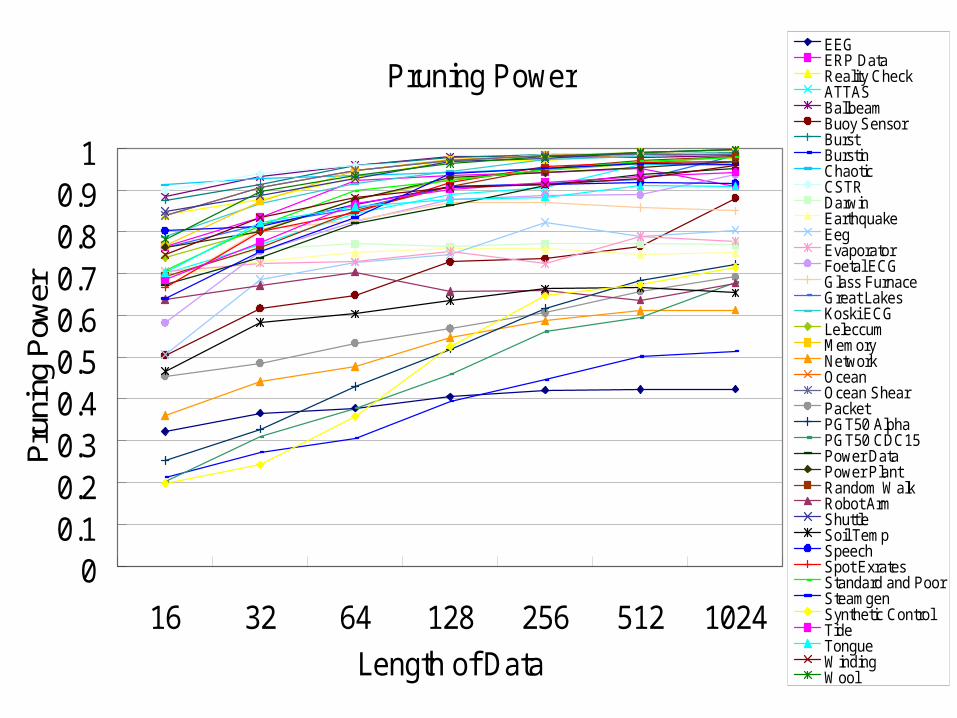
Pruning Power
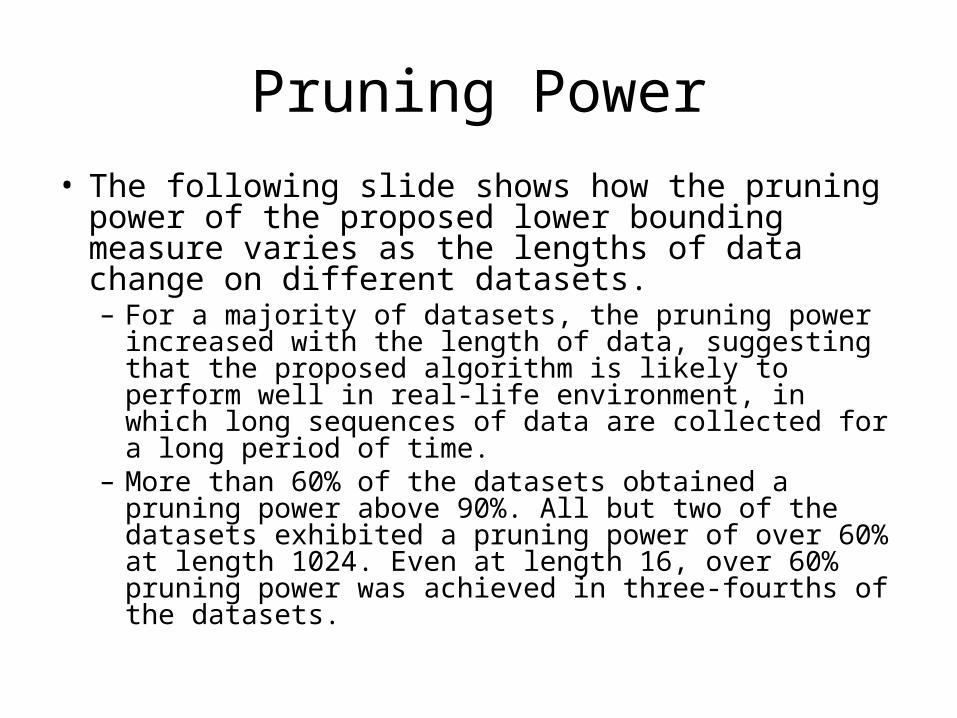
• The following slide shows how the pruning power of the proposed lower bounding measure varies as the lengths of data change on different datasets.– For a majority of datasets, the pruning power
increased with the length of data, suggesting that the proposed algorithm is likely to perform well in real-life environment, in which long sequences of data are collected for a long period of time.
– More than 60% of the datasets obtained a pruning power above 90%. All but two of the datasets exhibited a pruning power of over 60% at length 1024. Even at length 16, over 60% pruning power was achieved in three-fourths of the datasets.
Pruning Power
00.10.20.30.40.50.60.70.80.9
1
16 32 64 128 256 512 1024
Length of Data
Pru
ning
Pow
erEEGERP DataReality CheckATTASBallbeamBuoy SensorBurstBurstinChaoticCSTRDarwinEarthquakeEegEvaporatorFoetal ECGGlass FurnaceGreat LakesKoski ECGLeleccumMemoryNetworkOceanOcean ShearPacketPGT50 AlphaPGT50 CDC15Power DataPower PlantRandom WalkRobot ArmShuttleSoil TempSpeechSpot ExratesStandard and PoorSteamgenSynthetic ControlTideTongueWindingWool
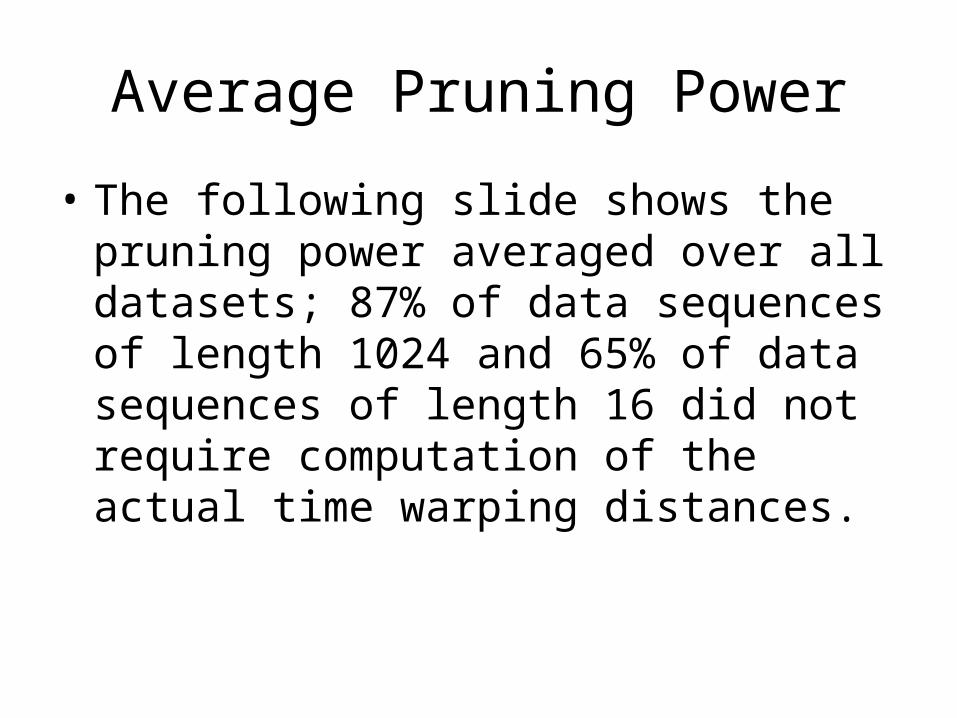
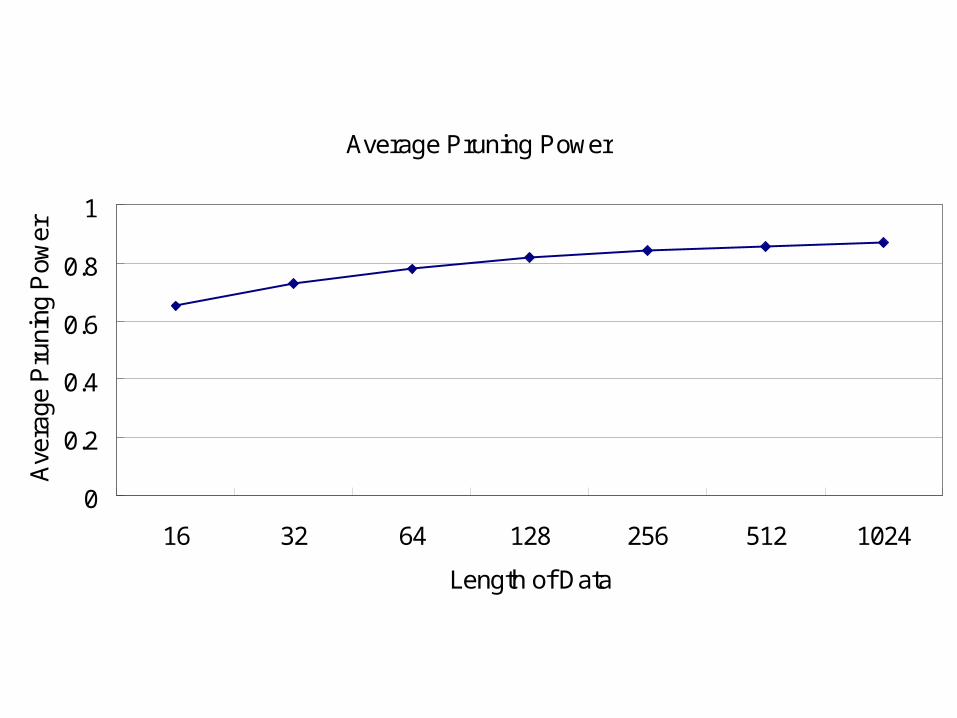
Average Pruning Power
• The following slide shows the pruning power averaged over all datasets; 87% of data sequences of length 1024 and 65% of data sequences of length 16 did not require computation of the actual time warping distances.
Average Pruning Power
0
0.2
0.4
0.6
0.8
1
16 32 64 128 256 512 1024
Length of Data
Ave
rage
Pru
ning
Pow
er
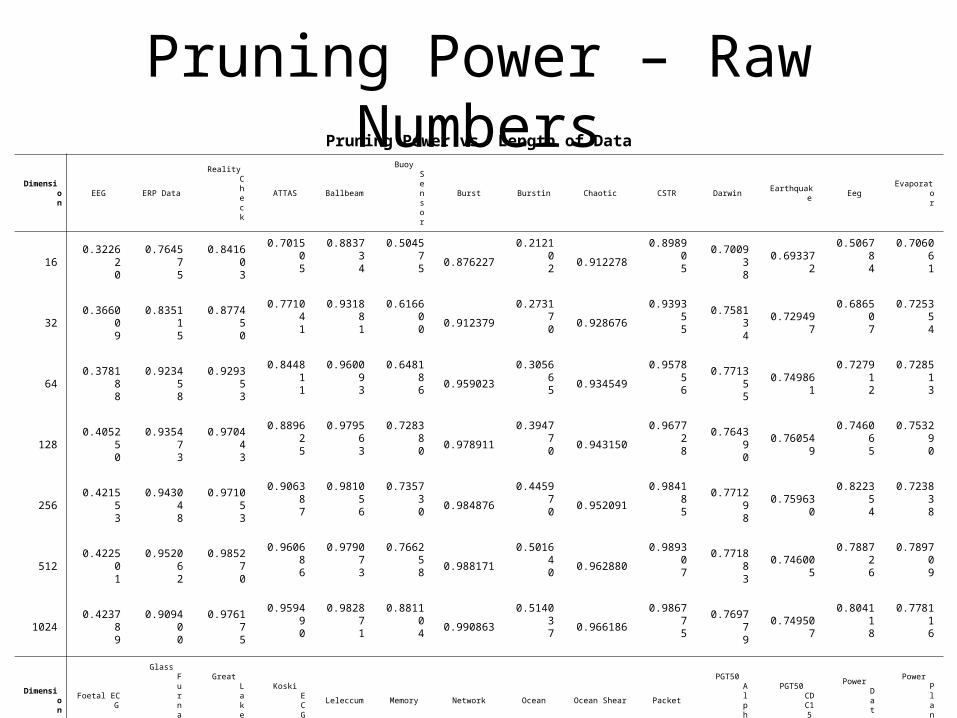
Pruning Power – Raw NumbersPruning Power vs. Length of Data
Dimension
EEG ERP Data
Reality Check
ATTAS Ballbeam
Buoy Sensor
Burst Burstin Chaotic CSTR Darwin Earthquake EegEvaporat
or
160.3226
20
0.764575
0.841603
0.701505
0.883734
0.504575
0.876227
0.212102
0.912278
0.898905
0.700938
0.693372
0.506784
0.706061
320.3660
09
0.835115
0.877450
0.771041
0.931881
0.616600
0.912379
0.273170
0.928676
0.939355
0.758134
0.729497
0.686507
0.725354
640.3781
88
0.923458
0.929353
0.844811
0.960093
0.648186
0.959023
0.305665
0.934549
0.957856
0.771355
0.749861
0.727912
0.728513
1280.4052
50
0.935473
0.970443
0.889625
0.979563
0.728380
0.978911
0.394770
0.943150
0.967728
0.764390
0.760549
0.746065
0.753290
2560.4215
53
0.943048
0.971053
0.906387
0.981056
0.735730
0.984876
0.445970
0.952091
0.984185
0.771298
0.759630
0.822354
0.723838
5120.4225
01
0.952062
0.985270
0.960686
0.979073
0.766258
0.988171
0.501640
0.962880
0.989307
0.771883
0.746005
0.788726
0.789709
10240.4237
89
0.909400
0.976175
0.959490
0.982871
0.881104
0.990863
0.514037
0.966186
0.986775
0.769779
0.749507
0.804118
0.778116
Dimension
Foetal ECG
Glass Furnace
Great Lakes
Koski ECG
Leleccum Memory Network Ocean Ocean Shear Packet
PGT50 Alpha
PGT50 CDC15
Power Data
Power Plant
160.5823
66
0.667292
0.763617
0.788211
0.738788
0.767077
0.361056
0.838729
0.838729
0.454409
0.252942
0.201408
0.673431
0.763441
320.7544
60
0.805286
0.817176
0.868442
0.803527
0.873913
0.441143
0.905589
0.905589
0.485061
0.327846
0.309233
0.737997
0.801387
640.8250
94
0.827233
0.855985
0.914999
0.877705
0.946237
0.478237
0.947321
0.947321
0.533411
0.429885
0.378305
0.820879
0.878095
1280.8779
12
0.870167
0.907650
0.944805
0.924549
0.972812
0.546761
0.970419
0.970419
0.568309
0.519509
0.459351
0.864432
0.929772
2560.8881
85
0.871079
0.916292
0.972940
0.946995
0.983239
0.587142
0.983679
0.983679
0.606108
0.617305
0.561448
0.911212
0.941613
5120.8885
88
0.858204
0.924727
0.981762
0.964394
0.990447
0.612243
0.985778
0.985778
0.657920
0.682724
0.594279
0.937497
0.953994
10240.9372
12
0.850404
0.982488
0.988746
0.980213
0.993886
0.613137
0.986514
0.986514
0.692022
0.721404
0.678522
0.952692
0.969604
Dimension
Random Walk
Robot Arm Shuttle Soil Temp SpeechSpot Exrat
es
Standard & Poo
rSteamgen
Synthetic Control
Tide Tongue Winding Wool Average
160.6930
60
0.638651
0.848837
0.466393
0.802835
0.667351
0.708446
0.640215
0.197165
0.684809
0.702385
0.745298
0.782698
0.653535
320.7627
26
0.672360
0.887582
0.583468
0.813972
0.802003
0.815125
0.753073
0.242413
0.775340
0.821866
0.833679
0.897753
0.728029
640.8522
34
0.703463
0.927370
0.603629
0.865021
0.845587
0.898330
0.834774
0.357602
0.866745
0.860557
0.881309
0.934227
0.778302
1280.9092
91
0.657382
0.969701
0.635959
0.907711
0.917622
0.922461
0.939568
0.525450
0.902781
0.876713
0.905980
0.964483
0.819014
2560.9513
56
0.659780
0.975370
0.663489
0.914221
0.957046
0.950578
0.952791
0.647056
0.918573
0.883266
0.912312
0.980002
0.842435
5120.9717
88
0.636301
0.989539
0.667249
0.917585
0.965179
0.968773
0.963212
0.673337
0.932474
0.910305
0.929074
0.990091
0.857010
10240.9813
49
0.677865
0.996204
0.654225
0.916146
0.968208
0.978736
0.961485
0.714639
0.943143
0.909705
0.957939
0.996061
0.870275
Varying Scaling Factor
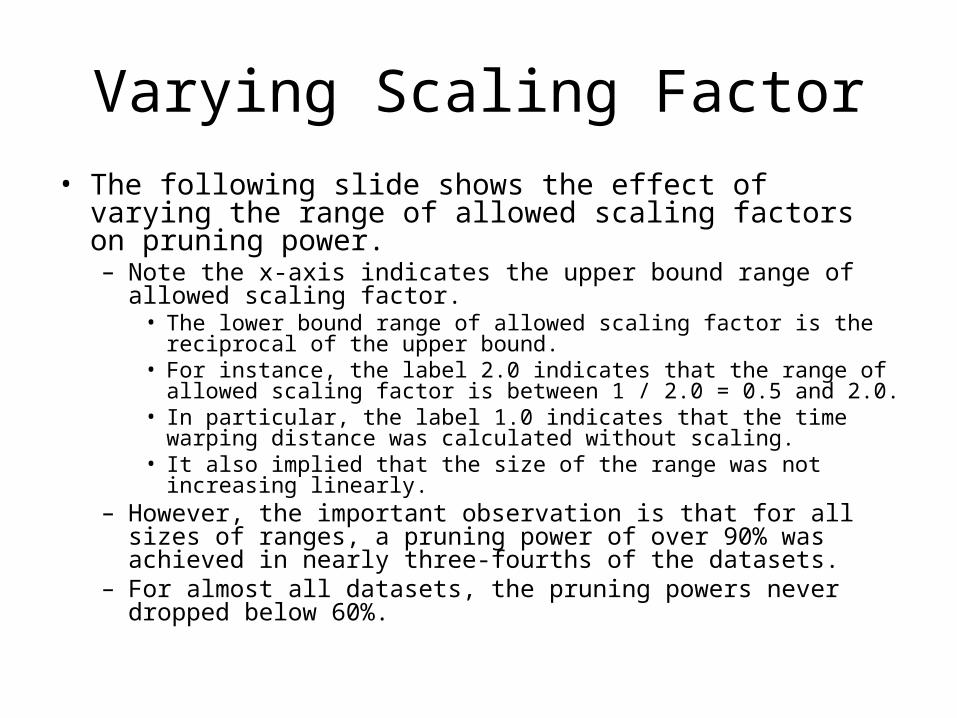
• The following slide shows the effect of varying the range of allowed scaling factors on pruning power.– Note the x-axis indicates the upper bound range of allowed
scaling factor.• The lower bound range of allowed scaling factor is the reciprocal of
the upper bound.• For instance, the label 2.0 indicates that the range of allowed
scaling factor is between 1 / 2.0 = 0.5 and 2.0.• In particular, the label 1.0 indicates that the time warping distance
was calculated without scaling.• It also implied that the size of the range was not increasing linearly.
– However, the important observation is that for all sizes of ranges, a pruning power of over 90% was achieved in nearly three-fourths of the datasets.
– For almost all datasets, the pruning powers never dropped below 60%.
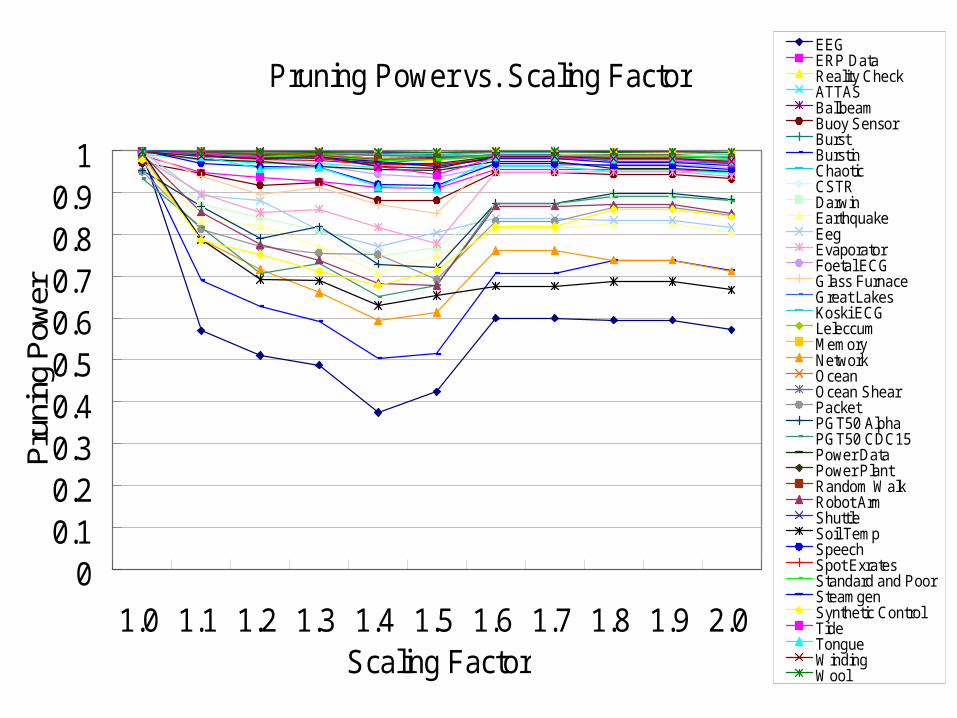
Pruning Power vs. Scaling Factor
00.10.20.30.40.50.60.70.80.9
1
1.0 1.1 1.2 1.3 1.4 1.5 1.6 1.7 1.8 1.9 2.0Scaling Factor
Pru
ning
Pow
erEEGERP DataReality CheckATTASBallbeamBuoy SensorBurstBurstinChaoticCSTRDarwinEarthquakeEegEvaporatorFoetal ECGGlass FurnaceGreat LakesKoski ECGLeleccumMemoryNetworkOceanOcean ShearPacketPGT50 AlphaPGT50 CDC15Power DataPower PlantRandom WalkRobot ArmShuttleSoil TempSpeechSpot ExratesStandard and PoorSteamgenSynthetic ControlTideTongueWindingWool
Varying Scaling Factor
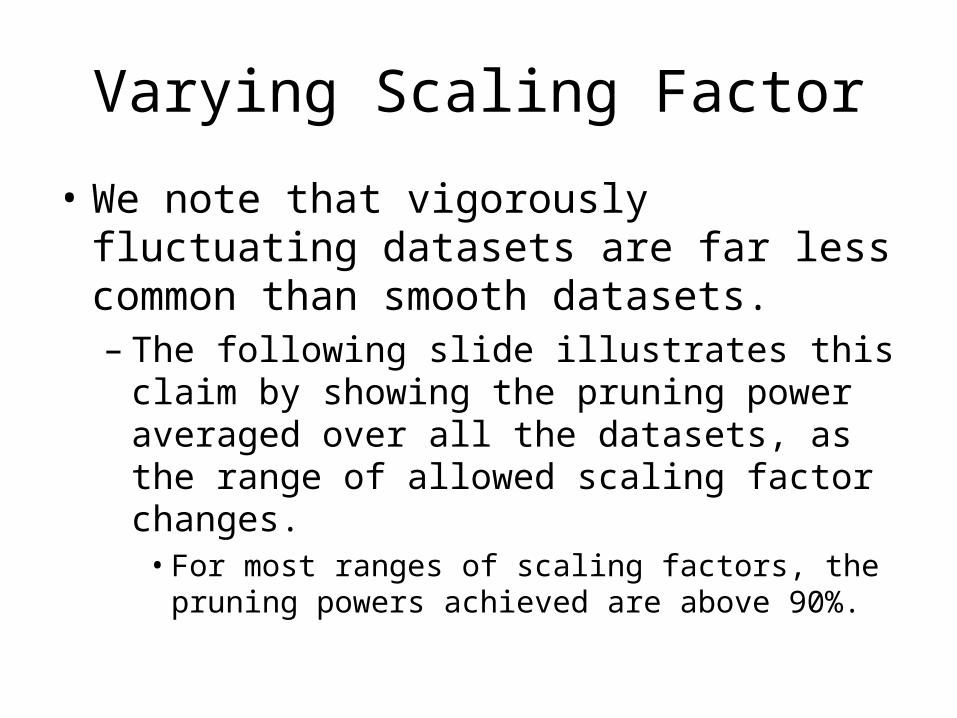
• We note that vigorously fluctuating datasets are far less common than smooth datasets.– The following slide illustrates this claim by
showing the pruning power averaged over all the datasets, as the range of allowed scaling factor changes.
• For most ranges of scaling factors, the pruning powers achieved are above 90%.
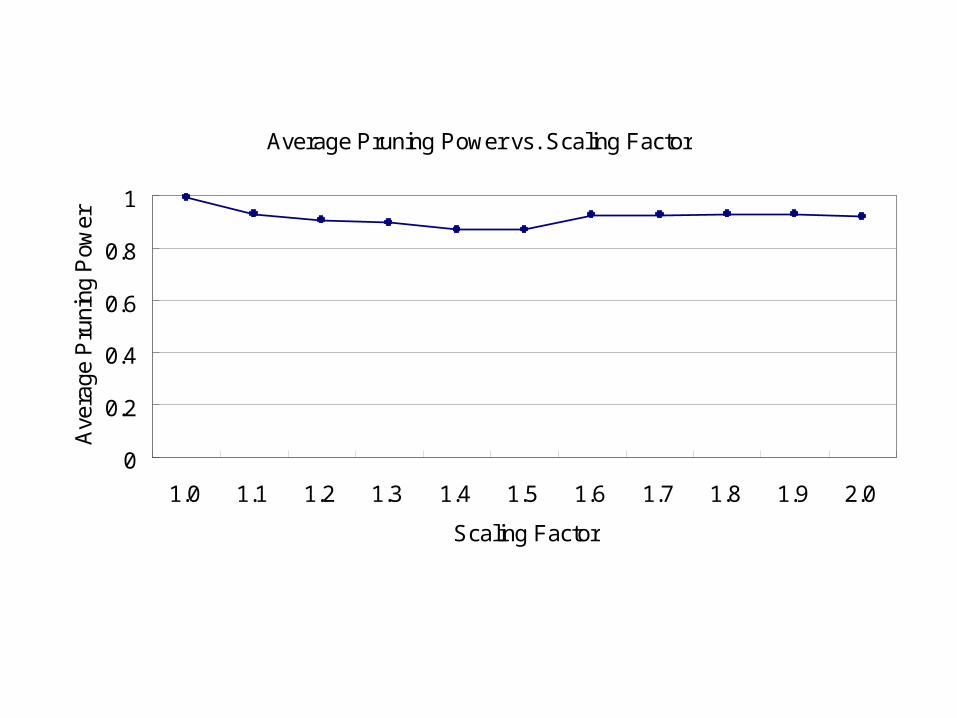
Average Pruning Power vs. Scaling Factor
0
0.2
0.4
0.6
0.8
1
1.0 1.1 1.2 1.3 1.4 1.5 1.6 1.7 1.8 1.9 2.0
Scaling Factor
Ave
rage
Pru
ning
Pow
er
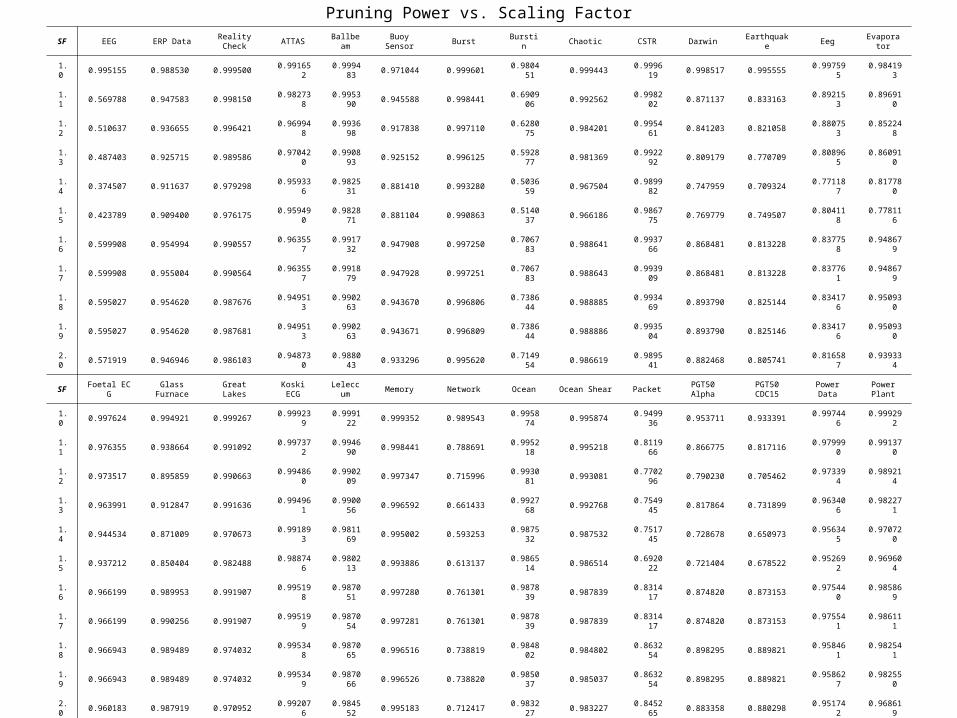
Pruning Power vs. Scaling Factor
SF EEG ERP DataReality Check
ATTASBallbea
mBuoy
SensorBurst Burstin Chaotic CSTR Darwin Earthquake Eeg Evaporat
or
1.0
0.995155 0.988530 0.999500 0.99165
2 0.9994
83 0.971044 0.999601
0.980451
0.999443 0.9996
19 0.998517 0.995555
0.997595
0.984193
1.1
0.569788 0.947583 0.998150 0.98273
8 0.9953
90 0.945588 0.998441
0.690906
0.992562 0.9982
02 0.871137 0.833163
0.892153
0.896910
1.2
0.510637 0.936655 0.996421 0.96994
8 0.9936
98 0.917838 0.997110
0.628075
0.984201 0.9954
61 0.841203 0.821058
0.880753
0.852248
1.3
0.487403 0.925715 0.989586 0.97042
0 0.9908
93 0.925152 0.996125
0.592877
0.981369 0.9922
92 0.809179 0.770709
0.808965
0.860910
1.4
0.374507 0.911637 0.979298 0.95933
6 0.9825
31 0.881410 0.993280
0.503659
0.967504 0.9899
82 0.747959 0.709324
0.771187
0.817780
1.5
0.423789 0.909400 0.976175 0.95949
0 0.9828
71 0.881104 0.990863
0.514037
0.966186 0.9867
75 0.769779 0.749507
0.804118
0.778116
1.6
0.599908 0.954994 0.990557 0.96355
7 0.9917
32 0.947908 0.997250
0.706783
0.988641 0.9937
66 0.868481 0.813228
0.837758
0.948679
1.7
0.599908 0.955004 0.990564 0.96355
7 0.9918
79 0.947928 0.997251
0.706783
0.988643 0.9939
09 0.868481 0.813228
0.837761
0.948679
1.8
0.595027 0.954620 0.987676 0.94951
3 0.9902
63 0.943670 0.996806
0.738644
0.988885 0.9934
69 0.893790 0.825144
0.834176
0.950930
1.9
0.595027 0.954620 0.987681 0.94951
3 0.9902
63 0.943671 0.996809
0.738644
0.988886 0.9935
04 0.893790 0.825146
0.834176
0.950930
2.0
0.571919 0.946946 0.986103 0.94873
0 0.9880
43 0.933296 0.995620
0.714954
0.986619 0.9895
41 0.882468 0.805741
0.816587
0.939334
SF Foetal ECG Glass Furnace
Great Lakes
Koski ECG
Leleccum Memory Network Ocean Ocean Shear Packet
PGT50 Alpha
PGT50 CDC15
Power Data
Power Plant
1.0
0.997624 0.994921 0.999267 0.99923
9 0.9991
22 0.999352 0.989543
0.995874
0.995874 0.9499
36 0.953711 0.933391
0.997446
0.999292
1.1
0.976355 0.938664 0.991092 0.99737
2 0.9946
90 0.998441 0.788691
0.995218
0.995218 0.8119
66 0.866775 0.817116
0.979990
0.991370
1.2
0.973517 0.895859 0.990663 0.99486
0 0.9902
09 0.997347 0.715996
0.993081
0.993081 0.7702
96 0.790230 0.705462
0.973394
0.989214
1.3
0.963991 0.912847 0.991636 0.99496
1 0.9900
56 0.996592 0.661433
0.992768
0.992768 0.7549
45 0.817864 0.731899
0.963406
0.982271
1.4
0.944534 0.871009 0.970673 0.99189
3 0.9811
69 0.995002 0.593253
0.987532
0.987532 0.7517
45 0.728678 0.650973
0.956345
0.970720
1.5
0.937212 0.850404 0.982488 0.98874
6 0.9802
13 0.993886 0.613137
0.986514
0.986514 0.6920
22 0.721404 0.678522
0.952692
0.969604
1.6
0.966199 0.989953 0.991907 0.99519
8 0.9870
51 0.997280 0.761301
0.987839
0.987839 0.8314
17 0.874820 0.873153
0.975440
0.985869
1.7
0.966199 0.990256 0.991907 0.99519
9 0.9870
54 0.997281 0.761301
0.987839
0.987839 0.8314
17 0.874820 0.873153
0.975541
0.986111
1.8
0.966943 0.989489 0.974032 0.99534
8 0.9870
65 0.996516 0.738819
0.984802
0.984802 0.8632
54 0.898295 0.889821
0.958461
0.982541
1.9
0.966943 0.989489 0.974032 0.99534
9 0.9870
66 0.996526 0.738820
0.985037
0.985037 0.8632
54 0.898295 0.889821
0.958627
0.982550
2.0
0.960183 0.987919 0.970952 0.99207
6 0.9845
52 0.995183 0.712417
0.983227
0.983227 0.8452
65 0.883358 0.880298
0.951742
0.968619
SFRandom
WalkRobot Arm Shuttle
Soil Temp
SpeechSpot Exrat
esStandard &
PoorSteamg
enSynthetic Control
Tide Tongue Winding WoolAverag
e
1.0
0.999316 0.991823 0.999472 0.99717
8 0.9995
25 0.996780 0.998003
0.998463
0.977751 0.9988
42 0.999415 0.998395
0.999156
0.991684
1.1
0.995331 0.853549 0.998895 0.78669
1 0.9702
43 0.987656 0.992618
0.988999
0.785640 0.9937
85 0.985925 0.987407
0.998610
0.928805
1.2
0.991490 0.775236 0.998385 0.69240
3 0.9612
92 0.980151 0.986087
0.982789
0.752406 0.9845
17 0.957332 0.982430
0.997621
0.905870
1.3
0.989852 0.738884 0.998083 0.68941
7 0.9612
06 0.977120 0.985869
0.984748
0.711955 0.9832
90 0.960734 0.986088
0.997206
0.897890
1.4
0.980321 0.683294 0.997118 0.63031
8 0.9189
63 0.967930 0.977566
0.973481
0.677345 0.9619
34 0.914782 0.962338
0.997277
0.868613
1.5
0.981349 0.677865 0.996204 0.65422
5 0.9161
46 0.968208 0.978736
0.961485
0.714639 0.9431
43 0.909705 0.957939
0.996061
0.870275
1.6
0.986326 0.867726 0.998239 0.67684
7 0.9692
22 0.981636 0.988090
0.980783
0.819298 0.9851
29 0.985496 0.986275
0.997754
0.927593
1.7
0.986328 0.867726 0.998242 0.67684
7 0.9692
23 0.981644 0.988091
0.980825
0.819298 0.9851
37 0.985496 0.986278
0.997758
0.927619
1.8
0.981463 0.870426 0.997439 0.68777
9 0.9661
13 0.979830 0.987544
0.972622
0.859444 0.9790
27 0.981215 0.981085
0.997219
0.929122
1.9
0.981465 0.870426 0.997440 0.68777
9 0.9661
13 0.979830 0.987545
0.972625
0.859444 0.9790
27 0.981215 0.981085
0.997339
0.929142
2.0
0.977163 0.849937 0.996917 0.66735
6 0.9563
03 0.976385 0.982182
0.965784
0.841658 0.9718
08 0.976245 0.975663
0.996876
0.920468
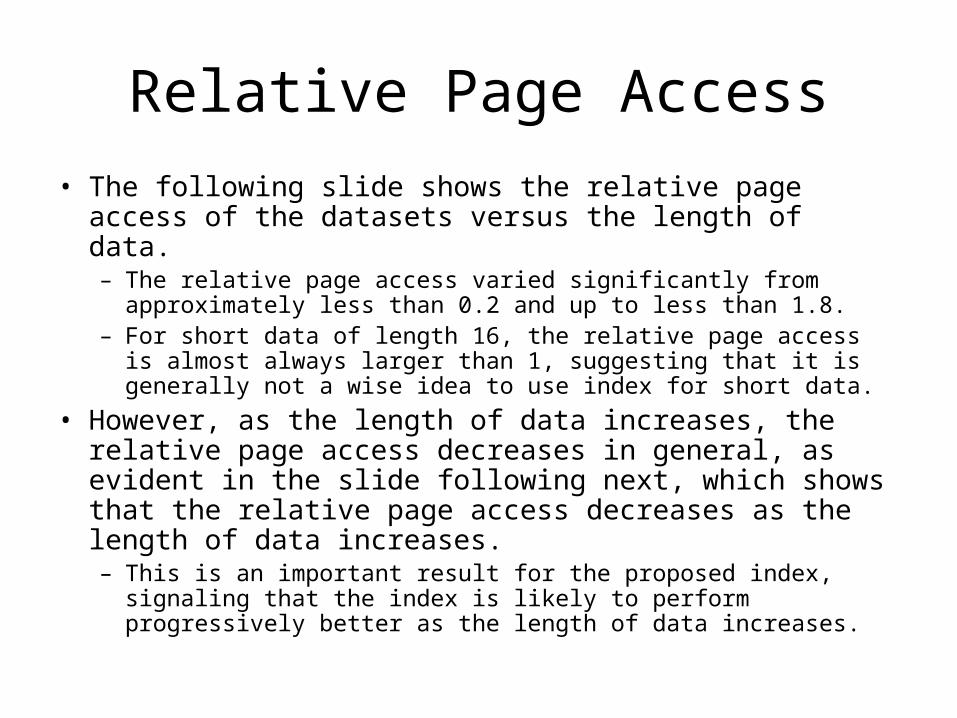
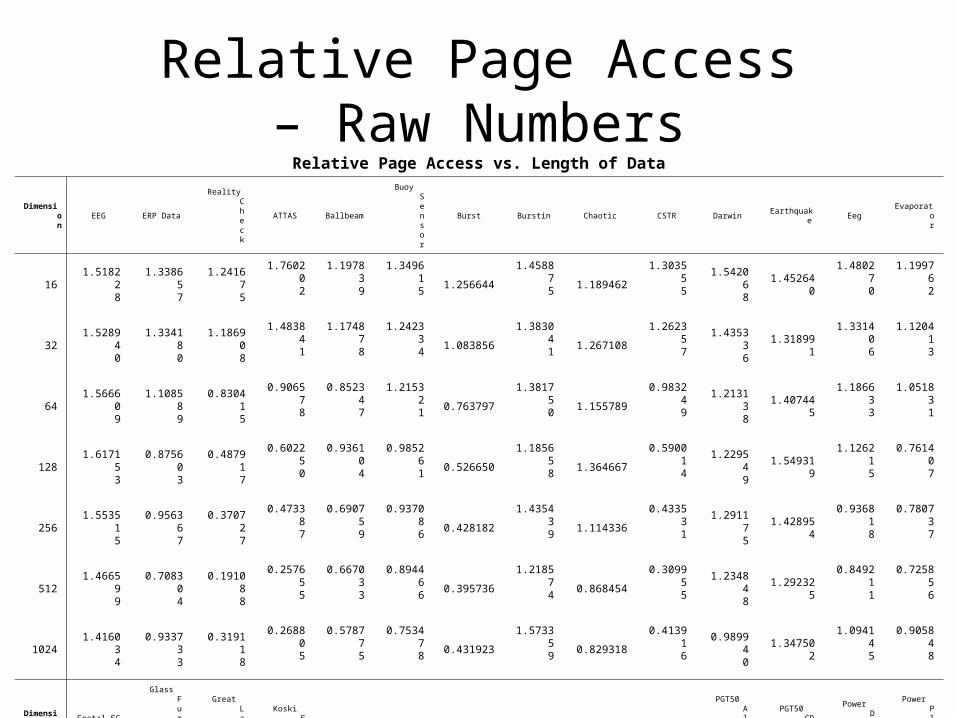
Relative Page Access
• The following slide shows the relative page access of the datasets versus the length of data.– The relative page access varied significantly from approximately
less than 0.2 and up to less than 1.8.– For short data of length 16, the relative page access is almost
always larger than 1, suggesting that it is generally not a wise idea to use index for short data.
• However, as the length of data increases, the relative page access decreases in general, as evident in the slide following next, which shows that the relative page access decreases as the length of data increases.– This is an important result for the proposed index, signaling that
the index is likely to perform progressively better as the length of data increases.
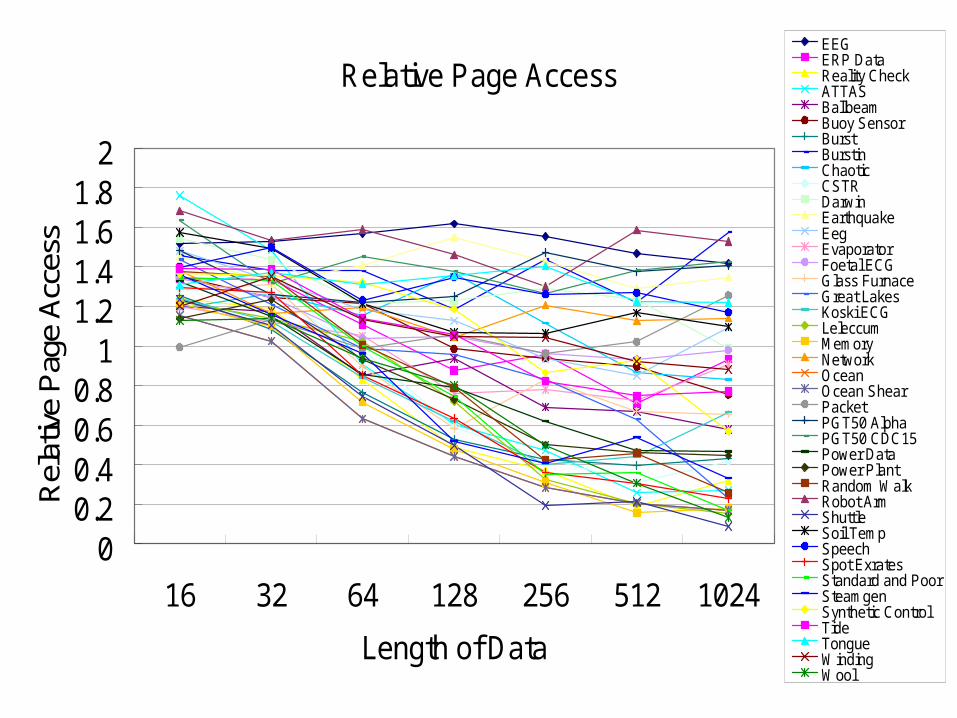
Relative Page Access
00.20.40.60.8
11.21.41.61.8
2
16 32 64 128 256 512 1024
Length of Data
Rel
ativ
e P
age
Acc
ess
EEGERP DataReality CheckATTASBallbeamBuoy SensorBurstBurstinChaoticCSTRDarwinEarthquakeEegEvaporatorFoetal ECGGlass FurnaceGreat LakesKoski ECGLeleccumMemoryNetworkOceanOcean ShearPacketPGT50 AlphaPGT50 CDC15Power DataPower PlantRandom WalkRobot ArmShuttleSoil TempSpeechSpot ExratesStandard and PoorSteamgenSynthetic ControlTideTongueWindingWool
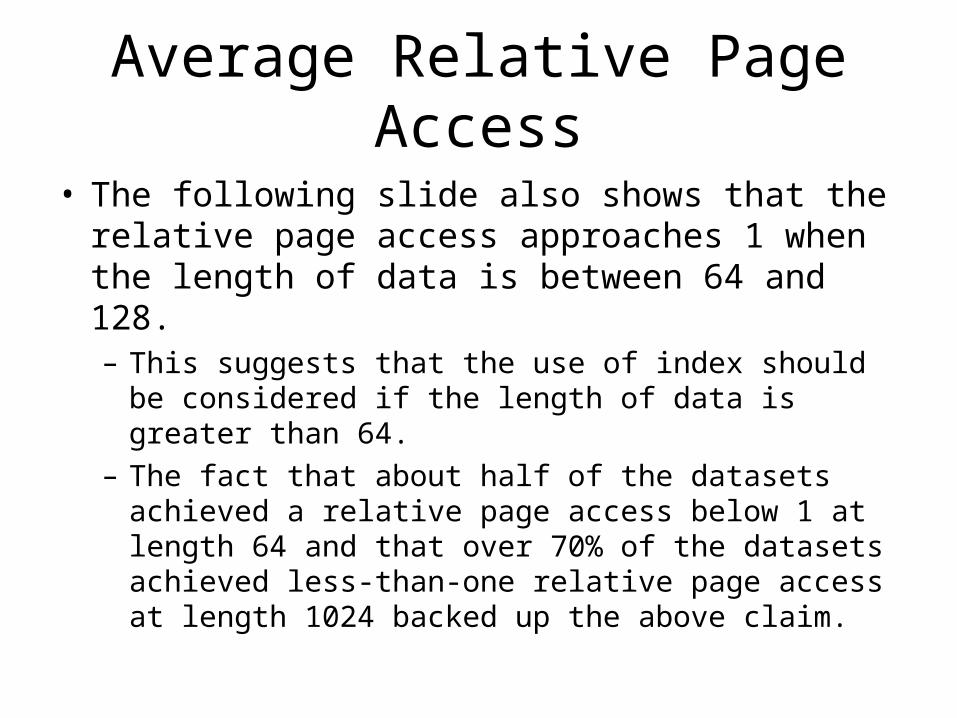
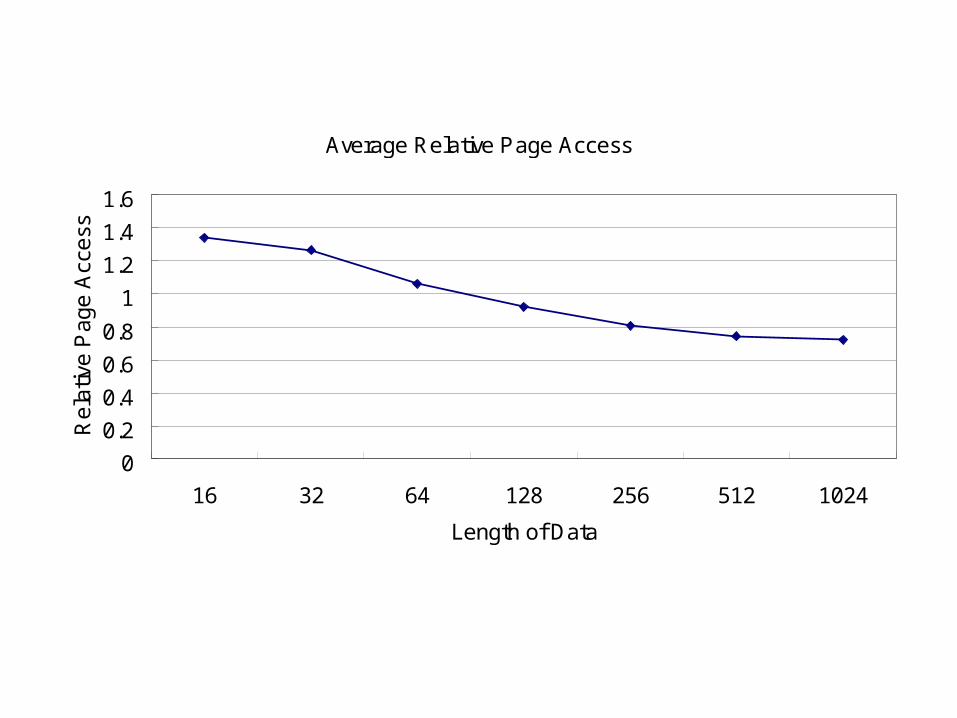
Average Relative Page Access
• The following slide also shows that the relative page access approaches 1 when the length of data is between 64 and 128.– This suggests that the use of index should be
considered if the length of data is greater than 64.– The fact that about half of the datasets achieved a
relative page access below 1 at length 64 and that over 70% of the datasets achieved less-than-one relative page access at length 1024 backed up the above claim.
Average Relative Page Access
0
0.2
0.4
0.6
0.8
1
1.2
1.4
1.6
16 32 64 128 256 512 1024
Length of Data
Re
lativ
e P
ag
e A
cce
ss
Relative Page Access vs. Length of Data
Dimension
EEG ERP Data
Reality Check
ATTAS Ballbeam
Buoy Sensor
Burst Burstin Chaotic CSTR Darwin Earthquake EegEvaporat
or
161.5182
28
1.338657
1.241675
1.760202
1.197839
1.349615
1.256644
1.458875
1.189462
1.303555
1.542068
1.452640
1.480270
1.199762
321.5289
40
1.334180
1.186908
1.483841
1.174878
1.242334
1.083856
1.383041
1.267108
1.262357
1.435336
1.318991
1.331406
1.120413
641.5666
09
1.108589
0.830415
0.906578
0.852347
1.215321
0.763797
1.381750
1.155789
0.983249
1.213138
1.407445
1.186633
1.051831
1281.6171
53
0.875603
0.487917
0.602250
0.936104
0.985261
0.526650
1.185658
1.364667
0.590014
1.229549
1.549319
1.126215
0.761407
2561.5535
15
0.956367
0.370727
0.473387
0.690759
0.937086
0.428182
1.435439
1.114336
0.433531
1.291175
1.428954
0.936818
0.780737
5121.4665
99
0.708304
0.191088
0.257655
0.667033
0.894466
0.395736
1.218574
0.868454
0.309955
1.234848
1.292325
0.849211
0.725856
10241.4160
34
0.933733
0.319118
0.268805
0.578775
0.753478
0.431923
1.573359
0.829318
0.413916
0.989940
1.347502
1.094145
0.905848
Dimension
Foetal ECG
Glass Furnace
Great Lakes
Koski ECG
Leleccum Memory Network Ocean Ocean Shear Packet
PGT50 Alpha
PGT50 CDC15
Power Data
Power Plant
161.3406
89
1.287433
1.435583
1.237885
1.224261
1.215665
1.383371
1.153702
1.153702
0.992752
1.481012
1.634052
1.327203
1.136920
321.2472
50
1.311823
1.207590
1.125165
1.138678
1.099045
1.163370
1.024475
1.024475
1.132718
1.260214
1.316821
1.150763
1.233051
641.0383
04
0.896539
0.988632
0.840303
1.022127
0.715251
1.195175
0.631686
0.631686
0.986160
1.221378
1.450676
0.858115
0.930927
1281.0486
38
0.581836
0.955289
0.619018
0.717476
0.479320
1.044484
0.440641
0.440641
1.058402
1.250114
1.376594
0.791496
0.730234
2560.9607
51
0.829880
0.831002
0.403638
0.327351
0.308918
1.206453
0.283952
0.283952
0.960267
1.471842
1.263139
0.618712
0.500736
5120.9305
44
0.667888
0.630370
0.440675
0.202979
0.157417
1.127305
0.205982
0.205982
1.019801
1.374783
1.382482
0.471118
0.462361
10240.9791
22
0.655376
0.231967
0.665916
0.154578
0.180978
1.139579
0.169438
0.169438
1.254587
1.405600
1.425001
0.465772
0.444837
Dimension
Random Walk
Robot Arm Shuttle Soil Temp SpeechSpot Exrat
es
Standard & Poo
rSteamgen
Synthetic Control
Tide Tongue Winding Wool Average
161.3766
42
1.682913
1.234891
1.573792
1.398669
1.293338
1.345880
1.360767
1.365710
1.390704
1.308829
1.201163
1.128378
1.340376
321.3494
51
1.532538
1.104730
1.493701
1.496310
1.271063
1.329950
1.159717
1.355713
1.385898
1.370407
1.350632
1.140216
1.266570
641.0050
43
1.588033
0.744667
1.212753
1.230510
0.853253
0.998204
0.961043
1.321875
1.139378
1.311534
1.131427
0.938562
1.060164
1280.7883
86
1.460337
0.496912
1.067514
1.347617
0.633163
0.744228
0.519667
1.186771
1.056253
1.353303
1.047924
0.800327
0.923765
2560.4215
66
1.299988
0.195134
1.063398
1.259823
0.361241
0.352205
0.407806
0.864809
0.821942
1.402710
1.043574
0.498838
0.806699
5120.4577
25
1.585264
0.214273
1.167539
1.267393
0.306695
0.358125
0.540054
0.927356
0.748646
1.223565
0.923770
0.306352
0.741135
10240.2580
44
1.528005
0.088301
1.097235
1.168286
0.228104
0.169561
0.331320
0.568785
0.769215
1.220670
0.881667
0.132935
0.722932
Relative Page Access– Raw Numbers
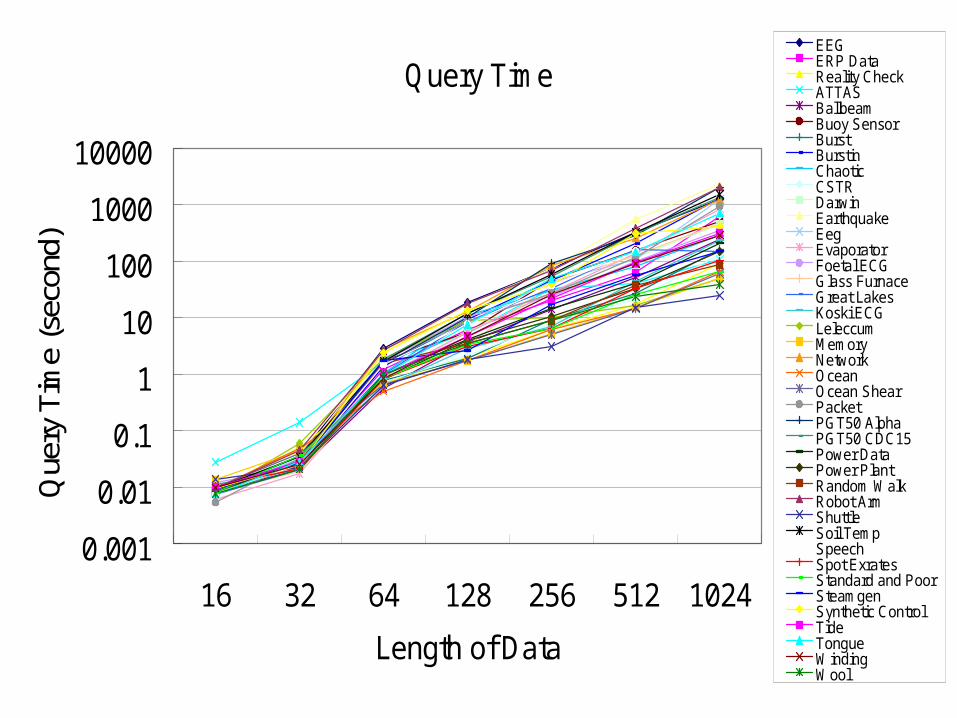
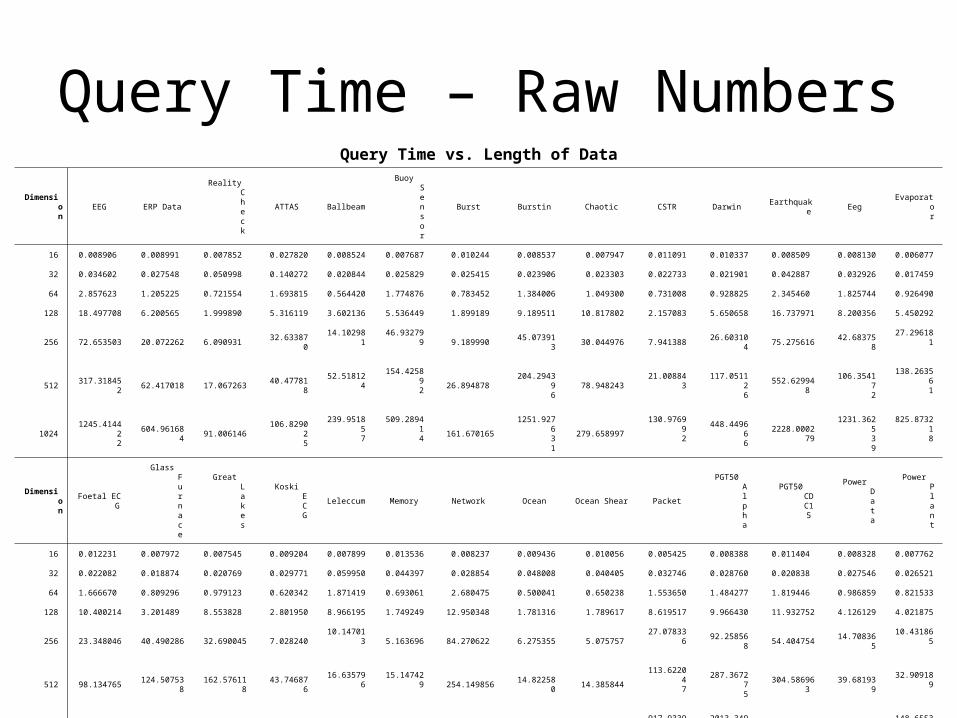
Query Time
• The following slide shows the actual running time of the range queries as calculated by the difference between two calls to gettimeofday before and after the queries.– The time is averaged over all 50 queries performed fo
r each length of data of each dataset.– It shows that the query generally runs very fast.
• All queries completed within a fraction of a second for all datasets of length 16 and 32, and all queries completed in the magnitude of minutes.
– Note the logarithmic scale in both axes.
Query Time
0.001
0.01
0.1
1
10
100
1000
10000
16 32 64 128 256 512 1024
Length of Data
Que
ry T
ime
(sec
ond)
EEGERP DataReality CheckATTASBallbeamBuoy SensorBurstBurstinChaoticCSTRDarwinEarthquakeEegEvaporatorFoetal ECGGlass FurnaceGreat LakesKoski ECGLeleccumMemoryNetworkOceanOcean ShearPacketPGT50 AlphaPGT50 CDC15Power DataPower PlantRandom WalkRobot ArmShuttleSoil TempSpeechSpot ExratesStandard and PoorSteamgenSynthetic ControlTideTongueWindingWool
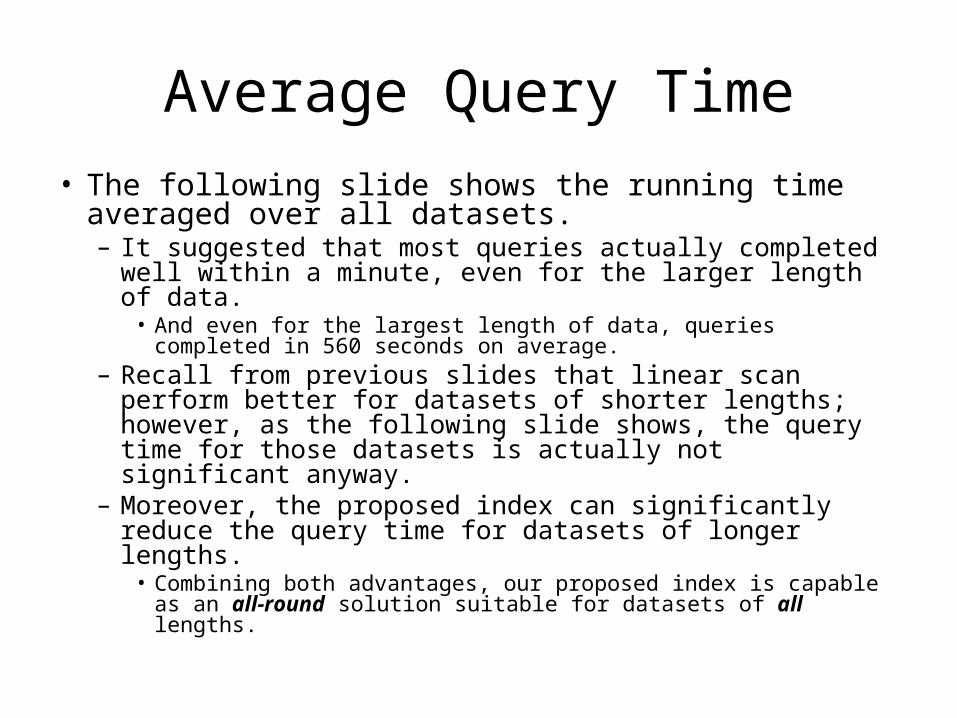
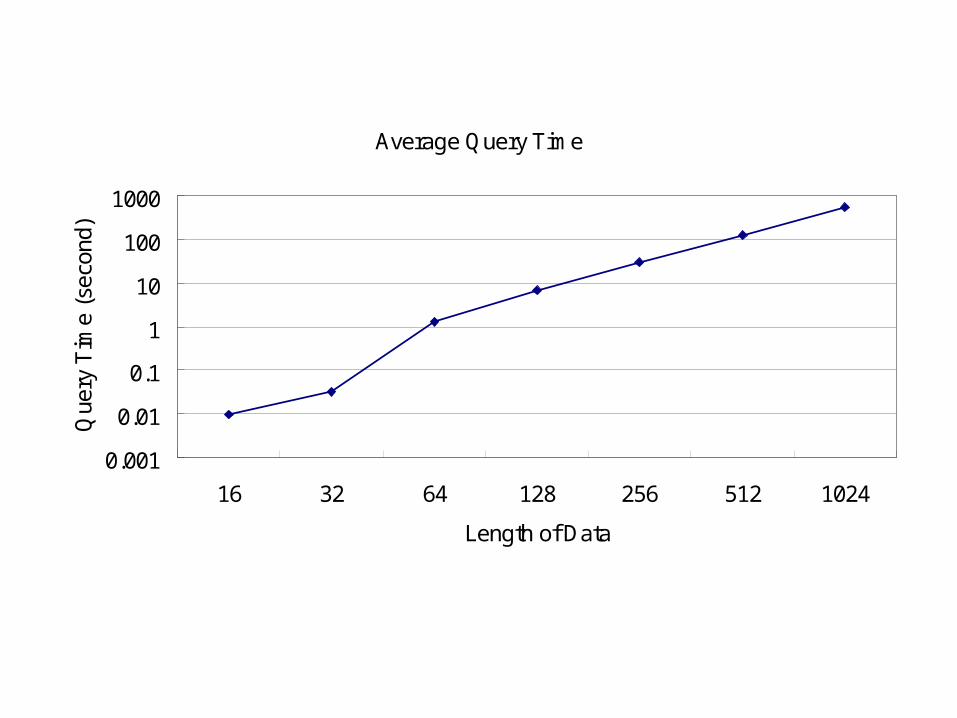
Average Query Time
• The following slide shows the running time averaged over all datasets.– It suggested that most queries actually completed well
within a minute, even for the larger length of data.• And even for the largest length of data, queries completed in
560 seconds on average.– Recall from previous slides that linear scan perform
better for datasets of shorter lengths; however, as the following slide shows, the query time for those datasets is actually not significant anyway.
– Moreover, the proposed index can significantly reduce the query time for datasets of longer lengths.
• Combining both advantages, our proposed index is capable as an all-round solution suitable for datasets of all lengths.
Average Query Time
0.001
0.01
0.1
1
10
100
1000
16 32 64 128 256 512 1024
Length of Data
Que
ry T
ime
(sec
ond)
Query Time vs. Length of Data
Dimension
EEG ERP Data
Reality Check
ATTAS Ballbeam
Buoy Sensor
Burst Burstin Chaotic CSTR Darwin Earthquake EegEvaporat
or
16 0.008906 0.008991 0.007852 0.027820 0.008524 0.007687 0.010244 0.008537 0.007947 0.011091 0.010337 0.008509 0.008130 0.006077
32 0.034602 0.027548 0.050998 0.140272 0.020844 0.025829 0.025415 0.023906 0.023303 0.022733 0.021901 0.042887 0.032926 0.017459
64 2.857623 1.205225 0.721554 1.693815 0.564420 1.774876 0.783452 1.384006 1.049300 0.731008 0.928825 2.345460 1.825744 0.926490
128 18.497708 6.200565 1.999890 5.316119 3.602136 5.536449 1.899189 9.189511 10.817802 2.157083 5.650658 16.737971 8.200356 5.450292
256 72.653503 20.072262 6.090931 32.63387
0
14.102981
46.932799
9.189990 45.07391
3 30.044976 7.941388
26.603104
75.275616 42.68375
8
27.296181
512317.31845
2 62.417018 17.067263
40.477818
52.518124
154.425892
26.894878 204.2943
96
78.948243 21.00884
3
117.051126
552.629948
106.354172
138.263561
10241245.4144
22
604.961684
91.006146 106.8290
25
239.951857
509.289414
161.670165
1251.927631
279.658997
130.976992
448.449666
2228.000279
1231.362539
825.873218
Dimension
Foetal ECG
Glass Furnace
Great Lakes
Koski ECG Leleccum Memory Network Ocean Ocean Shear Packet
PGT50 Alpha
PGT50 CDC15
Power Data
Power Plant
16 0.012231 0.007972 0.007545 0.009204 0.007899 0.013536 0.008237 0.009436 0.010056 0.005425 0.008388 0.011404 0.008328 0.007762
32 0.022082 0.018874 0.020769 0.029771 0.059950 0.044397 0.028854 0.048008 0.040405 0.032746 0.028760 0.020838 0.027546 0.026521
64 1.666670 0.809296 0.979123 0.620342 1.871419 0.693061 2.680475 0.500041 0.650238 1.553650 1.484277 1.819446 0.986859 0.821533
128 10.400214 3.201489 8.553828 2.801950 8.966195 1.749249 12.950348 1.781316 1.789617 8.619517 9.966430 11.932752 4.126129 4.021875
256 23.348046 40.490286 32.690045 7.028240 10.14701
3
5.163696 84.270622 6.275355 5.075757 27.07833
6
92.258568
54.404754 14.70836
5
10.431865
512 98.134765 124.50753
8 162.57611
8 43.74687
6
16.635796
15.147429
254.149856 14.82258
0 14.385844
113.622047
287.367275
304.586963
39.681939
32.909189
1024352.86413
2 467.26862
0 149.53252
4
234.984439
50.042713
49.646797
1211.571944
64.286687
60.260655
917.933985
2013.349248
1313.071738
207.557484
148.655349
Dimension
Random Walk
Robot Arm Shuttle Soil Temp SpeechSpot Exrat
es
Standard & Poo
rSteamgen
Synthetic Control
Tide Tongue Winding Wool Average
16 0.007986 0.009621 0.013935 0.009682 0.007806 0.010297 0.008018 0.009280 0.009646 0.009957 0.007609 0.009757 0.007734 0.009498
32 0.025615 0.045487 0.022771 0.034344 0.025284 0.021546 0.036322 0.026498 0.025737 0.028008 0.028174 0.025720 0.020987 0.032357
64 1.547834 2.595087 0.643038 1.672957 1.498341 0.847308 0.829322 1.747261 2.403264 0.942431 0.939633 0.855632 0.999961 1.303666
128 3.479501 17.817225 1.853674 11.71076
2 7.519265 3.157955 3.303026 2.632136 13.362863 4.667584 7.556816 4.631206 3.444505 6.762272
256 8.901375 68.145256 3.093776 59.23178
6
37.131263
6.517546 6.343443 17.15533
1 39.370829
21.753843
48.243180
25.453888 8.870395 29.76044
2
512 36.814731 375.71248
9 14.908316
325.899240
148.185988
32.366527
25.864971 56.19133
4 308.370053
93.215671
145.993875
90.096584 23.38742
8
124.120760
1024 85.938851 2033.8050
61
24.773419
1516.404957
662.354303
101.094878
64.856889 149.8172
56
408.384121
312.716380
704.605891
287.207593
38.630299
560.658250
Query Time – Raw Numbers