Embed Size (px)
Citation preview
1
Scale Up for Success Initiative
Research Evaluation Report
August 2015
Pinellas County Schools Office of Assessment, Accountability and Research
2
Executive Summary
Short History
The Scale Up for Success Initiative focuses on the continued support and growth of five elementary schools in the Pinellas County School District: Campbell Park, Fairmount Park, Lakewood, Maximo, and Melrose. To combat low performance and support student achievement, Pinellas County Schools in 2014 began an ambitious investment in these five turn-around schools.
Based on the latest national research, the following interventions were put in place: o Intensive support and training for every teacher, including the hiring of a
paraprofessional for every classroom to serve as a teaching partner. o Intensive coaching and support for school leaders, including a district partnership
with The New Teacher Project (a national leader in school improvement and support). o Advanced behavior management systems around Positive Behavioral Supports
(PBS) and frequent district monitoring to reduce student discipline incidences and ensure a stronger learning climate for teachers and students.
o Aggressive recruitment, retention and performance bonuses for teachers. o Comprehensive mental health and social services for students and families. o Enhanced extended learning budgets to provide after-school learning options.
Year One Progress / Highlights
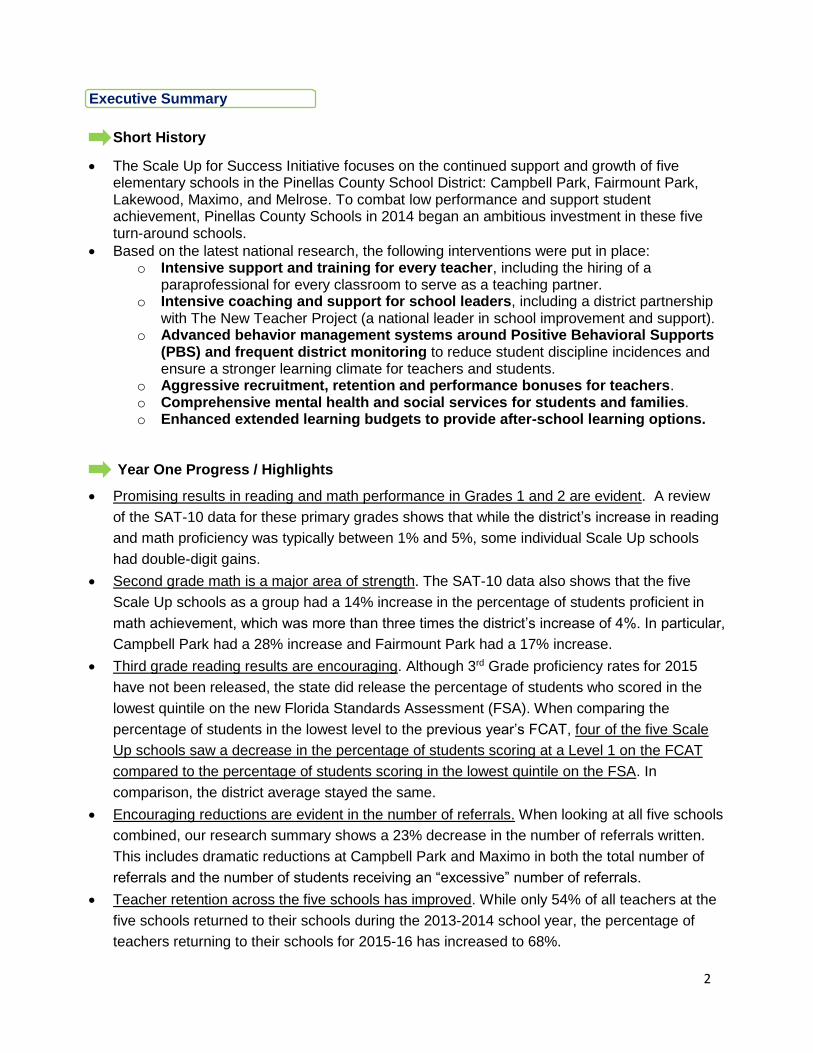
Promising results in reading and math performance in Grades 1 and 2 are evident. A review
of the SAT-10 data for these primary grades shows that while the district’s increase in reading
and math proficiency was typically between 1% and 5%, some individual Scale Up schools
had double-digit gains.
Second grade math is a major area of strength. The SAT-10 data also shows that the five
Scale Up schools as a group had a 14% increase in the percentage of students proficient in
math achievement, which was more than three times the district’s increase of 4%. In particular,
Campbell Park had a 28% increase and Fairmount Park had a 17% increase.
Third grade reading results are encouraging. Although 3rd Grade proficiency rates for 2015
have not been released, the state did release the percentage of students who scored in the
lowest quintile on the new Florida Standards Assessment (FSA). When comparing the
percentage of students in the lowest level to the previous year’s FCAT, four of the five Scale
Up schools saw a decrease in the percentage of students scoring at a Level 1 on the FCAT
compared to the percentage of students scoring in the lowest quintile on the FSA. In
comparison, the district average stayed the same.
Encouraging reductions are evident in the number of referrals. When looking at all five schools
combined, our research summary shows a 23% decrease in the number of referrals written.
This includes dramatic reductions at Campbell Park and Maximo in both the total number of
referrals and the number of students receiving an “excessive” number of referrals.
Teacher retention across the five schools has improved. While only 54% of all teachers at the
five schools returned to their schools during the 2013-2014 school year, the percentage of
teachers returning to their schools for 2015-16 has increased to 68%.
3
Recommendations / Growth Steps
Priority Recommendations
Increase the leadership capacity in each school around instructional change. While some progress has been made, we recommend that an emphasis be placed on the growth of the school leadership (including the principals, assistant principals and instructional coaches) to move the schools forward in terms of instructional vision, high expectations for students and staff, and data-driven interventions. Research clearly supports the link between leadership and academic improvement and the continued growth of the leaders in these five schools is paramount to the turn-around model.
Improve the learning environment in each school. While the discipline data across the five schools show promising trends, there are frequent interruptions to the classroom environments and those are negatively affecting teaching and learning. It is important to note while these interruptions might be viewed through a behavioral lens, they are tied in part to the lack of effective, behavioral lesson planning and rigorous instruction. It should be noted that the recent stabilizing of the teaching ranks in these schools may help to improve the learning environment.
Related Recommendations
Continue ongoing, intensive training for teachers and paraprofessionals. Continue the district’s growth model for teachers, paraprofessionals and school leaders related to effective instruction, observation and feedback cycles. Continue to partner with The New Teacher Project (TNTP) and align the district processes and coaching supports. Ensure that teachers receive professional development related to the use of district common assessments to drive learning.
Continue the district’s monitoring plan and weekly A-Team support meetings. Ensure that district leaders and instructional coaches visit these schools at least twice a month to monitor growth and provide immediate feedback to schools. Ensure that a consistent and deliberate message from the area superintendents for each school is evident and that the hierarchy of leadership support from the district is clearly defined.
Ensure that the paraprofessionals are hired and trained in a timely manner. Set clear guidelines around the role of the paraprofessionals in light of the research in support of paraprofessionals as “teaching partners” in the classrooms. Ensure that hiring is completed before school begins. Because the year-one plan was not fully implemented until the second half of the 2014-15 school year, some paraprofessional positions were not fully staffed. As of August 2015, all paraprofessional positions have been hired and a comprehensive two-day workshop for the paraprofessionals has been completed.
Pinpoint areas of growth in each school so as to narrow the research focus and identify areas for “scaling up” interventions to other schools. Review and study “outlier” successes from year-one study to determine connections / correlations that could be “scaled up.” This includes a dramatic drop in referrals and “repeat” referrals at Maximo and very promising results in the after-school program at Lakewood.
4
Develop ways to increase attendance at after school and summer programs (such as Promise Time and Summer Bridge) and establish community support for these initiatives. With the outcome results from Promise Time showing positive trends, it is imperative that more students take part. Schools should consider strategies to eliminate potential barriers to increasing enrollment and employ practices to ensure student needs are being met. Use Promise Time data to help drive instruction in the classrooms in support of differentiation.
Continue to support the growth and retention of the highly qualified faculty, staff and leaders at the schools by ensuring ongoing training, frequent monitoring and coaching in the classrooms and continued utilization of recruitment and retention bonuses.
Develop a more comprehensive family engagement plan by providing more guidelines and strategies to develop family engagement activities linked to learning and school improvement in the areas of academics and behavior. Ensure that more students and parents take advantage of additional social services at the schools.
5
Introduction / Purpose: Scale Up for Success Initiative The Scale Up for Success Initiative focuses on five elementary schools in the Pinellas
County School District: Campbell Park, Fairmount Park, Lakewood, Maximo, and Melrose.
The Florida Department of Education School Accountability Report identifies these schools
as among the state’s lowest performing and designates them as Priority Schools required to
implement school improvement strategies. Multiple data sources indicate that students who
attend these five schools perform significantly below their peers within the district.
The Scale Up for Success Initiative is aimed at increasing student achievement through a
multi-pronged approach. This includes providing school leaders and teachers with learning
opportunities around planning and implementing enhanced systems for improving teaching
and learning. The interventions across all five schools began in October 2014, with an
emphasis on implementation during the first year. Based on research conducted by Bryk,
Sebring, Kerbow, Rollow and Easton (1998) and Mapp (2005), the framework for support has
six essential elements: leadership, professional capacity, instructional core, student centered
learning climate, family and community engagement, and instructional guidance. Within
these six essential elements, the following areas are focal points within each school plan:
additional classroom assistance, full behavior management systems, enhanced family
engagement, ongoing professional development, frequent district monitoring, enhanced
extended learning opportunities for students and comprehensive mental health and social
services.
Best practices supported by this initiative include an emphasis on strong leadership,
continuous professional development and a continuum of interventions. In turn, the
implementation of these practices will help students improve academically, remain engaged
and improve behavior outcomes. In addition, implementation monitoring and process
evaluations are key components of the initiative to support continuous improvement.
6
This report will focus on the interventions for the first year of this initiative, which are listed below by each of the focus areas:
Student Academics
o Each classroom teacher will have a full-time paraprofessional as a
teaching partner so as to increase student contact time in support of
an improved learning environment.
o Each school will have enhanced Extended Learning Program (ELP) budgets
to increase services for all students scoring Level 1 or 2 in reading or math.
Professional Development
o Each classroom teacher and paraprofessional will receive ongoing professional
development and feedback related to their professional growth.
o Each teacher will be eligible for retention and performance bonuses.
Student Behavior
o Each school will implement school-wide behavior management systems aligned
to Positive Behavioral Supports (PBS).
o Each school will have a full-time psychologist and social worker.
Family and Community Engagement
o Each school will establish and implement frameworks that connect family and
community engagement to core learning.
o Each school will have a full-time family navigator and mental health counselor.
Leadership
o Leadership is key to high-performing schools. According to Marzano (2001), there
are seven traits to effective leadership, particularly in struggling schools: Clear vision
and mission, quality curriculum and instruction, high expectations, systems of
support, on-going professional development, and family and community
engagement. As part of the Scale Up For Success Initiative, several of these traits
for effective leadership are being implemented, monitored, and evaluated: teacher
quality, on-going professional development, family and community engagement, and
school environment.
o District leaders will provide support for school leaders in the areas of
instructional improvement and staff development.
o The New Teacher Project (TNTP) will help school leaders to focus on a unified
school vision, specifically in the areas of the learning environment, student
engagement and classroom observation and feedback.
7
Evaluation Methods: Scale Up for Success Initiative Evaluation Design
The evaluation design used for this initiative was collaborative and mixed-method. External
stakeholders, internal partners, key district personnel and the evaluation team met periodically
to discuss the implementation and monitoring activities. Conclusions and recommendations for
Year 2 were also done as a collaborative effort.
The Year 1 report serves as baseline data for the Scale Up for Success Initiative. It includes
evaluation of the processes, inputs, and preliminary outcomes of the Scale Up for Success
Initiative. The primary purpose of this Year 1 summative evaluation is to provide a snapshot of
the project implementation strategies to identify the program’s strengths and areas that need to
be enhanced for Year 2. This report also examines various outcome measures to analyze
current growth in key areas as well as to serve as a baseline comparison in the years to come.
The overall evaluation design was mixed-method, and included both quantitative and
qualitative data. Some of the quantitative data included assessments in various subject areas,
and discipline and attendance data across two years for the five schools. Survey data from
multiple stakeholders (staff, families and students) were also included in this report. In most
instances, the survey data for Year 1 were collected virtually and response rates were
sometimes small. A more directed approach is recommended and planned as part of the Year
2 evaluation so as to increase the response rate.
Limitations
It is important to note that though we are reporting on Year 1 processes and outcomes related
to the Scale Up initiative, most of the interventions were not fully implemented until the second
semester of 2014-15. For this reason, it is best to view the results as baseline data and the
recommendations as developmental with the understanding that Year 2 will be a full
implementation year and provide more telling data around the interventions at each school.
Instruments
A number of instruments were used in preparing this report, including the Stanford Achievement
Test (SAT-10) assessments (Grades 1 and 2), the Florida Comprehensive Assessment Test
(FCAT), the Florida Standards Assessment (FSA), the Scale Up Teacher Survey, the Scale Up
8
Paraprofessional Survey and a Scale Up Principal Survey. The survey instruments are
described in more detail below and the full results are available upon request.
The Scale Up Teacher Survey* was administered in February 2015. This survey was designed
to obtain data on teacher perceptions of various activities and components of the initiative.
Specifically, the survey addressed the teachers’ perceptions of the professional development,
academic, behavior and family engagement components of the initiative. Finally, there were
several items that addressed leadership and their support of the staff. The survey had 16 items,
including an open-ended comment box.
9
The Scale Up Paraprofessional Survey* was created to collect data regarding the
paraprofessionals and their experiences related to the Scale Up initiative. The survey also
served as an avenue to provide feedback for improved professional development opportunities
and to inform Year 2 implementation of the initiative. The survey was comprised of
33 items, including an open-ended comment box. This survey was administered in late May.
The Principal Year 1 Survey* was intended to provide valuable feedback to district leadership
regarding the principals’ perceptions of the Scale Up initiative and The New Teacher Project
(TNTP). The survey provided actionable feedback going into Year 2 of the initiative. The
survey contained 14 items, including an open-ended response comment box. The survey was
administered in late July.
A Formative Evaluation Report for Year 1 of Scale Up for Success was conducted in February
2015 to examine the progress of the initiative mid-year and to provide recommendations moving
forward. As part of this report, a review of the district’s cycle assessment data was conducted.
This provided an overview of academic achievement and potential gaps to address at key points
during the school year.
*Survey instruments are available upon request.
10
Overview
Academic Findings
This report serves as Year 1 (baseline) data regarding the Scale Up for Success Initiative. The
data included in this report encompass two broad areas: (1) data related to the implementation
of several of the Scale Up components and (2) related data specific to the outcomes in critical
areas, such as academics and behavior. Although there may be some impact on outcomes
during year one of the initiative, research on school turn-around models suggests that these
outcomes will be stronger and more evident in future years. Since careful monitoring of the
initiative on an ongoing basis is one of the major aspects of its implementation plan, the results
will be used to make strategic decisions at key points throughout each school year.
The goal for the academic interventions within the Scale Up initiative are addressed through
three different areas of intervention and were initially outlined in the following way: (1) Each
classroom teacher will have a full-time paraprofessional as a teaching partner (TP); (2)
Schools will have enhanced ELP budgets to include services for all students scoring Level 1 or
2 in reading or math; and (3) Each paraprofessional and teacher will receive ongoing
professional development. The following section on academic interventions focuses on the
first two strategies of providing each classroom with a paraprofessional and increasing ELP
budgets.
A separate section follows that is devoted to professional development for teachers and
paraprofessionals so as to provide a more in-depth review of this aspect of the initiative.
11
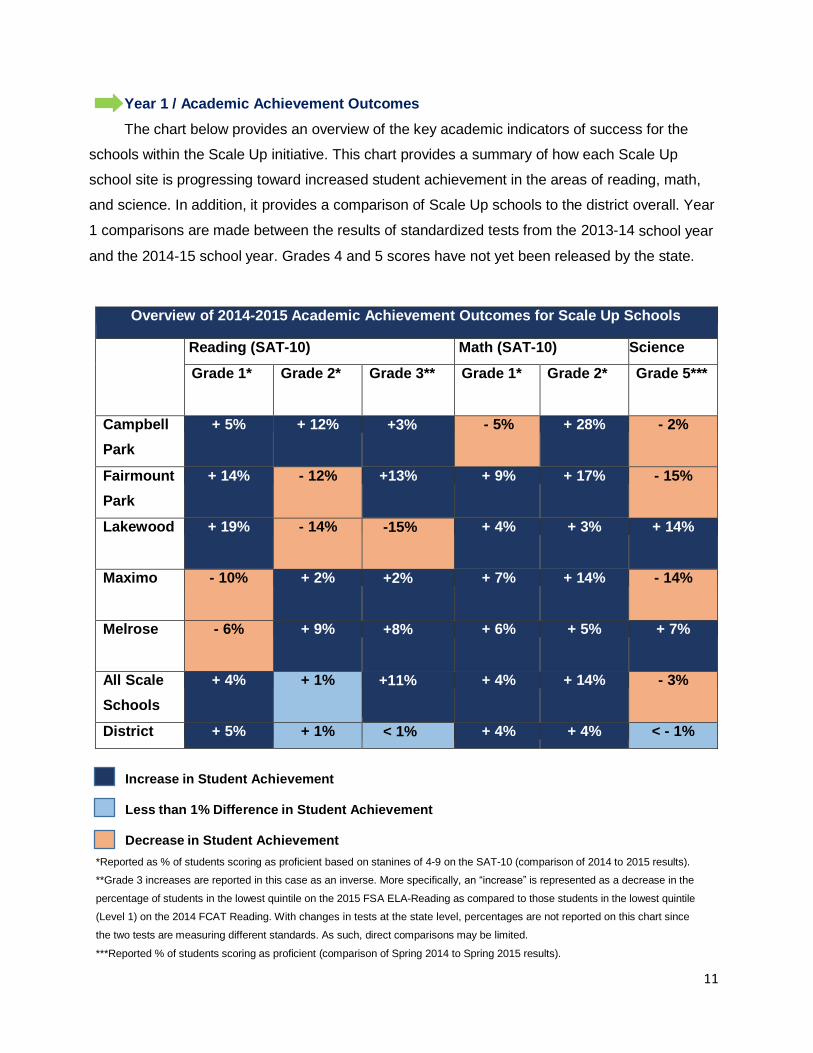
Year 1 / Academic Achievement Outcomes
The chart below provides an overview of the key academic indicators of success for the
schools within the Scale Up initiative. This chart provides a summary of how each Scale Up
school site is progressing toward increased student achievement in the areas of reading, math,
and science. In addition, it provides a comparison of Scale Up schools to the district overall. Year
1 comparisons are made between the results of standardized tests from the 2013-14 school year
and the 2014-15 school year. Grades 4 and 5 scores have not yet been released by the state.
Overview of 2014-2015 Academic Achievement Outcomes for Scale Up Schools
Reading (SAT-10) Math (SAT-10) Science
Grade 1* Grade 2* Grade 3** Grade 1*
Grade 2* Grade 5***
Campbell
Park
+ 5% + 12% +3% - 5% + 28% - 2%
Fairmount
Park
+ 14% - 12% +13% + 9% + 17% - 15%
Lakewood + 19% - 14% -15% + 4% + 3% + 14%
Maximo - 10% + 2% +2% + 7% + 14% - 14%
Melrose - 6% + 9% +8% + 6% + 5% + 7%
All Scale
Schools
+ 4% + 1% +11%
+ 4% + 14% - 3%
District + 5% + 1% < 1% + 4% + 4% < - 1%
Increase in Student Achievement
Less than 1% Difference in Student Achievement
Decrease in Student Achievement
*Reported as % of students scoring as proficient based on stanines of 4-9 on the SAT-10 (comparison of 2014 to 2015 results).
**Grade 3 increases are reported in this case as an inverse. More specifically, an “increase” is represented as a decrease in the
percentage of students in the lowest quintile on the 2015 FSA ELA-Reading as compared to those students in the lowest quintile
(Level 1) on the 2014 FCAT Reading. With changes in tests at the state level, percentages are not reported on this chart since
the two tests are measuring different standards. As such, direct comparisons may be limited.
***Reported % of students scoring as proficient (comparison of Spring 2014 to Spring 2015 results).
12
Strengths and Areas of Improvement Related to Academic Achievement Outcomes
Academic Conclusions:
Promising results in reading and math performance in Grades 1 and 2 are evident. A review
of the SAT-10 data for these primary grades shows that while the district’s increase in reading
and math proficiency was typically between 1% and 5%, some individual Scale Up schools
had double-digit gains.
Second grade math is a major area of strength. The SAT-10 data also shows that the five
Scale Up schools as a group had a 14% increase in the percentage of students proficient in
math achievement, which was more than three times the district’s increase of 4%. In particular,
Campbell Park had a 28% increase and Fairmount Park had a 17% increase.
Three of the five Scale Up schools showed gains in Grade 1 reading proficiency and three
schools also showed gains in Grade 2 reading proficiency. For Grade 1, Fairmount Park
and Lakewood demonstrated large gains (14% and 19%, respectively). For Grade 2,
Campbell Park showed a 12% gain and Melrose showed a 9% gain.
While 3rd Grade proficiency rates for 2015 have not been released, the state did release the
percentage of students in the lowest quintile on the new Florida Standards Assessment.
When comparing the bottom quintile to the Level 1 quintile on the state FCAT test, four of
the five Scale Up schools saw a decrease in the percentage of students scoring at this lower
level. Those results are promising compared to the district, which showed no change.
The percentage of students scoring as proficient on the 5th Grade FCAT Science decreased
from 2014 to 2015 by 3% (from 17% to 14%) for the Scale Up schools combined. Three of
the five Scale Up schools had a decrease in 5th Grade FCAT Science scores. This is
consistent with state and district decreases in science scores.
In a review of the Extended Learning Programs (Promise Time), fewer than 50% of students
at some Scale Up schools have pre and post i-Ready assessment data available, which
indicates that a majority of students aren’t completing the program. Pre and post data are
necessary in determining a true representation of learning gains and program completion is
vital to student learning.
The Extended Learning Program (Promise Time) data shows that while some Scale Up
schools demonstrated consistent gains, data from other sites revealed decreased test
scores, or minimal gains, when compared to other Scale Up sites and the district.
Four of the five schools made marked progress in the hiring of paraprofessionals, with a
range of 73% to 96% of paraprofessionals hired among four of the five Scale Up schools.
Campbell Park is shown as having hired paraprofessionals in only 56% of their
13
classrooms but that is tied to a school-level decision to focus in year one on developing
this model in Grades 4 and 5.
Overall perceptions of teachers regarding the implementation of paraprofessionals in the
classroom were positive. According to the Scale Up Survey, 86.5% of instructional staff
agreed that having a teaching partner has positively impacted student learning.
Eighty-eight percent of the paraprofessionals surveyed reported that they would like to
continue as a paraprofessional for the 2015-2016 academic year.
14
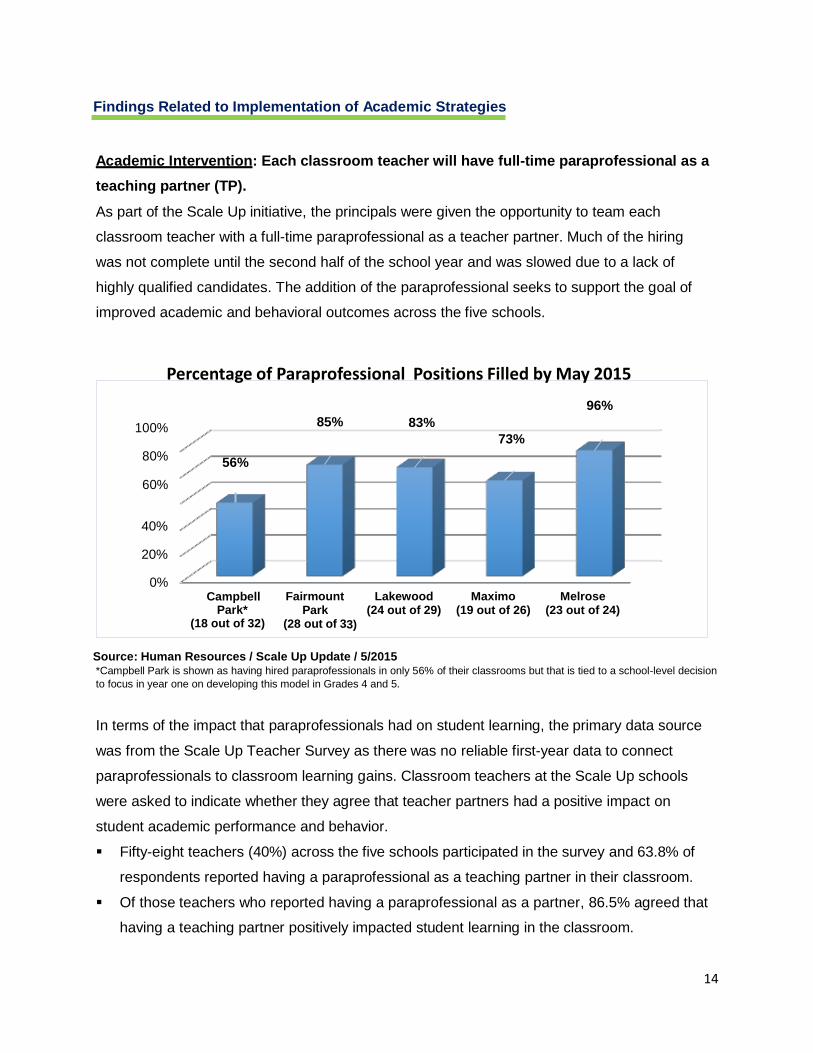
Findings Related to Implementation of Academic Strategies Academic Intervention: Each classroom teacher will have full-time paraprofessional as a
teaching partner (TP).
As part of the Scale Up initiative, the principals were given the opportunity to team each
classroom teacher with a full-time paraprofessional as a teacher partner. Much of the hiring
was not complete until the second half of the school year and was slowed due to a lack of
highly qualified candidates. The addition of the paraprofessional seeks to support the goal of
improved academic and behavioral outcomes across the five schools.
Percentage of Paraprofessional Positions Filled by May 2015
100%
80%
60%
56%
85% 83%
73%
96%
40%
20%
0% Campbell Park* (18 out of 32)
Fairmount Park (28 out of 33)
Lakewood
(24 out of 29)
Maximo
(19 out of 26)
Melrose
(23 out of 24)
Source: Human Resources / Scale Up Update / 5/2015 *Campbell Park is shown as having hired paraprofessionals in only 56% of their classrooms but that is tied to a school-level decision
to focus in year one on developing this model in Grades 4 and 5.
In terms of the impact that paraprofessionals had on student learning, the primary data source
was from the Scale Up Teacher Survey as there was no reliable first-year data to connect
paraprofessionals to classroom learning gains. Classroom teachers at the Scale Up schools
were asked to indicate whether they agree that teacher partners had a positive impact on
student academic performance and behavior.
Fifty-eight teachers (40%) across the five schools participated in the survey and 63.8% of
respondents reported having a paraprofessional as a teaching partner in their classroom.
Of those teachers who reported having a paraprofessional as a partner, 86.5% agreed that
having a teaching partner positively impacted student learning in the classroom.
15
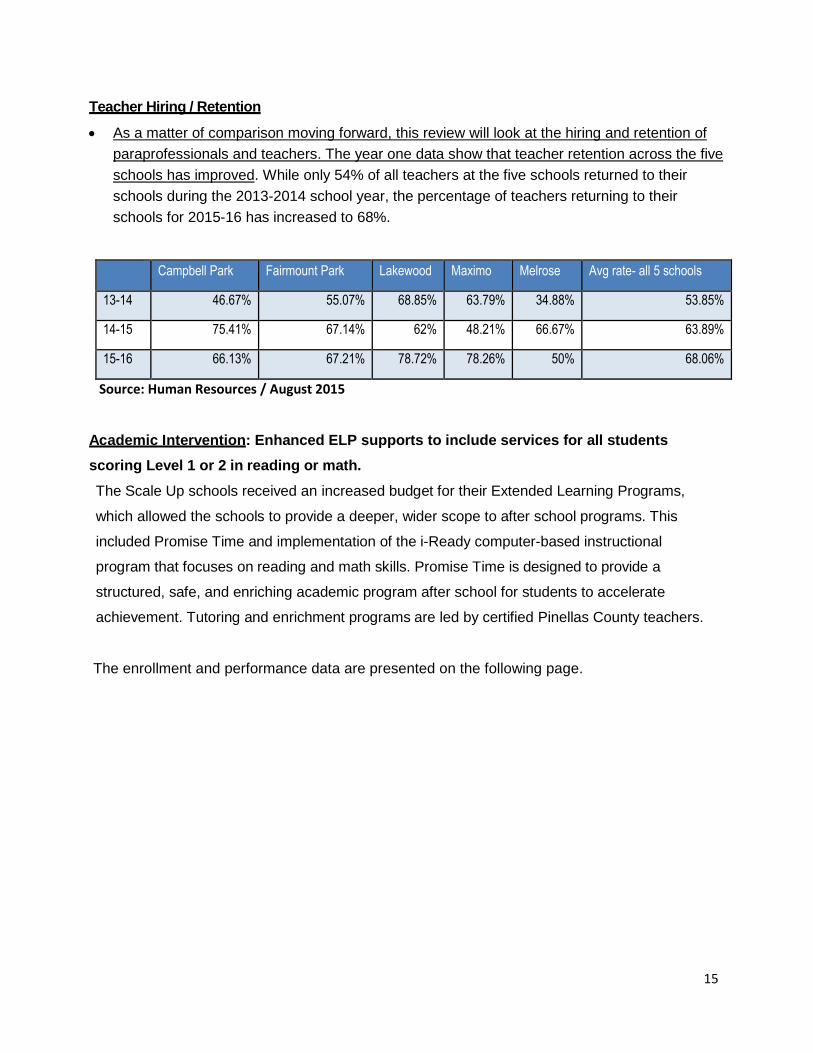
Teacher Hiring / Retention
As a matter of comparison moving forward, this review will look at the hiring and retention of
paraprofessionals and teachers. The year one data show that teacher retention across the five
schools has improved. While only 54% of all teachers at the five schools returned to their
schools during the 2013-2014 school year, the percentage of teachers returning to their
schools for 2015-16 has increased to 68%.
Campbell Park Fairmount Park Lakewood Maximo Melrose Avg rate- all 5 schools
13-14 46.67% 55.07% 68.85% 63.79% 34.88% 53.85%
14-15 75.41% 67.14% 62% 48.21% 66.67% 63.89%
15-16 66.13% 67.21% 78.72% 78.26% 50% 68.06%
Source: Human Resources / August 2015
Academic Intervention: Enhanced ELP supports to include services for all students
scoring Level 1 or 2 in reading or math.
The Scale Up schools received an increased budget for their Extended Learning Programs,
which allowed the schools to provide a deeper, wider scope to after school programs. This
included Promise Time and implementation of the i-Ready computer-based instructional
program that focuses on reading and math skills. Promise Time is designed to provide a
structured, safe, and enriching academic program after school for students to accelerate
achievement. Tutoring and enrichment programs are led by certified Pinellas County teachers.
The enrollment and performance data are presented on the following page.
16
Nu
mb
er
of
Stu
de
nts
Summary of Promise Time Enrollment and Growth Data
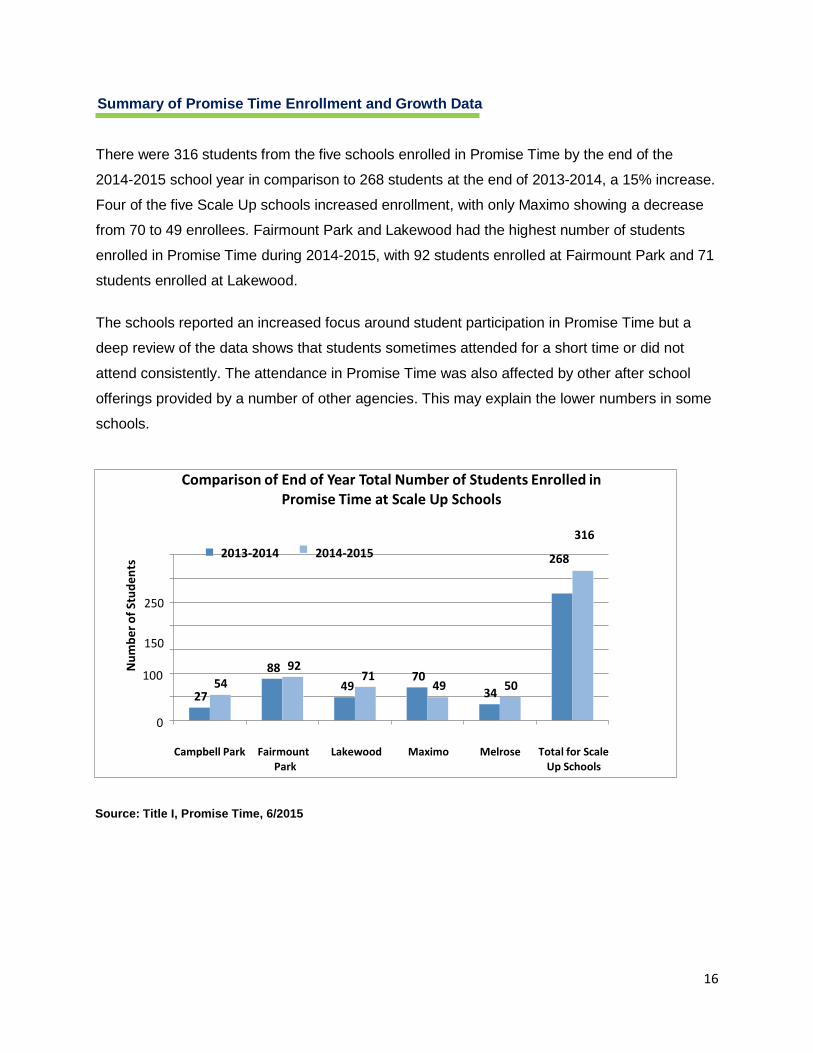
There were 316 students from the five schools enrolled in Promise Time by the end of the
2014-2015 school year in comparison to 268 students at the end of 2013-2014, a 15% increase.
Four of the five Scale Up schools increased enrollment, with only Maximo showing a decrease
from 70 to 49 enrollees. Fairmount Park and Lakewood had the highest number of students
enrolled in Promise Time during 2014-2015, with 92 students enrolled at Fairmount Park and 71
students enrolled at Lakewood.
The schools reported an increased focus around student participation in Promise Time but a
deep review of the data shows that students sometimes attended for a short time or did not
attend consistently. The attendance in Promise Time was also affected by other after school
offerings provided by a number of other agencies. This may explain the lower numbers in some
schools.
Comparison of End of Year Total Number of Students Enrolled in Promise Time at Scale Up Schools
250
150
2013-2014 2014-2015
268
316
100 54
27
0
88 92 71
49
70 49
34 50
Campbell Park Fairmount Park
Lakewood Maximo Melrose Total for Scale Up Schools
Source: Title I, Promise Time, 6/2015
17
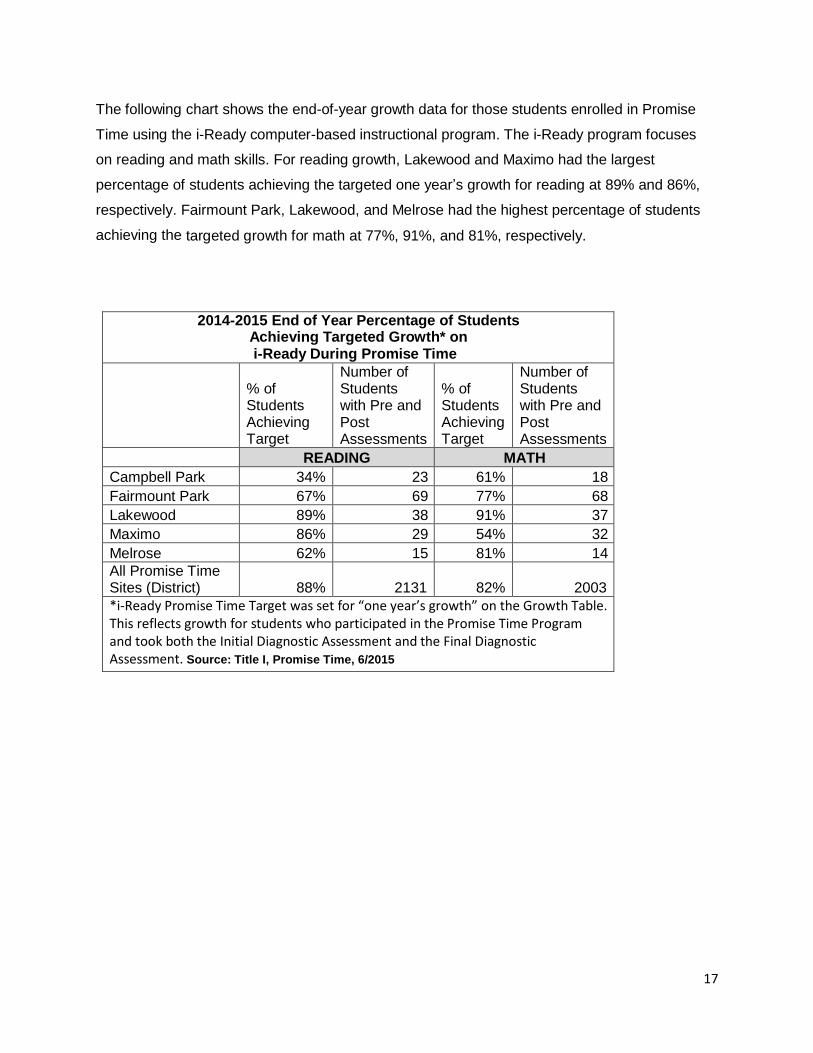
The following chart shows the end-of-year growth data for those students enrolled in Promise
Time using the i-Ready computer-based instructional program. The i-Ready program focuses
on reading and math skills. For reading growth, Lakewood and Maximo had the largest
percentage of students achieving the targeted one year’s growth for reading at 89% and 86%,
respectively. Fairmount Park, Lakewood, and Melrose had the highest percentage of students
achieving the targeted growth for math at 77%, 91%, and 81%, respectively.
2014-2015 End of Year Percentage of Students
Achieving Targeted Growth* on i-Ready During Promise Time
% of Students Achieving Target
Number of Students with Pre and Post Assessments
% of Students Achieving Target
Number of Students with Pre and Post Assessments
READING MATH
Campbell Park 34% 23 61% 18
Fairmount Park 67% 69 77% 68
Lakewood 89% 38 91% 37
Maximo 86% 29 54% 32
Melrose 62% 15 81% 14
All Promise Time Sites (District)
88%
2131
82%
2003
*i-Ready Promise Time Target was set for “one year’s growth” on the Growth Table. This reflects growth for students who participated in the Promise Time Program and took both the Initial Diagnostic Assessment and the Final Diagnostic Assessment. Source: Title I, Promise Time, 6/2015
18
Findings Related to Academic Achievement Outcomes
Summary of Grades 1 and 2 Reading -- Stanford Achievement Test (SAT-10)
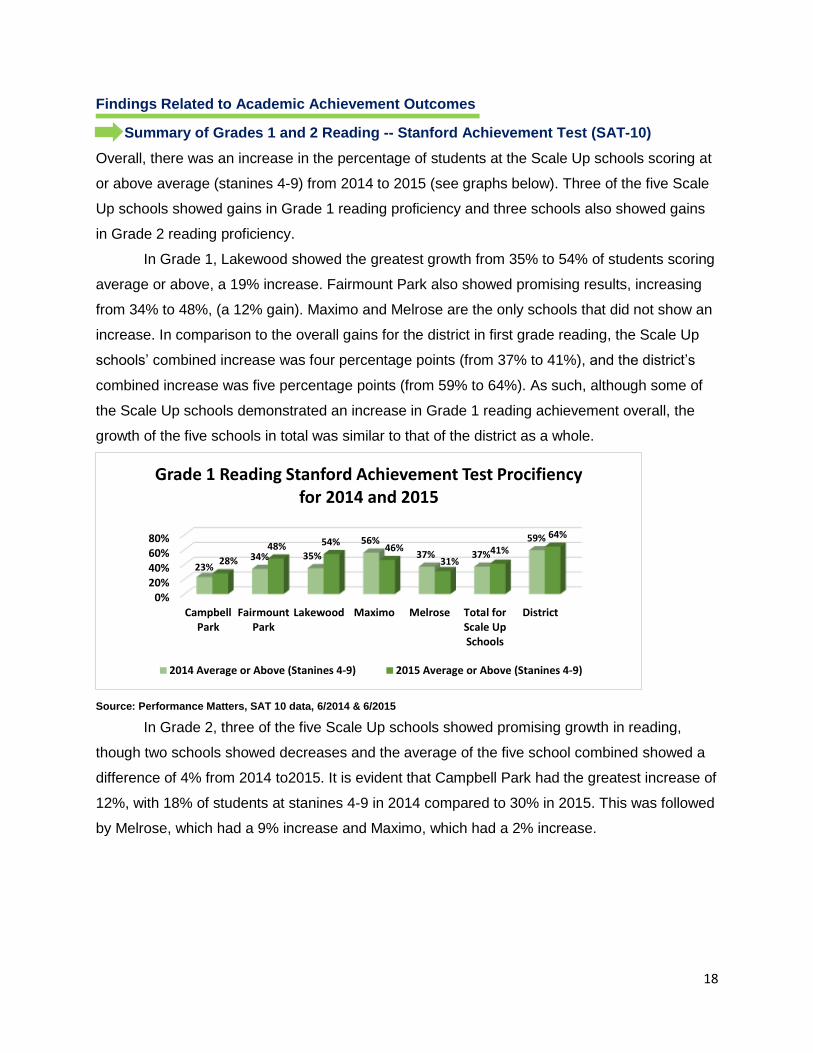
Overall, there was an increase in the percentage of students at the Scale Up schools scoring at
or above average (stanines 4-9) from 2014 to 2015 (see graphs below). Three of the five Scale
Up schools showed gains in Grade 1 reading proficiency and three schools also showed gains
in Grade 2 reading proficiency.
In Grade 1, Lakewood showed the greatest growth from 35% to 54% of students scoring
average or above, a 19% increase. Fairmount Park also showed promising results, increasing
from 34% to 48%, (a 12% gain). Maximo and Melrose are the only schools that did not show an
increase. In comparison to the overall gains for the district in first grade reading, the Scale Up
schools’ combined increase was four percentage points (from 37% to 41%), and the district’s
combined increase was five percentage points (from 59% to 64%). As such, although some of
the Scale Up schools demonstrated an increase in Grade 1 reading achievement overall, the
growth of the five schools in total was similar to that of the district as a whole.
Source: Performance Matters, SAT 10 data, 6/2014 & 6/2015
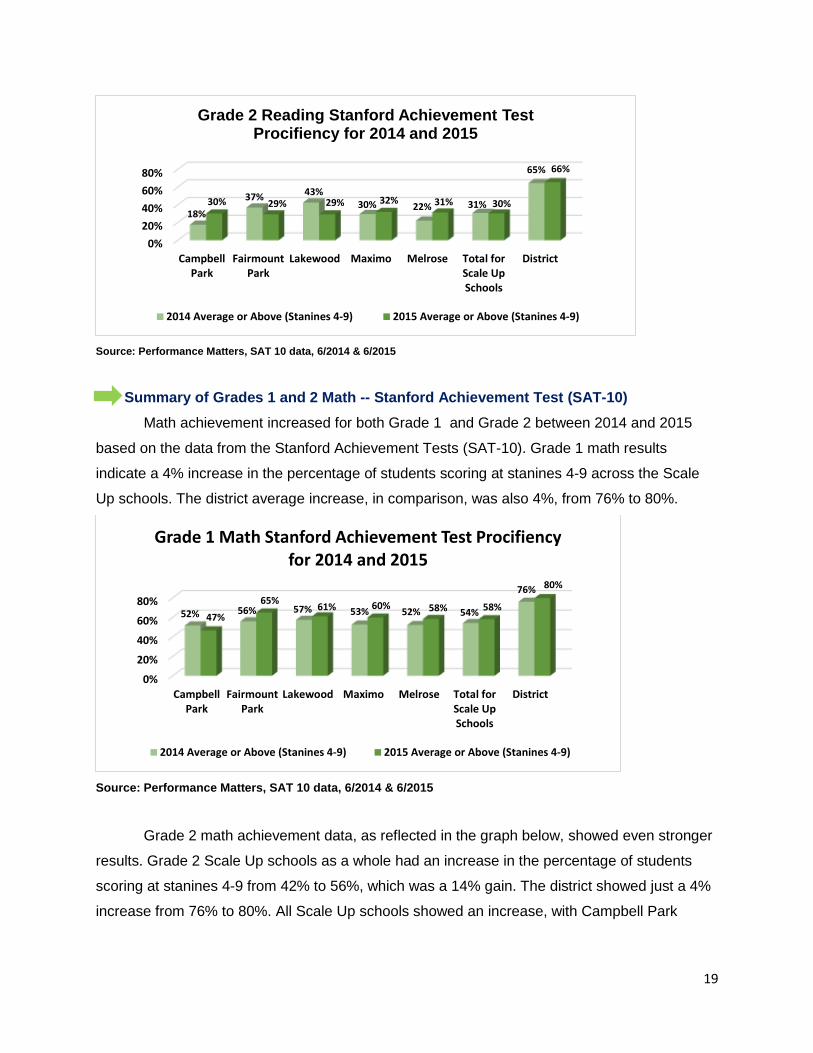
In Grade 2, three of the five Scale Up schools showed promising growth in reading,
though two schools showed decreases and the average of the five school combined showed a
difference of 4% from 2014 to2015. It is evident that Campbell Park had the greatest increase of
12%, with 18% of students at stanines 4-9 in 2014 compared to 30% in 2015. This was followed
by Melrose, which had a 9% increase and Maximo, which had a 2% increase.
0%20%40%60%80%
CampbellPark
FairmountPark
Lakewood Maximo Melrose Total forScale UpSchools
District
23%34% 35%
56%
37% 37%
59%
28%
48% 54%46%
31%41%
64%
Grade 1 Reading Stanford Achievement Test Procifiency for 2014 and 2015
2014 Average or Above (Stanines 4-9) 2015 Average or Above (Stanines 4-9)
19
Source: Performance Matters, SAT 10 data, 6/2014 & 6/2015
Summary of Grades 1 and 2 Math -- Stanford Achievement Test (SAT-10)
Math achievement increased for both Grade 1 and Grade 2 between 2014 and 2015
based on the data from the Stanford Achievement Tests (SAT-10). Grade 1 math results
indicate a 4% increase in the percentage of students scoring at stanines 4-9 across the Scale
Up schools. The district average increase, in comparison, was also 4%, from 76% to 80%.
Source: Performance Matters, SAT 10 data, 6/2014 & 6/2015
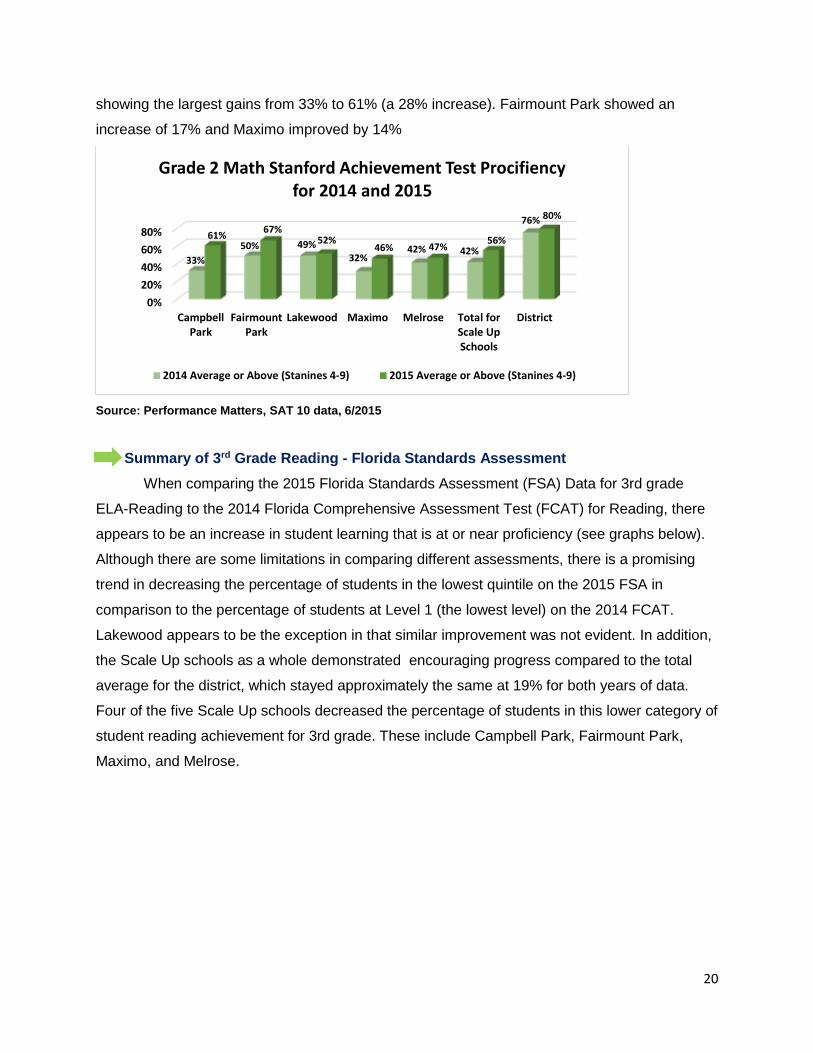
Grade 2 math achievement data, as reflected in the graph below, showed even stronger
results. Grade 2 Scale Up schools as a whole had an increase in the percentage of students
scoring at stanines 4-9 from 42% to 56%, which was a 14% gain. The district showed just a 4%
increase from 76% to 80%. All Scale Up schools showed an increase, with Campbell Park
0%
20%
40%
60%
80%
CampbellPark
FairmountPark
Lakewood Maximo Melrose Total forScale UpSchools
District
18%
37% 43%30% 22% 31%
65%
30% 29% 29% 32% 31% 30%
66%
Grade 2 Reading Stanford Achievement Test Procifiency for 2014 and 2015
2014 Average or Above (Stanines 4-9) 2015 Average or Above (Stanines 4-9)
0%
20%
40%
60%
80%
CampbellPark
FairmountPark
Lakewood Maximo Melrose Total forScale UpSchools
District
52% 56% 57% 53% 52% 54%
76%
47%
65%61% 60% 58% 58%
80%
Grade 1 Math Stanford Achievement Test Procifiency for 2014 and 2015
2014 Average or Above (Stanines 4-9) 2015 Average or Above (Stanines 4-9)
20
showing the largest gains from 33% to 61% (a 28% increase). Fairmount Park showed an
increase of 17% and Maximo improved by 14%
Source: Performance Matters, SAT 10 data, 6/2015
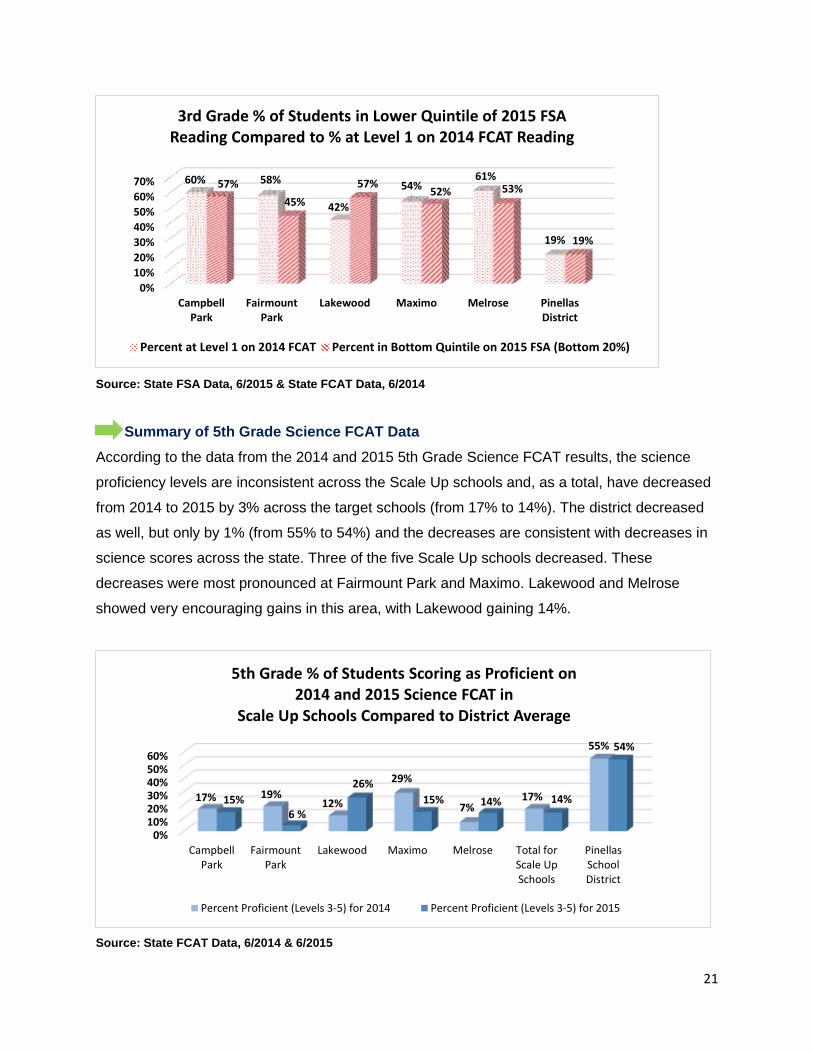
Summary of 3rd Grade Reading - Florida Standards Assessment
When comparing the 2015 Florida Standards Assessment (FSA) Data for 3rd grade
ELA-Reading to the 2014 Florida Comprehensive Assessment Test (FCAT) for Reading, there
appears to be an increase in student learning that is at or near proficiency (see graphs below).
Although there are some limitations in comparing different assessments, there is a promising
trend in decreasing the percentage of students in the lowest quintile on the 2015 FSA in
comparison to the percentage of students at Level 1 (the lowest level) on the 2014 FCAT.
Lakewood appears to be the exception in that similar improvement was not evident. In addition,
the Scale Up schools as a whole demonstrated encouraging progress compared to the total
average for the district, which stayed approximately the same at 19% for both years of data.
Four of the five Scale Up schools decreased the percentage of students in this lower category of
student reading achievement for 3rd grade. These include Campbell Park, Fairmount Park,
Maximo, and Melrose.
0%
20%
40%
60%
80%
CampbellPark
FairmountPark
Lakewood Maximo Melrose Total forScale UpSchools
District
33%
50% 49%32%
42% 42%
76%
61%67%
52%46% 47%
56%
80%
Grade 2 Math Stanford Achievement Test Procifiency for 2014 and 2015
2014 Average or Above (Stanines 4-9) 2015 Average or Above (Stanines 4-9)
21
Source: State FSA Data, 6/2015 & State FCAT Data, 6/2014
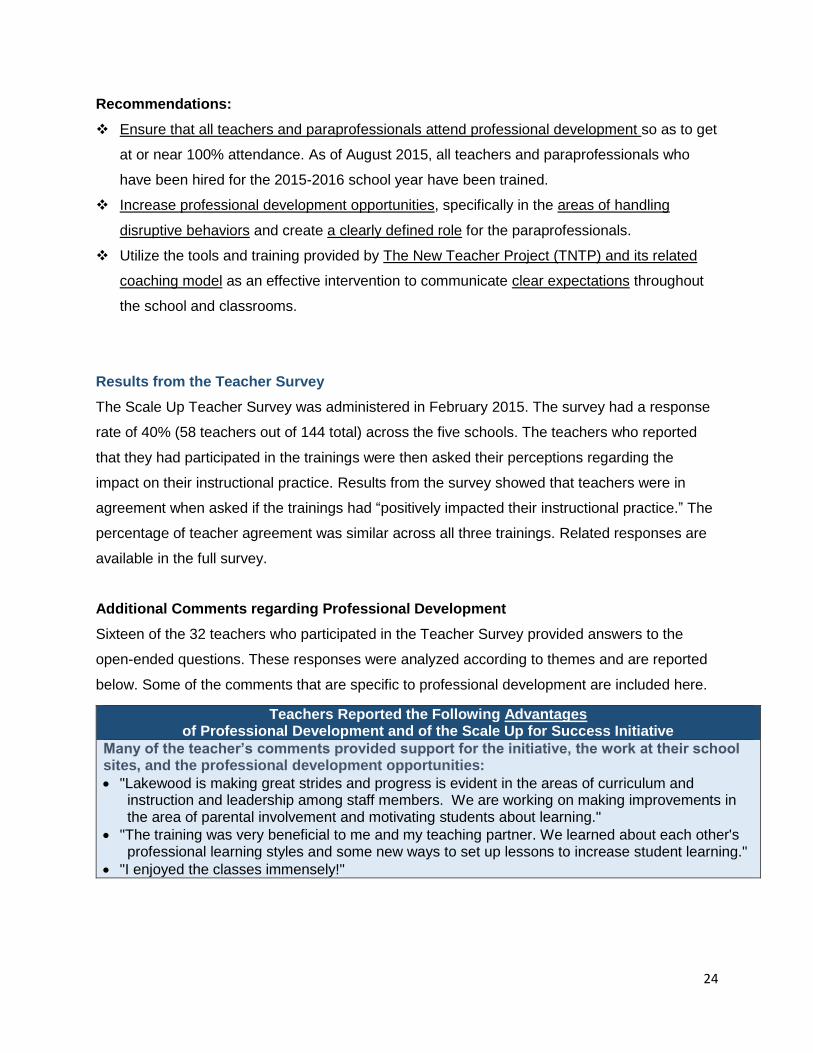
Summary of 5th Grade Science FCAT Data
According to the data from the 2014 and 2015 5th Grade Science FCAT results, the science
proficiency levels are inconsistent across the Scale Up schools and, as a total, have decreased
from 2014 to 2015 by 3% across the target schools (from 17% to 14%). The district decreased
as well, but only by 1% (from 55% to 54%) and the decreases are consistent with decreases in
science scores across the state. Three of the five Scale Up schools decreased. These
decreases were most pronounced at Fairmount Park and Maximo. Lakewood and Melrose
showed very encouraging gains in this area, with Lakewood gaining 14%.
Source: State FCAT Data, 6/2014 & 6/2015
0%
10%
20%
30%
40%
50%
60%
70%
CampbellPark
FairmountPark
Lakewood Maximo Melrose PinellasDistrict
60% 58%
42%
54%61%
19%
57%
45%
57%52% 53%
19%
3rd Grade % of Students in Lower Quintile of 2015 FSA Reading Compared to % at Level 1 on 2014 FCAT Reading
Percent at Level 1 on 2014 FCAT Percent in Bottom Quintile on 2015 FSA (Bottom 20%)
0%10%20%30%40%50%60%
CampbellPark
FairmountPark
Lakewood Maximo Melrose Total forScale UpSchools
PinellasSchoolDistrict
17% 19%12%
29%
7%17%
55%
15%6 %
26%
15% 14% 14%
54%
5th Grade % of Students Scoring as Proficient on 2014 and 2015 Science FCAT in
Scale Up Schools Compared to District Average
Percent Proficient (Levels 3-5) for 2014 Percent Proficient (Levels 3-5) for 2015

22
23
Findings: Professional Development
for Teachers and Paraprofessionals
Professional Development Intervention: Each teacher and paraprofessional will receive
ongoing professional development.
Strengths in Professional Development
Conclusions:
There has been a steady increase in training for the teachers and paraprofessionals, with
53-60 teachers attending separate Phase I-Phase III trainings and 43-47 paraprofessionals
attending these same trainings during Year 1. This represents between 37% and 42% of all
teachers and paraprofessionals in the five schools. A larger percentage of teachers and
paraprofessionals might have been trained had the hiring of paraprofessionals been at or
near 100%. As of August 2015, the training was required as part of the pre-school planning.
These trainings are designed to provide both the teachers and paraprofessionals with a
better understanding of how to partner and improve student learning and were conducted
during the 2014-15 school year as the paraprofessionals came on board. These three
phases were: Personality Styles, Co-teaching Methods and Culturally Responsive
Instruction. There were three cycles tied to these trainings: two three-day sessions in the
Fall of 2014 and one three-day session in the Spring of 2015.
Paraprofessionals overwhelmingly stated that they agree or strongly agree that the trainings
helped support their learning in several areas (89%-100% agreeing or strongly agreeing).
Paraprofessionals also indicated that they believe that there should be more training
provided, with 55% indicating this for the Phase I-III Trainings and 39% for the Intervention
Hour Trainings.
Overall, there was positive feedback from both teacher and paraprofessionals who attended
the Phase I-III trainings based on open ended comments.
Three of the principals suggested in the Principal Survey (see Leadership section) that more
professional development related to teacher effectiveness and improving instructional
practice was needed.
24
Recommendations:
Ensure that all teachers and paraprofessionals attend professional development so as to get
at or near 100% attendance. As of August 2015, all teachers and paraprofessionals who
have been hired for the 2015-2016 school year have been trained.
Increase professional development opportunities, specifically in the areas of handling
disruptive behaviors and create a clearly defined role for the paraprofessionals.
Utilize the tools and training provided by The New Teacher Project (TNTP) and its related
coaching model as an effective intervention to communicate clear expectations throughout
the school and classrooms.
Results from the Teacher Survey
The Scale Up Teacher Survey was administered in February 2015. The survey had a response
rate of 40% (58 teachers out of 144 total) across the five schools. The teachers who reported
that they had participated in the trainings were then asked their perceptions regarding the
impact on their instructional practice. Results from the survey showed that teachers were in
agreement when asked if the trainings had “positively impacted their instructional practice.” The
percentage of teacher agreement was similar across all three trainings. Related responses are
available in the full survey.
Additional Comments regarding Professional Development
Sixteen of the 32 teachers who participated in the Teacher Survey provided answers to the
open-ended questions. These responses were analyzed according to themes and are reported
below. Some of the comments that are specific to professional development are included here.
Teachers Reported the Following Advantages of Professional Development and of the Scale Up for Success Initiative
Many of the teacher’s comments provided support for the initiative, the work at their school sites, and the professional development opportunities:
"Lakewood is making great strides and progress is evident in the areas of curriculum and instruction and leadership among staff members. We are working on making improvements in the area of parental involvement and motivating students about learning."
"The training was very beneficial to me and my teaching partner. We learned about each other's professional learning styles and some new ways to set up lessons to increase student learning."
"I enjoyed the classes immensely!"
25
Paraprofessionals
The evaluation team conducted a survey of paraprofessionals across all five Scale Up schools
in the Spring of 2015 to gauge the perceived effectiveness of the professional development
trainings. The professional development sessions included content area training in addition to
the Phase I–III trainings referenced above. These content areas included Elementary Language
Arts, Math and Science. They were also provided training specific to the Intervention Hour:
Leveled Literacy Intervention (LLI), Repeated Reading Routine, Guided Reading, and Nemours.
Results from the Paraprofessional Survey
The survey had a response rate of 83%. A summary of the survey results are presented below.
Results from the survey demonstrated a high level of agreement that Phase I-III trainings met
their goals. In particular, paraprofessionals stated that they agree or strongly agree that the
trainings helped support their learning in the following areas (89% to 100% agreeing or strongly
agreeing):
Work professionally with the classroom teacher.
Deal with conflict in the classroom.
Decide which instructional approach is best suited for the lesson.
Ensure that each student is getting the instruction he / she needs to optimize their learning.
Understand culturally responsive instruction.
Implement culturally responsive instruction in my classroom.
In addition, the paraprofessionals rated their level of agreement with the identified professional
development outcomes of the Intervention Hour trainings. These results also indicated a high
level of agreement that the trainings supported their learning in the following areas (from 93% to
95% agreeing or strongly agreeing):
Teachers Reported the Following Ways to Enhance Professional Development and of the Scale Up for Success Initiative
Teachers provided some suggestions about the professional development, which emphasized the need to hire more paraprofessionals and to have them hired earlier in the school year:
“As a fourth grade teacher, I did attend the meetings for getting to know your teacher partner. However, I did not receive a teaching partner. I feel that a partner would greatly impact the student achievement and student behavior.”
“Paraprofessionals need to be hired much earlier than they were hired this year.”
26
“The training I received…”
Prepared me to perform essential responsibilities during the Intervention Hour.
Taught me skills that I apply during the Intervention Hour.
Provided resources that are useful during the Intervention Hour.
Was aligned to my assigned classroom intervention duties during the Intervention Hour
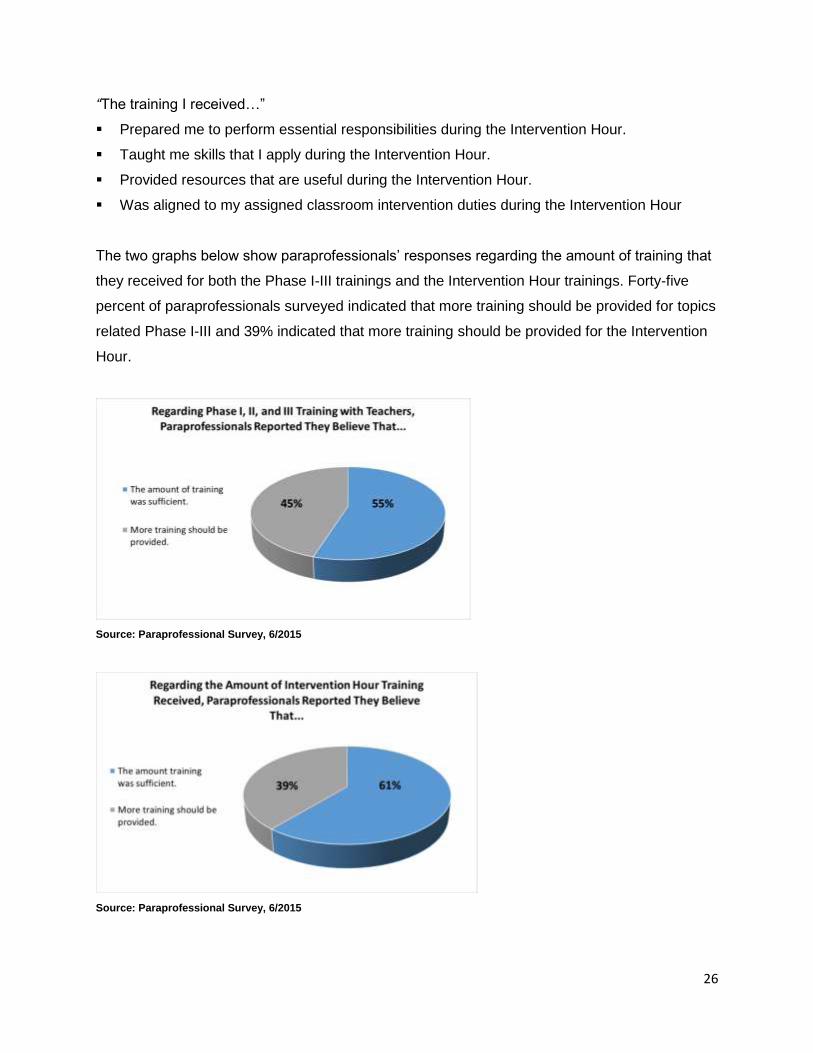
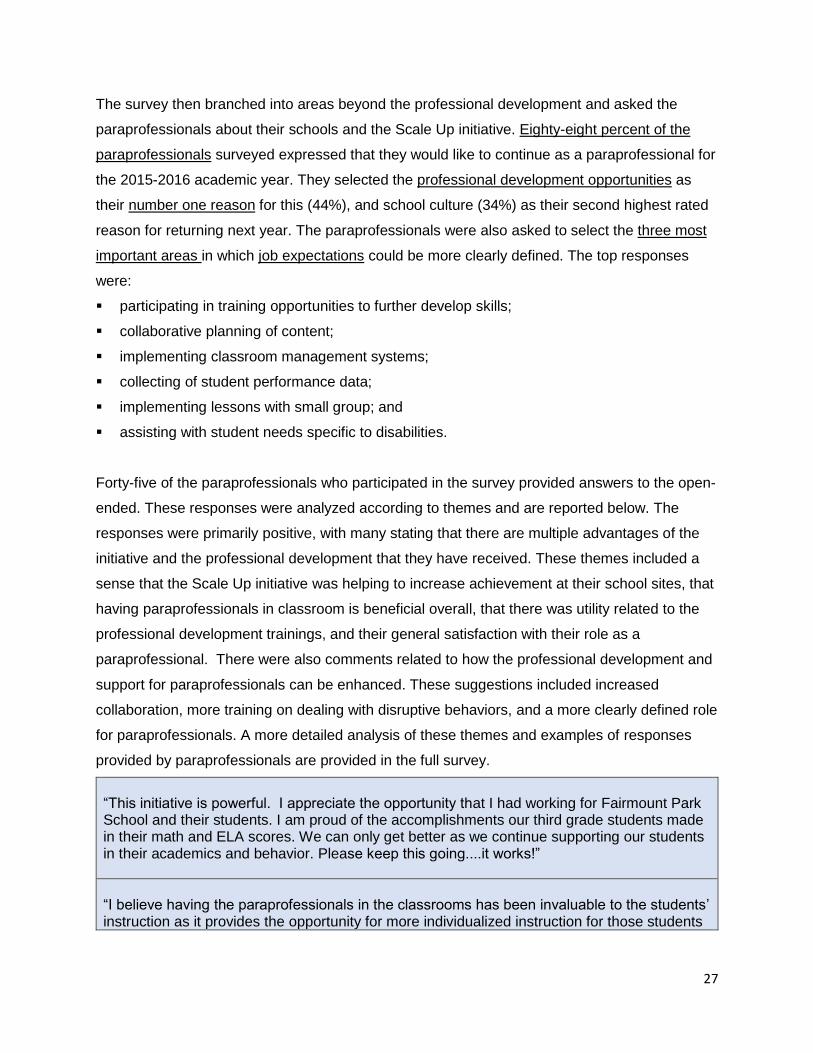
The two graphs below show paraprofessionals’ responses regarding the amount of training that
they received for both the Phase I-III trainings and the Intervention Hour trainings. Forty-five
percent of paraprofessionals surveyed indicated that more training should be provided for topics
related Phase I-III and 39% indicated that more training should be provided for the Intervention
Hour.
Source: Paraprofessional Survey, 6/2015
Source: Paraprofessional Survey, 6/2015
27
The survey then branched into areas beyond the professional development and asked the
paraprofessionals about their schools and the Scale Up initiative. Eighty-eight percent of the
paraprofessionals surveyed expressed that they would like to continue as a paraprofessional for
the 2015-2016 academic year. They selected the professional development opportunities as
their number one reason for this (44%), and school culture (34%) as their second highest rated
reason for returning next year. The paraprofessionals were also asked to select the three most
important areas in which job expectations could be more clearly defined. The top responses
were:
participating in training opportunities to further develop skills;
collaborative planning of content;
implementing classroom management systems;
collecting of student performance data;
implementing lessons with small group; and
assisting with student needs specific to disabilities.
Forty-five of the paraprofessionals who participated in the survey provided answers to the open-
ended. These responses were analyzed according to themes and are reported below. The
responses were primarily positive, with many stating that there are multiple advantages of the
initiative and the professional development that they have received. These themes included a
sense that the Scale Up initiative was helping to increase achievement at their school sites, that
having paraprofessionals in classroom is beneficial overall, that there was utility related to the
professional development trainings, and their general satisfaction with their role as a
paraprofessional. There were also comments related to how the professional development and
support for paraprofessionals can be enhanced. These suggestions included increased
collaboration, more training on dealing with disruptive behaviors, and a more clearly defined role
for paraprofessionals. A more detailed analysis of these themes and examples of responses
provided by paraprofessionals are provided in the full survey.
“This initiative is powerful. I appreciate the opportunity that I had working for Fairmount Park School and their students. I am proud of the accomplishments our third grade students made in their math and ELA scores. We can only get better as we continue supporting our students in their academics and behavior. Please keep this going....it works!”
“I believe having the paraprofessionals in the classrooms has been invaluable to the students’ instruction as it provides the opportunity for more individualized instruction for those students
28
who both need it and crave it. Please continue this program to help the children of this community get on track and have a brighter outlook on school/education…”
“I think the program is very good in that it allows for at least two adult professionals in the classroom. However more responsibilities can be allotted to the paraprofessional with the relevant training.”
“The paraprofessional is a valuable asset in the classroom, hence the role should be clearly designed to get the maximum benefit of this resource.”
Source: Paraprofessional Survey, 6/2015
29
Behavior Findings
Overview
Much like the previous sections of this report, the behavioral findings serve as Year 1 (baseline)
data regarding the Scale Up for Success Initiative. The data included in this section will include
two areas of focus related to improving behavior and learning climate (1) data related to the
implementation of Positive Behavior Supports (PBS) at each school site and (2) data related to
the hiring of additional intervention personnel to support students’ social and behavioral needs,
especially in light of the intent to reduce “repeat offender” students who lose quite a bit of
instructional time. The report presents baseline data specific to the number and degree of
referrals given at each school. Though results are preliminary and cannot be tied to any specific
intervention, some of the data related to referrals, repeated misbehavior and learning climate
are promising.
Behavior Intervention: The schools will implement PBS with ongoing training and
support through the University of South Florida.
Each school developed a school-wide behavior plan, established a school-based PBS
leadership team to lead this behavioral support plan, and had their PBS team attend on-going
monthly training sessions conducted by the University of South Florida.
PBS is rooted in a belief system around routines and reinforcing positive behaviors. It is based
on understanding why problem behaviors occur – ie. the behavior's function. This approach to
behavior can occur on a school-wide level, in a specific setting or classroom, or with an
individual student. PBS is the application of evidence-based strategies and systems to assist
schools to increase academic performance, increase safety, decrease problem behavior, and
establish positive school cultures (http://flpbs.fmhi.usf.edu).”
Results from Benchmarks of Quality (BOQ) Data for PBS Implementation
Each of the schools was charged with completing the Benchmarks of Quality for School-wide
Positive Behavior Support self-assessment during the Spring of 2015. The BOQ data is a
research-based instrument to measure the schools’ self-reported implementation of PBS. The
benchmarks are used to identify areas of success, areas for improvement and to identify model
PBS schools. The assessment included 53 items that were to be completed first by the PBS
behavior coach and then by each team member.
30
The BOQ data revealed inconsistent results across the five schools. Two of the five schools
improved their overall PBS implementation, while the others scores declined regarding the
implementation of PBS as it relates to the BOQ data.
Across the five schools, the schools tended to rate themselves highest in two areas: (1)
effective procedures for dealing with discipline and (2) expectations and rules developed.
Effective procedures included having a narrative in place that described the discipline process
and problem behaviors are defined and major/minor behaviors are clearly differentiated.
Expectations and rules developed included factors such as posting three to five positively stated
school-wide procedures around the school, expectations that apply to both students and staff
and rules that are linked to expectations.
Areas that tended to score the lowest by the PBS teams included a consistent behavioral lesson
plan, a rewards program and the implementation plan. A deeper examination into each area
revealed that lesson plan included a behavioral curriculum that outlined teacher’s expectations
and rules. These lessons involved both examples and non-examples. The rewards program
involved rewards that are varied to maintain student interest and includes incentives for
staff/faculty. The implementation plan included a curriculum that teaches the components of the
discipline system to all staff and ensures its use.
Feedback from TNTP
It is important to point out here that feedback from TNTP representatives in the schools is
consistent with the BOQ data described above. The research-based instruments from TNTP –
both from surveys and classroom visitation protocols – show some consistent need areas for
the five schools related to behavior and learning environment. Those include:
A lack of consistent, shared expectations around the learning environment.
A lack of consistent roles for leaders, teachers and support staff.
A growing but still inadequate foundation for what they call “conditions for success.” This
includes how students function in a classroom, how to re-engage students who are off
task, and how improved lesson planning can improve time on task.
The feedback from TNTP suggests that Campbell Park may be ahead of the other schools in
light of that school’s longer relationship to the project.
31
Conclusions Related to Behavior Outcomes
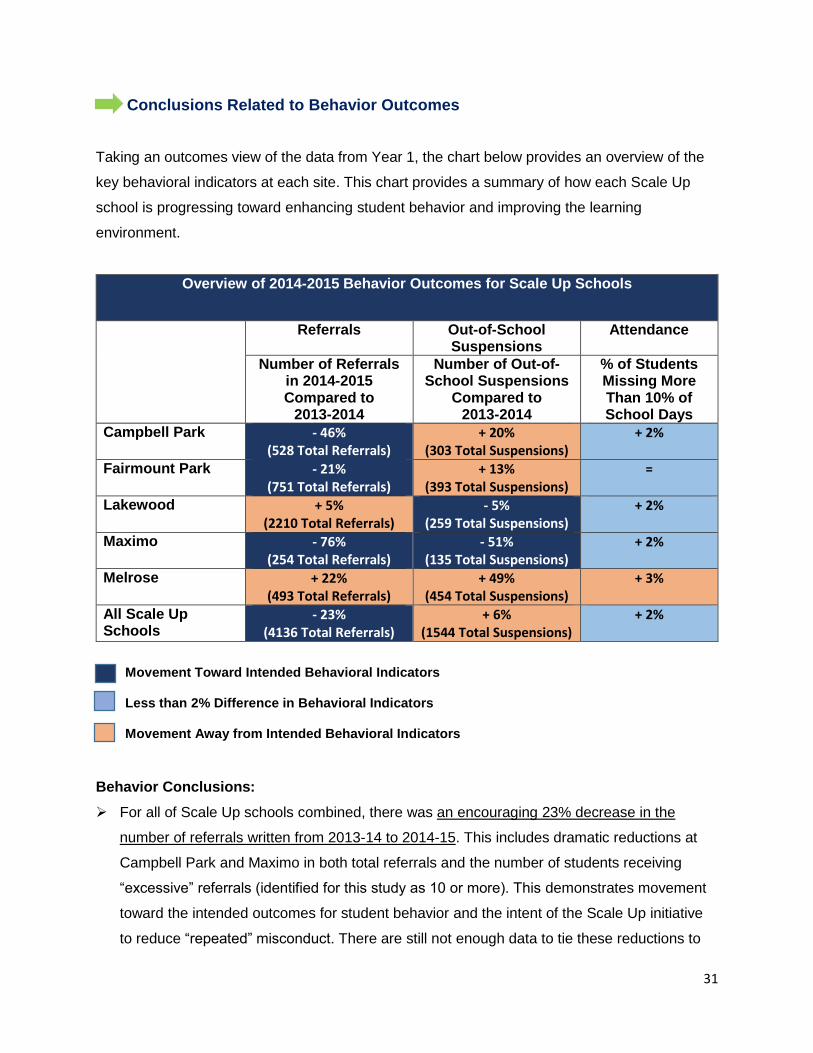
Taking an outcomes view of the data from Year 1, the chart below provides an overview of the
key behavioral indicators at each site. This chart provides a summary of how each Scale Up
school is progressing toward enhancing student behavior and improving the learning
environment.
Overview of 2014-2015 Behavior Outcomes for Scale Up Schools
Referrals Out-of-School Suspensions
Attendance
Number of Referrals in 2014-2015 Compared to
2013-2014
Number of Out-of-School Suspensions
Compared to 2013-2014
% of Students Missing More Than 10% of School Days
Campbell Park - 46% (528 Total Referrals)
+ 20% (303 Total Suspensions)
+ 2%
Fairmount Park - 21% (751 Total Referrals)
+ 13% (393 Total Suspensions)
=
Lakewood + 5% (2210 Total Referrals)
- 5% (259 Total Suspensions)
+ 2%
Maximo - 76% (254 Total Referrals)
- 51% (135 Total Suspensions)
+ 2%
Melrose + 22% (493 Total Referrals)
+ 49% (454 Total Suspensions)
+ 3%
All Scale Up Schools
- 23% (4136 Total Referrals)
+ 6% (1544 Total Suspensions)
+ 2%
Movement Toward Intended Behavioral Indicators Less than 2% Difference in Behavioral Indicators Movement Away from Intended Behavioral Indicators
Behavior Conclusions:
For all of Scale Up schools combined, there was an encouraging 23% decrease in the
number of referrals written from 2013-14 to 2014-15. This includes dramatic reductions at
Campbell Park and Maximo in both total referrals and the number of students receiving
“excessive” referrals (identified for this study as 10 or more). This demonstrates movement
toward the intended outcomes for student behavior and the intent of the Scale Up initiative
to reduce “repeated” misconduct. There are still not enough data to tie these reductions to
32
the increased use of PBS, the involvement of TNTP, the hiring of additional support
personnel, or the involvement of paraprofessionals in the classroom or improved teaching
practices.
o Nearly half (48%) of the total referrals across the five schools were due to Striking a
Student or Fighting, incidences where a referral is required under the district’s Code
of Student Conduct.
The total number of suspensions across the five Scale Up schools increased by 6%. Two of
the five schools showed a decrease, with the largest decrease at Maximo (a drop of 51%
from 2013-14 to 2014-15). One explanation for the drop in referrals and increase in
suspensions is likely tied to the higher incidences of “striking a student” and “fighting” that
typically lead to suspensions.
Overall, there were minimal changes in the attendance data when looking at the percentage
of students missing 10% or more of school days. These percentages went up slightly at four
of the five Scale Up schools and stayed approximately the same at Fairmount Park.
Recommendations:
The schools should continue their emphasis on reducing the number of referrals and out of
school suspensions (OSS) using the current strategies that they are using and with an
emphasis on using PBS strategies to create a more focused and positive school
environment. For those schools that had increases in the number of referrals, a more
consistent use of the school-wide behavior plan for reducing referrals is recommended.
The schools should continue to work with district personnel and TNTP to get rooted in the
basic foundations around securing a consistent learning environment. Research supports
“learning environment” as a key condition for success and, though related to academic
growth, should be viewed as an antecedent to learning gains.
Refine the implementation of PBS to address specific, repeated behaviors and to provide
alternatives to those behaviors.
Fully utilize the new Early Warning Systems data in Performance Matters to implement early
behavior and attendance interventions for students who may be at-risk.
33
Behavior Findings: Conclusions Based on Interventions
Behavior Intervention: The schools will implement PBS as part of their best practices.
Conclusions:
All of the five Scale Up schools implemented Positive Behavior Support (PBS) using the
Florida Positive Behavior Support Project (FLPBS) model and with training from FLPBS at
the University of South Florida.
Each of the five Scale Up schools developed a school-wide behavior plan, established a
school-based PBS leadership team to lead this behavioral support plan and had their PBS
teams attend monthly training sessions conducted by the University of South Florida.
According to the PBS leadership team’s own perceptions of implementation:
o Two areas that they rated highly in terms of implementation were procedures for
dealing with discipline and expectations and rules developed.
o Those areas that tended to score the lowest by the PBS teams included lesson
planning, the rewards program and the implementation plan.
Recommendations:
Continue to implement practices that support development of consistent school-wide
expectations and improved learning climate.
Based on Benchmark of Quality (BOQ) data related to PBS implementation, an emphasis
should be placed on:
o Strengthening the behavioral lesson planning, including a behavioral curriculum of
the teacher’s expectations and rules that includes examples and non-examples.
o Developing and enhancing a school-wide rewards program involving rewards that
are varied to maintain student interest and that includes incentives for staff/faculty.
o Ensuring that the implementation plan includes a curriculum that teaches the
components of the school-wide discipline system to all staff, and establishing
systems to monitor its development and use.
34
Results from Teacher Survey on the Perceived Impact of PBS
Teachers at the Scale Up schools were surveyed regarding the PBS supports in the schools.
Though response rates were low (between 39 and 48 teachers answered each question),
approximately 83% of teacher respondents across the five schools agreed that PBS “has been
implemented more consistently in the classrooms this year.” Among those who have used PBS
more consistently at these sites, 84.8% reported that it had “positively impacted” student
behavior in the classroom. Some school sites stood out in different areas of the survey. For
example, Fairmount Park had the lowest percentage (57%) of teachers agreeing or strongly
agreeing with the statement that “The Positive Behavioral Support (PBS) is used more
consistently in my classroom this year.” Lakewood had the lowest percentage (63.6%) agreeing
or strongly agreeing with the statement that, “The Positive Behavioral Support (PBS) has
positively impacted student behavior in my classroom.” It is interesting to note that although
Lakewood had the lowest percentage agreeing that PBS had impacted student behavior, it had
the second highest agreement in that PBS is used more consistently in their classrooms
(92.3%). This suggests that the implementation of PBS will need better consistency and further
study.
Overall, 75.9% of teacher respondents agreed that the School-Based Leadership Team (SBLT)
has supported consistent use of the school-wide behavior plan. Agreement was highest at
Maximo (91.7%) and lowest at Fairmount Park (57.1%). Among those who reported that the
SBLT had supported consistent use of the behavior plan, teachers across schools agreed that
this had positively impacted student behavior throughout the school. The exception were the
respondents at Lakewood, where agreement is at 55.6%. These percentages are further broken
down in the full survey.
Teachers were also asked to indicate their level of agreement for several items based on the
effective use of district resources to improve student learning and/or behavior at their school
sites. The results for the Scale Up schools as a whole were positive. The average percentage of
agreement within Scale Up schools that implementation of PBS was an effective use of district
resources was reported at 84.2%.
35
Behavior Intervention: Each school will have a full-time psychologist and social worker.
Full-time psychological and social work services were provided at each school for the 2014-
2015 school year. The make-up of the student services team varied by school. A typical team
was comprised of a psychologist, a social worker, an educational diagnostician, a family
navigator (funded through the Juvenile Welfare Board), and a mental health counselor (also
funded through JWB). Research from year one showed that many of the team members worked
collaboratively on an array of services and that the work differed greatly by school, typically
dependent on the strengths of the student services team and work distribution. Data related to
the number of children served in each school showed some growth from 2014 but the levels of
services and degree of success tied to individuals was not measured as part of this study. A
measure of increased student access to these services is planned for as part of the Year 2
evaluation.
36
Findings Related to Intended Behavior Outcomes
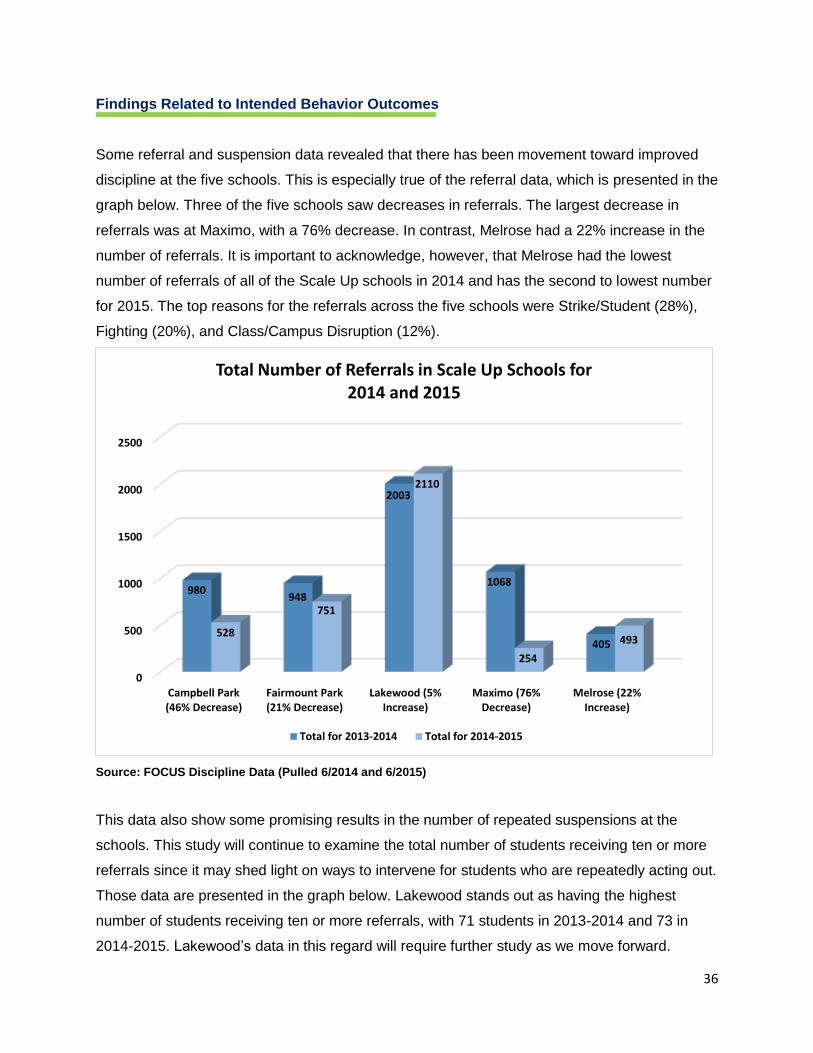
Some referral and suspension data revealed that there has been movement toward improved
discipline at the five schools. This is especially true of the referral data, which is presented in the
graph below. Three of the five schools saw decreases in referrals. The largest decrease in
referrals was at Maximo, with a 76% decrease. In contrast, Melrose had a 22% increase in the
number of referrals. It is important to acknowledge, however, that Melrose had the lowest
number of referrals of all of the Scale Up schools in 2014 and has the second to lowest number
for 2015. The top reasons for the referrals across the five schools were Strike/Student (28%),
Fighting (20%), and Class/Campus Disruption (12%).
Source: FOCUS Discipline Data (Pulled 6/2014 and 6/2015)
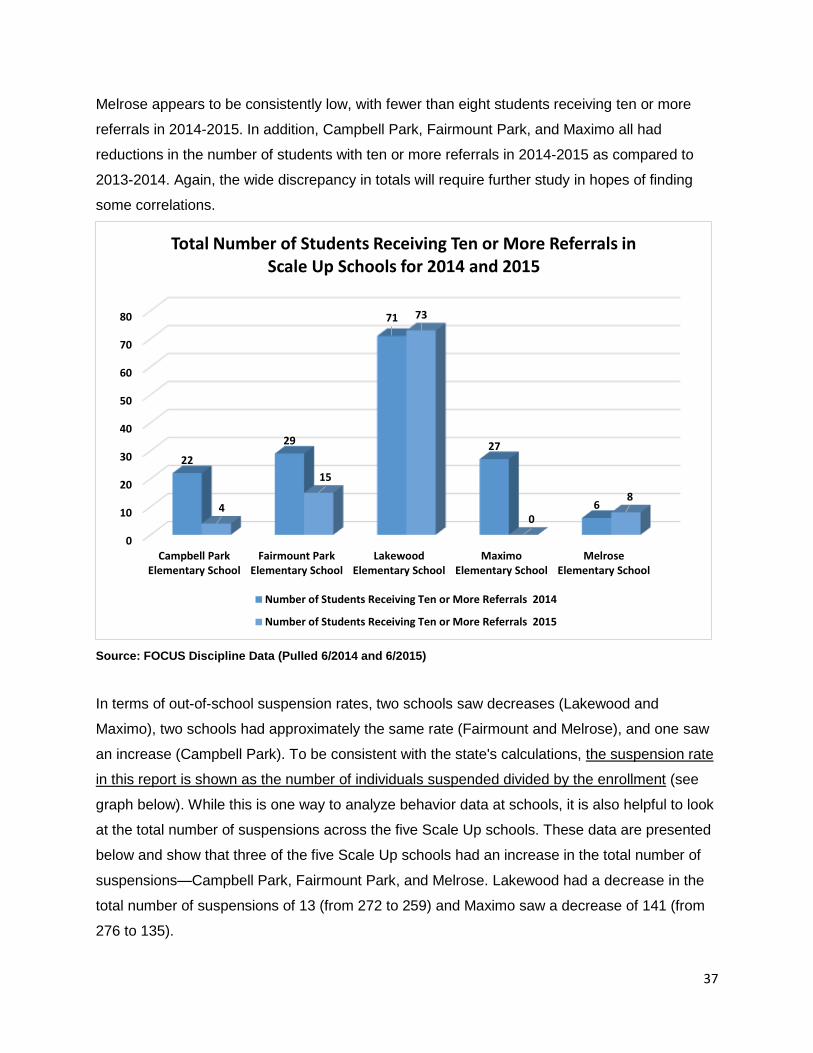
This data also show some promising results in the number of repeated suspensions at the
schools. This study will continue to examine the total number of students receiving ten or more
referrals since it may shed light on ways to intervene for students who are repeatedly acting out.
Those data are presented in the graph below. Lakewood stands out as having the highest
number of students receiving ten or more referrals, with 71 students in 2013-2014 and 73 in
2014-2015. Lakewood’s data in this regard will require further study as we move forward.
0
500
1000
1500
2000
2500
Campbell Park(46% Decrease)
Fairmount Park(21% Decrease)
Lakewood (5%Increase)
Maximo (76%Decrease)
Melrose (22%Increase)
980948
2003
1068
405528
751
2110
254
493
Total Number of Referrals in Scale Up Schools for 2014 and 2015
Total for 2013-2014 Total for 2014-2015
37
Melrose appears to be consistently low, with fewer than eight students receiving ten or more
referrals in 2014-2015. In addition, Campbell Park, Fairmount Park, and Maximo all had
reductions in the number of students with ten or more referrals in 2014-2015 as compared to
2013-2014. Again, the wide discrepancy in totals will require further study in hopes of finding
some correlations.
Source: FOCUS Discipline Data (Pulled 6/2014 and 6/2015)
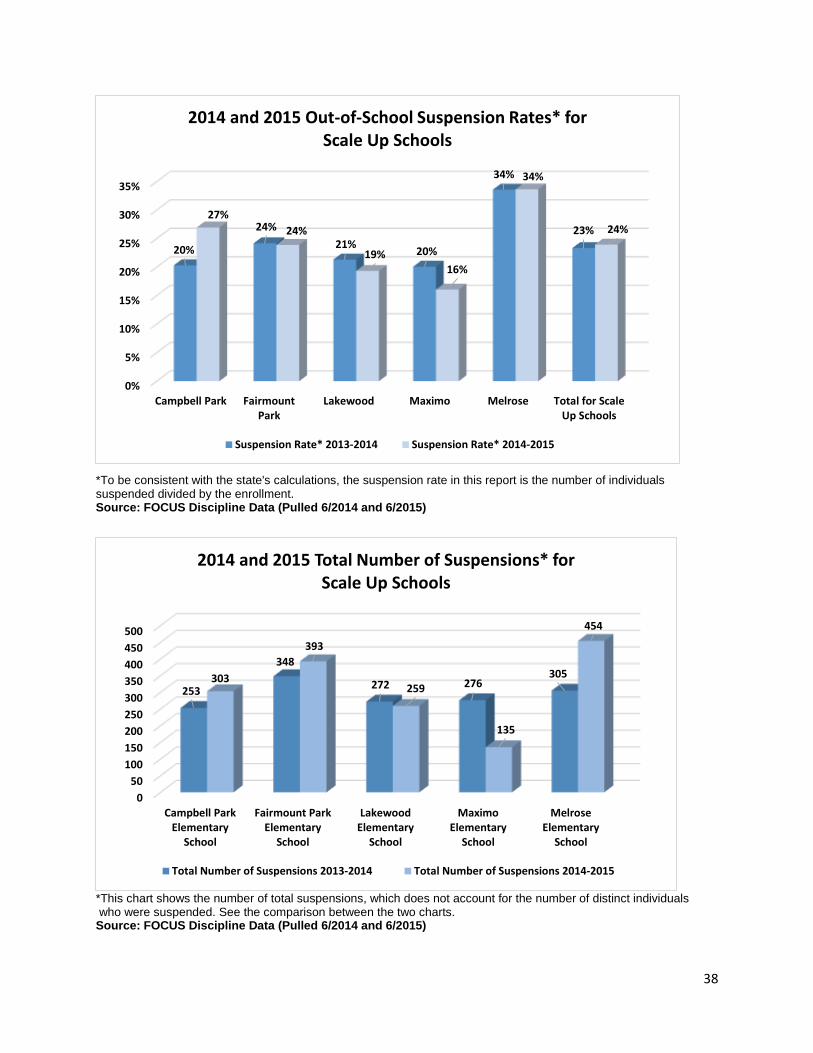
In terms of out-of-school suspension rates, two schools saw decreases (Lakewood and
Maximo), two schools had approximately the same rate (Fairmount and Melrose), and one saw
an increase (Campbell Park). To be consistent with the state's calculations, the suspension rate
in this report is shown as the number of individuals suspended divided by the enrollment (see
graph below). While this is one way to analyze behavior data at schools, it is also helpful to look
at the total number of suspensions across the five Scale Up schools. These data are presented
below and show that three of the five Scale Up schools had an increase in the total number of
suspensions—Campbell Park, Fairmount Park, and Melrose. Lakewood had a decrease in the
total number of suspensions of 13 (from 272 to 259) and Maximo saw a decrease of 141 (from
276 to 135).
0
10
20
30
40
50
60
70
80
Campbell ParkElementary School
Fairmount ParkElementary School
LakewoodElementary School
MaximoElementary School
MelroseElementary School
22
29
71
27
64
15
73
0
8
Total Number of Students Receiving Ten or More Referrals in Scale Up Schools for 2014 and 2015
Number of Students Receiving Ten or More Referrals 2014
Number of Students Receiving Ten or More Referrals 2015
38
*To be consistent with the state's calculations, the suspension rate in this report is the number of individuals suspended divided by the enrollment. Source: FOCUS Discipline Data (Pulled 6/2014 and 6/2015)
*This chart shows the number of total suspensions, which does not account for the number of distinct individuals who were suspended. See the comparison between the two charts. Source: FOCUS Discipline Data (Pulled 6/2014 and 6/2015)
0%
5%
10%
15%
20%
25%
30%
35%
Campbell Park FairmountPark
Lakewood Maximo Melrose Total for ScaleUp Schools
20%
24%
21%20%
34%
23%
27%
24%
19%
16%
34%
24%
2014 and 2015 Out-of-School Suspension Rates* for Scale Up Schools
Suspension Rate* 2013-2014 Suspension Rate* 2014-2015
0
50
100
150
200
250
300
350
400
450
500
Campbell ParkElementary
School
Fairmount ParkElementary
School
LakewoodElementary
School
MaximoElementary
School
MelroseElementary
School
253
348
272 276305303
393
259
135
454
2014 and 2015 Total Number of Suspensions* for Scale Up Schools
Total Number of Suspensions 2013-2014 Total Number of Suspensions 2014-2015
39
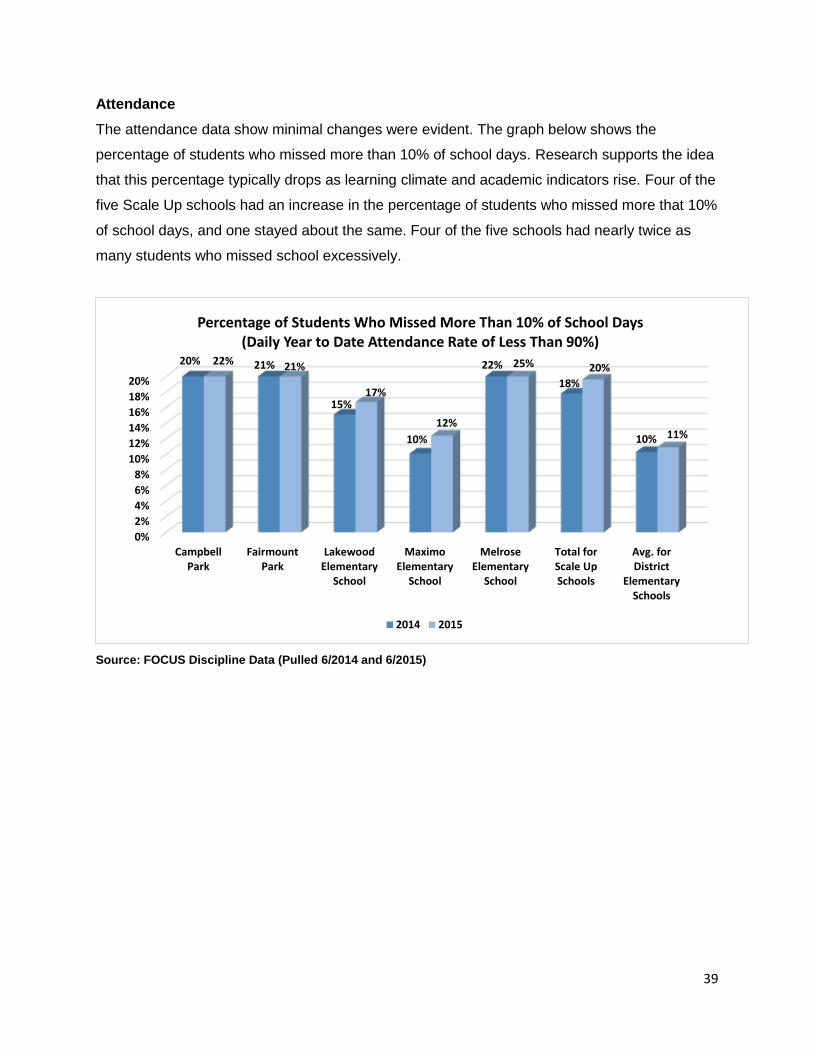
Attendance
The attendance data show minimal changes were evident. The graph below shows the
percentage of students who missed more than 10% of school days. Research supports the idea
that this percentage typically drops as learning climate and academic indicators rise. Four of the
five Scale Up schools had an increase in the percentage of students who missed more that 10%
of school days, and one stayed about the same. Four of the five schools had nearly twice as
many students who missed school excessively.
Source: FOCUS Discipline Data (Pulled 6/2014 and 6/2015)
0%
2%
4%
6%
8%
10%
12%
14%
16%
18%
20%
CampbellPark
FairmountPark
LakewoodElementary
School
MaximoElementary
School
MelroseElementary
School
Total forScale UpSchools
Avg. forDistrict
ElementarySchools
20% 21%
15%
10%
22%
18%
10%
22% 21%
17%
12%
25% 20%
11%
Percentage of Students Who Missed More Than 10% of School Days (Daily Year to Date Attendance Rate of Less Than 90%)
2014 2015
40
Leadership Findings
Overview
As previously stated, leadership is the key to high-performing schools. A primary emphasis
within the Scale Up for Success Initiative is to support the school leaders through (1) more
consistent district monitoring, support and feedback from the area superintendents and district
(Instructional Support Model) ISM team and (2) through on-site coaching and support from The
New Teacher Project (TNTP).
TNTP’s work includes: (1) supporting district and school leadership to articulate a compelling
vision for rigorous instruction and a strategy to achieve it in the Priority Schools; and (2) training
principal managers, school leaders, and coaches for the Scale Up schools to understand and
execute the vision and strategy, including execution of a proven coaching model. The support
provided to each school is designed to vary depending on the school’s individual needs.
Leadership Support: To develop school leadership in the areas of instructional
excellence, learning environment and staff development through supports provided via
district leadership and TNTP.
Conclusions:
The district leadership / ISM team visited each school monthly to provide feedback and
support. That district team, called the A-team, also met weekly at the district level to review
school data trends as they developed immediate support as needed.
The area superintendents assigned to each school visited the sites every other week to
follow up on action items required through the ISM site visits.
TNTP conducted its own school site survey (called Insight) to garner additional information
around school staff perceptions and conducted multiple visits with the principals to better
understand their vision and growth needs.
The ISM site visitation data and feedback from TNTP point to several key conclusions:
The principals reported feeling stronger support and increased growth at their school
sites. They also showed a unique confidence in their abilities and a passion for the work.
41
The principals and their teams still require additional supports around setting the
foundation or “conditions for success.” Our research shows that there are inconsistent
visions and processes among the five principals. Improvements here will be critical to
creating a strong learning environment, especially related to repeated disruptions to
learning in the classrooms and how those should be avoided and handled.
The principals are showing an increased focus on student data as a way of affecting
student learning at an individual level. This is especially evident at Campbell Park and,
as previously stated, this may be due to that staff’s longer history with this project.
Principal Survey / Year 1
A survey of the principals was conducted in July of 2015 after the year was completed to garner
the principals’ thoughts as to the support from TNTP and the success of the Scale Up initiative
to date. This survey consisted of 14 items, including four open-ended questions. Four of the five
principals responded to the survey.
Some of those findings related to TNTP were as follows:
The principals felt supported by TNTP in the areas of instructional support, behavior support
and creating a school transformation plan. All four of the principals who responded to the
survey agreed that TNTP provided their schools with resources in these key areas.
All four principals noted that TNTP provided support in defining, measuring and supporting a
common definition of student engagement at their school sites.
Most of the principals felt supported regarding various supports provided by TNTP in the
area of creating a productive learning environment.
One principal noted less support in the area of reducing behavior problems in the
classroom and supporting teachers in classroom management.
The four principals reported that TNTP provided support in utilizing an observation rubric,
providing high quality feedback and supporting preparation for feedback meetings.
o Two of the four principals felt that they needed more support in scheduling
observations and feedback meetings.
42
Findings regarding the support provided by TNTP in assisting the schools to improve data-
driven decisions were the least consistent among the four principals.
o Two of the four principals reported that they were lacking support in implementing
data-driven instructional practices and supporting teachers in using data to inform
instruction and set goals.
o Only one principal felt that he or she was supported in incorporating student data
within all planning meetings.
Some of those findings related to the Scale Up initiative were as follows:
The principals identified multiple additional resources that would be necessary to improve
outcomes related to the Scale Up initiative.
o The majority of principals suggested additional professional development in various
areas, such as Teacher Effectiveness and Improved Instructional Practice and
Strategies for Family Engagement.
o Some of the principals suggested that additional resources may be needed
associated with early behavior interventions (for pre-kindergarten students) and
increased an increased timeliness of student services for the most intensive
students.
TNTP Focus Areas to Date
March 2015 – Diagnostic to Assess Needs of Scale Up Schools
TNTP used a variety of data sources to include in the diagnostic report in order to assess the
and strategically support the Scale Up schools. The methods and process included:
Classroom observations
Fall 2014 Insight (Instructional Culture Index)
Focus groups with major stakeholders, including leadership teams, staff and students
Leadership interviews
Major recommendations from this diagnostic review across all five schools included intensive
coaching in three major areas: learning environment, student engagement and observation and
feedback for instructional staff.
43
April 2015 – Development of the Transformation Plan
TNTP spent the month of April working with each of the five principals to develop a school-
specific transformation plan. Completing the plans with the principals was intended to lay the
foundation for TNTP to accomplish the following goals:
to model the importance of using student and school-level data, including that which we
collected through the diagnostic, to inform school improvement planning;
to demonstrate the importance of planning well in advance of the upcoming school
year; and
to orient them to think about school improvement planning in an integrated fashion,
starting with a clear instructional vision for the school.
Each school’s leadership team also participated in training to enhance their knowledge of what it
requires to encompass a vision of excellence and best practices related to instructional
coaching.
May – Implementing Foundational Work for School Transformation
The New Teacher Project began refining the transformation plans and coaching around learning
environment, student engagement and observation and feedback of instructional staff that
would be implemented in Fall 2015. Some of this work included:
Establishing clear school-wide procedures and routines and implementing and monitoring
these new procedure.
Supporting the school’s administrative team in designing a teacher and student handbook.
Refining a monitoring instrument designed to maximize instructional time
and student engagement.
Developing a walkthrough schedule that calls for each teacher to be observed a minimum of
two times a week.
44
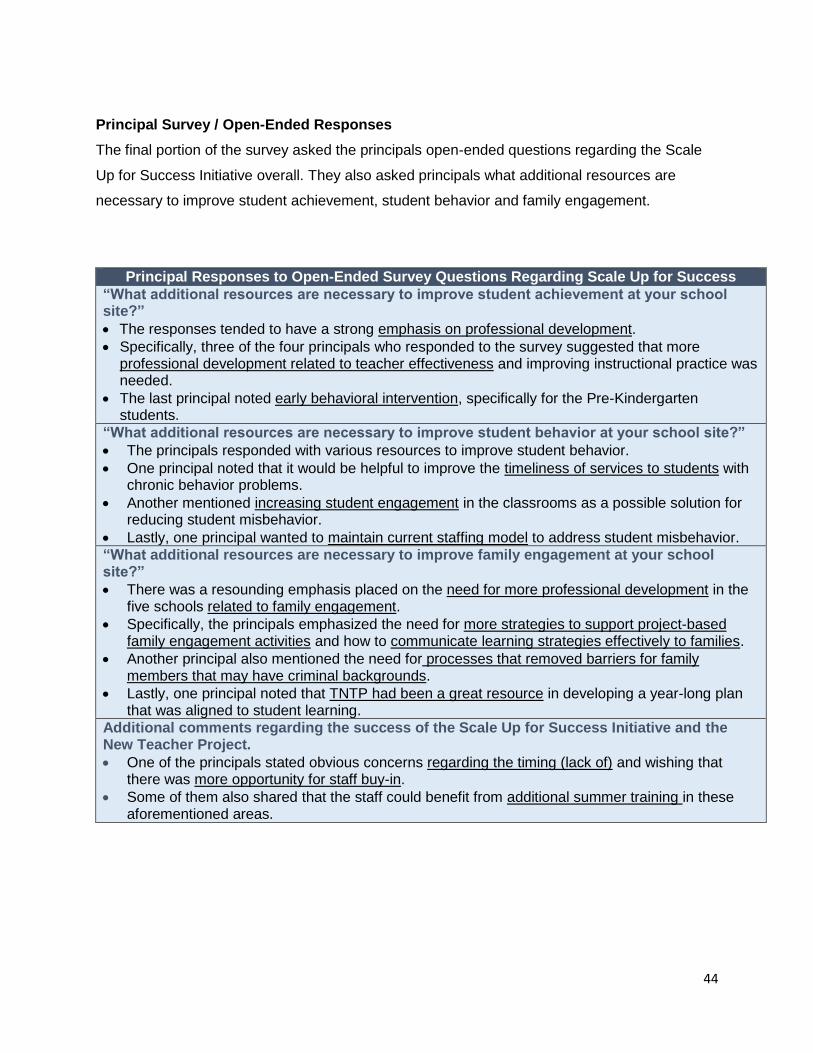
Principal Survey / Open-Ended Responses
The final portion of the survey asked the principals open-ended questions regarding the Scale
Up for Success Initiative overall. They also asked principals what additional resources are
necessary to improve student achievement, student behavior and family engagement.
Principal Responses to Open-Ended Survey Questions Regarding Scale Up for Success
“What additional resources are necessary to improve student achievement at your school site?”
The responses tended to have a strong emphasis on professional development.
Specifically, three of the four principals who responded to the survey suggested that more professional development related to teacher effectiveness and improving instructional practice was needed.
The last principal noted early behavioral intervention, specifically for the Pre-Kindergarten students.
“What additional resources are necessary to improve student behavior at your school site?”
The principals responded with various resources to improve student behavior.
One principal noted that it would be helpful to improve the timeliness of services to students with chronic behavior problems.
Another mentioned increasing student engagement in the classrooms as a possible solution for reducing student misbehavior.
Lastly, one principal wanted to maintain current staffing model to address student misbehavior.
“What additional resources are necessary to improve family engagement at your school site?”
There was a resounding emphasis placed on the need for more professional development in the five schools related to family engagement.
Specifically, the principals emphasized the need for more strategies to support project-based family engagement activities and how to communicate learning strategies effectively to families.
Another principal also mentioned the need for processes that removed barriers for family members that may have criminal backgrounds.
Lastly, one principal noted that TNTP had been a great resource in developing a year-long plan that was aligned to student learning.
Additional comments regarding the success of the Scale Up for Success Initiative and the New Teacher Project.
One of the principals stated obvious concerns regarding the timing (lack of) and wishing that there was more opportunity for staff buy-in.
Some of them also shared that the staff could benefit from additional summer training in these aforementioned areas.
45
Findings: Family and Community Engagement
Overview
Family, school, and community engagement is essential to building strong learning support
systems. The ultimate goal within this component of the Scale Up initiative is to intentionally link
family engagement activities to learning and school improvement by developing Learning
Support Systems, Systems Alignment, Family and Community Engagement Opportunities and
Trainings/Workshops. The plan also supports the families and students by developing a system
of supports that includes mental health services and family connection navigators.
The family engagement component of the Scale Up initiative was comprised of several
components which included: (1) A full-time mental health counselor (funded through the
Juvenile Welfare Board); (2) A full-time family navigator (also via JWB); (3) An emphasis on
increasing attendance at family engagement activities and (4) Family engagement activities that
were linked to student learning.
Family and Community Engagement Strategy: Establish and implement frameworks that
connect family and community engagement to core learning.
Family and Community Engagement Strategy: Support each school by hiring a full-time
family navigator and mental health counselor.
Conclusions:
There were several aspects of the initiative related to family engagement that were
implemented as designed. Each school had a full-time family navigator and mental health
counselor. The family navigators served, on average, 26 students and families; the mental
health counselors served on average 20 students as each site. There was no measurement
done per this study as to the level or degree of supports provided to the students.
There was a renewed focus on family engagement across the five schools. Attendance at
family engagement activities and the number of activities that were linked to student learning
increased across all five Scale Up schools, though large turnouts were still not common. On
average, there were approximately 19 families in attendance per event. We did see a
renewed sense of academic focus at those events.
46
Overall, the staff tended to have positive perceptions related to these navigation and
counseling services. Specifically, most respondents found that these services improved
student outcomes for their school sites.
Staff tended to agree less with the Scale Up initiative’s impact as it relates to the family’s
ability to support student learning.
Families across the five schools tended to agree less when compared to the total of all Title
I schools that there was a family-school partnership related to handling student misbehavior.
Recommendations:
Create improved processes that integrate the Pinellas County Schools student services
team with the JWB resources to ensure that students are receiving services effectively and
efficiently. For example, outlining the parental consent process to decrease barriers to
families and students who are in need of services.
o The Juvenile Welfare Board (JWB) found that possibly integrating some mental
health counseling and family navigator education into teacher-staff training time
could be helpful in eliminating some potential barriers to students and/or families
accessing services. JWB also suggested that the schools develop an annual family-
engagement plan, which includes providing more guidelines and strategies to
develop family engagement activities linked to school data and school improvement
including both academic and behavioral interventions and incorporates a
professional development for staff and families related to the Dual-Capacity
Framework.
Though there were more family nights linked to learning, the next steps could include
creating a system to track the students and the families to explore what works best for
families in these five schools.
Families’ overall perceptions via survey instruments tended to be positive, though these
results were sometimes inconsistent and/or participation tended to be minimal among the
five schools. More work could be done to ensure that more families provide feedback.
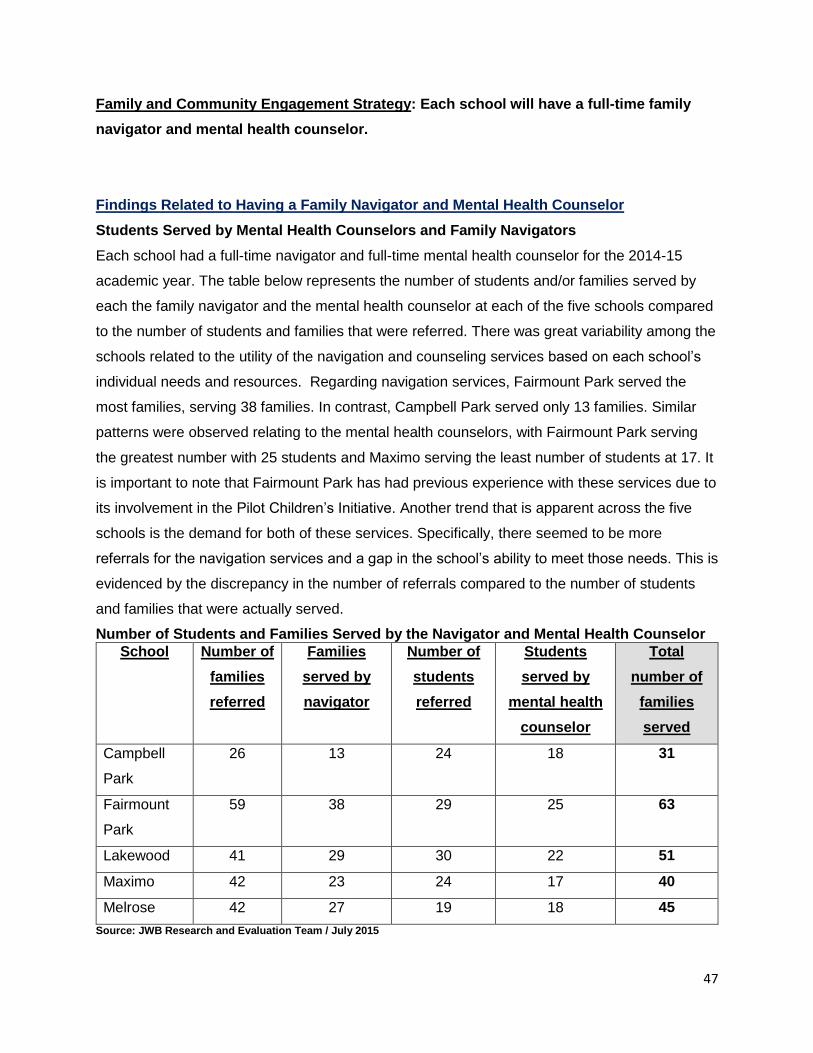
47
Family and Community Engagement Strategy: Each school will have a full-time family
navigator and mental health counselor.
Findings Related to Having a Family Navigator and Mental Health Counselor
Students Served by Mental Health Counselors and Family Navigators
Each school had a full-time navigator and full-time mental health counselor for the 2014-15
academic year. The table below represents the number of students and/or families served by
each the family navigator and the mental health counselor at each of the five schools compared
to the number of students and families that were referred. There was great variability among the
schools related to the utility of the navigation and counseling services based on each school’s
individual needs and resources. Regarding navigation services, Fairmount Park served the
most families, serving 38 families. In contrast, Campbell Park served only 13 families. Similar
patterns were observed relating to the mental health counselors, with Fairmount Park serving
the greatest number with 25 students and Maximo serving the least number of students at 17. It
is important to note that Fairmount Park has had previous experience with these services due to
its involvement in the Pilot Children’s Initiative. Another trend that is apparent across the five
schools is the demand for both of these services. Specifically, there seemed to be more
referrals for the navigation services and a gap in the school’s ability to meet those needs. This is
evidenced by the discrepancy in the number of referrals compared to the number of students
and families that were actually served.
Number of Students and Families Served by the Navigator and Mental Health Counselor
School Number of
families
referred
Families
served by
navigator
Number of
students
referred
Students
served by
mental health
counselor
Total
number of
families
served
Campbell
Park
26 13 24 18 31
Fairmount
Park
59 38 29 25 63
Lakewood 41 29 30 22 51
Maximo 42 23 24 17 40
Melrose 42 27 19 18 45
Source: JWB Research and Evaluation Team / July 2015
48
Results from Juvenile Welfare Board (JWB) external evaluation
The Juvenile Welfare Board (JWB) conducted an internal process evaluation of their staff
(family navigators and mental-health counselors only) in the five schools. This evaluation
included a focus group that examined implementation components that worked well and areas
for growth or improvement related to the full time services of the family navigator and the mental
health counselor. This evaluation focused solely on the roles of staff funded by JWB and did not
include other school-based staff. A summary of the recommendations from the JWB report is
included below.
Ensure administration support including: orientation to schools and community of these
services for families, timely conflict resolution, and onsite space to serve families.
Clearly define Family Navigators roles at each of the schools.
Provide training for school leadership and staff related to mental health and navigation
services.
Arrange for opportunities to share and adapt best practices across school sites.
It is important to note that these recommendations are provided by an outside evaluator using
information gathered in an internal process and did not include input from PCS staff. An
examination of the items noted by JWB researchers need to be examined including input from
Pinellas County Schools staff to ensure best practices.
Family and Community Engagement Intervention: Establish and implement a framework
that connects family and community engagement to core learning.
Another component of the Scale Up initiative is a direct intervention which focuses on families
and communities and ensuring that school staff at the Scale Up schools have a unified
understanding of family and community engagement.
This intervention included a two-day professional development session led by Dr. Karen Mapp.
Dr. Mapp is a Senior Lecturer from the Harvard Graduate School of Education (HGSE) and the
Faculty Director of the Education Policy and Management Master’s Program. District and school
leaders from all five Scale Up schools attended this training related to the Dual-Capacity
Framework for Family-School Partnerships. This framework emphasizes:
A description of the capacity challenges that must be addressed to support the cultivation of
effective home-school partnerships;
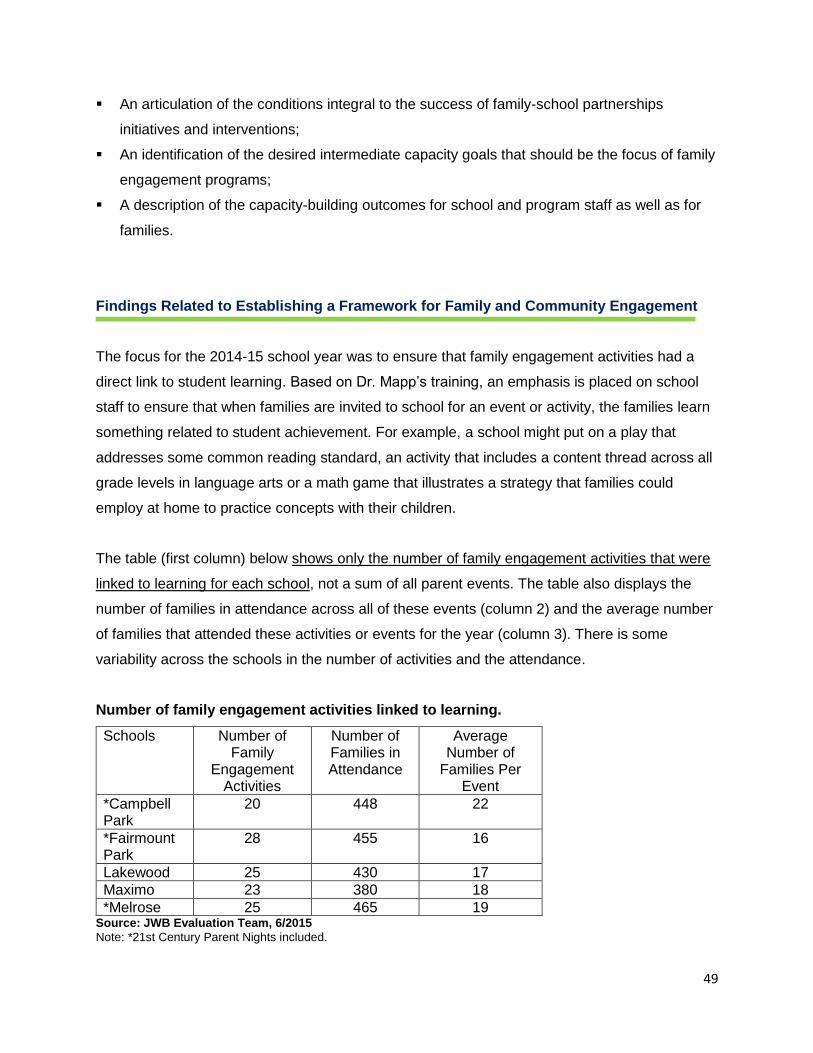
49
An articulation of the conditions integral to the success of family-school partnerships
initiatives and interventions;
An identification of the desired intermediate capacity goals that should be the focus of family
engagement programs;
A description of the capacity-building outcomes for school and program staff as well as for
families.
Findings Related to Establishing a Framework for Family and Community Engagement
The focus for the 2014-15 school year was to ensure that family engagement activities had a
direct link to student learning. Based on Dr. Mapp’s training, an emphasis is placed on school
staff to ensure that when families are invited to school for an event or activity, the families learn
something related to student achievement. For example, a school might put on a play that
addresses some common reading standard, an activity that includes a content thread across all
grade levels in language arts or a math game that illustrates a strategy that families could
employ at home to practice concepts with their children.
The table (first column) below shows only the number of family engagement activities that were
linked to learning for each school, not a sum of all parent events. The table also displays the
number of families in attendance across all of these events (column 2) and the average number
of families that attended these activities or events for the year (column 3). There is some
variability across the schools in the number of activities and the attendance.
Number of family engagement activities linked to learning.
Schools Number of Family
Engagement Activities
Number of Families in Attendance
Average Number of
Families Per Event
*Campbell Park
20 448 22
*Fairmount Park
28 455 16
Lakewood 25 430 17
Maximo 23 380 18
*Melrose 25 465 19 Source: JWB Evaluation Team, 6/2015
Note: *21st Century Parent Nights included.
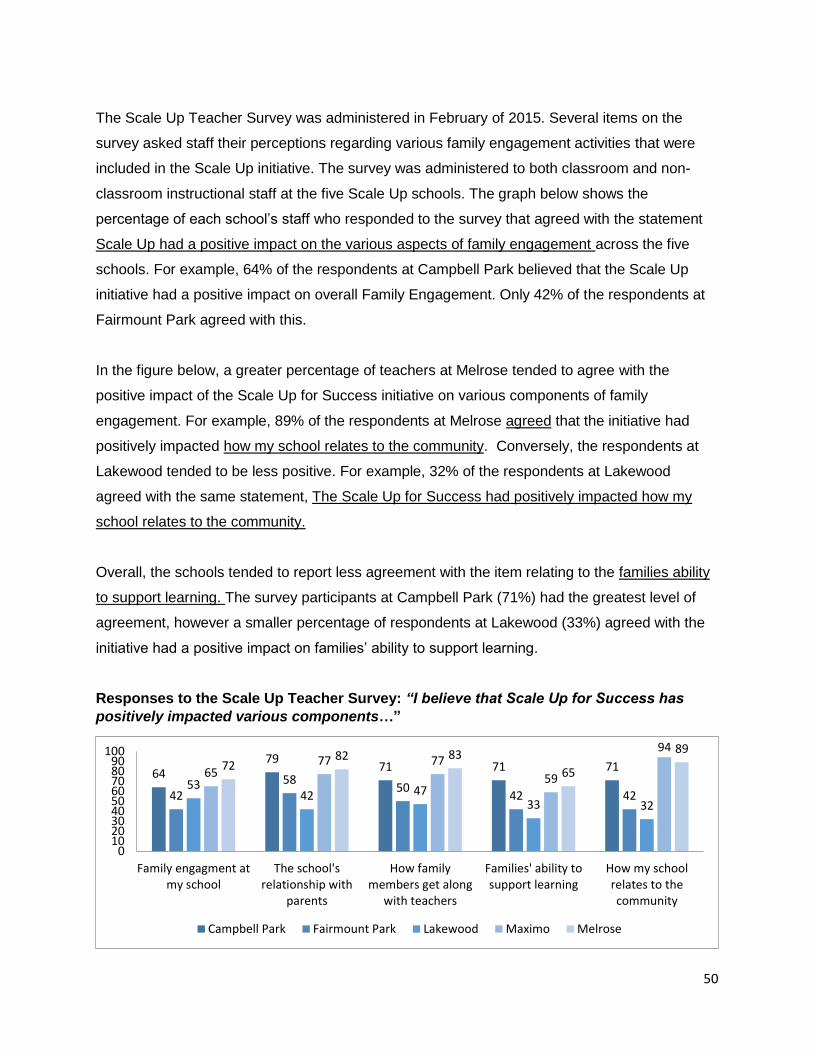
50
The Scale Up Teacher Survey was administered in February of 2015. Several items on the
survey asked staff their perceptions regarding various family engagement activities that were
included in the Scale Up initiative. The survey was administered to both classroom and non-
classroom instructional staff at the five Scale Up schools. The graph below shows the
percentage of each school’s staff who responded to the survey that agreed with the statement
Scale Up had a positive impact on the various aspects of family engagement across the five
schools. For example, 64% of the respondents at Campbell Park believed that the Scale Up
initiative had a positive impact on overall Family Engagement. Only 42% of the respondents at
Fairmount Park agreed with this.
In the figure below, a greater percentage of teachers at Melrose tended to agree with the
positive impact of the Scale Up for Success initiative on various components of family
engagement. For example, 89% of the respondents at Melrose agreed that the initiative had
positively impacted how my school relates to the community. Conversely, the respondents at
Lakewood tended to be less positive. For example, 32% of the respondents at Lakewood
agreed with the same statement, The Scale Up for Success had positively impacted how my
school relates to the community.
Overall, the schools tended to report less agreement with the item relating to the families ability
to support learning. The survey participants at Campbell Park (71%) had the greatest level of
agreement, however a smaller percentage of respondents at Lakewood (33%) agreed with the
initiative had a positive impact on families’ ability to support learning.
Responses to the Scale Up Teacher Survey: “I believe that Scale Up for Success has
positively impacted various components…”
6479
71 71 71
4258
5042 42
5342 47
33 32
6577 77
59
94
7282 83
65
89
0102030405060708090
100
Family engagment atmy school
The school'srelationship with
parents
How familymembers get along
with teachers
Families' ability tosupport learning
How my schoolrelates to thecommunity
Campbell Park Fairmount Park Lakewood Maximo Melrose
51
Other Surveys
Multiple data sources were examined to provide the most comprehensive representation of
family engagement at the Scale Up sites. The district conducts a variety of surveys throughout
the year which include measures of perceptions of family engagement. Data from the AdvancEd
survey (which has replaced our district’s annual climate survey) and the Title I Parent surveys
were reviewed for Scale Up schools to supplement evaluation data. The AdvancED survey
measured the perception of family engagement from the lens of three stakeholder groups:
students, parents and staff. The surveys were administered by each school site and each
school site determined how and when the survey would be administered and used. The results
of both surveys can be provided as needed.

51

53