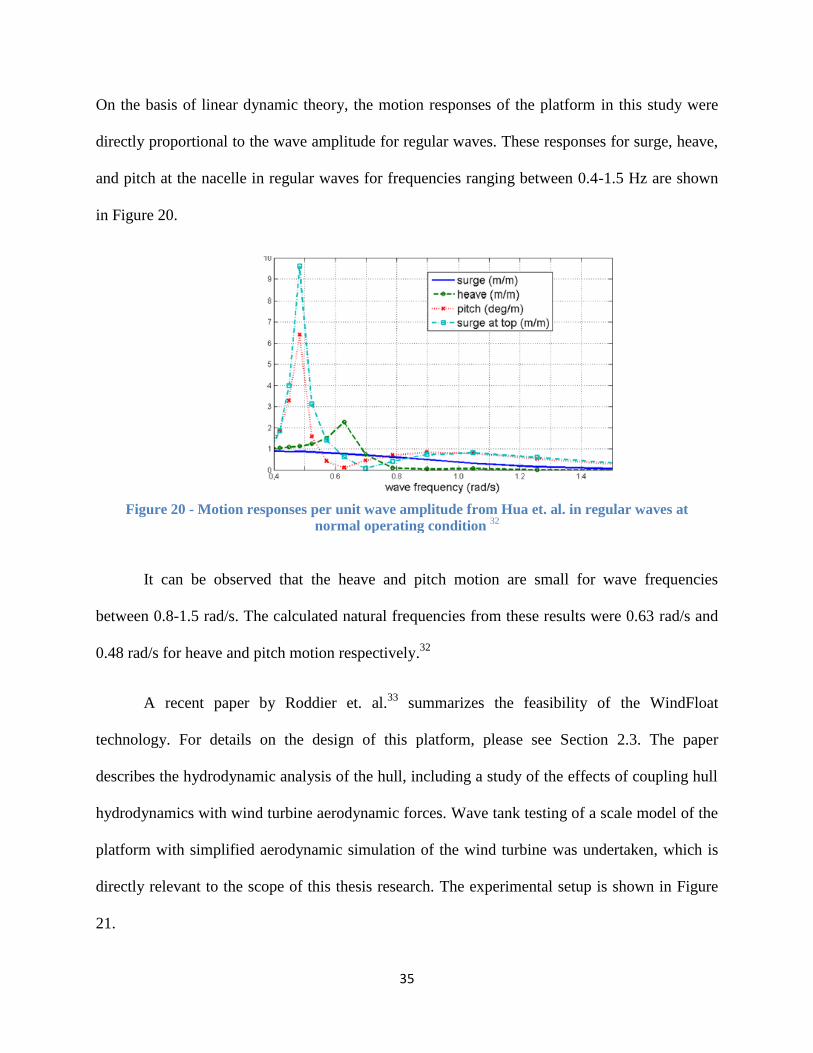
Embed Size (px)
DESCRIPTION
A Thesis Research ReportSubmitted to the Faculty
Citation preview

WORCESTER POLYTECHNIC INSTITUTE
Scale model experiments on floating offshore wind turbines
A Thesis Research Report Submitted to the Faculty
of
WORCESTER POLYTECHNIC INSTITUTE
in partial fulfillment of the requirements for the Degree of Masters of Science
In Mechanical Engineering
SUBMITTED BY:
______________
Syed Kazim Naqvi
May 2012
APPROVED BY:
_________________ ___________________ ___________________ Prof. David J. Olinger, PhD Prof. Simon Evans Prof. M. Dimentberg Thesis Advisor Committee Member Committee Member
___________________ Prof. John Blandino Graduate Committee Rep.

1
Abstract
This research focuses on studying the feasibility of placing large wind turbines on deep-
ocean platforms. Water tank studies have been conducted using the facilities at Alden Research
Laboratories (ARL) on 100:1 scale Tension Leg Platform (TLP) and Spar Buoy (SB) models.
Froude scaling was used for modeling the offshore wind turbine designs. Primary components of
the platform turbine, tower, and cable attachments were fabricated in ABS plastic using rapid
prototyping. A wireless data acquisition system was installed to prevent umbilical data cables
from affecting the behavior of the platform when exposed to wave loading. In Phase I testing,
Froude-scaled TLP and Spar Buoy models at a 100:1 scale were placed in a water flume and
exposed to periodic waves at amplitudes ranging from 0.5 cm – 7.5 cm and frequencies ranging
from 0.25 Hz – 1.5 Hz. The testing was conducted on simple tower and turbine models that only
accounted for turbine weight at the nacelle. In Phase II testing, emphasis was placed on further
testing of the tension leg platform as a more viable design for floating offshore wind turbines.
The tension leg platform scale model was improved by adding a disc to simulate drag force
incident at the top of the tower, as well as a rotor and blades to simulate the gyroscopic force due
to turbine blade rotation at the top of the tower. Periodic wave motions of known amplitude and
frequency were imposed on the model to study pitch, heave, roll, surge, sway motions and
mooring cable tensions (in Phase II only) using accelerometers, inclinometers, capacitance wave
gage, and load cells. Signal analysis and filtering techniques were used to refine the obtained
data, and a Fourier analysis was conducted to study the dominant frequencies. Finally, Response
Amplitude Operators (RAO’s) were plotted for each data set to standardize the results and study
the overall trend with respect to changes in wave amplitude and frequency. For Phase I testing, it

2
is shown that surge motion of the platform dominates other motions for both the tension leg
platform and spar buoy, and varying tether pretension has little effect on response amplitude
operator values. For phase II testing, it was found that the introduction of thrust and gyroscopic
forces increases sway and pitch motions as well as upstream tether forces. Coupling effects of
pitch motion with roll and sway due to the presence of gyroscopic forces were also seen. The
present experimental results can be used to validate the hydrodynamic kernels of linear
frequency-domain models, time-domain dynamics models, and computational simulations on
floating wind turbines. Numerical analysis and simulations have been conducted in a separate
study at WPI. These simulations are comparable to the experimental results.

3
Certain materials are included under the fair use exemption of the U.S. copyright law and
have been prepared according to the fair use guidelines and are restricted from further use.

4
Table of Contents
Abstract ......................................................................................................................................................... 1
1. Introduction ........................................................................................................................................ 11
1.1. Wind Turbines as an Energy Resource ........................................................................................ 11
1.2. Offshore Wind Energy ................................................................................................................. 13
1.3. Physics of Thrust and Gyroscopic Forces .................................................................................... 18
2. Background Research .......................................................................................................................... 21
2.1. History ......................................................................................................................................... 21
2.2. Floating Platform Classifications ................................................................................................. 24
2.3. Commercial Developments ......................................................................................................... 25
2.4. Previous Research Efforts ........................................................................................................... 31
3. Goals and objectives ........................................................................................................................... 40
4. Research methodology ....................................................................................................................... 43
4.1. Testing Summary ........................................................................................................................ 43
4.2. Scale Model Configurations ........................................................................................................ 44
4.3. Platform design ........................................................................................................................... 46
4.4. Froude scaling of model .............................................................................................................. 47
4.5. Instrumentation .......................................................................................................................... 52
4.5.1. Load Cells ............................................................................................................................ 52
4.5.2. Wireless instrumentation module ...................................................................................... 53

5
4.5.3. Spinning Rotor and Thrust Disc ........................................................................................... 54
4.6. Test Facilities ............................................................................................................................... 58
4.7. Post processing of data ............................................................................................................... 63
5. Phase I Testing Results ........................................................................................................................ 67
5.1. Tension Leg Platform .................................................................................................................. 67
5.2. Spar Buoy .................................................................................................................................... 70
5.3. Comparison with numerical simulations (Nematbaksh et. al.) ................................................... 72
5.4. Roll and Sway Responses ............................................................................................................ 77
6. Phase II Testing Results ....................................................................................................................... 78
6.1. Baseline run, wave loading ......................................................................................................... 78
6.2. Rotor effects................................................................................................................................ 80
6.3. Wind effects ................................................................................................................................ 82
6.4. Combined wind and rotor effects ............................................................................................... 84
6.5. Response Amplitude Operators .................................................................................................. 87
7. Conclusion and future work ................................................................................................................ 91
References .................................................................................................................................................. 94
Appendices .................................................................................................................................................. 98
Appendix A – Design ............................................................................................................................... 98
Appendix B – Instrumentation .............................................................................................................. 101
Appendix C- Experimentation ............................................................................................................... 103

6

7
List of Figures
Figure 1 - Electricity Production in the US 1980-20091 ............................................................................. 11
Figure 2 - Resource potential for onshore and offshore wind turbines7 ...................................................... 14
Figure 3 - US Annual Average Offshore Wind Speed at 90m7 .................................................................. 15
Figure 4 - Wind Resource available along the Massachusetts coast at 50m elevation7 .............................. 16
Figure 5 - Platform motions with respect to flow direction9 ....................................................................... 18
Figure 6 - FLOAT design: perspective view13 ............................................................................................ 21
Figure 7 - Semi-submersible supporting vessel for wind turbines 14........................................................... 22
Figure 8 - The Dutch tri-floater and NREL TLP concepts 17 ...................................................................... 23
Figure 9 - Floating offshore wind turbine concepts 19 ................................................................................. 25
Figure 10 - The Walney wind farm uses Siemens SWT 3.6 wind turbines with a 107m rotor diameter 21 26
Figure 11 - Statoil hywind - computer model and full scale. The model shows the depth of the platform
below the sea surface 22 ............................................................................................................................... 26
Figure 12 - WindFloat offshore wind farm 23 .............................................................................................. 27
Figure 13 - Blue H TLP proof-of-concept currently under construction 24 ................................................. 28
Figure 14 - Titan 200 self-installing platform, consisting of a Y shape hull supported by three independent
legs25 ........................................................................................................................................................... 29
Figure 15 - SWAY 1:6 scale model, as deployed outside Bergen, Norway27 ............................................. 30
Figure 16 - A view of the SWAY model after recovery from sinking 28 .................................................... 30
Figure 17 - Comparison of RAO data from Kurian et al. for regular and irregular waves 29 ..................... 32
Figure 18 - Pitch motion RAO from Murray et. al. for an extended tension leg platform design 30 ........... 33
Figure 19 - RAOs of sway heave and roll as a function of ζ (frequency of wave-maker motion: from Yan
et. al.): (a) RAO of surge motion, (b) RAO of heave motion, (c) RAO of pitch motion 34 ........................ 33

8
Figure 20 - Motion responses per unit wave amplitude from Hua et. al. in regular waves at normal
operating condition 32 .................................................................................................................................. 35
Figure 21 - Test setup by Roddier et. al. for the WindFloat model in a 100 year storm 33 ......................... 36
Figure 22 – RAOs from Roddier et. al. in surge, heave, and pitch with and without wind. 33
‘TF’ depicts
tether force .................................................................................................................................................. 37
Figure 24 (a) – Detailed drawings of the model tension leg platform (TLP) and spar buoy (SB) used in
Phase I experiments. 1- Tethers, 2-Horizontal legs, 3-Instrumentation cylinder, 4- Buoyant tank, 5-Tower,
6-Nacelle and rotor weight, 7-Nacelle accelerometer and inclinometer, 8-Center of gravity accelerometer
and wireless transmitter, 9-Ballast weights. The top view for the TLP and SB details the platform and
tether orientations with respect to the incident waves. 46 ............................................................................ 45
Figure 24 (b) - Detailed drawing of the tension leg platform used in Phase II of experiments. All
components stay the same as in Figure 24, except as follows: 1- ABS plastic for drag disc edge, 2- Shrink
wrap for providing drag, 3- Carbon fiber blade, 4- Nacelle platform for accommodating motor and
inclinometer, 5- Rotor hub attaching blades to motor, 6- Carbon fiber rods to reinforce drag disc, 7- Load
cells on water flume bottom, 8- aluminum plate for load cells. .................................................................. 45
Figure 25 – Side view of nacelle assembly. The components shown are as follows: 1- Nacelle platform, 2-
Motor, 3- Gearhead, 4- Hub (press fits onto axis of gearhead), 5- indentation for accommodating motor 47
Figure 26 - Honeywell model 31 series load cell 50
schematic.................................................................... 52
Figure 27 – (a) Load cell instrumentation setup for first round testing. 1- Voltmeter, 2- NI DAQ, 3- Power
supply. (b) Tension Leg Platform model, (c) Spar Buoy model ................................................................. 60
Figure 28 - Test setup at WPI Fluids Lab (Phase II testing) ....................................................................... 62
Figure 29 - Test setup at ARL (Phase II testing) ........................................................................................ 62
Figure 30 - Power spectra input and output parameters. Phase II test. No wind. Rotor moment of inertia =
0.006791 kg.m2. Peak-to-peak wave height = 2 cm, Wave period = 0.80 seconds. ................................... 65

9
Figure 31 - TLP baseline experiment (Phase I testing). Wave period = 0.86 sec Ballast weight = 0.6 kg.
(a) Nacelle accelerations. (b) Center of gravity accelerations. (c) Wave height. (d) Pitch motion 46
. ........ 67
Figure 32 - Response amplitude operators for the TLP (Phase I testing). (a) Roll RAOs, (b) Surge RAOs,
(c) Roll RAOs 46 .......................................................................................................................................... 68
Figure 33 - Spar buoy baseline experiment. Wave period = 0.95 sec, Ballast weight =5.57 kg. (a) Nacelle
accelerations, (b) Center of gravity accelerations, (c) Wave height, (d) Pitch motion 46 ............................ 71
Figure 34 - Response amplitude operators for the spar buoy. 46 ................................................................. 72
Figure 35 - (a) Three-dimensional view of numerical domain. (b) Front view; (c) Side view of refined grid
near cylinder 37
. ........................................................................................................................................... 73
Figure 36 - Simulation of scale-model floating wind turbine platform, baseline run. (a) Three-dimensional
view (t/T=30) (b), (c) Two-dimensional view (cylinder midplane) at t/T = 28.8, t/T = 29.2. T = wave
period 37
. ...................................................................................................................................................... 74
Figure 37 - Surge and heave motions (platform center of gravity), wave heights, and pitch motions. Wave
period=1 sec. wave height = 0.07 m. Surge and heave motions are non-dimensionalized with buoyant tank
diameter 37
. .................................................................................................................................................. 74
Figure 38 - Response amplitude operators for numerical simulations and scale model experiments for the
tension leg platform. 37, 46 ............................................................................................................................ 76
Figure 39 - Roll and Sway Responses for tension leg platform. Wave period = 0.86 sec., Ballast weight =
0.6 kg 46
. ...................................................................................................................................................... 77
Figure 40 - TLP baseline experiment – No wind or rotor effects (Phase II testing). Wave period = 0.82
seconds. Peak-to-peak wave height = 1.9 cm (a) Tether Forces. (b) Center of gravity accelerations. (c)
Wave height. (d) Pitch motion. ................................................................................................................... 78
Figure 41 - TLP experiment – Rotor effects (Phase II testing). Wave period = 0.86 sec. Rotor moment of
inertia=0.006791 kgm2. Peak-to-peak wave height = 4.45 cm (a) Tether Forces. (b) Center of gravity
accelerations. (c) Wave height. (d) Pitch motion. ....................................................................................... 81

10
Figure 42 - TLP experiment – Wind effects (Phase II testing). Wave period = 0.87 sec. Wind
speed=15m/s. Peak-to-peak wave height = 3.8 cm (a) Tether Forces. (b) Center of gravity accelerations.
(c) Wave height. (d) Pitch motion. .............................................................................................................. 82
Figure 43 - TLP experiment – Rotor and wind effects (Phase II testing). Wave period = 0.88 sec. Wind
speed=15 m/s. Rotor moment of inertia=0.004851 kg.m2. Peak-to-peak wave height = 1.2 cm (a) Tether
Forces. (b) Center of gravity accelerations. (c) Wave height. (d) Pitch motion. ........................................ 84
Figure 44 - TLP experiment – Rotor and wind effects (Phase II testing). Wave period = 0.88 sec. Rotor
moment of inertia=0.006791 kg.m2. Wind speed=15 m/s. Peak-to-peak wave height = 3.81 cm (a) Tether
Forces. (b) Center of gravity accelerations. (c) Wave height. (d) Pitch motion. ........................................ 86
Figure 45 - Response amplitude operators for the TLP (Phase II testing). ................................................. 88
Figure 46 - Gyroscopic effects on platform motion .................................................................................... 89
Figure 47 – TLP tank, ledge, and lid (exploded view). The ledge contains O-ring channels that, with O-
rings installed, ensure a water tight closure of the tank. 1- O-ring channels, 2- Mating holes in TLP lid and
ledge for water tight assembly .................................................................................................................... 99
Figure 48 - Fixture assembly allowing circular motion of tether. 1- Tether, 2- Hollow ball glued to tether
and allowing its circular motion, 3- Hollow chamber, 4- 3/8”-24 thread mating fixture B to fixture A, 5-
10-24 thread mating fixture A to load cell ................................................................................................ 100
Figure 49 - Wireless instrumentation module (shown assembled). 1- Arduino multiplexor, 2- Xbee
breadboard with 1mW wireless transmitter (latter not visible), 3- Arduino microontroller48 ................... 101
Figure 50 - XBee wireless receiver module .............................................................................................. 102
Figure 51 - Maxon Motors gearhead (left) and motor (right) to provide 120 RPM to the rotor ............... 102
Figure 52 - Experimental setup created in LabVIEW for acquiring data ................................................. 103
Figure 53 - Typical spectral analysis configuration in LabVIEW Signal Express ................................... 104

11
1. Introduction
1.1. Wind Turbines as an Energy Resource
Energy consumption and consequent demand in the United States and other developed
and developing countries around the world has grown at unprecedented rates throughout the last
few years. According to the global energy statistical yearbook published by Enerdata, net global
energy consumption soared by 5.5% of previous year values in 2010.2 Electricity production in
the USA has also increased significantly, almost doubling in the last 30 years as shown in Figure
1.1 The graph below shows how this energy production (in TWh) has varied for different energy
sources. It is interesting to note that while fossil fuels have met increased energy demand for
several decades, renewable resources as a means of electricity production has almost doubled
since 1990. As fossil fuels are non-renewable, it is inevitable that the energy grid in the US will
be powered by a mixture of renewables, hydro, and nuclear power in the future, with decreasing
reliance on fossil fuels.
Figure 1 - Electricity Production in the US 1980-20091

12
Wind energy is an important renewable resource that needs to be developed in the US.
The US Department of Energy (DOE) aims to increase wind energy production to account for
20% of overall demand in the country by 20303. According to data released by the US Energy
Information Administration (EIA), wind energy accounted for a modest 0.7% of overall energy
production in 2009.3 This implies that in order to meet the DOE goal, wind energy production in
the US will have to increase to more than 20 times its current level in the next two decades.
There are several important reasons for developing wind energy as a renewable resource
in the US. While the development of this goal is expected to have an incremental direct cost to
society of $43 billion (which breaks down to $0.50 per month per household), the savings in
avoided carbon regulation costs alone will range from $50-$150 billion.3 In addition, wind
energy resource development will add 500,000 jobs to the US economy and generate $2 billion
in local annual revenues. It will result in a reduction in nationwide natural gas usage and is
expected to result in savings of $86-214 billion to natural gas customers. This is because
renewable energy is cheaper to the consumer than natural gas, and an increase in the percentage
of wind energy contributing to grid power supply will result in savings that can be utilized
directly by the consumer.4

13
1.2. Offshore Wind Energy
Wind energy is the fastest growing renewable energy source, increasing at an annual rate
of 25% with a worldwide installed capacity of 239 GW in 2011.5 The vast majority of wind
power is generated from onshore wind farms. Their growth is however limited by the lack of
inexpensive land near major population centers and the visual pollution caused by large wind
turbines.
Wind energy generated from offshore wind farms is the next frontier. Current offshore
wind turbines are supported by monopoles driven into the seafloor at coastal sites a few miles
from shore and in water depths of 10-15m. The primary impediment to their growth is the
prohibitive cost of seafloor mounted monopoles in larger water depths. They are also deemed to
be aesthetically unpleasing when they become visible on the horizon at popular tourist
destinations. However, large sea areas with stronger and steadier winds are available for wind
farm development further offshore, and 5 MW wind turbine towers located 20 miles from the
coastline are invisible.6
Current research is focusing on the feasibility of deep sea offshore wind turbines that are
tethered to the sea bed via cables instead of monopoles. This solves the issue of possible visual
pollution caused by offshore wind turbine farms and also increases the average wind power
available per unit area as the installation is far offshore where wind energy is an ample resource.
Figure 2 shows the levelized cost of energy (LCOE) versus the respective quantity of onshore
and offshore wind energy available in the US. LCOE is an economic assessment of all costs
associated with an energy-generating system.
Wind power available at a particular location is often assigned a wind power class.

14
The wind power density limits for each wind power class are shown in Table 1. Each grid
cell contains sites of varying power class. The assigned wind power class is representative of the
range of wind power densities likely to occur at exposed sites within the grid cell. Probability
density functions are used to account for variation in the instantaneous wind speed away from
the mean wind speed in power density calculations. The wind speeds are usually described with a
Weibull distribution, which is a probability density distribution for wind speeds that gives a good
fit to the obtained wind data. The Weibull distribution incorporates a ‘k’ factor that determines
the shape of the probability density curve.
Figure 2 - Resource potential for onshore and offshore wind turbines7

15
It is evident that the quantity of offshore wind energy available for each wind class is
much larger, especially in the deep sea, but the levelized cost increases proportionally to this
increased resource availability. Figure 3 below shows the distribution of annual average wind
speed along the US coast line at a height of 90m.
It is interesting to note that a significant amount of wind energy is available along both
the eastern and western coasts as well as along the Great Lakes. These areas also correspond to
Table 1
Wind power classes, as defined by NREL7
Figure 3 - US Annual Average Offshore Wind Speed at 90m7

16
the most densely populated areas of the US. Hence, offshore wind turbines can be developed
along the coastlines very close to population centers to deliver energy locally and reduce
transmission losses.
Moreover, the wind resource available along the Massachusetts coast line is also
abundant and indicates that this state would be ideal for launching pilot projects in offshore wind
energy when backed by federal and local renewable energy incentives. The wind power density
at a 50m height at a distance of 20-40 miles from the coast ranges from 600-800 W/m2, which is
classified as an ‘outstanding’ wind resource by NREL. The wind resource distribution for
Massachusetts has been produced by TrueWind Solutions for NREL and reproduced in Figure 4.
The wind class color scheme for this map is as indicated in Table 1.
Figure 4 - Wind Resource available along the Massachusetts coast at 50m elevation7

17
The US DOE in their 2008 report has stated that ‘offshore wind energy installations have
a broadly dispersed, abundant resource and the economic potential for cost competitiveness that
would allow them to make a large impact in meeting the future energy needs of the United
States’.7
To conclude, floating wind turbine technology would open up a large majority of the
continental shelf as a wind power resource. The wind power industry has recognized the
potential of far-offshore wind farms. General Electric, Blue H, and Hydro Oil and Energy of
Norway are currently evaluating the feasibility of several installations. While the potential is
vast, further study is required as the floating systems need to be stable, structurally sound, and
economical. Floating oil-platform technology can provide a basis for design; however
differences exist for floating wind turbines due to the additional forces on the turbines from wind
loads and the higher center of gravity due to tower height.8

18
1.3. Physics of Thrust and Gyroscopic Forces
The platform motions in surge, sway, heave, pitch, roll, and yaw directions for a floating
offshore wind turbine are defined in Figure 5. The surge, sway, and heave motions are
translational motions in the x, z, and y directions respectively as shown in Figure 5, and are
defined with respect to the body (platform) frame.
Since modeling aerodynamic thrust forces and rotor gyroscopic effects is the main
objective of the present work, it is appropriate to discuss the physics of these effects when
applied to a floating offshore wind turbine platform. An aerodynamic thrust force exists on any
wind turbine when it is operating. This horizontal thrust force acts in the downwind direction, as
Figure 5 - Platform motions with respect to flow
direction9
Thrust
Force

19
shown in Figure 5, created because the rotor extracts kinetic energy from the wind. As a result,
the wind velocity decreases as the air flows through the rotor. In order to decrease the airflow
velocity the rotor must put a force on the air, which is equal and opposite to the downwind thrust
force the air flow places on the rotor. In order to properly model the thrust force using a scaled
rotating rotor blade, Reynolds number similarity needs to be achieved. Using air-flow at sea
level, the model wind speed would need to be a factor of 100 greater than the actual wind speed
over the full-scale platform, which is impossible to achieve in practice. An alternative method
using a 100:1 scale solid aerodynamic disc is therefore used in the present work and has been
applied in other studies such as Roddier et. al.10
The gyroscopic effect of spinning rotor blades is another important physical effect on
floating wind turbine platforms that must be modeled in scale-model experiments. The
gyroscopic effect can be described as follows – given a spinning rotor with an angular
momentum about one axis, if an applied torque results in rotation of the rotor about a 2nd
axis, a
subsequent rotation (torque) results about the 3rd
axis which is perpendicular to the first two axes.
The fundamental equation describing the behavior of the gyroscope is as follows
(1)
Where the vectors τ and L are the applied torque and angular momentum respectively in the
surge axis, I and ω are the mass moment of inertia and angular velocity about the 1st axis
respectively, and α is the angular acceleration in the surge axis of the rotor.
Applied to a floating wind turbine platform, the gyroscopic effect results in the following:
A spinning turbine rotor has an angular momentum (torque) about the surge axis (see Figure 5).
As a result of torques leading to platform motion in pitch, this spinning rotor creates a new

20
component of angular momentum yaw. This new component of angular momentum may either
enhance or decrease the yaw motions of the platform (depending on the relative phase of the
pitch and yaw motions). Similarly, initial yaw motions can also induce torque and motions in
pitch. The angular velocity induced by pitch motion can also enhance or decrease pitch motions
of the platform. As a result of yaw motions created on the platform, a secondary gyroscopic
effect may also occur. Forces in the sway axis occur on a yawed rotor disc. These forces may
also induce torque and motions in roll. The gyroscopic effect (and resulting torques) depends on
the angular velocity and moment of inertia of the spinning rotor. Platform motions induced in
yaw, pitch, and roll as a result of gyroscopic forces are directly proportional to the angular
velocity and moment of inertia of the spinning rotor that creates these gyroscopic forces.9

21
2. Background Research
2.1. History
Floating wind turbines were first envisioned in the US by Heronemus11
, who described an
offshore wind power system as “consisting of wind-driven electrical DC generators mounted on
floating towers in the waters off the coast of New England where the winds are high. The output
from the generators supplied underwater electrolyzer stations in which water was converted to
hydrogen and oxygen. The hydrogen would be piped to shore where it would be converted to
electricity in fuel cell stations.” 12
Concepts of how the vast amount of wind energy available offshore may be harnessed
have varied since this initial proposal. In 1998, a conceptual design for ‘FLOAT – an offshore
floating wind turbine’ was proposed. This design represented a marriage of the wind power and
offshore oil and gas technology. The objective of the FLOAT project was to develop a floating
wind turbine system enabling the economic generation of electricity from wind power in
offshore locations typically at 100 – 300 feet water depth.13
Figure 6 below shows a perspective
view of the proposed FLOAT design.
Figure 6 - FLOAT design: perspective view
13

22
In 2003, the development of analytical tools emerged for modeling the turbine loads and
fatigue damage due to platform motion. The effect that the motion would have on the wind
turbine was found by calculating the aerodynamic and inertial loads on the blades in a two-
dimensional state domain representing the blade and vessel motion respectively.14
This research
envisioned a design in which a semi-submersible structure would act as a supporting vessel for
five wind turbines (Figure 7). It was noted, however, that the rapid increase in the size of wind
turbines implied that alternative single-turbine concepts appeared to offer the best opportunities
to develop cost-effective floating solutions.15
Musial et al. provided a general technical description of several types of floating
platforms for wind turbines.16
The platform topologies were classified into multiple or single
turbine floaters and by mooring method, with a detailed description of specific anchor types, as
shown in Figure 8.
Figure 7 - Semi-submersible supporting vessel for wind

23
Cost estimates in this paper showed that single unit production cost was $7.1 million for
the Dutch tri-floater and $6.5 million for the NREL TLP concept. However, it was projected that
value engineering, multiple unit series production, and platform/turbine system optimization
would lower the unit platform costs to $4.26 million and $2.88 million respectively, with
significant potential to reduce cost further with system optimization.17
Figure 8 - The Dutch tri-floater and NREL TLP concepts 17

24
2.2. Floating Platform Classifications
As mentioned earlier, floating platform configurations may vary widely. However, three
primary configurations have been classified by the primary mechanism that stabilizes the
platform. These are summarized as follows.
Ballast: Platforms that achieve stability by using ballast weights hung below a central buoyancy
tank which creates a righting moment and high inertial resistance to pitch and roll and usually
enough draft to offset heave motion.18
The spar buoy platform (SBP) at the far left of Figure 9
shows this concept.
Mooring Lines: Platforms that achieve stability through the use of mooring line tension. The
tension leg platform (TLP) relies on mooring line tension for righting stability,18
as shown at the
center of Figure 9.
Buoyancy: Platforms that achieve stability through the use of distributed buoyancy, taking
advantage of a weighted (distributed) water plane area for creating a righting moment.19
This is
demonstrated in the shallow draft barge (SDB), as shown at the far right of Figure 9.

25
Current research and development has shown that the mooring line TLP and Spar Buoy
platform concepts are the most feasible for commercial viability.19
2.3. Commercial Developments
Numerous organizations and governmental agencies have accelerated the pace of
offshore wind turbine development in recent years, with primary efforts championed by the
European Wind Energy Association (EWEA), Statoil Hydro, Vestas, Siemens, Thanet Offshore
Wind Ltd, and A2SEA. Europe is the world leader in installed offshore wind energy. The first
offshore wind farm placed in operation was based in Denmark in 1991, and there have been
more than 25 other installed offshore wind farms of significant capacity since then.20
However,
all of these wind farms use bottom-fixed turbines; there are no floating wind turbines currently
used for electricity production.
Figure 9 - Floating offshore wind turbine concepts 19

26
The Walney wind farm, shown in Figure 10, is currently the largest offshore wind farm in
the world, located 14 km west of Walney Island off the coast of Cumbria. It has an installed
capacity of 367 MW and has been installed in water depths ranging from 19-23m. It was
developed by Walney (UK) Offshore Windfarms Limited, a partnership between Dong Energy
and Scottish and Southern Energy.20
The Hywind floating wind turbine concept, shown in Figure 11 and developed by Statoil,
was the first floating offshore wind turbine in the world launched for testing in 2009. The
Hywind concept combines known technologies in a completely new setting and opens up the
possibility for capturing wind energy in deep-water environments.
Figure 10 - The Walney wind farm uses Siemens SWT 3.6 wind turbines with a 107m rotor diameter 21
Figure 11 - Statoil hywind - computer model and full scale. The model
shows the depth of the platform below the sea surface 22

27
The floating structure of the Hywind concept is a spar buoy consisting of a steel cylinder
filled with a ballast of water and rocks. It extends 100m beneath the sea’s surface and is attached
to the seabed by a three-point mooring spread – utilizing the spar buoy ballast stabilized platform
design discussed in Section 2.2. Hywind has generated 15 MWh of production since its startup,
and Statoil plans to continue testing throughout 2011 and 2012 in order to gain further data for
optimization of the next generation of Hywind.22
A floating wind turbine platform named WindFloat has been proposed and patented by
Principal Power. It is a floating foundation for offshore wind turbines that attempts to improve
dynamic stability at shallow draft by dampening wave and turbine induced motion utilizing a tri-
column triangular platform with the wind turbine positioned on only one of the three columns10
.
The triangular platform is then ‘moored with 4 lines, 2 of which are connected to the column
stabilizing the turbine, thus creating an asymmetric’ mooring to increase stability and reduce
motion10
. Figure 12 shows a computer rendered image of a typical WindFloat platform and wind
farm.
Blue H is a UK based firm developing deep-water floating platform technology for
offshore wind turbines. Blue H commenced its activities in the offshore wind market by adapting
the concept of submerged TLPs, originally developed by the oil industry for some of its off-shore
rigs, and designed a platform large and stable enough to support a tower and a wind turbine in all
Figure 12 - WindFloat offshore wind farm 23

28
foreseeable weather conditions. Blue H has built and installed a proof-of-concept offshore wind
turbine at a 75% scale size in 113m deep water 21.3 km off the cost of southern Italy. This model
was installed in 2008 and decommissioned in early 2009. Blue H plans to launch a second proof-
of-concept tension legged platform for a 2MW floating wind turbine in 2012.24
Ongoing
construction activity on the Blue H TLP model can be seen in Figure 13.
Another tension legged wind turbine foundation has been proposed by Offshore Wind
Power Systems of Texas, LLC. This design can be seen in Figure 14 and was created to
economically support a single wind turbine in water depths greater than 48 feet.
Figure 13 - Blue H TLP proof-of-concept currently under construction 24

29
The layout of Titan 200 Mobile Self Installing Platform consists of a Y shape hull supported by
three independent legs. The foundation for the wind turbine is at the center of the Y hull25
.
The SWAY concept consists of a floating spar buoy that is 640 feet tall and designed to
rise and fall with wave activity. The concept is unique as the turbine in the installed
configuration faces downwind. A model of the SWAY concept was installed in 2010. However,
on 1st December 2011, the offshore wind energy company SWAY reported that extreme weather
caused its floating wind tower test model to sink into the sea.
The scaled-down 1:6 test model of the SWAY concept was located at a site outside
Bergen, Norway. No structural damages were evident; however the model sank due to
experiencing a 6.3 meter wave, which would translate to a 40.3 meter wave at full scale. In
comparison, a ‘hundred year wave’ does not exceed 30 meters. This implies that the SWAY
concept experienced extreme wave conditions that are not likely to occur even in a 100 years26
.
Figure 14 - Titan 200 self-installing platform, consisting of a Y
shape hull supported by three independent legs25

30
It is evident from this incident that there is a need for further testing and deployment of
floating wind turbine concepts at smaller scales to ensure their survivability in extreme weather
conditions.
As of 8th
December 2011, SWAY reported that all replacement parts and re-building
contracts to re-launch the scaled-down 1:6 test model have been signed, and the tower is
scheduled to resume testing early May 2012. Figure 16 shows the SWAY 1:6 scale model after
recovery from sinking.28
Figure 15 - SWAY 1:6 scale model, as deployed outside Bergen, Norway27
Figure 16 - A view of the SWAY model after recovery from sinking 28

31
2.4. Previous Research Efforts
There have been several studies of the response of scaled floating wind turbine platforms
to wave and wind loading. Kurian et. al.29
conducted an experimental study analyzing the
behavior of a 1:50 scale TLP model subjected to the action of regular and irregular waves.
Platform motions in surge, sway, and heave directions were studied using accelerometers. Tether
forces were also measured using specifically developed load cells. Due to the combined study of
both tether forces and platform accelerations conducted in this study, it is particularly relevant to
the scope of this thesis research. Response amplitude operators (RAOs) were obtained for the
measured parameters. RAO is a standard metric frequently used in the offshore structure
literature to study the response of a parameter to an input, and is calculated by taking the square
root of the ratio of the power spectral density (psd) of the response to the psd of the incident
wave height. Further details on RAO measurements are given in Section 4.7. Figure 17 shows
the RAOs resulting from the experimental study documented in the article. It is interesting to
note that the bulk of the surge RAO values lie at a value below 1, while force RAO values vary
from 100-300 N/M with highest values near a resonant frequency for the system.29

32
Murray et. al.30
proposed an extended tension leg platform design that was sponsored by
FloaTEC, LLC. The TLP model was designed for deployment at a water depth of 1500 m and
tests were conducted of a 1:92 scale model. This study measured extreme responses, tether
tensions, and six-degree-of-freedom platform motions.33
The platform pitch motion RAO is
shown in Figure 18 and is observed to be extremely low with a range of 0.004-0.026°/m. This is
perhaps because the platform studied is an extended tension leg platform, which consists of four
columns connected underwater by four pontoons. In this design, the pontoon extensions move
the tendon connection point outboard of the columns, due to which the extensions effectively
increase the restoring effect of the tendons (tethers) while reducing the column spacing. The
measured RAOs were also compared to the predicted frequency domain responses, and good
agreement was found at the lower periods, as shown in Figure 18.30
Figure 17 - Comparison of RAO data from Kurian et al. for regular and irregular waves 29

33
In 2007, Yan et. al.31
developed numerical simulations of the fully non-linear interaction between
steep waves and two-dimensional floating bodies. These simulations included the methods for
Figure 18 - Pitch motion RAO from Murray et. al. for an extended tension leg platform design 30
Figure 19 - RAOs of sway heave and roll as a function of ζ (frequency of wave-maker motion:
from Yan et. al.): (a) RAO of surge motion, (b) RAO of heave motion, (c) RAO of pitch motion 34

34
estimating velocities, accelerations and forces pertaining to two-dimensional floating bodies.31
The results of these numerical simulations are summarized in Figure 19.
It can be observed from Figure 19 that the numerical results presented in the study were
closer to the linear solution (present in results from other publications) when the incident waves
were small (0.01 m) and had a corresponding high frequency. However, at larger wave heights
(0.07 m), the numerical results in the paper became closer to experimental data. This was
deemed reasonable as the experimental data for the larger wave heights contained non-linear
effects that are taken into account by the non-linear numerical simulations but not by the linear
solution.31
Jianbo Hua conducted studies on evaluating the dynamic stability of a floating platform
of concrete for offshore wind turbines.32
This was one of the first studies that included the effects
of the presence of a rotor at the nacelle. The MIT NREL 5 MW tension leg design was used for
the thrust calculation. The maximum thrust experienced by the platform was calculated as 850
KN, which resulted in a platform tilt angle of less than 7°. The large mass and hydrodynamic
inertia of the platform used in this study implied a response that comprised of a nearly constant
tilt angle, which was then balanced by an onboard ballast system that kept the tower upright. An
elliptical sphere was designed for ballast to obtain the required dynamic performance for the
platform at operating conditions with moderate wave heights. This ballast system improved the
damage stability of the platform and ensured that an adequate hydro-restoring moment could
always be induced as a consequence of the forced tilt.
35
On the basis of linear dynamic theory, the motion responses of the platform in this study were
directly proportional to the wave amplitude for regular waves. These responses for surge, heave,
and pitch at the nacelle in regular waves for frequencies ranging between 0.4-1.5 Hz are shown
in Figure 20.
It can be observed that the heave and pitch motion are small for wave frequencies
between 0.8-1.5 rad/s. The calculated natural frequencies from these results were 0.63 rad/s and
0.48 rad/s for heave and pitch motion respectively.32
A recent paper by Roddier et. al.33
summarizes the feasibility of the WindFloat
technology. For details on the design of this platform, please see Section 2.3. The paper
describes the hydrodynamic analysis of the hull, including a study of the effects of coupling hull
hydrodynamics with wind turbine aerodynamic forces. Wave tank testing of a scale model of the
platform with simplified aerodynamic simulation of the wind turbine was undertaken, which is
directly relevant to the scope of this thesis research. The experimental setup is shown in Figure
21.
Figure 20 - Motion responses per unit wave amplitude from Hua et. al. in regular waves at
normal operating condition 32

36
Simulation of a 100 year storm was conducted in this study using both experimental and
numerical approaches. The maximum crest to trough pitch was 7° with a 21.3 m corresponding
wave height. Similar responses and trends were observed for all tested platform headings (0° and
90°) and for runs with and without wind loading.
RAOs were also calculated for full-scale wave periods ranging from 8-16 seconds, as
shown for surge, heave, and pitch in Figure 22. The presence of wind did not affect surge or
heave motions significantly, but some effect was seen in the pitch RAOs.
Figure 21 - Test setup by Roddier et. al. for the WindFloat model in a 100 year storm 33

37
Utsonomiya et al.34
conducted a motion analysis of a floating offshore wind turbine
during the rotor-rotation under wind loads using numerical methods based on multi-body
dynamics theory. Motions in the sway direction were observed to be small, with dominant
motion in the surge direction. Yaw motion increased due to a moment of inertia incident at the
nacelle of the platform. Due to the effect of gyro-moment, the rotor did not face the wind
perpendicularly in this study, and the floating body started to move in the sway direction and
rotate in the roll direction. It was therefore recommended in this study that in order to analyze
and evaluate the motion of a floating offshore wind turbine in operation, it is required to take the
effects of the rotor-rotation into account.
The above studies have been summarized in detail due to their relevance to this research.
However, additional studies that predicted aero elastic, hydrodynamic, and rigid body motion
Figure 22 – RAOs from Roddier et. al. in surge, heave, and pitch with and without wind. 33
‘TF’
depicts tether force

38
responses of floating wind turbines have been used to investigate various platform and mooring
arrangements. Several studies have summarized the development of simulation tools that include
models of aerodynamic, gravitational, and inertial loading of the rotor, nacelle, and tower, elastic
structural effects; wave loading; dynamic loading between the platform and turbine; and motions
of the mooring cables. Karimirad studied the dynamic response of floating structures to extreme
wave and wind loads.35
Previous computational studies based on solving the Navier-Stokes equations for water
and wind flow over floating platforms are rare. Chexoxarov and Chexoxarov36
investigated wind
loading on a floating turbine rotor, including the effect of wind velocity and turbine rotation rate,
by solving the three-dimensional Navier-Stokes equations with using finite element methods.
Recently, Nematbaksh et al.37
have applied three-dimensional computational methods utilizing
the fully non-linear, viscous Navier-Stokes equations to floating wind turbines platforms. Such
as formulation allows modeling of large-amplitude waves that result in maximum structural
loading which can often drive system design decisions.
The linear frequency-domain (LFD), time-domain dynamics (TDD), and Navier-Stokes
simulations for floating turbines have not been validated extensively using scale-model or full-
scale experiments. Experiments of this type may also reveal physical phenomena and platform
dynamics that are not properly modeled in simulations at their current stage of development. To
the best of our knowledge, References [38-45] are the predominant scale-model experiments
conducted on floating wind turbine platforms reported in the archival literature. Murakhami et.
al.38
performed early tests on a Hitz concept floating turbine. Shimada et. al.39
compared scale-
model results to LFD model results on the tri-floater concept, while Johanning40
and Utsonomiya
et. al.34
compare analytical model results for spar buoy systems. Scaled experiments modeling

39
floating turbines under development include Nielsen at. al.41
on the HYWIND spar buoy, and
Cermelli et. al.42
, Roddier et al.33
on the tri-leg WindFloat concept (described previously). Nihei
and Fujioka43
have conducted experiments on tension leg platforms. Length scale factor varies
between 22:1 and 150:1 in these studies. Scale-model tests of floating platforms used in the gas
and oil industry are more common. Chakrabarti44
and Chakrabarti and Grinius45
review work in
this area. It can be concluded from this literature review that the dynamic stability of floating
platforms is easier to achieve with the tension leg configuration versus a spar buoy configuration,
and that the effect of wind and rotor on platform motions is significant and must be included in
scale-model experimentation for accurate results.

40
3. Goals and objectives
Deep sea wind farms consisting of floating wind turbines are deemed an important
element in meeting the world’s energy needs. However, little work has been done to assess the
technical challenges that must be overcome to provide stable, durable, and cost-effective tethered
floating wind turbine platforms. This thesis research analyzes the motions of floating wind
turbine platforms by conducting physical experiments in existing facilities at WPI and Alden
Research Labs 46
.
In this thesis research, the dynamic motions of floating wind turbines were studied
through scale-model experiments. In Phase I testing, Froude-scaled TLP and Spar Buoy models
at a 100:1 scale were placed in a water flume and exposed to periodic waves at amplitudes
ranging from 0.5 cm – 7.5 cm and frequencies ranging from 0.25 Hz – 1.5 Hz. The testing was
conducted on simple tower and turbine models that only accounted for turbine weight at the
nacelle. The response of both tension leg platforms and spar buoy models to this wave loading
was studied through accelerometer and inclinometer measurements via a wireless data
acquisition system that eliminated the need for umbilical cables which would affect platform
motions. The effect of wave frequency, wave height, and tether pretension on response amplitude
operators for pitch, surge, and heave motions for both tension leg and spar buoy platforms was
determined.
In Phase II testing, emphasis was placed on further testing of the tension leg platform as a
more viable design for floating offshore wind turbines. The tension leg platform scale model was
improved by adding a disc to simulate drag force incident at the top of the tower, as well as a
rotor and blades to simulate the gyroscopic force due to turbine blade rotation at the top of the
tower. The scale model tension leg platform wind turbine was installed in the water flume

41
available at Alden Research Laboratory and was exposed to wind loading of known velocity as
well as periodic waves at amplitudes ranging from 0.5 cm – 4 cm and frequencies ranging from
0.3 Hz – 1.3 Hz. The response of the scale model wind turbine to this combined wave and wind
loading was studied using accelerometers and inclinometers. Force measurements on the tethers
were used to determine tether tension loads needed for tether anchor design on the ocean floor.
Finally, the effect of wave frequency, wave height, wind speed, and rotor moment of inertia on
response amplitude operators for pitch, roll, sway, surge, heave, and tether force variations was
studied for the tension leg platform wind turbine.
The goal of this thesis project was to conduct physical experiments on scale models of
the tension leg platform (TLP) and spar buoy (SB) type floating offshore wind turbine.
The objectives were as follows:
1. Develop a scale model of the NREL 5 MW TLP and Spar Buoy offshore wind turbine
platforms.
2. Develop instrumentation for acquiring the following data
a. Previously existing instrumentation38
that was further refined
i. Accelerations in surge, sway, and heave directions at the center of gravity and at
the nacelle of the model using accelerometers
ii. Pitch and roll angles at the nacelle of the model using an inclinometer
iii. Videos of experiments to verify wave heights and periods and observe platform
motions
b. Newly developed instrumentation
i. Forces in tethers using submersible load cells

42
ii. Wave height using a potentiometer / capacitance wave gage
3. Study the dependence of platform motions on the following variables
a. Thrust force at the nacelle via a drag disc
b. Gyroscopic effects due to a 3-blade rotor
c. Wave height and frequency incident at the platform
4. Evaluate response amplitude operators (RAOs) for pitch, roll, surge, sway, heave, and
various tether forces
5. Study and compare results obtained with those of similar experiments from the literature.
6. Use the scale-model experiment results to validate concurrent Navier-Stokes39
based
simulations being developed at WPI.
7. Compare measured scale-model accelerations, roll and pitch motions, and tether tension
forces to acceptable maximum levels for floating platform and tether anchor design.

43
4. Research methodology
4.1. Testing Summary
The current research on floating wind turbines was commenced by a background study of
the various types of floating platform configurations, and an assessment of the parameters that
will be measured as well as the equipment/instrumentation required to measure those parameters.
The wireless data acquisition system for measuring accelerations and angles was developed by
Eric Destefano47
and Eric Murphy.48
After acquisition and setup of instrumentation, initial Phase
I testing was conducted at the water tank available in the fluids lab at WPI. Final testing was
conducted at ARL from 10th
– 14th
January 2011 on a 100:1 scale model of the TLP type wind
turbine.
The result of this Phase I testing was processed and documented and the need for
studying gyroscopic and drag forces at the nacelle due to turbine blade rotation was identified. A
drag disc and 3-blade rotor with scaled weights and moments of inertia were installed at the
nacelle of the 100:1 scale model and it was ensured that the overall model weight remained
similar to that of the previous round of testing.
Phase II testing started with initial checks to ensure proper functioning of all equipment
at the water tank available in the fluids lab at WPI. Wireless data acquisition was modified to
improve accuracy, and load cell instrumentation was developed during Phase II testing. As in
Phase I, final testing was conducted at ARL from 19th
-27th
December 2011 with a focus on the
100:1 scale model of the TLP type wind turbine.

44
4.2. Scale Model Configurations
As mentioned previously, two phases of testing were conducted with two different
configurations for the TLP type wind turbine. Phase I of testing consisted of a simple turbine and
tower model where only the weights of the turbine, tower, and nacelle were modeled as shown in
Figure 24 (a). The gyroscopic and thrust forces due to turbine blade rotation at the top of the
tower were not modeled during this round. Emphasis was placed on acquiring platform
acceleration, inclination, and wave height data using a wireless data acquisition system
previously developed by Eric Murphy and Eric Destefano as a directed research project47, 48
. This
wireless system eliminated the need for an umbilical cord transmitting data from the model that
could potentially influence the platform motion and consequently affect the results of the
experiment.
In Phase II of testing, improvements were made to the data acquisition system to allow
simultaneous measurement of tether forces, accelerations, inclination, and wave height. A drag
disc made of lightweight plastic and reinforced by carbon-fiber spokes and ABS plastic at the
edges was developed for placement at the top of the tower (nacelle), as well as a 90 RPM motor
with a hub and three blades with variable moments of inertia to simulate the drag and gyroscopic
forces respectively. All design modifications are shown in Figure 24 (b) and will be discussed in
further detail in Section 4.3.

45
Figure 24 (a) – Detailed drawings of the model tension
leg platform (TLP) and spar buoy (SB) used in Phase I
experiments. 1- Tethers, 2-Horizontal legs, 3-
Instrumentation cylinder, 4- Buoyant tank, 5-Tower, 6-
Nacelle and rotor weight, 7-Nacelle accelerometer and
inclinometer, 8-Center of gravity accelerometer and
wireless transmitter, 9-Ballast weights. The top view for
the TLP and SB details the platform and tether
orientations with respect to the incident waves. 46
Figure 24 (b) - Detailed drawing of the tension leg platform used
in Phase II of experiments. All components stay the same as in
Figure 24, except as follows: 1- ABS plastic for drag disc edge, 2-
Shrink wrap for providing drag, 3- Carbon fiber blade, 4-
Nacelle platform for accommodating motor and inclinometer, 5-
Rotor hub attaching blades to motor, 6- Carbon fiber rods to
reinforce drag disc, 7- Load cells on water flume bottom, 8-
aluminum plate for load cells.
Waves
2
1
3
5
4
6
7 8
Water level

46
4.3. Platform design
A scale-model tension leg platform of 100:1 scale was constructed using three
dimensional printing technology and ABS plastic as the primary structural material, as described
previously in Section 4.2. ABS cement and primer was used to reinforce and water-proof the
platform.
A drag disc was integrated into the nacelle platform, with a surface area equal to the area
swept by the turbine blades (for a detailed explanation of drag-force scaling, please see Sections
4.4 and 4.5.3). The net weight of the drag disc had to be kept as low as possible; hence a design
was selected with carbon fiber spokes reinforcing a wheel of ABS plastic onto which a sheet of
light-weight plastic was installed. The wheel was printed using 3D printing facilities available at
WPI in eight similar arcs that were mated together using industrial grade adhesive. This feature
is shown in Figure 24 (b). In addition to the drag disc, a rotor and hub assembly was installed at
the nacelle platform to facilitate a study of the influence of gyroscopic forces at the top of the
tower on platform motion and stability. Figure 25 details the components of this assembly.

47
A motor was chosen with a gearhead to deliver the correct magnitude of scaled RPM as
based on the NREL 5 MW wind turbine (see Table 3). An extensive description of the
motor/gearhead will be provided in Section 4.5.3. The nacelle platform was designed to
accommodate the motor at a 5˚ slope with respect to the horizontal plane. This measure was
taken in order to match the model to the full-scale as accurately as possible and also to counter
any possible sagging of the spinning axis of the motor due to the additional weight of the blades
at the outer face of the gearhead rotary.
4.4. Froude scaling of model
Froude scaling was used for establishing scaling factors between the model and the full
scale platform. A geometric scaling ratio used for this scaling is first defined by:
(1)
where FS denotes full-scale and M denotes model. The geometric scaling factor λ=100 in Phase I
and II of tests. A Froude number is defined next by:
1 3
4
5
2
Figure 25 – Side view of nacelle assembly. The components shown are as follows: 1- Nacelle platform, 2-
Motor, 3- Gearhead, 4- Hub (press fits onto axis of gearhead), 5- indentation for accommodating motor

48
√ (2)
Where U is a characteristic velocity and L is a corresponding characteristic length. The
characteristic velocity in the model, Um is then calculated by matching Fr in the model and full-
scale, i.e. Frm=Frfs. Thus,
√
(3)
Then, the characteristic velocity ratio between model and full-scale is given by:
√ (4)
The scale ratio for any important physical parameter in this problem can then be determined in a
similar fashion. Methods for obtaining scale ratios for common physical parameters have been
detailed in Reference 44. Table 2 describes the scaling of common parameters for the platform
design.
The importance of such scale factors is to determine which factors will change and by
how much. For example, acceleration scales by a factor of 1 between the model and the full
scale; however, force scales by a factor of λ3. These numbers had a significant impact on the
platform design.
Table 2
Scale ratios for common variables using Froude scaling
Scale Ratios for Common Properties
λ = FS/M = 100
Variable Dimensions Units Scale Ratio Multiplier
Length L m λ 102
Mass M kg λ3 106
Angle None rad 1 1
Acceleration L/T2 m/s^2 1 1
Angular Acceleration
1/T2 1/s^2 λ-1 0.01
Angular Velocity
1/T 1/s
√ 0.1
Force (M*L)/T2 kg*m/s^2 λ3 106
Wave Height L m λ 100

49
Wave Period T s √ 10
Velocity L/T m/s √ 10
Moment of Inertia
M*L2 kg*m2 5 1010
It should be noted that when Froude scaling is applied, Reynolds number scaling is not
guaranteed. In fact (based on platform diameter) it can be shown that the Reynolds number for a
full-scale model differs by a ratio of λ3/2
, or for the purposes of this research, Refs/Rem=1000 44
.
The full scale MIT NREL 5MW wind turbine49
with the tension leg and spar buoy
configurations were used to set the values for full-scale parameters. These configuration
parameters are shown in Table 3 for the tension leg platform and

50
Table 4 for the spar buoy platform. The scale ratios from Table 2 were then applied to
determine the corresponding values for the scale model in order to set model design
requirements.
Table 3
Tension leg configuration design parameters for MIT NREL 5 MW (full scale) wind turbine 49

51
Table 4
Spar buoy configuration design parameters for MIT NREL 5 MW (full scale) wind turbine 49

52
Table 5 shows the design parameters for the tension leg and spar buoy models used in Phase I of
testing after Froude scaling was applied.

53
Table 5
Scale model dimensions and weights for Phase I 46
/ Phase II testing Tension Leg Platform
(Phase I) Tension Leg Platform
(Phase II) Spar Buoy (Phase I)
Tank height 0.21 m 0.21 m 0.60 m Tank diameter 0.22 m 0.22 m 0.14 m
Draft 0.18 m 0.18 m 0.59 m Tank weight (w.o. ballast) 3.18 kg 3.18 kg 0.635 kg
Ballast weight 0.6, 1.8 kg 0.6, 1.8 kg 3.71, 5.57 kg Mass on the C.G.
(DAQ instruments) 0.24 kg 0.24 kg 0.24 kg
Tower Mass 0.84 kg 0.84 kg 0.84 kg Nacelle Mass (incl. DAQ
instruments, for Phase II,
add rotor and aero disc)
0.207 kg 0.350 kg 0.207 kg
Total Platform Mass M 6.27 kg (1.8 kg ballast) 5.07 kg (0.6 kg ballast)
6.41 kg (1.8 kg ballast) 5.21 kg (0.6 kg ballast)
7.49 kg (5.57 kg ballast) 5.54 kg (3.71 kg ballast)
Buoyant displacement
mass, MB
7.25 kg 7.25 kg 9.42 kg
% Tether Pretension (M
B-M)/M
B
13.5% (1.8 kg ballast) 30.0% (0.6 kg ballast)
11.6% (1.8 kg ballast) 28.0% (0.6 kg ballast)
20.0% (5.6 kg ballast) 41.0% (3.7 kg ballast)
Platform resonant period Pitch, roll
Heave Surge, Sway
0.5 s 0.5
15.0
0.5 s 0.5
15.0
2.5 s 1.1
~30 (est.) Center of gravity
(distance below tower
base)
-.05 m (1.8 kg ballast)
-.05 m (1.8 kg ballast)
-.12 m (5.6 kg ballast)
Metacentric height -0.026 m (unstable) -0.026 m (unstable) 0.118 cm (calc) Tower height 0.95 m 0.95 m 0.95 m

54
4.5. Instrumentation
4.5.1. Load Cells
The TLP type wind turbine modeled in this thesis research was based on the 5 MW
NREL wind turbine. The maximum allowable force on each tether for the full-scale has been
documented to be in the order of 2*107
N 49
. This translates to a scaled force of 20 N for the
model, as forces scale by a factor of 106:1. For an in-depth description of scaling ratios, please
see Section 4.4. The Honeywell model 31 mid series load cells were selected for the experiment,
with an operating range of 4.5-45 N, linearity of ±0.15%, and a hysteresis of ±0.2%. Figure 26
shows a schematic of these load cells.
They were deemed to be most suited for the measurements required as they were
available with submersible capability and accounted for any increase in measured forces due to
the added weight of water when submerged. The load cells required an excitation voltage of 5
VDC, and output a signal of 2 mV/V. Instrumentation amplifiers were deemed essential for
obtaining accurate measurements and reducing noise in the data obtained, due to the low output
signal provided by the load cells.50
Figure 26 - Honeywell model 31 series load cell 50
schematic

55
4.5.2. Wireless instrumentation module
In order to conduct a detailed study of the stability of the TLP type platform, it was
necessary to measure accelerations and inclinations of the platform both at the center of gravity
as well as at the nacelle. The data acquisition system for measuring accelerations and inclinations
was developed by Eric Destefano47
and Eric Murphy48
. Wireless data acquisition was necessary
to eliminate an umbilical cord for data transmission which would affect platform dynamics.
Surge, sway, and heave were measured at the center of gravity of the platform via an
accelerometer module housed by an inner cylinder as shown previously in Figure 24 (a) (label 3).
In addition, pitch and roll were measured at the nacelle platform via an inclinometer. The
accelerometer and inclinometer modules were connected to a wireless transmitter that sent real-
time data to a receiver at the laptop that was connected to LabVIEW for recording the
measurements.
The inclinometer required a 10-30 VDC input signal and provided a 0-5 VDC output
signal. It was operated at 18 volts using 2 9V batteries that also powered the accelerometer and
wireless transmission module. Since the inclinometer was housed at the top of the tower, wires
were run through the inside and into the instrumentation cylinder, where the output signal was
received by the wireless transmission module.
In order to measure surge, sway, and heave, ADXL335 triple axis sensors were used that
required 1.8-3.6 VDC and measured ± 3 g’s. They were chosen due to their small footprint, light
weight, low power requirements, and compatibility with the wireless transmission module.
In order to generate a wireless signal, the sensors had to be connected to a
microcontroller directly on the model. An Arduino Duemilanove microcontroller was used to

56
provide the power to the sensors, process the analog signals, and output the signals to the
wireless card. The wireless signals were sent and received using two XBee 1mW antennas 48
.
Accelerometer accuracy for phase I and II is estimated at ± 1.0 cm/s2 and inclinometer
accuracy at ± 0.1˚. These accuracy estimates lead to calculated error bars of ± 0.025, ± 0.07, and
± 0.015 on pitch angle, surge, and heave RAOs respectively. Acceleration data was post-
processed to correct for pitch and roll angle inclinations. Response amplitude operators were
determined using LabVIEW® System Identification Toolkit routines. Hanning windows were
applied for power spectra calculations 46
.
The data from load cells described in Section 4.5.1 was not transmitted via a wireless
system, but hardwired to the data acquisition computer. The cables transmitting this data from
the load cells to the data acquisition computer were routed so as to not interfere with flow or
platform dynamics.
4.5.3. Spinning Rotor and Thrust Disc
The thrust and gyroscopic force incident at the nacelle of a floating offshore wind turbine
may impact on platform motions (for more details, see Section 1.3). In order to determine the
effect of these forces on the tension leg platform, an aerodynamic drag disc and a rotor were
installed for Phase II of testing. Modeling the actual aerodynamic thrust force incident on a
floating offshore wind turbine would require a detailed blade design, which was not within the
scope of this research. Moreover, an alternative approach via the aerodynamic drag disc and
rotor was taken as proper Reynolds Number scaling of the full-scale platform would require
model wind speeds in the order of 103 m/s.

57
An ideal Betz rotor was used for the design of the aerodynamic drag disc. An ideal Betz
rotor is an optimum rotor that extracts the maximum possible energy from the wind while taking
blade design considerations into account. A Betz rotor has a power extraction coefficient of 59%,
which implies that it converts 59% of the kinetic wind energy incident on it into kinetic
rotational energy at the central axis of the wind turbine.
The aerodynamic thrust force for an ideal Betz rotor, can be predicted using
(5)
Where = 1.29 kg/m3 is the density of air, m/s is assumed as an average wind
speed experienced by wind turbines offshore. The full scale thrust is calculated to be 1.7 MN,
which scales to a model thrust of 1.7 N (for scaling ratios see Table 2).
The drag force experienced by a circular disc of the type used in these experiments is
given by:
(6)
The required drag disc diameter is then given by the following expression.
√
(7)
At a nominal wind speed of 2.5 m/s for the model and assuming a drag coefficient of 1.2,
the drag disc diameter was determined to be 0.67 m 51
. Thus, a solid aerodynamic disk with a
diameter of 0.66 m was used to create the thrust force on the model, as shown in Figure 24 (b).

58
As stated earlier, the gyroscopic force incident on a floating wind turbine due to its
rotor’s rotation also alters its platform motions and was studied in scale-model experiments
conducted during Phase II of experimentation (for further detail on how gyroscopic forces effect
platform motions, see Section 1.3). The gyroscopic force was modeled by installing a rotor at the
nacelle with a scaled rotational speed matching that of the NREL 5 MW wind turbine.
The NREL 5 MW wind turbine has a maximum designed rotor speed of 12 RPM 49
,
which translates into a 120 RPM rotor speed for our 100:1 scale model that is the subject of this
thesis research. This 120 RPM parameter formed the basis of the specifications that were
required for installing a motor at the nacelle to study gyroscopic forces subjected on the TLP
model. In addition, it was deemed appropriate to use a 9V battery and a DC motor. A 2W motor
(model 110050) with a nominal RPM of 380 RPM/V was selected from Maxon Motors™. The
motor provided 3420 RPM at 9 volts (at no load) which was geared down to 120 RPM using a
planetary gearhead (model 118185) with a reduction ratio of 1:29, also provided by Maxon
Motors™. The motor and gearhead can be seen in Figure 51 (Appendix B – Instrumentation).
Finally, a remote start circuit was installed with the motor that was retrofitted from a garage-door
opening remote starter, to allow remote start of the rotors during testing. At the time of Phase II
testing, it was found that the motor provided 90 RPM after final assembly to the model. This
translates to a 9 RPM rotor speed at full scale.
In addition to selecting a motor that provided the required scaled RPM, it was also
necessary to evaluate the moments of inertia that both the model and full-scale platforms would
experience as a result of rotation of the turbine blades. The model moment of inertia is 4.85 x 10⁶
kg/m2
for the full scale 5 MW NREL turbine49
, which translates to a scaled moment of inertia of
4.851 x 10⁻³
kg/m2 at a scaling factor of 10
10:1 (see Table 2).

59
The required moment of inertia was achieved by changing the mass of neodymium
magnets attached to the rotor (consisting of carbon fiber rods) at a specified distance from the
central axis. This calculation proceeds as follows:
(8)
(
)
(9)
Where l is the length of the rod, R is the distance from the center of the rotor to the weights
placed on the rotor, and r is the rotor based disk radius.
Table 6 shows the calculations for the distance to place the magnets from the center of
the rotor hub to achieve the correct scaled mass moment of inertia. The variable ‘Ib’ is defined as
the moment of inertia for a baseline 5 MW NREL turbine rotor. I/Ib is therefore a ratio of the
fractional change in moment of inertia as a result of the changing the distance of the rotating
mass of magnets from the center of rotation. Rod mass was 6.94 x 10⁻³
kg, rotor hub mass was
1.62 x 10⁻²
kg, magnet mass was 2.218 x 10⁻²
kg, rod length was 0.24 m, and rotor based disk
radius was 3.81 x 10⁻²
m for this calculation. A ratio I/Ib of 1.4 was used as the nominal moment
of inertia for the platform during Phase II testing to compensate for a drop in rotor speed from
120 RPM to 90 RPM. A drop in the rotor speed resulted in a lower moment of inertia of the
spinning rotor, which was then raised by using the I/Ib ratio of 1.4. The ratio of 1.0 for I/Ib was
then used to study the effect of lowering moment of inertia on the platform motions. Table 6
shows moment of inertia values of the model for I/Ib ratios of 1 and 1.4.
Table 6
Moment of Inertia Calculations9
I/Ib Model I=mR2
I (kg.m2) Radius(m)
1.0 0.004851 0.189
1.4 0.006791 0.224

60
4.6. Test Facilities
Preliminary tests on the scale model platforms were conducted in the fluids lab at WPI,
which consists of a 4’ deep x 2’ wide x 8’ long water tank with a manually operated plank acting
as the simple wave generator. No actual data was acquired at this facility as the waves generated
were reflected back due to the absence of a damping beach. The fluids lab tank was mainly used
to conduct mock experiments including float tests of model platforms, and ensure proper
function of all equipment and instrumentation. Water flume 6 available at Alden Research
Laboratory (ARL) was an appropriate facility for performing experiments as it contained a beach
to absorb the waves and a mechanical generator operating at variable frequencies. The flume test
section was 7’ deep and 6’ wide, providing adequate room for installation of the model.
The depth of water in the flume was kept constant in both rounds of testing at 1.37
meters. The testing section of the flume was 183 cm (width) x 183 cm (height) with a transparent
side wall for model viewing. A video camera was used to capture the side view of the flume and
observe the wave heights incident at the platform and the platform surge, heave, and pitch
motions. In addition to the video camera capturing the side view of the TLP model, another
camera was installed directly downstream and above the model, with the purpose of capturing a
top view video to obtain any sway, yaw and roll motion of the model. Yaw motions were
observed, particularly when rotor and wind effects were modeled, however at present, the top
view videos have not been post-processed to yield yaw motions vs. time. This is due to time
constraints and the lack of availability of video processing software. The entire flume was 12
meters in length, and a plunger-type wave maker was located about 5 meters upstream of the
models. The wave maker generated waves with periods ranging from about 0.6 – 1.2 seconds,

61
and peak-peak wave heights from about 0 - 7 cm. This corresponded to full-scale wave periods
in a range of 6 – 12 seconds (a representative shorter period range for full-scale conditions) 46
and wave heights of 0 – 7 meters. A sloped beach with surface damping material, which damped
upstream wave reflections, was located about 5 meters downstream from the test section.
A float type wave height meter was placed 0.7 m upstream of the scale models on the
tunnel centerline during Phase I of testing. This probe had an accuracy of ±4 mm 46
. The
potentiometer float used to measure wave heights previously was replaced by a capacitance wave
gage for Phase II of testing. This was deemed more accurate in detecting lower frequency (larger
wave period) waves, and had an accuracy of ±0.8 mm.46
Figure 27 shows the overall
experimental setup used in Phase I of testing for the spar buoy and tension leg platforms.

62
For phase II of testing, an industrial fan was placed parallel to the aerodynamic drag disc
at a distance of 0.30 meters. In addition, a honeycomb was installed in front of the fan to better
direct the flow of wind incident at the drag disc. The fan’s axis of rotation was aligned with the
central axis of the drag disc and rotor, to ensure an even distribution of thrust force at the drag
disc. Wind velocities at the front of the aero disc were measured using a pitot tube and a high-
(a) (b)
1 2
3
Figure 27 – (a) Load cell instrumentation setup for first round testing. 1- Voltmeter, 2- NI DAQ,
3- Power supply. (b) Tension Leg Platform model, (c) Spar Buoy model
(c)

63
resolution transducer. The wind velocities were set to two values of 2.5 and 3.5 m/s,
corresponding to a model thrust force that is calculated as follows.
(10)
In the above equation, Cd is the drag coefficient, A is the incident area, ρ is the density of
the medium, and is the incident velocity. Drag forces corresponding to velocities of 2.5 m/s
and 3.5 m/s were calculated at 1.7 N and 3.2 N for the model, corresponding to full scale drag
forces of 1.7 MN and 3.2 MN respectively. Velocity for the full scale model can then be
calculated as follows.
√
(11)
The full scale velocity according to equation (11) is 21.6 m/s and 30.1 m/s for model
velocities of 2.5 m/s and 3.5 m/s respectively.
Figure 28 and Figure 29 show a view of the test configuration during Phase II of testing
at the WPI Fluids Lab and at Alden Research Laboratory respectively.

64
Figure 28 - Test setup at WPI Fluids Lab (Phase II testing)
Figure 29 - Test setup at ARL (Phase II testing)

65
4.7. Post processing of data
The experimental data measured is described in Table 7.
Table 7
Description of measured parameters
Measured Parameter Units Equipment
used Notes
Tether Forces Pound-force Load Cells
4 load cells were used to measure
tension in each tether attached to
platform
Center of Gravity
Acceleration
Gravitational
acceleration (g)
Triple-axis
Accelerometer
Acceleration was measured in 3
directions of platform motion: surge,
sway, and heave. (See Figure 5)
Nacelle Acceleration Gravitational
acceleration (g)
Triple-axis
Accelerometer
Nacelle acceleration was not measured
in Phase II testing
Pitch and Roll
Angles Degrees Inclinometer
An inclinometer at the nacelle measured
angular displacement of the platform
Wave Height Inches Capacitance
Probe
Probe was placed 1 m upstream to
platform in test configuration
Data was acquired at a rate of 8 samples per second, and each experimental run was
conducted for approximately 1 minute.
In the first stage of post-processing of the data, corrections were made to the
accelerations to account for the added component of gravitational acceleration for surge, sway,
and heave motions. These corrections are needed since when the platform pitches or rolls at
angles ϕ (roll) and θ (pitch) respectively, the accelerometer will measure surge, heave, or sway
accelerations due to the gravitational field even if the platform is not accelerating in these
directions. The following correction equations are derived by transforming the gravitational
acceleration vector in the earth frame to the body frame of the platform (where ϕ is roll and θ is
pitch, as shown previously in Figure 5)
(12)
(13)

66
(14)
Corrections were also made to account for the fact that surge, sway, and heave
acceleration values drifted slightly as the batteries powering the sensing equipment became
weaker. The drifting observed was 10-20% over a day of testing. These corrections were made
by averaging the value of accelerations present in raw data and subtracting the average value
from raw data values to ‘de-mean’ the data. Peak to peak wave heights measured with a
capacitance probe were confirmed by comparing them to peak to peak wave heights observed in
side view videos of the platform. In some instances for the large wave periods a gain adjustment
was made to the probe time series to match the video peak to peak values.
In the next stage of data processing, the time-domain measured parameters (load cell
(force), accelerations (surge, sway, heave), angles (pitch, roll), and wave height) were converted
into frequency domain power spectra using LabVIEW Signal Express. The configuration used
for time to frequency domain conversion is shown in Figure 53 (Appendix C- Experimentation).
Frequency spectra were obtained for all parameters measured in Table 7. A Hanning filter was
applied to obtain the frequency spectra for each parameter to ensure minimal noise in the results
obtained. A time series window of 15 seconds was taken for all experiments. The peaks of the
spectrum corresponded to the dominant peak observed at a particular frequency in the time-series
of the measured parameter. Validation checks were performed on the data at this stage as
follows:
Peaks in the frequency spectra of wave height should be close to the frequency of the wave
as observed from the side-view videos

67
Magnitude of the peaks in the frequency spectra (obtained from LabVIEW Signal Express)
for each measured parameter should closely match the peak-to-peak value of the same parameter
in the time series
For experiments involving a study of the effect of gyroscopic and thrust forces, the rotor and
fan were turned on simultaneously to accurately observe the change in measured parameters.
Thus, the time-to-frequency domain conversion was only performed in the time duration when
both the rotor and fan were switched on and their effects could be clearly observed in the
measured parameter.
Figure 30 shows typical power spectra used in post-processing for a measured parameter.
The power spectrum for the upstream tether force has been shown as the output parameter, and
wave height spectrum is the input parameter. This figure shows how power spectral density
varies with frequency for both the upstream tether force and wave height. A peak at 1.25 Hz in
Figure 30 - Power spectra input and output parameters. Phase II test. No wind. Rotor moment of
inertia = 0.006791 kg.m2. Peak-to-peak wave height = 2 cm, Wave period = 0.80 seconds.

68
the wave height spectrum implies that this is the dominant frequency of the incident wave,
translating to a 1/1.25=0.8 second wave period. The output response similarly shows a peak at
1.4 Hz frequency.
In the final stage of post-processing of the data, Response Amplitude Operators (RAOs)
were calculated for the parameters described in Table 7.
An RAO is a standard dimensionless ratio that is used to summarize dynamic motions of
floating structures. In other contexts, is it also called a transfer function or gain. It is defined
using
√
(15)
Where SR and SI are the power spectral densities of the response and input respectively.
For the dataset studied in this thesis research, the input is the wave height frequency spectra. The
power spectral densities are taken at the same frequency f as that corresponding to the observed
peak in the wave height spectra. Higher power density values than those corresponding to peaks
at the correct frequency were only seen at frequencies <0.1 Hz, and hence not taken into
consideration. For acceleration data, the following modification was necessary to convert
acceleration magnitudes to amplitude magnitudes. This is done since it is standard to present
surge, sway, and heave RAOs in terms of amplitude (cm/cm) instead of acceleration (g/cm).
√
(√ ) (16)
The peak frequency response of the output occurred at the wave height frequency (in the linear
regime only) for RAOs.

69
5. Phase I Testing Results
5.1. Tension Leg Platform
The first phase of testing was conducted at Alden Research Laboratory in early 2011, as
previously described in Section 4.1 and Section 4.6. Figure 31 shows the time traces for surge
and heave accelerations, wave heights, and pitch/roll angles for a typical experiment conducted
during phase I testing. A 10 second time window was arbitrarily chosen from the experimental
data to obtain these plots. It was observed that platform responses occurred at the incident wave
frequency, and that surge accelerations dominated heave accelerations.
Surge accelerations were also larger at the nacelle compared to the center of gravity due to the
Figure 31 - TLP baseline experiment (Phase I testing). Wave period = 0.86 sec Ballast weight = 0.6 kg.
(a) Nacelle accelerations. (b) Center of gravity accelerations. (c) Wave height. (d) Pitch motion 46
.

70
added angular acceleration at the top of the tower due to oscillatory motions 46
. The dominant
surge acceleration reaches a maximum value in the order of 0.1 g’s. Sclavounos49
has observed
similar maximum acceleration values of 0.07 g’s when modeling floating turbine platforms,
where simulations developed to model rigid-bottom fixed offshore structures are extended to
model floating structures. Maximum allowable wind turbine acceleration levels of 0.3 g’s are
generally considered acceptable51
.
Maximum measured pitch angles were in the order of 2 degrees. However, acceptable
values lie within a range of 5-7 degrees according to the results of CFD based simulations
conducted by Roddier et. al46
.
Figure 32 - Response amplitude operators for the TLP (Phase I testing). (a) Roll RAOs,
(b) Surge RAOs, (c) Roll RAOs 46

71
An important set of results obtained from Phase I of experiments were the Response
Amplitude Operators shown in Figure 32 – calculated as described in Section 4.7. Data from
multiple experimental runs at a specific wave period are presented in Figure 32 in order to show
the typical level of scatter in Phase I data. Error bars based on instrument accuracy are also
presented in Figure 32. It is observed that data scatter is generally within expected error bars.
The effect of varying tank ballast (and consequently tether pretension) in the TLP model was
studied when computing the RAOs. Heave and surge RAOs were considered for motions at the
center of gravity of the platform. RAOs for pitch deflection were observed at a maximum of
0.3°/cm. The pitch RAO increased at smaller wave periods (higher frequencies) near the resonant
period for pitch of 0.5 seconds. Surge RAOs followed the monotonically increasing trend with
respect to wave period that has been previously observed in literature (please see Section 2.4).
The RAOs for heave also followed similar trends 46
. Resonant period peaks were not visible in
Phase I RAOs, as the NREL model resonant periods were designed to be well outside the limits
of sea state wave periods. The resonant frequency of the tower was not experimentally
determined, as it was not modeled with the same stiffness as that of the full-scale platform, and
was hence not perfectly plastic. All results consisting of RAOs have been summarized and
presented in Figure 32.
Finally, fairly small amplitude roll and sway responses (shown in Figure 39) were
observed for the TLP model, as the primary response of the platform was expected to occur in
the direction of the input. Waves were incident at the platform in the surge direction, and hence
the primary response was observed in this direction, with roll and sway being secondary (and
hence lower) responses.

72
5.2. Spar Buoy
As mentioned previously, a study of the physical motions of the spar buoy platform was
also performed during Phase I testing. Time traces for nacelle and center of gravity accelerations
in surge, heave, wave heights, and pitch angles for a typical experiment run of the spar buoy
model are shown in Figure 33. Parameter settings from

73
Table 5, a wave period of 0.95 seconds, peak-to-peak wave height of 3 cm, and 5.57 kg
ballast were used for this experimental run. Platform (model) responses at the incident wave
frequency were clearly observed. Heave accelerations were of a similar order of magnitude as
that of the TLP, both at the nacelle and at the center of gravity. Pitch responses were generally of
less than 1° amplitude.
Response amplitude operators (as a function of wave period) for the spar buoy platform
are shown in Figure 34. Heave and surge RAOs were determined for platform center of gravity
motions. The overall trends in the RAOs were observed to be similar to those of the tension leg
Figure 33 - Spar buoy baseline experiment. Wave period = 0.95 sec, Ballast weight =5.57 kg. (a)
Nacelle accelerations, (b) Center of gravity accelerations, (c) Wave height, (d) Pitch motion 46
74
platform. Pitch angle RAOs were slightly higher for the spar buoy compared to the tension leg
platform and a slightly larger scatter was observed in the data. Surge RAO amplitudes were
lower for the spar buoy compared to the tension leg platform. This could be due to the inclined
60° orientation of the spar buoy tethers which more effectively damped surge motions compared
to the vertical TLP tethers. Heave motion amplitudes were slightly lower for the spar buoy
compared to the TLP. As before, there was little effect of tether pretension on the RAO values.
5.3. Comparison with numerical simulations (Nematbaksh et. al.)
Nematbaksh et. al.37
conducted similar studies with scale model tension leg and spar
buoy platforms using Navier-Stokes based numerical simulations. The computations in these
Figure 34 - Response amplitude operators for the spar buoy. 46
3.71 kg ballast 5.57 kg ballast

75
studies used a three dimensional rectangular domain that encompasses the water, water-air
interface, and the air. The domain is resolved by a regular structured grid, stretched to allow a
cluster of grid points around the turbine. Similar to scale-model experiments, the turbine is
attached to the bottom of the flume by four pre-tensioned tethers. This made the numerical study
identical to the experimental one conducted during Phase I testing. Figure 35 shows the
numerical domain and the location of the turbine. The computational model in the numerical
simulations consists of the flow solver; tracking of the free surface and solid, inclusion of the
tower and rotor weight, and the tether model.
The baseline simulation was conducted in a rectangular domain (flume) with 16 × 1 × 1.8
meter length, width, and height respectively, with water height set at 1.37 meters. The length of
the domain was long enough to prevent the effects of reflecting waves. The wave period and
frequency are 1.0 sec and 0.07 meters respectively. In Figure 36 (a), a three dimensional view of
the baseline simulation is shown. Figure 36 (b, c) shows the side view of the TLP motion at two
different time steps 37
.
Figure 35 - (a) Three-dimensional view of numerical domain. (b) Front view;
(c) Side view of refined grid near cylinder 37
.

76
Figure 36 - Simulation of scale-model floating wind turbine platform, baseline
run. (a) Three-dimensional view (t/T=30) (b), (c) Two-dimensional view (cylinder
midplane) at t/T = 28.8, t/T = 29.2. T = wave period 37
.
Figure 37 - Surge and heave motions (platform center of gravity), wave heights, and pitch
motions. Wave period=1 sec. wave height = 0.07 m. Surge and heave motions are non-
dimensionalized with buoyant tank diameter 37
.

77
In Figure 37, surge and heave motions of the platform center of gravity are presented,
along with wave heights, and pitch angle motions. Periodic responses at the incident wave
frequency were clearly observed. Surge motions dominated over heave motions, a trend clearly
reflected in both numerical and experimental studies. Peak to peak pitch angle amplitudes were
approximately 2.5˚ 37
.
In Figure 38, response amplitude operators are presented for the numerical simulations
and Phase I scale model TLP experiments 37, 46
. Response amplitude operators for the numerical
simulation were determined using LabVIEW® System Identification Toolkit routines in an
identical manner as for the experimental data. Hanning windows were applied for power spectra
calculations. Wave periods and heights for the numerical simulation varied over the ranges of
0.68 – 1.2 sec and 3.5 – 7 cm for the RAO study. This corresponded to wave periods of 6.8 – 12
sec and wave heights of 3.5 – 7 meters when applying a 100:1 scale and Froude scaling methods.
It can be observed that there is good agreement in surge and pitch RAOs for the
numerical simulation and experiments, confirming that the simulations are capturing the most
important physical effects associated with the wave loading on the platform. The agreement for
heave motions is less favorable, with the numerical simulation over predicting the heave
amplitudes, especially at shorter wave periods. Future work is needed to better tune the tether
model in the simulation to match the tethers in the experiments.

78
Figure 38 - Response amplitude operators for numerical simulations and scale
model experiments for the tension leg platform. 37, 46

79
5.4. Roll and Sway Responses
The roll and sway responses observed for both the tension leg platform (shown in Figure
39) and spar buoy were of fairly small amplitude during phase I experimentation. It was realized
that future work would be needed to determine whether these responses were due to some slight
asymmetry in the set-up, wave reflections from the flume side walls, or whether they were
caused by non-linear coupling with surge, heave, and pitch motions. This has been addressed in
phase II experimentation, the results of which will be presented in the next section.
Figure 39 - Roll and Sway Responses for tension leg platform. Wave period = 0.86 sec.,
Ballast weight = 0.6 kg 46
.

80
6. Phase II Testing Results
6.1. Baseline run, wave loading
The second phase of testing was conducted at ARL in December 2011, as previously
described in Section 4.1 and Section 4.6. Figure 40 shows the time traces for surge and heave
accelerations, wave heights, and pitch/roll angles for the baseline experimental run conducted
during Phase II testing. A 10 second time window was arbitrarily chosen from the experimental
data to obtain these plots.
Figure 40 - TLP baseline experiment – No wind or rotor effects (Phase II testing). Wave period =
0.82 seconds. Peak-to-peak wave height = 1.9 cm (a) Tether Forces. (b) Center of gravity
accelerations. (c) Wave height. (d) Pitch motion.
Upstream tether force
Downstream tether force
Heave
Surge
Sway
Pitch
Roll
(a) (b)
(c) (d)

81
As mentioned previously in Section 4.6, gyroscopic and aerodynamic drag effects on
platform motions were studied during Phase II experimentation by adding a spinning rotor and
wind incident on an aerodynamic drag disc. However, in the baseline run of Figure 40, wind and
rotor effects are not modeled. As a result, the platform dynamics shown are solely due to wave
loading.
For the initial test, tether tensions for all cables were obtained from measurement. It was
confirmed that the sum of these equaled the net reserve buoyancy force on the platform (which is
equal to the difference between the buoyancy and weight of the platform). The tether forces
obtained from measurement were then balanced using a Wheatstone bridge at the beginning of
this experimental run, thus the tether force curves in Figure 40 and later figures show a zero
mean.
It was observed in Figure 40 that dominant platform motions occurred at the incident
wave frequency, and that surge accelerations dominated heave accelerations, which was similar
to platform behavior during phase I of testing. The dominant surge acceleration reaches a
maximum value in the order of 0.2 g’s, which is slightly higher than that obtained during Phase I
testing, but still within allowable values as present in the literature 51. Peak-to-peak pitch values
followed a similar trend, with a maximum peak-to-peak pitch angle of 4 degrees. A higher pitch
angle was observed in Phase II testing in comparison with Phase I possibly due to the presence
of a non-uniformly distributed mass at the nacelle during Phase II testing, which had been
modeled using simple weights at the nacelle in Phase I testing.

82
6.2. Rotor effects
In Figure 41, the effect of adding a spinning rotor without wind is studied. Although a
spinning rotor that is extracting energy implies a thrust force, Figure 41 is presented to isolate the
gyroscopic effect on platform motions. Moment of inertia for the model was 0.006791 kg.m2.
The moment of inertia was selected at 140% of the scaled moment of inertia of the NREL 5 MW
wind turbine (see Table 6). This was deemed a nominal value as the rotor speed for all
experimental runs was reduced to 90 RPM and the moment of inertia consequently increased to
140% of the NREL 5 MW turbine to model similar gyroscopic effects. The wave period in
Figure 41 was approximately the same as that of the baseline experiment. A detailed study of the
gyroscopic effect on platform motions when wind effects are also added will be given later in
this section by studying RAO trends. The peak-to-peak wave height for results shown in Figure
41 was higher than that of the baseline run, as a result of which upstream/downstream tether
forces; surge, sway, and heave accelerations; and pitch/roll amplitudes also showed higher
amplitudes. However, since RAO trends normalize these parameters by wave height, a
comparison can be made between experimental results obtained at different wave heights.

83
It is shown in Figure 41 compared to the baseline run of Figure 40 that tether forces,
surge, sway, and pitch amplitudes are largely unchanged. Heave motions increase slightly and
roll motions decrease slightly compared to the baseline run.
Figure 41 - TLP experiment – Rotor effects (Phase II testing). Wave period = 0.86 sec. Rotor
moment of inertia=0.006791 kgm2. Peak-to-peak wave height = 4.45 cm (a) Tether Forces. (b)
Center of gravity accelerations. (c) Wave height. (d) Pitch motion.
Upstream tether force
Downstream tether force
Surge
Heave
Sway
Pitch
Roll
(a) (b)
(c) (d)

84
6.3. Wind effects
Figure 42 shows the effect of adding only wind effects (with no rotor effects) on platform
motions. Tension increases in the upstream tethers due to the presence of the thrust force
upstream. Surge, sway, heave, and pitch motions are largely unchanged when compared to the
baseline run. Roll motion decreases slightly and a shift is observed in mean surge acceleration as
well as upstream and downstream tether forces.
This shift is an expected result of the thrust force incident on the aerodynamic thrust disc
at the nacelle of the platform that physically tilts the platform and moves it further downstream.
Figure 42 - TLP experiment – Wind effects (Phase II testing). Wave period = 0.87 sec.
Wind speed=15m/s. Peak-to-peak wave height = 3.8 cm (a) Tether Forces. (b) Center of
gravity accelerations. (c) Wave height. (d) Pitch motion.
Upstream tether force
Downstream tether force
Heave
Surge
Sway
Pitch
Roll
(a) (b)
(c) (d)

85
A constant thrust force acting on the platform in the surge direction appears as a constant
acceleration that is detected by the accelerometer and causes the shift in mean surge acceleration.
It can be observed from Figure 42 (a) that mean upstream tether force Fu=1.7 N, with a
corresponding mean downstream tether force Fd=-1.3 N. By taking a moment balance about the
platform center of gravity, the thrust force incident on the aerodynamic drag disc can be
estimated as.
(17)
Where ΔFt=Fu-Fd is the net tether force incident on the platform, and Rt and Rl are perpendicular
distances from the center of gravity of the platform to the nacelle and the legs respectively. With
Rt=1.05 m and Rl=0.22 m, the thrust force for this experimental run was calculated to be 1.3 N,
which is in good agreement with the expected thrust force calculated in Section 4.6. This
calculation serves to validate the tether force measurements.
A mean yaw angle of 5˚ was observed in platform motion under wind loading; this was not
accounted for in drag calculations and disc design.

86
6.4. Combined wind and rotor effects
While the results in Sections 6.2 and 6.3 help to isolate trends in the data and validate our
measurements, correct modeling requires adding both gyroscopic rotor effects and aerodynamic
thrust force effects to the experiments. The results of this modeling are presented in this section
starting with Figure 43 which shows time traces of the platform motions. Wind speed of 2.5 m/s
was incident at the aerodynamic thrust disc, corresponding to a full scale wind speed of 21.1 m/s
(see Section 4.6). A spinning rotor was added with moment of inertia = 0.004851 kg.m2,
equivalent to a nominal MOI rotor speed for an NREL 5 MW wind turbine (see Section 0).
Figure 43 - TLP experiment – Rotor and wind effects (Phase II testing). Wave period = 0.88 sec.
Wind speed=15 m/s. Rotor moment of inertia=0.004851 kg.m2. Peak-to-peak wave height = 1.2 cm (a)
Tether Forces. (b) Center of gravity accelerations. (c) Wave height. (d) Pitch motion.
Upstream tether force
Downstream tether force
Heave
Surge
Sway
Pitch
Roll
(a) (b)
(c) (d)

87
It was observed in Figure 43 that the influence of wind reduces mean surge amplitude as
well as mean downstream tether force as compared to the baseline case, as in the case shown in
Figure 42 with wind only. This is because a thrust force at the nacelle creates a moment about the
center of gravity that tilts the entire platform, thus increasing the tension in upstream tethers and
decreasing the corresponding tension in downstream tethers. Peak to peak amplitudes for surge,
sway, heave, and pitch motions as well as upstream and downstream tether forces remain largely
unchanged compared to the baseline run. Roll motion amplitude decreases, however, in
comparison with the baseline run.
It is once again noted here that the peak-to-peak wave height for results shown in Figure
43 are lower than that of the baseline run, as a result of which upstream/downstream tether
forces; surge, sway, and heave accelerations; and pitch/roll amplitudes also show lower
amplitudes. However, since RAO trends normalize these parameters by wave height, a
comparison can be made between experimental results obtained at different wave heights.

88
Figure 44 shows the effect of increasing rotor moment of inertia to 0.006791 kg m2
(nominal NREL 5 MW turbine), while keeping all other control variables (with the exception of
wave height) the same as those during the previously shown experimental run.
It was observed from Figure 44 that peak-to-peak surge acceleration increased to 0.25
g’s, due to the presence of both wind and rotor effects. Peak-to-peak amplitude of upstream and
downstream tether forces increased when compared to the baseline run due to the presence of
higher amplitude waves incident at the platform. A similar trend was observed in peak-to-peak
Figure 44 - TLP experiment – Rotor and wind effects (Phase II testing). Wave period = 0.88 sec.
Rotor moment of inertia=0.006791 kg.m2. Wind speed=15 m/s. Peak-to-peak wave height = 3.81
cm (a) Tether Forces. (b) Center of gravity accelerations. (c) Wave height. (d) Pitch motion.
Upstream tether force
Downstream tether force
Heave
Surge
Sway
Pitch
Roll
(a) (b)
(c) (d)
89
amplitudes of surge, sway, heave, pitch, and roll motions. Since Response Amplitude Operators
(RAOs) normalize these parameters by wave height, wind and rotor effects can be isolated and
studied between experimental results obtained at different wave heights.
6.5. Response Amplitude Operators
To systematically study the effect of wave frequency and amplitude as rotor moment of
inertia and wind velocity is varied, Response Amplitude Operators (RAO) calculated as
described in Section 4.7, for runs with combined wind/rotor effects are presented in Figure 45.
Surge, heave, and sway RAOs were considered for motions at the center of gravity of the
platform. RAOs for pitch deflection were observed at a maximum of 1.2°/cm in the absence of
wind and rotor effects. Surge RAOs for the baseline run followed the monotonically increasing
trend with respect to wave period that has been previously observed in literature (please see
Section 2.4) and as was observed in Phase I of experimentation. The RAOs for heave and sway
also followed similar trends. All wave heights collapsed onto a single curve for RAOs, hence the
effect of variation in wave height was not studied. A saturation of values was observed in wave
height time traces at higher wave amplitudes, as a result of which the wave heights were
truncated at these amplitudes. This was accounted for by multiplying the existing wave height
values by a factor that equated the sensor-obtained wave heights to those seen in the side view
videos.
Higher RAO values than those seen for baseline results were observed in Figure 45 at an
intermediate moment of inertia of 0.004851 kg.m2
for surge motion. A larger moment of inertia
of 0.006791 kg.m2 incident
at the nacelle of the platform reduced surge RAO to the same order
of magnitude as that of the baseline run. This trend has been further detailed for sway RAOs in
Figure 46. Similar trends were observed for heave, sway, and roll motions in Figure 45.

90
Figure 45 - Response amplitude operators for the TLP (Phase II testing).
(a)
(e)
(d) (c)
(b)
(f)

91
The large variation in surge and heave RAOs due to gyroscopic effects was not expected
(see gyroscopic physics discussion in Section 1.3). Further study will be required to evaluate the
possible cause(s) of these trends.
For sway and roll RAOs the trend of largest RAO values occurring at an intermediate
moment of inertia (0.004851 kg.m2) was repeated. Sway RAO has a value of 0.042 cm/cm at an
intermediate moment of inertia of 0.004851 kg.m2, as shown in Figure 45. The RAO value drops
to 0.01 cm/cm at a higher moment of inertia of 0.006791 kg.m2. The observed trend may be due
to a shift in phase angle differences between roll (or sway) and yaw motions between the
intermediate and larger moment of inertia cases.
It was difficult to discern repeatable trends in the RAO results of pitch and upstream
tether force, in Figure 45 (f) and (d) respectively, due to large scatter in the data. The large
scatter may be due to turbulent effects introduced by the modeled wind flow. However, the
effect of gyroscopic and thrust forces incident at the platform did not increase RAO values
beyond maximum acceptable design limits discussed earlier (see Section 2.4 and 4.2). The
common trend of larger RAO values for the intermediate moment of inertia cases can also be
observed in the pitch and tether force RAO plots despite the higher scatter present in this data.
Figure 46 - Gyroscopic effects on platform motion

92
Further testing is necessary in summer 2012 to gather more consistent pitch/tether force data and
RAOs.

93
7. Conclusion and future work
In this thesis research, wave tank experiments were conducted on Froude-scaled floating
wind turbine platforms. During Phase I testing, tension leg platforms and spar buoys were
modeled with a simple floating offshore wind turbine and nacelle, and the dominant surge,
heave, and pitch motions of the two platforms were measured. Periodic wave motions of known
amplitude and frequency were imposed on the model to study pitch, heave, roll, surge, and sway
motions using accelerometers, inclinometers, and a potentiometer for wave height measurement.
Signal analysis and filtering techniques were used to refine the obtained data, and a Fourier
analysis was conducted to study the dominant frequencies. Finally, Response Amplitude
Operators (RAO’s) were plotted for each data set to standardize the results and study the overall
trend with respect to changes in wave amplitude and frequency. It was shown that surge motion
of the platform dominated other motions for both the tension leg platform and spar buoy, and
varying tether pretension has little effect on response amplitude operator values. It is expected
that the results will help overcome a current lack of experimental data on floating wind turbines,
and can be used to validate the hydrodynamic kernels of linear frequency-domain (LFD) models,
time-domain dynamics (TDD) models, and computational simulations, including those that were
concurrently conducted by Nematbaksh et. al. Preliminary validation of the numerical
simulations against these experiments was shown through favorable comparison of response
amplitude operators, particularly for the dominant surge and pitch motions.37, 46
Further experiments were conducted during Phase II testing where the aerodynamic
thrust load and rotor gyroscopic effects were modeled, and tether tensions were measured. At
this stage, emphasis was placed on further testing of the tension leg platform as a more viable
design for floating offshore wind turbines. The tension leg platform scale model was improved
94
by adding an aerodynamic disc to simulate thrust force incident at the top of the tower, as well as
a rotor and blades to simulate the gyroscopic force due to turbine blade rotation at the top of the
tower. Periodic wave motions of known amplitude and frequency were imposed on the model to
study pitch, heave, roll, surge, sway motions and mooring cable tensions using accelerometers,
inclinometers, capacitance wave gage, and load cells. Signal analysis and filtering techniques
were used to refine the obtained data, and a Fourier analysis was conducted to study the
dominant frequencies. Finally, Response Amplitude Operators (RAO’s) were plotted for each
data set to standardize the results and study the overall trend with respect to changes in wave
amplitude and frequency.
Higher RAO values than those seen for baseline results were observed during Phase II
testing at an intermediate moment of inertia for surge, heave, sway, and roll motions. A larger
moment of inertia reduced RAO values of these motions to the level as that of the baseline run.
The observed trend in sway and roll motions was suggested to be due to a shift in phase angle
differences between roll (or sway) and yaw motions between the intermediate and larger moment
of inertia cases.
It was difficult to discern repeatable trends in pitch and tether force RAO due to large
scatter in the data. However, the effect of gyroscopic and thrust forces incident at the platform
did not increase RAO values beyond maximum acceptable design limits, and the common trend
of larger RAO values for the intermediate moment of inertia cases was also observed in the pitch
and tether force RAO plots despite the higher scatter present in this data.
Further testing is necessary in summer 2012 to gather more consistent pitch/tether force
data and RAOs. The aerodynamic thrust disc and scaled rotor will also be added to the scale-
model spar buoy platform so that differences in TLP and spar buoy platform responses can be

95
measured with more detailed modeling included. Future work may also include additional testing
of wave direction effects, different tether configurations for the spar buoy, and physical
modeling of random incident waves. Results from this future testing will be compared to the
Navier-Stokes based numerical simulations.

96
References
1Enerdata. “Global Energy Statistical Yearbook”. s.l. : Enerdata, 2010.
2EIA. “International Energy Statistics.” US Energy Information Administration (EIA), 2011.
3Department of Energy. “20% Wind Energy by 2030: Increasing Wind Energy's contribution to
the U.S. Electricty Supply.” US Department of Energy, 2008.
4Hand, et al. “Power system modeling of 20% Wind-Generated Electricity by 2030.” Golden,
CO : National Renewable Energy Laboratory, 2010.
5World Wind Energy Association. “Word Wind Energy Report 2012. World Wind Energy
Association, 2012.
6Paul Sclavounos, Christopher Tracy and Sungho Lee. “Floating Offshore Wind Turbines:
Responses in a Seastate Pareto Optimal Designs and Economic Assessment.” Cambridge, MA :
Massachusetts Institute of Technology, 2007.
7US Department of Energy. “Offshore Energy Report. s.l.” US Department of Energy, 2008.
8Olinger, David J. “Proposal to NSF.” Worcester Polytechnic Institute, 2009.
9Harvell, J., Petrosan, A., Rios, W., Vinci, D. “Design of scale-model floating wind turbine.”
Worcester Polytechnic Institute, 2012
10Roddier, D., Cermelli, C., and Aubault, A., “Integrated dynamic analysis of floating offshore
wind turbine.” Proceedings of the International Offshore and Polar Engineering Conference,
2009b, pp. 378-383
11Heronemus, W.E., “Power from offshore winds,” Proc. of the 8
th Annual Conference and
Exposition on Applications of Marine Technology to Human Needs, 1972, pp. 535-466.
12Heronemus, W.E., “A proposed national wind power R&D program.” Wind Energy
Conversion Systems, 1973.
13
Tong, K.C. “Technical and economic aspects of a floating offshore wind farm.” Croydon,
Surrey, UK : Elsevier - Journal of Wind Engineering and Industrial Aerodynamics, 1998,
Volumes 74-76.
14Henderson, A.R. and Patel, M.H. “On the modeling of a floating offshore wind turbine. Wind
Energy. 1998, Vol. 6.
15Henderson, A.R, Leutz, R and Fuji, T. “Potential for floating offshore wind energy in
Japanese water.” Kitakyushu, Japan : s.n., 2002.

97
16Musial, W, Butterfield, S and and Boone, A. “Feasibility of Floating Platform Systems for
Wind Turbines.” Reno, Nevada : National Renewable Energy Lab, 2004.
17Newman, J.N. “Marine Hydrodynamics.” Cambridge, Massachusetts : The MIT Press, 1977.
18Butterfield. S.,Musial, W., Jonkman, J. and Sclavounos, P., “Engineering Challenges for
Floating Offshore Wind Turbines.” Copenhagen, Denmark : Offshore Wind Conference / NREL,
2005.
19Environmental and Energy Study Institute. “Offshore Wind Energy – October 2010.”
Environmental and Energy Study Institute, 2010
20Reuters. “New 367 MW offshore wind farm opens in UK.” London : Reuters, 2012.
21Scottish and Southern Energy plc. “Walney Wind Farm – Wind Energy Offshore”. SSE, 2011
22Statoil. “Hywind - the world's first floating wind turbine.” Statoil, 2012
23
CompositesWorld. “Vestas, WindPlus to deploy floating wind turbine structure.” Randers,
Denmark : CompositesWorld, 2011.
24Blue H. “Blue H Products – Phase 2.” Blue H, 2012
25Offshore Wind Power Systems of Texas. “Titan 200 self-installing platform.” OWPST, 2011
26NAW Staff. “Extreme Weather Causes Floating Wind Turbine Prototype To Sink.” North
American Wind Power, Thursday December 1 2012.
27Offshore Wind Biz. “Extreme Storm Probably Sinks Sway’s Test Model” Norway, Offshore
Wind November 29th
2011.
28RenewableEnergyWorld. “Deepwater Offshore Wind Power Generation Using Oil and Gas
Platform Technology.” [Electronic] Oregon, US : RenewableEnergyWorld.com, 2008.
29
V.J. Kurian, V.G. Idichandy, and C. Ganapathy. “Hydrodynamic Response of Tension-leg
Platforms - A Model.” Experimental Mechanics, 1993, vol. 33, pp. 212-217
30Murray, John, Yang, Chan K and Wooseuk, Yang. “An Extended Tension Leg Platform
Design for Post-Katrina Gulf of Mexico.” Houston, Texas, ISOPE, 2008, Paper # ISOPE-2008-
287
31Yan, S and Ma, Q. W. “Numerical simulation of fully non-linear interaction between steep
waves and 2D floating bodies.” London, Elsevier/Journal of Computational Physics, 2007, Vol.
221, pp. 666-692

98
32Hua, Jianbo. “A floating platform of concrete for offshore wind turbine.” s.l. Journal of
Renewable and Sustainable Energy, 2011 Paper #063103.
33Roddier, D., Cermelli, C., Aubult, A., “Windfloat: A floating foundation for offshore wind
turbines, Part II: Hydrodynamics analysis,” Proceedings of the International Conference on
Offshore Mechanics and Arctic Engineering – OMAE 2009, Vol. 4, Part A, 2009, pp. 135-143.
34Utsunomiya, T., Sato, T., Matsukuma, J., and Yago, K., “Experimental validation for motion
of a SPAR-type floating offshore wind turbine using 1/22.5 scale model,” Proceedings of the
28th
International Conference on Ocean, Offshore and Arctic Engineering OMAE2009. Vol. 4,
Part B, 2009a, pp. 951-959
35Karimirad, M., “Dynamic response of floating wind turbines,” Scientia Iranica, Vol 17, No.
2, 2010, pp. 146-156.
36Chexoxarov, V., and Chexoxarov, V., “Calculation of wind loading on large-scale floating
wind turbines,” 2004, pp. 216-221.
37Nematbaksh, A., Olinger, D.J., and Tryggvason, G., “A computational simulation of floating
wind tubine platforms,” Proceedings of the Fluid Structure Interaction VI Conference, Wessex
Institute of Technology, 2011, pp. 181-191.
38Murakami, M., Takada, M., Fujiyodhi, M., Katada, T., Nagata, S., and Fujita, T., “The Hitz
concept of an offshore floating-type wind turbine generation system.” Hitachi Zosen Technical
Review, Vol. 65, No. 1, 2004, pp. 34-37.
39Shimada, K., Ohyama, T., Miyakawa, M., Ishihara, T., Phuc, P.V., and Sukegawa, H., “A
study on a semi-submersible floating offshore wind energy conversion system.” Proceedings of
the Seventeenth 2007 International Offshore and Polar Engineering Conference, ISOPE 2007,
pp. 348-355.
40Johanning, L. “Dynamic response characteristics of a floating wind turbine tower at low
response frequency,” Proceedings of the 28th
International Conference on Ocean, Offshore and
Arctic Engineering 2009, OMAE 2009, Vol. 4, Part B, 2009, pp. 983-992.
41Nielsen, F.G., Hanson, R.D., and Skaare, B., “Integrated dynamic analysis of floating offshore
wind turbine,” Proceedings of the 25th
International Conference on Offshore Mechanics and
Arctic Engineering, OMAE 2006.
42Cermelli, C. Roddier, D., and Aubault, A., “Windfloat: A floating foundation for offshore
wind turbines, Part II: Hydrodynamics analysis,” Proceedings of the International Conference on
Offshore Mechanics and Arctic Engineering – OMAE 2009, Vol. 4, Part A, 2009, pp. 135-143.
43Nihei, Y. and Fujioka, H., “Motion characteristics of a TLP type offshore wind turbine in
waves and wind.” OMAE2010-21126, 2010

99
44Chakrabarti, S.K. “Offshore Structure Modeling”, World Scientific, Singapore, 1994.
45
Chakrabarti, S.K. and Grinius, V., “Role of physical simulation of deepwater floating offshore
structures.” Proceedings of the International Conference on Ocean, Offshore, and Arctic
Engineering OMAE 1998, OMAE 98-0345, 1998.
46D.J. Olinger, E. Destefano, E. Murphy, S.K. Naqvi. “Scale-model experiments on floating
wind turbine platforms.” Nashville, Tennessee, American Institute of Aeronautics and
Astronuatics, 2012.
47DeStefano, Eric. “Measurement of the Dynamic Motion of Scale-Model Offshore Floating
Wind Turbines.” Worcester Polytechnic Institute, 2010.
48Murphy, Eric. “Development of a wireless data acquisition system.” Worcester, WPI, 2011.
49E.N. Wayman, P.D. Sclavounos. “Coupled dynamic modeling of floating wind turbine
systems.” Houston, Texas : NREL, 2006.
50
Honeywell. “Model 31 Mid Range Precision Miniature Load Cell.” s.l. [Datasheet]:
Honeywell, 2010.
51Frye, J.,Horvath, N., Ndwega, A. “Design of Scale-Model Floating Wind Turbine: Spar
Buoy.” Worcester Polytechnic Institute, 2011
52Meussen, B., Ritschel, U., Warnke, I., Kirchner, J. “Wind Turbines and Earthquakes.”
Windrad Engineering GmbH, 2001

100
Appendices
Appendix A – Design
The TLP tank was made water resistant by several coatings of ABS cement and sealing
foam. In addition, a ledge was constructed with O-ring channels to fit at the lip of the TLP tank
and prevent water from entering it. A ledge fixture was designed to make the platform water
proof, with O-rings channels at the top and side to prevent leakage and keep the sealing intact.
Eight mating holes were provided in the tank lid with matching ¼” bolts and nuts to attach the
lid to the ledge. These features are detailed in Figure 47.

101
The tethers were attached to the load cells using a thread adaptor (fixture A-Figure 48).
This consisted of a mating threaded rod with inner 10-24 threads attaching it to the load cell and
outer 3/8”-24 threads attaching it to fixture B. This fixture consists of female 3/8”-24 threads on
one end that attached it to fixture A, and a hollow chamber on the other end. A spherical hollow
aluminum ball was glued onto the end of the tethers and threaded through the outer hole of
Figure 47 – TLP tank, ledge, and lid (exploded view). The ledge contains O-ring channels that,
with O-rings installed, ensure a water tight closure of the tank. 1- O-ring channels, 2- Mating
holes in TLP lid and ledge for water tight assembly
1
2
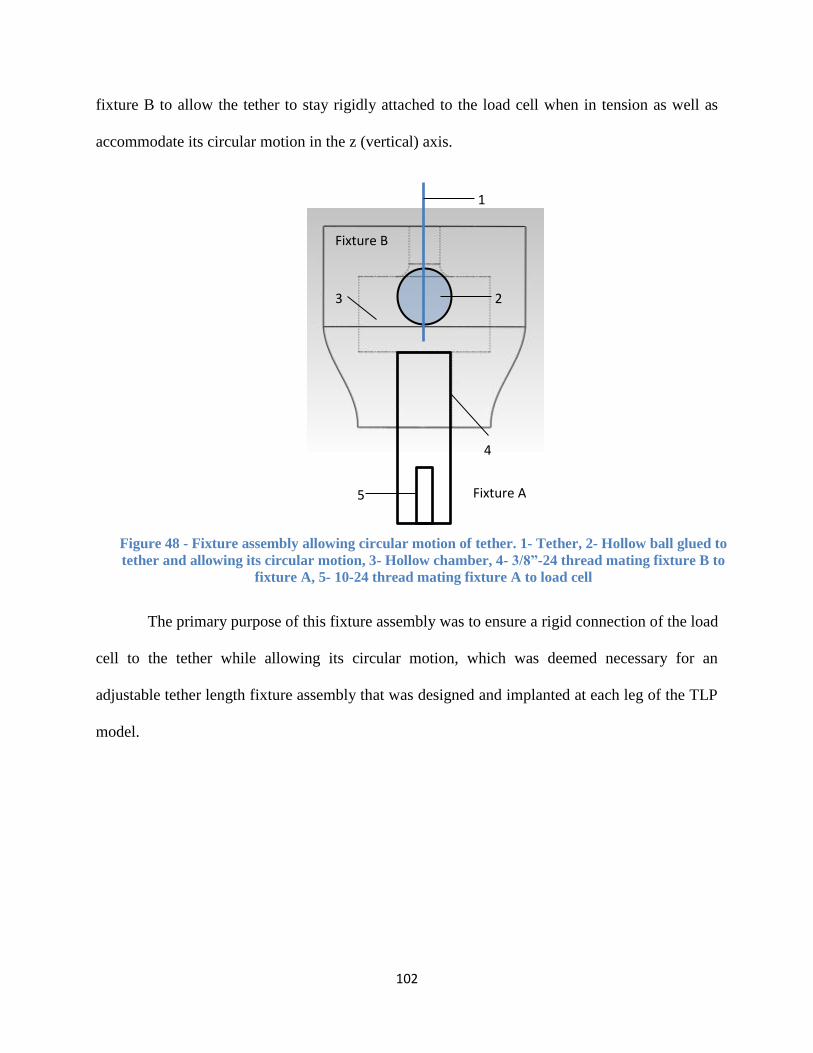
102
fixture B to allow the tether to stay rigidly attached to the load cell when in tension as well as
accommodate its circular motion in the z (vertical) axis.
The primary purpose of this fixture assembly was to ensure a rigid connection of the load
cell to the tether while allowing its circular motion, which was deemed necessary for an
adjustable tether length fixture assembly that was designed and implanted at each leg of the TLP
model.
Figure 48 - Fixture assembly allowing circular motion of tether. 1- Tether, 2- Hollow ball glued to
tether and allowing its circular motion, 3- Hollow chamber, 4- 3/8”-24 thread mating fixture B to
fixture A, 5- 10-24 thread mating fixture A to load cell
1
2 3
4
5 Fixture A
Fixture B

103
Appendix B – Instrumentation
Output voltage signals from the accelerometer and inclinometer were received by the
Arduino multiplexor, which transferred them to the Arduino microprocessor. This
microprocessor acquired and processed the signals at a preset sampling rate of 100 samples per
second and sent them to the XBee wireless transmitter. The hardware associated with this setup
is shown assembled in Figure 49.
The XBee wireless transmitter module is capable of transmitting signals at a radius of
100 meters using 802.11g wireless communication. It was experimentally determined that the
module was capable of transmitting these signals through water and other media that was present
in the test setup with virtually no data loss. The signals were received at the laptop by another
XBee wireless receiver module as shown in Figure 50.
1
2
3
Figure 49 - Wireless instrumentation module (shown assembled). 1- Arduino
multiplexor, 2- Xbee breadboard with 1mW wireless transmitter (latter not
visible), 3- Arduino microontroller48

104
Figure 50 - XBee wireless receiver module
Figure 51 - Maxon Motors gearhead (left) and motor (right) to provide 120 RPM to
the rotor

105
Appendix C- Experimentation
Figure 52 shows the experimental setup created in LabVIEW for observing and recording
the data obtained in real-time.
Figure 52 - Experimental setup created in LabVIEW for acquiring data

106
Table 8 lists the experiment number and corresponding value of each relevant parameter that was
studied in detail for evaluating the impact on sea-state response.
Experiment Number
Wave Frequency (Hz)
Wave Height (in.)
Rotor Moment of Inertia (kg.m2)
Incident Wind Speed (m/s)
Wave Generator Stroke (in.)
TLP 13 0.380 0.125 0 0 3
TLP 14 0.714 0.625 0 0 3
TLP 15 0.758 0.750 0 0 3
TLP 19 1.25 1.50 0 0 3
TLP 20 1.30 2.00 0 0 3
TLP 30 0.662 0.250 0.005821 0 3
TLP 32 0.560 0.375 0.005821 0 3
TLP 34 0.763 0.625 0.005821 0 3
TLP 36 0.952 0.875 0.005821 0 3
TLP 38 1.14 1.75 0.005821 0 3
TLP 40 1.33 1.75 0.005821 0 3
TLP 44 0.369 0.188 0.005821 15 3
TLP 46 0.559 0.375 0.005821 15 3
TLP 48 0.752 0.750 0.005821 15 3
TLP 50 1.14 1.50 0.005821 15 3
TLP 56 1.23 2.50 0.005821 15 3
TLP 58 1.27 1.25 0.005821 15 3
TLP 61 0.368 0.125 0.004851 15 3
TLP 62 0.565 0.25 0.004851 15 3
TLP 63 0.752 0.750 0.004851 15 3
TLP 64 0.935 1.00 0.004851 15 3
TLP 65 1.14 1.75 0.004851 15 3
TLP 66 1.23 2.25 0.004851 15 3
TLP 69 1.06 0.875 0 15 3
TLP 71 0.830 1.00 0 15 3
TLP 74 0.568 0.125 0.004851 15 1.5
TLP 75 0.758 0.250 0.004851 15 1.5
TLP 76 0.943 0.250 0.004851 15 1.5
TLP 78 1.25 0.500 0.004851 15 1.5
TLP 81 1.14 0.750 0.004851 15 1.5
TLP 82 1.22 0.875 0.004851 15 1.5
TLP 84 1.11 0.750 0.004851 0 1.5
TLP 85 1.15 0.750 0 15 1.5 Table 8 - Test matrix

107
Figure 53 - Typical spectral analysis configuration in LabVIEW Signal Express