Embed Size (px)
Citation preview
Scale Invariant Feature Transform withIrregular Orientation Histogram Binning
Yan Cui, Nils Hasler, Thorsten Thormahlen, Hans-Peter Seidel
MPI Informatik, Saarbrucken, Germany
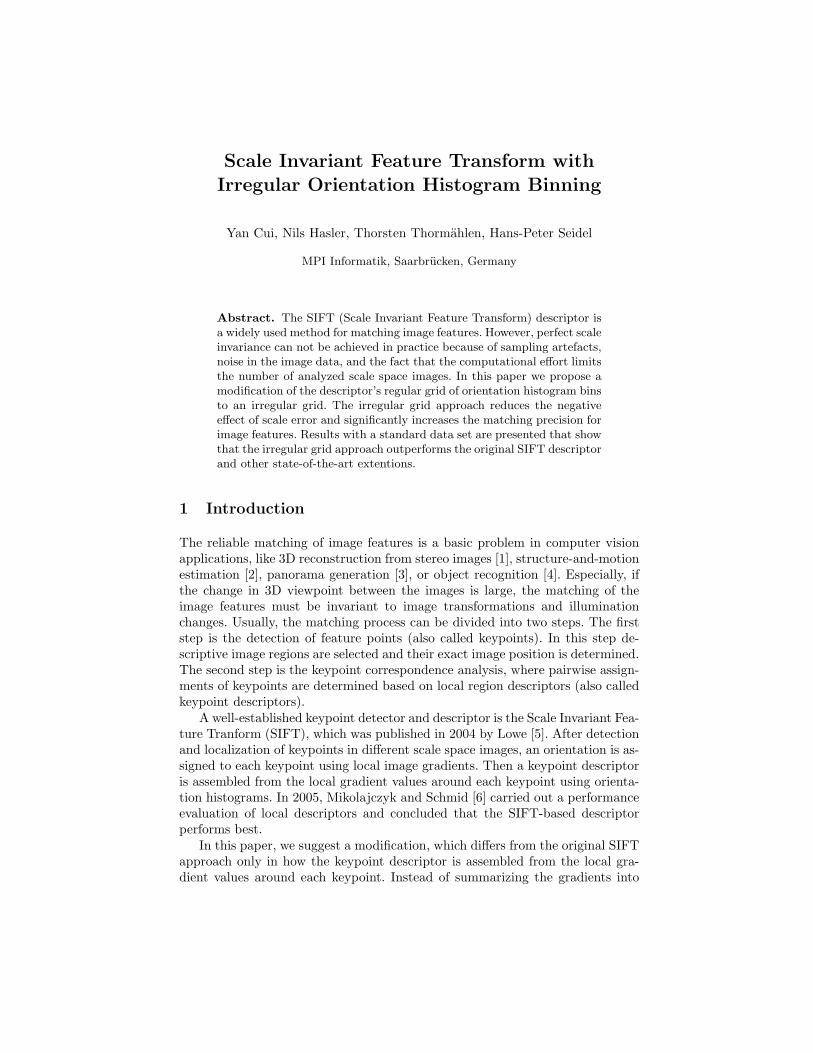
Abstract. The SIFT (Scale Invariant Feature Transform) descriptor isa widely used method for matching image features. However, perfect scaleinvariance can not be achieved in practice because of sampling artefacts,noise in the image data, and the fact that the computational effort limitsthe number of analyzed scale space images. In this paper we propose amodification of the descriptor’s regular grid of orientation histogram binsto an irregular grid. The irregular grid approach reduces the negativeeffect of scale error and significantly increases the matching precision forimage features. Results with a standard data set are presented that showthat the irregular grid approach outperforms the original SIFT descriptorand other state-of-the-art extentions.
1 Introduction
The reliable matching of image features is a basic problem in computer visionapplications, like 3D reconstruction from stereo images [1], structure-and-motionestimation [2], panorama generation [3], or object recognition [4]. Especially, ifthe change in 3D viewpoint between the images is large, the matching of theimage features must be invariant to image transformations and illuminationchanges. Usually, the matching process can be divided into two steps. The firststep is the detection of feature points (also called keypoints). In this step de-scriptive image regions are selected and their exact image position is determined.The second step is the keypoint correspondence analysis, where pairwise assign-ments of keypoints are determined based on local region descriptors (also calledkeypoint descriptors).
A well-established keypoint detector and descriptor is the Scale Invariant Fea-ture Tranform (SIFT), which was published in 2004 by Lowe [5]. After detectionand localization of keypoints in different scale space images, an orientation is as-signed to each keypoint using local image gradients. Then a keypoint descriptoris assembled from the local gradient values around each keypoint using orienta-tion histograms. In 2005, Mikolajczyk and Schmid [6] carried out a performanceevaluation of local descriptors and concluded that the SIFT-based descriptorperforms best.
In this paper, we suggest a modification, which differs from the original SIFTapproach only in how the keypoint descriptor is assembled from the local gra-dient values around each keypoint. Instead of summarizing the gradients into
orientation histograms in subregions on a regular grid, we apply an irregulargrid with subregions of different sizes. This modification results in a keypointdescriptor that is less sensitive to scale errors. It will be shown that this novelapproach has a remarkable impact on the matching performance.
The paper is structured as follows. In the next section we show how scalequantization error can cause a wrong matching result. Section 3 introduces ournew irregular grid approach. In section 4 results are presented and the paperends with a conclusion.
2 The SIFT Descriptor and Scale Quantization Error
The scale invariance of SIFT is achieved by rescaling the input image repeatedlywith a Gaussian scale-space kernel. Feature detection is performed on everyscale space image. Obviously, computing more images, increases the accuracyof the scale of a given feature and the more characteristic a descriptor of thefeature becomes. Unfortunately, the more images are processed the higher thecomputational cost. Keeping the number of necessary scales small is consequentlya desirable design goal.
1.41.4 1.61.6 1.81.8 22 2.22.2 2.42.4 2.62.6 2.82.8 332.554
355
3.556
457
4.558
559
5.560
661
6.562
scale scale
(c) (d)(a)
(b)
SS
D o
f Des
crip
tor
SS
D o
f DoG
SIFT 4 intervalsSIFT 25 intervals
SIFT 8 intervalsIG 8 intervalsSIFT 25 intervalsIG 25 intervals
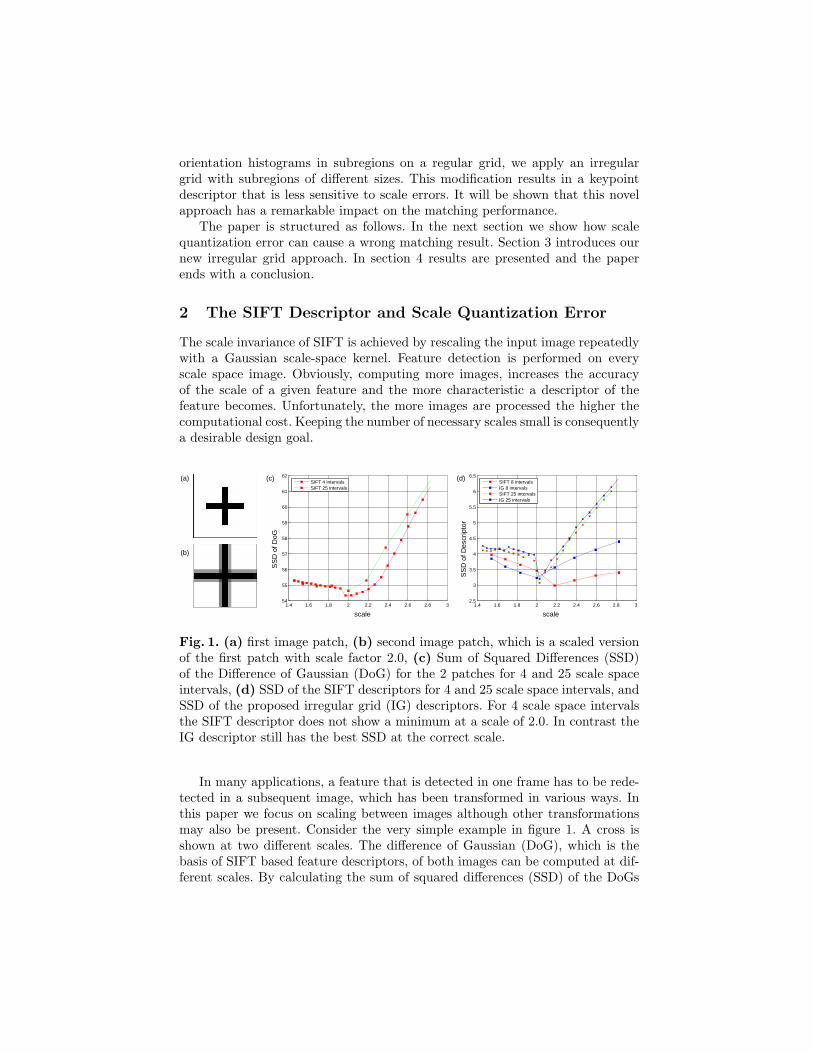
Fig. 1. (a) first image patch, (b) second image patch, which is a scaled versionof the first patch with scale factor 2.0, (c) Sum of Squared Differences (SSD)of the Difference of Gaussian (DoG) for the 2 patches for 4 and 25 scale spaceintervals, (d) SSD of the SIFT descriptors for 4 and 25 scale space intervals, andSSD of the proposed irregular grid (IG) descriptors. For 4 scale space intervalsthe SIFT descriptor does not show a minimum at a scale of 2.0. In contrast theIG descriptor still has the best SSD at the correct scale.
In many applications, a feature that is detected in one frame has to be rede-tected in a subsequent image, which has been transformed in various ways. Inthis paper we focus on scaling between images although other transformationsmay also be present. Consider the very simple example in figure 1. A cross isshown at two different scales. The difference of Gaussian (DoG), which is thebasis of SIFT based feature descriptors, of both images can be computed at dif-ferent scales. By calculating the sum of squared differences (SSD) of the DoGs
of the two crosses, it is possible to show that by comparing DoGs of differentimages, the scale factor transforming one cross into the other can be estimated.Figure 1 (c) shows the SSD of DoGs of the two crosses, where scale space issampled a different number of times. Both plots have their minimum at thescale closest to the real scale. Yet, figure 1 (d) shows that the SIFT descriptor isunable to detect the feature at the correct scale unless a large number of scalesis computed.
3 Irregular Orientation Histogram Binning
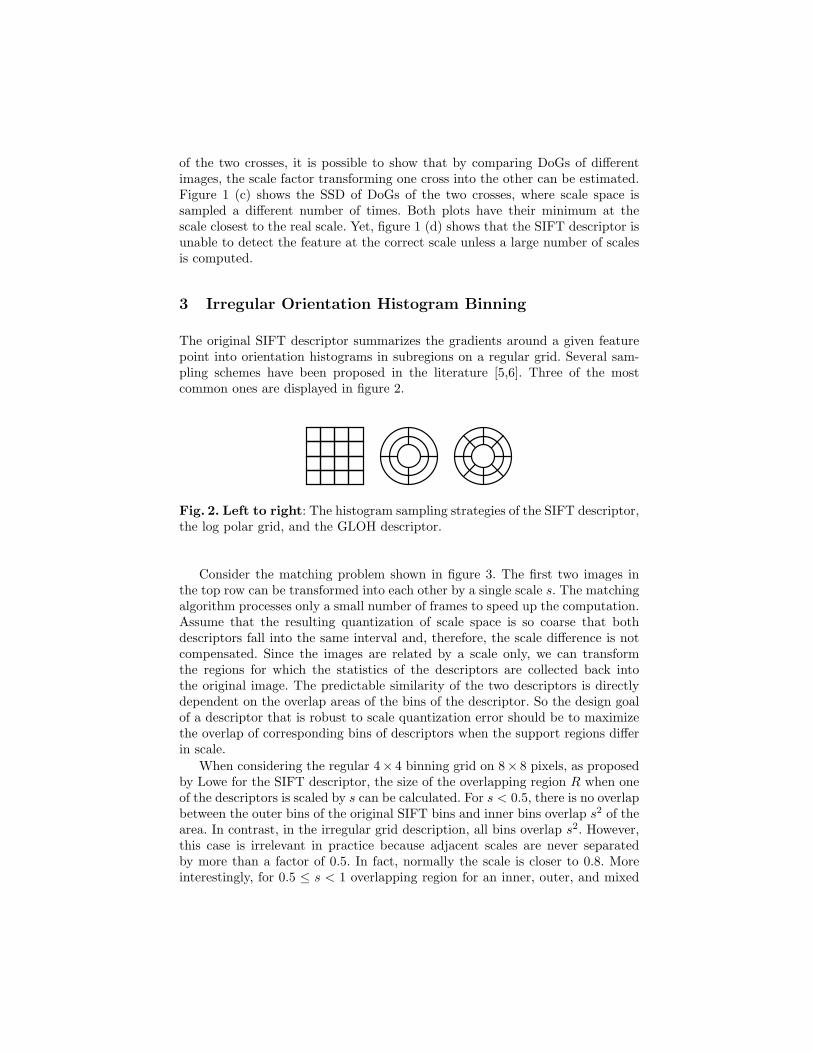
The original SIFT descriptor summarizes the gradients around a given featurepoint into orientation histograms in subregions on a regular grid. Several sam-pling schemes have been proposed in the literature [5,6]. Three of the mostcommon ones are displayed in figure 2.
Fig. 2. Left to right: The histogram sampling strategies of the SIFT descriptor,the log polar grid, and the GLOH descriptor.
Consider the matching problem shown in figure 3. The first two images inthe top row can be transformed into each other by a single scale s. The matchingalgorithm processes only a small number of frames to speed up the computation.Assume that the resulting quantization of scale space is so coarse that bothdescriptors fall into the same interval and, therefore, the scale difference is notcompensated. Since the images are related by a scale only, we can transformthe regions for which the statistics of the descriptors are collected back intothe original image. The predictable similarity of the two descriptors is directlydependent on the overlap areas of the bins of the descriptor. So the design goalof a descriptor that is robust to scale quantization error should be to maximizethe overlap of corresponding bins of descriptors when the support regions differin scale.
When considering the regular 4× 4 binning grid on 8× 8 pixels, as proposedby Lowe for the SIFT descriptor, the size of the overlapping region R when oneof the descriptors is scaled by s can be calculated. For s < 0.5, there is no overlapbetween the outer bins of the original SIFT bins and inner bins overlap s2 of thearea. In contrast, in the irregular grid description, all bins overlap s2. However,this case is irrelevant in practice because adjacent scales are never separatedby more than a factor of 0.5. In fact, normally the scale is closer to 0.8. Moreinterestingly, for 0.5 ≤ s < 1 overlapping region for an inner, outer, and mixed
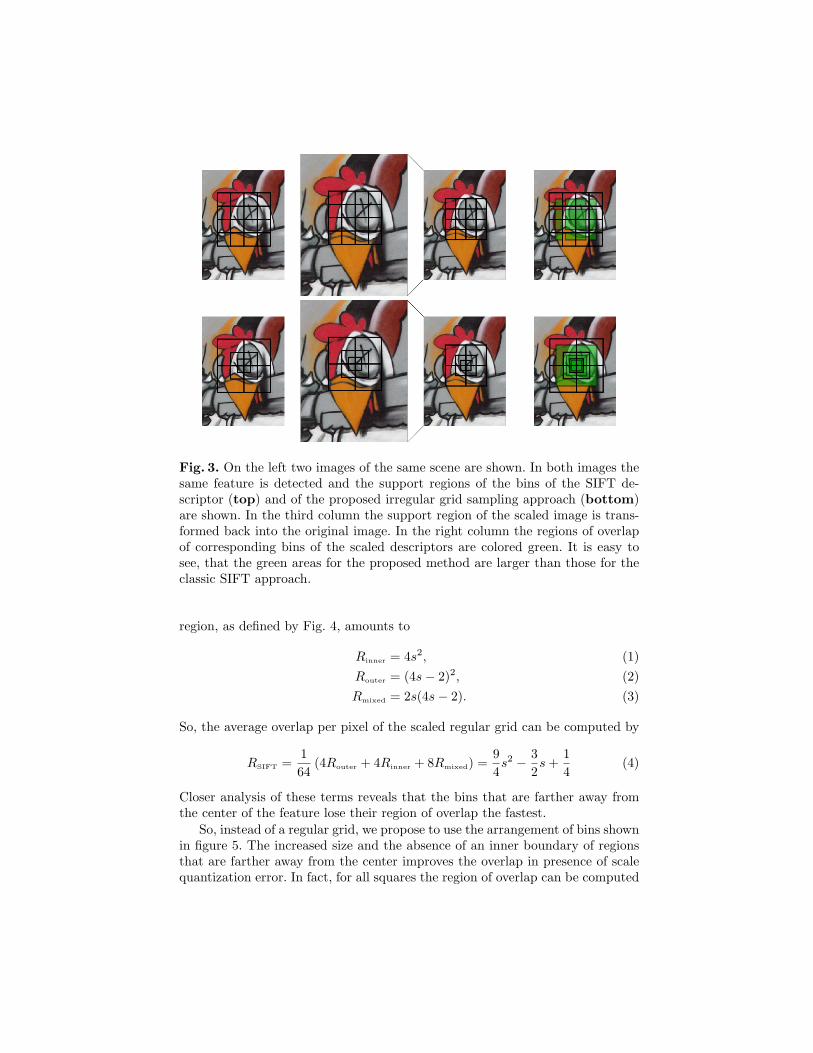
Fig. 3. On the left two images of the same scene are shown. In both images thesame feature is detected and the support regions of the bins of the SIFT de-scriptor (top) and of the proposed irregular grid sampling approach (bottom)are shown. In the third column the support region of the scaled image is trans-formed back into the original image. In the right column the regions of overlapof corresponding bins of the scaled descriptors are colored green. It is easy tosee, that the green areas for the proposed method are larger than those for theclassic SIFT approach.
region, as defined by Fig. 4, amounts to
Rinner = 4s2, (1)Router = (4s− 2)2, (2)Rmixed = 2s(4s− 2). (3)
So, the average overlap per pixel of the scaled regular grid can be computed by
RSIFT =164
(4Router + 4Rinner + 8Rmixed) =94s2 − 3
2s +
14
(4)
Closer analysis of these terms reveals that the bins that are farther away fromthe center of the feature lose their region of overlap the fastest.
So, instead of a regular grid, we propose to use the arrangement of bins shownin figure 5. The increased size and the absence of an inner boundary of regionsthat are farther away from the center improves the overlap in presence of scalequantization error. In fact, for all squares the region of overlap can be computed
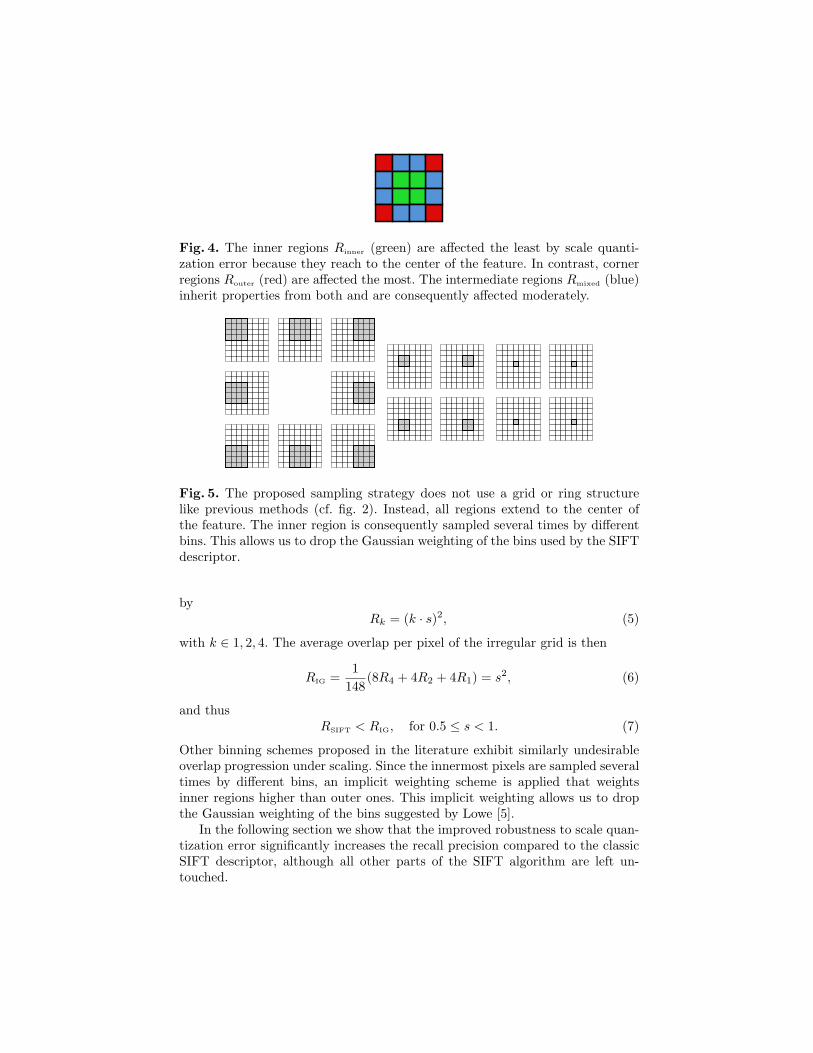
Fig. 4. The inner regions Rinner (green) are affected the least by scale quanti-zation error because they reach to the center of the feature. In contrast, cornerregions Router (red) are affected the most. The intermediate regions Rmixed (blue)inherit properties from both and are consequently affected moderately.
Fig. 5. The proposed sampling strategy does not use a grid or ring structurelike previous methods (cf. fig. 2). Instead, all regions extend to the center ofthe feature. The inner region is consequently sampled several times by differentbins. This allows us to drop the Gaussian weighting of the bins used by the SIFTdescriptor.
byRk = (k · s)2, (5)
with k ∈ 1, 2, 4. The average overlap per pixel of the irregular grid is then
RIG =1
148(8R4 + 4R2 + 4R1) = s2, (6)
and thusRSIFT < RIG, for 0.5 ≤ s < 1. (7)
Other binning schemes proposed in the literature exhibit similarly undesirableoverlap progression under scaling. Since the innermost pixels are sampled severaltimes by different bins, an implicit weighting scheme is applied that weightsinner regions higher than outer ones. This implicit weighting allows us to dropthe Gaussian weighting of the bins suggested by Lowe [5].
In the following section we show that the improved robustness to scale quan-tization error significantly increases the recall precision compared to the classicSIFT descriptor, although all other parts of the SIFT algorithm are left un-touched.
4 Results
In this section a comparison of the proposed irregular grid (IG) sampling methodwith a number of well known feature descriptors is performed on the imagedataset introduced for performance evaluation by Mikolajczyk and Schmid [6]1.
Results are shown for Complex Filters(CF) [7], Gradient Location and Orien-tation Histograms (GLOH) [6], Steerable Filters (SF) [8], Differential Invariants(DI) [9], Moment invariants (MOM) [10], PCA-SIFT (PCA-SIFT) [11], SIFT(SIFT) [5], Spin images (SPIN) [12], and Cross Correlation (CC). For the re-sults of CF, GLOH, SF, DI, MOM, PCA-SIFT, SIFT, SPIN, and CC we usedthe code provided by the Visual Geometry Group, University of Oxford2.
The images we use are compiled in figure 6. The task for all feature descriptorsis to find the correct corresponding feature pairs between features detected in theimages of the leftmost column and one of the images of the other two columns.
All descriptors work on the same set of features detected by our implemen-tation of the SIFT detector. Since not all details of the original implementationwere published by Lowe our algorithm detects slightly different feature pointsets. However, the comparison we perform is still fair because all descriptors usethe exact same keypoint locations.
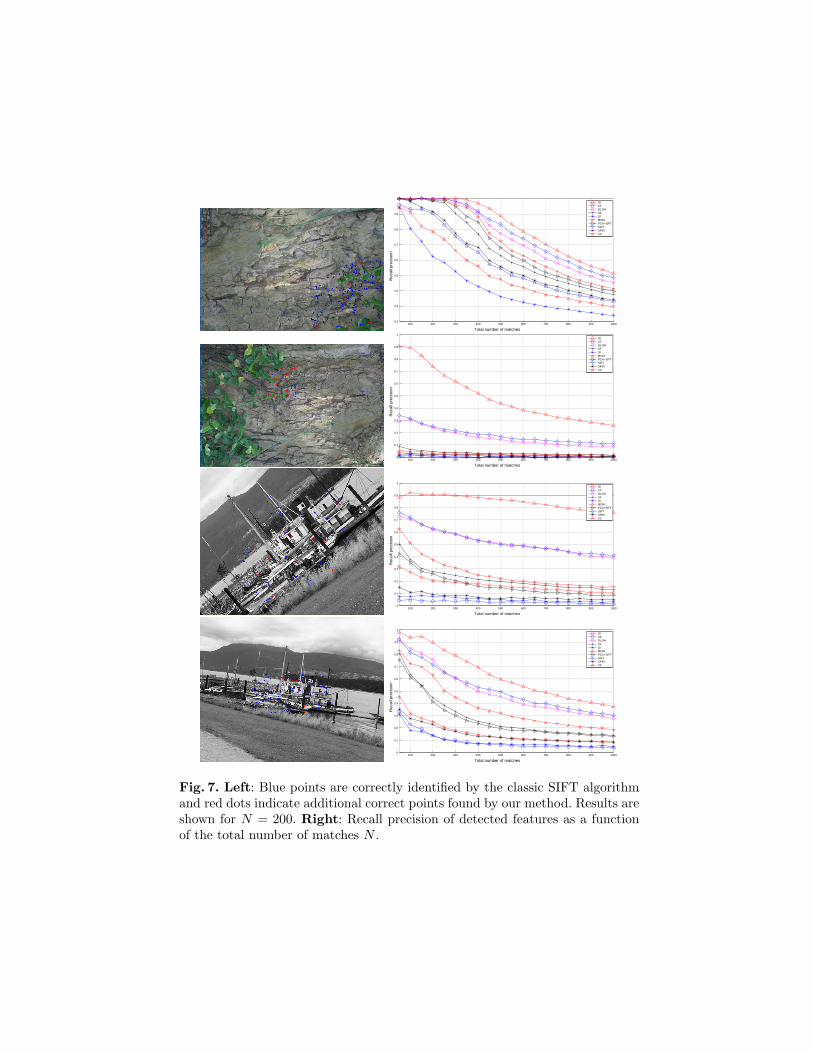
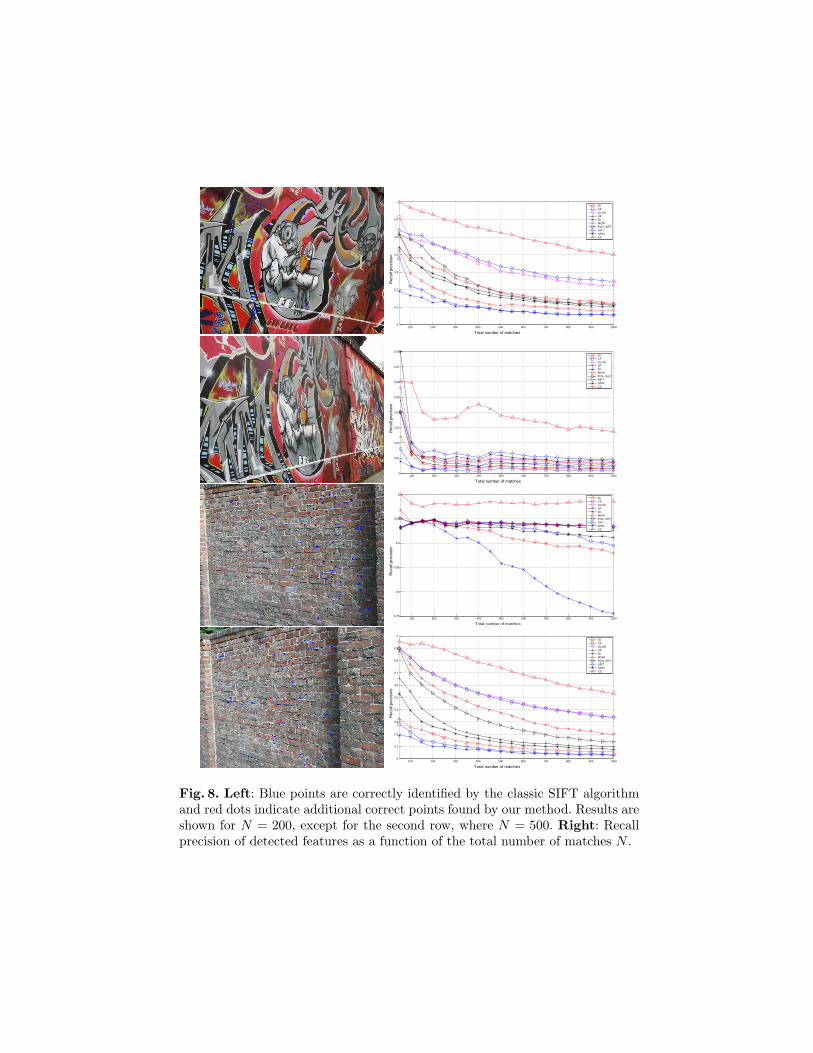
Figures 7 and 8 show the points correctly detected by the classic SIFT al-gorithms on the different input images in blue and the additional correct pointsdetected by the irregular grid (IG) algorithm in red. Also, the recall precisionof a number of state-of-the-art algorithms as a function of the total numberof matches is given, where recall precision is the ratio between the number ofcorrect matches and number of possible matches
recall precision =#correct matches#possible matches
,
and the number of possible matches is defined as the smaller number of featurepoints detected in either of the input images. The total number of matches N isequal to the number of correct plus the number of false matches.
N = #correct matches + #false matches
The total number of matches can be varied by changing the threshold for themaximum allowed distance between two descriptors. The classification into cor-rect matches and false matches is done based on the ground truth transforma-tions that are available for the test images. Our algorithm consistently performsbetter than the other approaches on all test images.
Please note that in all test scenarios but the second graffiti example (Fig. 6 c(3))the precision axis is plotted from zero to one. In the second graffiti example,however, the performance of all evaluated descriptors is rather weak because thetransformation between the images cannot be approximated very well by rota-tion and scaling alone. Instead, a strong affine transformation effectively confuses1 http://www.robots.ox.ac.uk/∼vgg/research/affine/index.html2 http://www.robots.ox.ac.uk/∼vgg/research/affine/descriptors.html

the merely rotation and scale invariant descriptors. The proposed irregular griddescriptor still outperforms the other investigated methods.
5 Conclusion
In this paper a modification of the binning method employed by the classic SIFTdescriptor is proposed, which significantly improves the recall precision of thealgorithm. The main observation leading to the improved approach is that theoverlap of ring or grid based binning schemes diminishes quickly in the presenceof scale quantization error. By working with many scales of the input images,this effect can be countered effectively but this is computationally expensive.The presented approach, however, improves the robustness to scale quantizationerrors at no additional computational cost. We show that recall precision of themodified descriptor consistently outperforms SIFT and several other state-of-the-art descriptors on a standard dataset.
References
1. Tuytelaars, T., Van Gool, L.: Wide baseline stereo matching based on local, affinelyinvariant regions. In: Proc. British Machine Vision Conference. (2000) 412–425
2. Thormahlen, T., Hasler, N., Wand, M., Seidel, H.P.: Merging of feature tracksfor camera motion estimation from video. In: 5th European Conference on VisualMedia Production (CVMP 2008), London, UK (2008)
3. Brown, M., Lowe, D.G.: Automatic panoramic image stitching using invariantfeatures. International Journal of Computer Vision 74(1) (2007) 59–73
4. Sivic, J., Zisserman, A.: Video data mining using configurations of viewpointinvariant regions. Computer Vision and Pattern Recognition, IEEE ComputerSociety 1 (2004) 488–495
5. Lowe, D.G.: Distinctive image features from scale-invariant keypoints. Interna-tional Journal of Computer Vision 60 (2004) 91–110
6. Mikolajczyk, K., Schmid, C.: A performance evaluation of local descriptors. Trans.on Pattern Analysis and Machine Intelligence 27(10) (2005) 1615–1630
7. Baumberg, A.: Reliable feature matching across widely separated views. ComputerVision and Pattern Recognition, IEEE Computer Society 1 (2000) 1774ff.
8. Freeman, W., Adelson, E.: The design and use of steerable filters. Trans. onPattern Analysis and Machine Intelligence 13(9) (1991) 891–906
9. Florack, L.M.J., ter Haar Romeny, B., Koenderink, J.J., Viergever, M.A.: Gen-eral intensity transformations and differential invariants. Journal of MathematicalImaging and Vision 4 (1994) 171–187
10. Gool, L.J.V., Moons, T., Ungureanu, D.: Affine/ photometric invariants for planarintensity patterns. In: ECCV ’96: Proceedings of the 4th European Conference onComputer Vision-Volume I, London, UK, Springer-Verlag (1996) 642–651
11. Ke, Y., Sukthankar, R.: PCA-SIFT: A more distinctive representation for localimage descriptors. Computer Vision and Pattern Recognition, IEEE ComputerSociety 2 (2004) 506–513
12. Lazebnik, S., Schmid, C., Ponce, J.: A sparse texture representation using affine-invariant regions. Computer Vision and Pattern Recognition, IEEE ComputerSociety 2 (2003) 319ff.
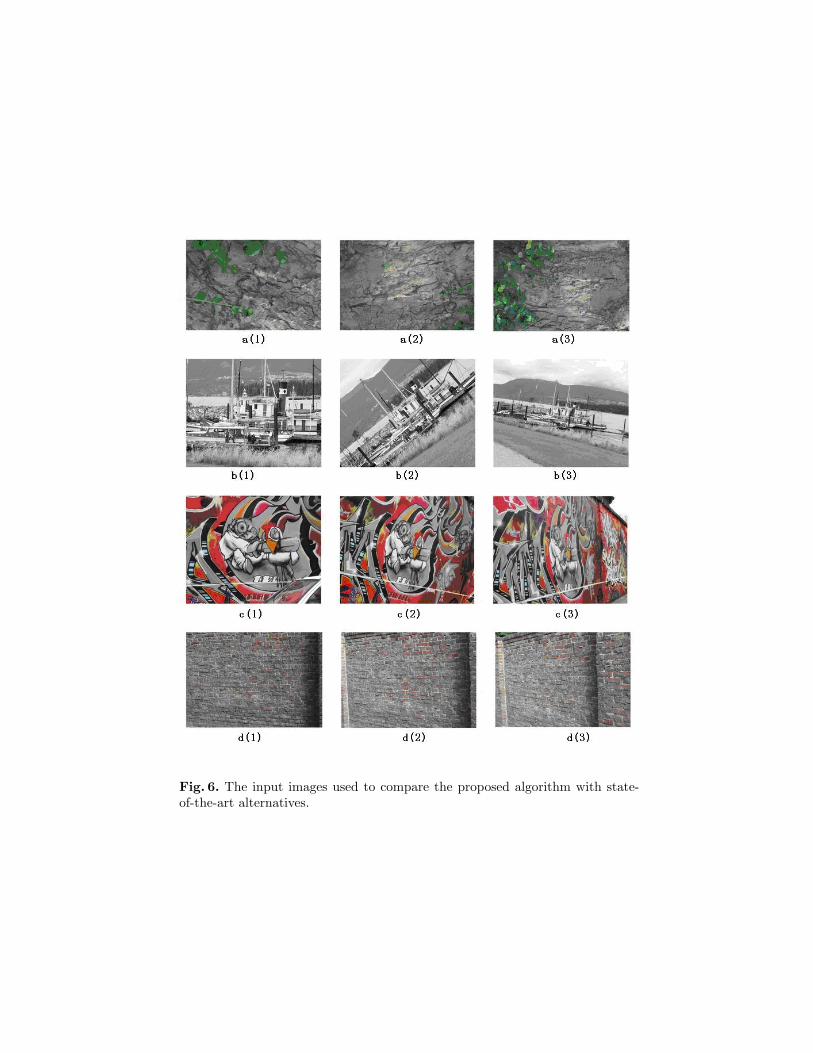
Fig. 6. The input images used to compare the proposed algorithm with state-of-the-art alternatives.
100 200 300 400 500 600 700 800 900 10000.2
0.3
0.4
0.5
0.6
0.7
0.8
0.9
1
Total number of matches
Rec
all p
reci
sion
IGCFGLOHSFDIMOMPCA−SIFTSIFTSPINCC
100 200 300 400 500 600 700 800 900 10000
0.1
0.2
0.3
0.4
0.5
0.6
0.7
0.8
0.9
1
Total number of matches
Rec
all p
reci
sion
IGCFGLOHSFDIMOMPCA−SIFTSIFTSPINCC
100 200 300 400 500 600 700 800 900 10000
0.1
0.2
0.3
0.4
0.5
0.6
0.7
0.8
0.9
1
Total number of matches
Rec
all p
reci
sion
IGCFGLOHSFDIMOMPCA−SIFTSIFTSPINCC
100 200 300 400 500 600 700 800 900 10000
0.1
0.2
0.3
0.4
0.5
0.6
0.7
0.8
0.9
1
Total number of matches
Rec
all p
reci
sion
IGCFGLOHSFDIMOMPCA−SIFTSIFTSPINCC
Fig. 7. Left: Blue points are correctly identified by the classic SIFT algorithmand red dots indicate additional correct points found by our method. Results areshown for N = 200. Right: Recall precision of detected features as a functionof the total number of matches N .
100 200 300 400 500 600 700 800 900 10000
0.1
0.2
0.3
0.4
0.5
0.6
Total number of matches
Rec
all p
reci
sion
IGCFGLOHSFDIMOMPCA−SIFTSIFTSPINCC
100 200 300 400 500 600 700 800 900 10000
0.01
0.02
0.03
0.04
0.05
0.06
0.07
0.08
Total number of matches
Rec
all p
reci
sion
IGCFGLOHSFDIMOMPCA−SIFTSIFTSPINCC
100 200 300 400 500 600 700 800 900 10000.75
0.8
0.85
0.9
0.95
1
Total number of matches
Rec
all p
reci
sion
IGCFGLOHSFDIMOMPCA−SIFTSIFTSPINCC
100 200 300 400 500 600 700 800 900 10000
0.1
0.2
0.3
0.4
0.5
0.6
0.7
0.8
0.9
1
Total number of matches
Rec
all p
reci
sion
IGCFGLOHSFDIMOMPCA−SIFTSIFTSPINCC
Fig. 8. Left: Blue points are correctly identified by the classic SIFT algorithmand red dots indicate additional correct points found by our method. Results areshown for N = 200, except for the second row, where N = 500. Right: Recallprecision of detected features as a function of the total number of matches N .


![Rotation-Invariant Categorization of Colour Images using ...users.monash.edu/~app/papers/12RotInv_IJCNN.pdf · Invariant Feature Transform [6] (SIFT), PCA-SIFT [7] and the “Speeded](https://img.pdfslide.us/doc/110x75/5f8efdcabf398034506eea1a/rotation-invariant-categorization-of-colour-images-using-users-apppapers12rotinvijcnnpdf.jpg)

![Extending the Scale Invariant Feature Transform Descriptor ...decsai.ugr.es/vip/files/journals/LukeEtAl2008.pdf · The Scale Invariant Feature Transform (SIFT) [1] has become a popular](https://img.pdfslide.us/doc/110x75/5fa859909b060a15b9109720/extending-the-scale-invariant-feature-transform-descriptor-the-scale-invariant.jpg)