Embed Size (px)
Citation preview

SCALA: A PERFORMANCE SYSTEMFOR SCALABLE COMPUTING
Xian-He Sun1
Thomas Fahringer2
Mario Pantano2
Abstract
Lack of effective performance-evaluation environmentsis a major barrier to the broader use of high perfor-mance computing. Conventional performance environ-ments are based on profiling and event instrumentation. Itbecomes problematic as parallel systems scale to hun-dreds of nodes and beyond. A framework of developingan integrated performance modeling and prediction sys-tem, SCALability Analyzer (SCALA), is presented in thisstudy. In contrast to existing performance tools, the pro-gram performance model generated by SCALA is basedon scalability analysis. SCALA assumes the availabilityof modern compiler technology, adopts statistical andsymbolic methodologies, and has the support of browserinterface. These technologies, together with a new ap-proach of scalability analysis, enable SCALA to providethe user with a more intuitive level of performance anal-ysis for scalable computing. A prototype SCALA systemhas been implemented. Initial experimental results showthat SCALA is unique in its ability of revealing the scal-ing properties of a computing system.
Key Words: Software System, Performance Evaluation,Parallel and Distributed Processing, Scalability Analysis,Symbolic Analysis, Statistical Analysis
1 Introduction
Although rapid advances in highly scalable multiprocess-ing systems are bringing petaflop performance withingrasp, software infrastructure for massive parallelismsimply has not kept pace. Modern compiler technologyhas been developed to reduce the burden of parallel pro-gramming through automatic program restructuring. Thereare many ways to parallelize an application, but the rela-tive performance of different parallelizations vary withproblem size and system ensemble sizerformance sys-tems have been developed for parallel computing (Mohret al. 1996, Miller et al. 1995, Whaley and Dongarra1998, Berman et al. 1996, Taylor et al. 2000). Thesesystems have different strengths and focus on differentapplications. They are an important component of highperformance computing. In this study we introduce theframework and initial implementation of the SCALabilityAnalyzer (SCALA) system, a performance system design-ed for scalable computers. Distinguished from other exist-ing performance tools, the program performance modelgenerated by SCALA is based on scalability analysis(Sun 2002, Sun and Rover 194). SCALA is a systemwhich correlates static, dynamic and symbolic informa-tion to reveal the scaling properties of parallel programsand machines and for predicting their performance in ascalable computing environment. SCALA serves threepurposes: to predict performance, to support performancedebugging and program restructuring, and to estimate theinfluence of hardware variations. Symbolic and scalabilityanalysis are integrated into advanced compiler systemsto explore knowledge from the compiler and to guidethe program restructuring process for optimal perfor-mance. A graphical user interface is developed to visu-alize the performance variations of different programimplementations with different hardware resources.Users can choose the performance metrics and parame-ters they are interested in.
SCALA supports range comparison (Sun 2002), a newconcept which allows the performance of different code-machine combinations to be compared over a range ofsystem and problem sizes. SCALA is an experimentalsystem that supports performance oriented programdevelopment for OpenMP/MPI/HPF and mixed parallel(e.g., OpenMP/MPI) programs. SCALA is designed toexplore the plausibility and credibility of new techniques,and to use them collectively to bring performance analy-
SCALA: A PERFORMANCE SYSTEM 1
The International Journal of High Performance Computing Applications,
Volume 16, No. 4, Autumn 2002, pp. 000-000
© 2002 Sage Publications
1DEPARTMENT OF COMPUTER SCIENCE, ILLINOIS INSTITUTE
OF TECHNOLOGY, CHICAGO, IL 60616
2INSTITUTE FOR SOFTWARE TECHNOLOGY AND PARALLEL
SYSTEMS, UNIVERSITY OF VIENNA LIECHTENSTEINSTR. 22
1090 VIENNA, AUSTRIA

sis environments to their most advanced level. In thispaper, we present the design and initial implementationof SCALA. Section 2 presents the structure and primarycomponents of SCALA. Section 3 and 4 gives a shortdescription of scalability analysis and symbolic analysisrespectively. Implementation results are reported in Sec-tion 5. Finally, Section 6 gives the summary and conclu-sion.
2 The Design of SCALA
The design of SCALA is based on the integration ofsymbolic cost models and dynamic metrics collected atrun-time. The resulting code-machine model is then ana-lyzed to predict performance for different software (i.e.program parameters) and architecture characteristics vari-ations. To accomplish this process, SCALA combinesperformance prediction techniques, data analysis andscalability analysis with modern compiler techniques.An important feature of SCALA is its capability to relateperformance information back to the source code in orderto guide the user and the compiler in the selection oftransformation and optimization strategies. AlthoughSCALA is an integrated system designed to predict thescaling behavior of parallel applications, it supportsstandard performance information via data analysis andvisualization techniques and can be used without com-piler support.
The general structure of SCALA comprises severalmodules which combined together provide a robust envi-ronment for advanced performance analysis. SCALA hasthree sources of information (compiler, measurement sys-tem, and user) and two outputs (compiler and user). Thecompiler provides symbolic models of the program andinformation on the code regions measured. Dynamic per-formance information is provided by the measurementsystem in terms of tracefiles. The user can also be involvedin the process of supplying specific information on soft-ware parameters and on the characteristics of the inputdata. The three input sources can be used collectivelyfor the best result or can be used separately, based onphysical constraints and target applications. On the out-put side, performance indices can be given directly tothe Compiler, annotating the syntax tree and call graphof the application so that the compiler can automaticallyselect the most appropriate transformations to be appliedto each code region. Detailed information on the pre-dicted behavioral characteristics of the application willbe given to the programmer by using visualization tech-niques. Figure 1 depicts the design structure of SCALAwhich is composed of the following modules:
• Data Management: This module implements datafiltering and reduction techniques for extrapolatingdetailed information on each code region measured.The input of this module is a tracefile in a specificformat while its output is given to the analysis mod-ules and to the interface for visualization.
• Statistical Analysis: The statistical component ofSCALA determines code and/or machine effects, findsthe correlation between different program phases, iden-tifies the scaling behavior of “difficult segments”, andprovides statistical data for the user interface.
• Symbolic Analysis: The symbolic module gathers costmodels for alternative code variants computed at com-pile-time, and using dynamic data evaluates the resultingexpressions for specific code-machine combinations.
• Scalability Analysis: The development of this moduleis based on the most advanced analytical results onscalability analysis as described in Section 3. Thescalability module implements newly developed algo-rithms for predicting performance in terms of executiontime and scalability of a code-machine combination.
• Model Generator and Database: The performancemodel generator determines the model of system exe-cution. The database keeps previously measured infor-mation which will be used to find appropriate valuesof symbolic constants and statistic data for perfor-mance prediction.
• Interface: The measured and predicted results can bevisualized via a user-friendly graphical interface. Theappearance of the interface can be justified by theuser and the visualization can be “zoomed” in and outfor a specific computing phase and component. Theresults also can be passed through the interface to thecompiler for automatic optimization purposes.
While each module of SCALA has its specific designgoal, they are closely interconnected for a cooperativeanalysis process that provides the user with advancedperformance information for a deep investigation of theapplication itself as well as of the interaction with theunderlying parallel machine. The other important point inthis design is the complete integration of SCALA in theVienna Fortran Compiler (VFC) (Benkner 1999, Benkneret al. 1995) which translates Fortran programs (Fortran90,MPI, OpenMP, HPF, and mixed program) into Fortran90/MPI or mixed OpenMP/MPI programs. Moreover, theScala Instrumentation System (SIS) has been integratedinto VFC to alleviate generic instrumentation of sourcecodes for a variety of performance overheads and met-rics for arbitrary code regions ranging from the entireprogram to single statements.
This integration allows the tool to directly gatherdetailed information on the source code being trans-
2 COMPUTING APPLICATIONS

formed. As a consequence, performance predictions canbe linked back to the user source code providing sug-gestions for code optimizations. A brief discussion of thescalability analysis, symbolic analysis, and data analysismodules is given in the following sections. The imple-mentation of these modules, as well as others, can befound in Section 5 where the implementation issues areaddressed.
3 Scalability Analysis
Several scalability metrics and prediction methodolo-gies have been proposed (Gustafson et al. 1988, Kumaret al. 1994, Sahni and Thanvantri 1996, Hwang and Xu1998). SCALA’s approach is based on isospeed scalability(Sun and Rover 1994): a code-machine combination(CMC) is scalable if the achieved average unit speedcan remain constant when the number of processorsscales up, provided the problem size can be increasedwith the system size.
The performance index considered in isospeed scala-bility, therefore, is speed which is defined as workdivided by time. Average unit speed (or, average speed,in short) is the achieved speed of the given computingsystem divided by p, the number of processors. The
speed represents a quantity that ideally would increaselinearly with the system size. Average speed is a mea-sure of efficiency of the underlying computing system.Unlike the widely used, speedup based parallel efficiency,average speed does not need the comparing of sequen-tial single node performance. While the speedup basedefficiency is a good measure for parallel performancegain, average speed is a more appropriate metric for thestudy of scalability.
For a large class of CMCs, the average speed can bemaintained by increasing the problem size. The necessaryproblem size increase varies with code-machine combina-tions. This variation provides a quantitative measurementof scalability. Let W be the amount of work of a codewhen p processors are employed in a machine, and let
′W be the amount of work of the code when ′ >p p pro-cessors are employed to maintain the average speed,then the scalability from system size ′p to system size ofthe code-machine combination is:
ψ( , )p pp W
p W′ =
′ ⋅⋅ ′
(1)
where the work ′W is determined by the isospeed con-straint.
3SCALA: A PERFORMANCE SYSTEM
Fig. 1 Structure of SCALA.

In addition to measuring and computing scalability,the prediction of scalability and the relation betweenscalability and execution time have been well studied. Amechanism is developed to predict the scalability auto-matically (Sun et al. 1999). Theoretical and experimen-tal results show that scalability combined with initialexecution time can provide good performance predic-tion, in terms of execution times.
New concepts of crossing-point analysis and rangecomparison are introduced. Crossing-point analysis findsfast/slow performance crossing points of parallel pro-grams and machines. If CMC 1 is faster (slower) thanCMC 2 at ensemble size p, and ′ >p p is the first scaledensemble size such that CMC 1 becomes slower (faster)than CMC 2 at ′p , then we say ′p is a performance crossing-point of CMC 1 and CMC 2, and CMC 1 overperformsCMC 2 over the ensemble range between p and ′ −p 1. Incontrast with execution time which is measured for a par-ticular pair of problem and system sizes, range comparisoncompares performance over a wide range of ensembleand problem size via scalability and crossing-point anal-ysis. Only the two most relevant theoretical results aregiven here. More results can be found in Sun (2002).
Result 1: If a code-machine combination is faster atthe initial state and has a better scalability than that ofother code-machine combinations, then it will remainsuperior over the scalable range.
Result 1 shows that a better scalability will maintain abetter execution time over the scalable range. Rangecomparison becomes more challenging when the initialfaster CMC has a smaller scalability. When the systemensemble size scales up, an originally faster code withsmaller scalability can become slower than a code thathas a better scalability. Finding the fast/slow crossingpoint is critical for achieving optimal performance.
CMC 1 and CMC 2 may have different scalability anddifferent scaled problem size ′W , W * at the scaled ensem-ble size ′ >p p, respectively. By equation (1), we can usethe scalability of CMC 1 and CMC 2 to find the perfor-mance crossing point in terms of the scaled problemsize ′W , W * , which we call the scaled crossing point.As given by Result 2, the scaled crossing point can beused to identify the performance crossing point (withthe same problem size) and conduct range comparison.
4 COMPUTING APPLICATIONS
Assumption of the Algorithm: Assume code-machine combinations 1 and 2 have execution time t p W( , )and T p W( , ) respectively, and t p W T p W( , ) ( , )= α at the initial state, where α >1.
Objective of the Algorithm: Find the superior range of combination 2 starting at the ensemblesize p
Range ComparisonBegin
′ =p p;Repeat
′ = ′ +p p 1;Compute the scalability of combination 1 Φ( , )p p′ ;Compute the scalability of combination 2 Ψ( ; )p p′ ;
Until(Φ Ψ( , ) ( , )p p p p′ > ′α or ′p = the limit of ensemble size)If Φ Ψ( , ) ( , )p p p p′ > ′α then
′p is the smallest scaled crossing point;Combination 2 is superior at any ensemble size p y , p p p≤ < ′y ;
ElseCombination 2 is superior at any ensemble size p y , p p p≤ ≤ ′y
End{If}End{Range Comparison}
Fig. 2 Range Comparison Via Crossing Point Analysis.

Result 2: Assume code-machine combination 1 has alarger execution time than code-machine combination 2at the initial state, then the scaled ensemble size ′p is nota scaled crossing point if and only if combination 1 has alarger execution time than that of combination 2 for solv-ing any scaled problem W y such that W y is between ′Wand W * at ′p , where ′W and W * is the scaled problemsize of combination 1 and combination 2 respectively.
Result 2 gives the necessary condition for range compari-son of scalable computing: ′p is not a crossing point of pif and only if the fast/slow relation of the codes does notchange for any scaled problem size within the scalablerange of the two compared code-machine combinations.Based on this theoretical finding, with the comparisonof scalability, we can predict the relative performanceof codes over a range of problem sizes and machinesizes. This special property of the scalability comparisonis practically valuable. Programming optimization in alarge sense is to compare different programming optionsand to choose the best option available. Pre-measuredperformance can be sorted and used for performanceprediction. Since execution time is determined by prob-lem size, using pre-measured execution time to predictperformance requires an extremely large database and isimpractical. On the other hand, scalability is “dimension-less” and only need to be stored at each ensemble size.Result 2 provides a foundation for the performance pre-diction component of SCALA. Figure 2 gives the rangecomparison algorithm in terms of finding the smallestscaled crossing point via scalability comparison. Morealgorithms can be found in Sun (2002). In general, therecould be more than one scaled crossing point over theconsideration range for a given pair of CMCs. Thisalgorithm can be used iteratively to find successivescaled crossing points.
4 Symbolic Analysis
The quality of scalability analysis depends significantlyon the ability to determine crucial program informationsuch as how much work is contained in a program, howmuch work has to be processed by a specific processor,communication overhead, etc. This as well as many otherprogram analyses are seriously hampered by programunknowns (problem and machine sizes) and complexexpressions that can stem from recurrences, tiling withsymbolic block sizes (Benkner et al. 1995), linearizedsubscripts, and non-linear terms in subscript expressions.Ineffective approaches to gather and propagate sufficientinformation about variables through the program con-tinue to have a detrimental impact on many compileranalyses and optimizations (Fahringer and Scholz 1997,Fahringer 1998, Blume and Eigenmann 1994, Tu andPadua 1995, Tu 1995). As a consequence worst case
assumptions are frequently made or program analysis isdone at runtime which increases the execution overhead.Therefore, sophisticated symbolic analysis that can copewith program unknowns is needed to alleviate thesecompiler deficiencies.
We use symbolic evaluation (Fahringer and Scholz1997) which combines both data and control flow analy-sis to determine variable values, assumptions about andconstraints between variable values, and conditionsunder which control flow reaches a program statement.Computations are represented as symbolic expressionsdefined over the program’s problem and machine size.Each program variable is associated with a symbolicexpression describing its value at a specific programpoint. In addition a path condition – represented by afirst-order logic formula – describes the condition underwhich control flow reaches a given program point andthe assumptions on variable values made for a givencontrol flow branch.
The goal of our symbolic evaluation with respect toloops is to detect the recurrence variables, determine therecurrence system and finally find closed forms for recur-rence variables at the loop exit by solving the recurrencesystem. We have implemented a recurrence solver writ-ten on top of Mathematica. Our symbolic evaluationtechniques comprise accurate modeling of assignmentand input/output statements, branches, loops, recurrences,arrays and procedures. Efficiency and accuracy are highlyimproved by aggressive simplification techniques. All ofour techniques target both linear as well as non-linearexpressions and constraints.
Symbolic evaluation is used as a basis for a varietyof symbolic algorithms to compute statement execu-tion counts as well as the work contained in a programand the amount of data transferred as a function of theproblem and machine size (Fahringer 1998). The workto be done by an individual processor with respect to aspecific program statement S is computed to be thenumber of times this processor is executing S weightedby the time it takes to execute a single instance of S.Symbolic execution times are functions over machineand problem sizes. The execution time of a single state-ment is obtained by the measurement system. Based onactual measurements on the target machines of interestthe data management component is extracting and sum-ming up all execution times for the operations containedin S. We are currently developing a symbolic executiontime estimator for data-parallel Fortran programs which isbased on our techniques for computing symbolic statementexecution counts combined with execution times of opera-tions (obtained by the data management component).
In the following we describe how to estimate theamount of work to be processed by every processor of adata parallel program. The following code shows a High
SCALA: A PERFORMANCE SYSTEM 5

Performance Fortran (HPF) (1996) code excerpt with aprocessor array PR of size p (machine size) and twoproblem sizes n1 and n 2 ,
INTEGER A(n2)!HPF$ PROCESSORS :: PR(p)!HPF$ DISTRIBUTE (BLOCK) ONTO PR :: ADO J n1 11= ,DO J J n2 1 11= ∗,IF (J n2 2≤ ) THEN
S: A(J 2) = ...ENDIFENDDOENDDO
The loop contains a write operation to a one-dimen-sional array A which is block-distributed onto p proces-sors. Let k (1≤ ≤k p) denote a specific processor of theprocessor array. Computations that define the data ele-ments owned by a processor k are performed exclusivelyby k. For the sake of simplicity we assume that p evenlydivides n 2 . Therefore, a processor k is executing theassignment to A based on the underlying block distribu-tion if n k p J n k p2 2 21 1∗ − + ≤ ≤ ∗( ) / / . The precise workto be processed by a processor k is the number of timesk is writing A, which is defined by work (k).
The problem of estimating the amount of work to bedone by processor k can now be formulated as countingthe number of integer solutions to I which is given by:
1 1 1≤ ≤J n
1 2 1 1≤ ≤ ∗J J n
J n2 2≤n k
pJ
n k
p2
2
211
∗ −+ ≤ ≤
∗( )
I contains constraints for every loop bound and conditionexpression in the above example code. Furthermore, theconstraints of the data distribution are included in I. Allconstraints are defined over loop variables and machineand problem sizes. Note that if we omit the last two con-straints of I then we obtain the overall work contained ina program. In the following we replace n k p2 1 1∗ − +( ) /by LB and n k p2 ∗ / by UB. By using various techniquesto simplify systems of constraint (Fahringer 1998) wecan determine that 1 2≤ J is made redundant by B J≤ 2
and J n2 2≤ by J UB2 ≤ . Therefore, the simplified I withall redundant inequalities removed is given by
1 1 1≤ ≤J n
LB J UB≤ ≤2
J J n2 1 1≤ ∗
Determining how many times processor k is executingstatement S is identical with the problem to find thenumber of solutions of I. We estimate work k( ) by work k( )which is given as follows:
work k C E ki ii
( ) ( ) ( )= ∗≤ ≤∑γ
1 3
where
C UB n p n1 12
2= ≤ ≤{ , }
E kn UB LB LB n LB n UB
n1
1 1 1
12
2 2
2( )
( ) ( )=
+ − ∗ − ∗ + ∗ ∗ +∗
C n nUBn
LBn2 1 11 1
= > ≤{ , }
E k n LBn
n LB2 1 2 21
12
1 1( ) ( ) ( )= − + ∗ − +
C n p n UB3 2 12 1= ≥ ≥ +{ , }
E k nn
pUB
n3 112
11( ) ( )= ∗ − ++
and γ is defined as follows:
γ ( ):
:C
C=
=1
0
if TRUE
otherwise
Notice that the result is given as a function of k (proces-sor identification), machine and problem sizes. We haveimplemented a symbolic sum algorithm (Fahringer 1998)that estimates the number of solutions to a system of lin-ear and non-linear symbolic constraints.
Most conventional performance estimators must repeatthe entire performance analysis whenever the problem sizeor the number of processors used are changing. How-ever, our symbolic performance analysis provides thesolution of the above problem as a symbolic expressionof the program unknowns (p, n1 , n 2 , and k). For eachchange in the value of any program unknown we simplyre-evaluate the result, instead of repeating the entire per-formance analysis. Table 1 shows an experiment whichcompares measured against estimated values for a 4processor (p = 4) version of the example code by varyingthe values for n1 and n 2 . The measurements have beendone by executing the example code on an iPSC/860hypercube system and enumerating for each processorthe number of times it writes array A in the loop of theexample code. It can be seen that the estimates (work k( ))are very close to the measurements (work k( )). In theworst case the estimates are off by 1.19% for a relativelysmall problem size (n1 200= , n 2 100= ). Moreover, wealso observe that for larger problem sizes the estimationaccuracy consistently improves.
6 COMPUTING APPLICATIONS

In order to obtain an execution time estimate for S weweight this figure with the pre-measured execution timesfor each operation contained in S as obtained from thedata management component.
To compute the amount of data transferred as impliedby a parallel program we specify a similar set of con-straints that describes the non-local data accesses of aspecific processor k. The number of solutions to this setof constraints determines the amount of data transferredwith respect to k. In both cases we use a symbolic sumalgorithm to compute the number of solutions to a set ofconstraints. We also can use this approach to determinewhether two processors are exchanging data. For instance,let I1 and I 2 determine the local data of a processor k1
and the non-local data needed by a processor k2 , respec-tively. Then k1 is sending data to k2 if and only if thereexists at least one solution to I I1 2∪ . We can thereforeuse our symbolic sum algorithm as a basis to compute the
• overall work contained in a program• amount of work to be processed by a specific proces-
sor• amount of data transferred, and• number of transfers.
All of these performance metrics are functions overmachine and problem sizes. Communication times canbe computed based on the well-known linear communi-cation model ρ β+ ∗ D, where ρ is the message startupoverhead, and β is the message transfer overhead for send-ing a single data element. SIS can be used to determinemeasurements for ρ and β. Symbolic analysis can thencombine these parameter values with symbolic functionsfor amount of data transferred and number of transfers inorder to compute symbolic communication times as func-tions of machine and problem size.
We have implemented a prototype of our symbolicevaluation framework (Fahringer and Scholz 1997) aswell as symbolic sum algorithm (Fahringer 1998) thatestimates the number of solutions to a set of symbolicconstraint. These techniques are used as part of theVFC – a parallelizing compiler for Fortran programs,PT (Fahringer 1995, 1996a) – a performance estima-tor, and SCALA in order to effectively parallelize andoptimize Fortran programs for distributed and sharedmemory architectures.
5 Prototype Implementation
The implementation of SCALA involves several steps,which include the development of each componentmodule, integration of these components, and testing,modification and enhancement of each component aswell as of the integrated system. As a collective effort,we have conducted the implementation of each compo-nent concurrently and have successfully tested a proto-type of the SCALA system.
Restructuring a program can be seen as an iterativeprocess in which a parallel program is transformed ateach iteration. The performance of the current parallelprogram is analyzed and predicted at each iteration. Then,based on the performance result, the next restructuringtransformation is selected for improving the performanceof the current parallel program. Integrating performanceanalysis with a restructuring system is critical to supportautomatic performance tuning in the iterative restructur-ing process. As a collaborative effort between IllinoisInstitute of Technology and University of Vienna, a firstprototype of SCALA was developed and tested underthe VFC as an integrated performance tool for revealingscaling behavior of simple and structured codes. In thisframework, the static performance data have been pro-
SCALA: A PERFORMANCE SYSTEM 7
Table 1Measured versus estimated values for the amount of work to be done by all processors for p = 4
n1 n2 work kk p
( )1≤ ≤∑ work k
k p
( )1≤ ≤∑ error in %
100 100 10000 10025 0.25
200 100 20000 20238 1.19
200 200 40000 40450 1.12
400 200 80000 80474 0.59
400 400 160000 160900 0.56
800 400 320000 320950 0.29
800 800 640000 641800 0.28
vided by P T3 . The integration of P T3 into VFC enablesthe user to exploit considerable knowledge about thecompiler’s program structural analysis information and pro-vides performance estimates for code restructuring. Amongothers P T3 traverses an abstract syntax tree generatedby VFC in order to locate communication statementsinserted by the compiler. For each communication state-ment, a list of constraints is determined by P T3 thatdetermines which processor is communicating with whatother processors. These constraints are based on theowner-computes model which indicates that a processorupdates data if this data is owned by the processor. Anyremote data that is needed to update local data must betransferred via message passing. In Fahringer (1996b)we have demonstrated how P T3 determines the amountof data transferred and the number of transfers for par-allel programs by incorporating compile-time analysis.Such analysis is restricted to so-called regular programswhich contain only linear array index and loop boundfunctions defined over loop variables of enclosing loops.The resulting constraints are incorporated by our sym-bolic analysis to determine the amount of data trans-ferred and number of transfers as symbolic functionsdefined over problem and/or machine sizes (see Sec-tion 4). The SCALA system has been integrated to pre-dict the scaling behavior of the program by using staticinformation provided by P T3 and the dynamic perfor-mance information collected at run-time. In particular,the Data Management Module of SCALA filters the rawperformance data obtained, executing the code on a paral-lel machine, and provides selected metrics which com-bined with the static models of P T3 allows an accuratescalability prediction of the algorithm-machine combi-nation. Naturally, the interactions between SCALA and
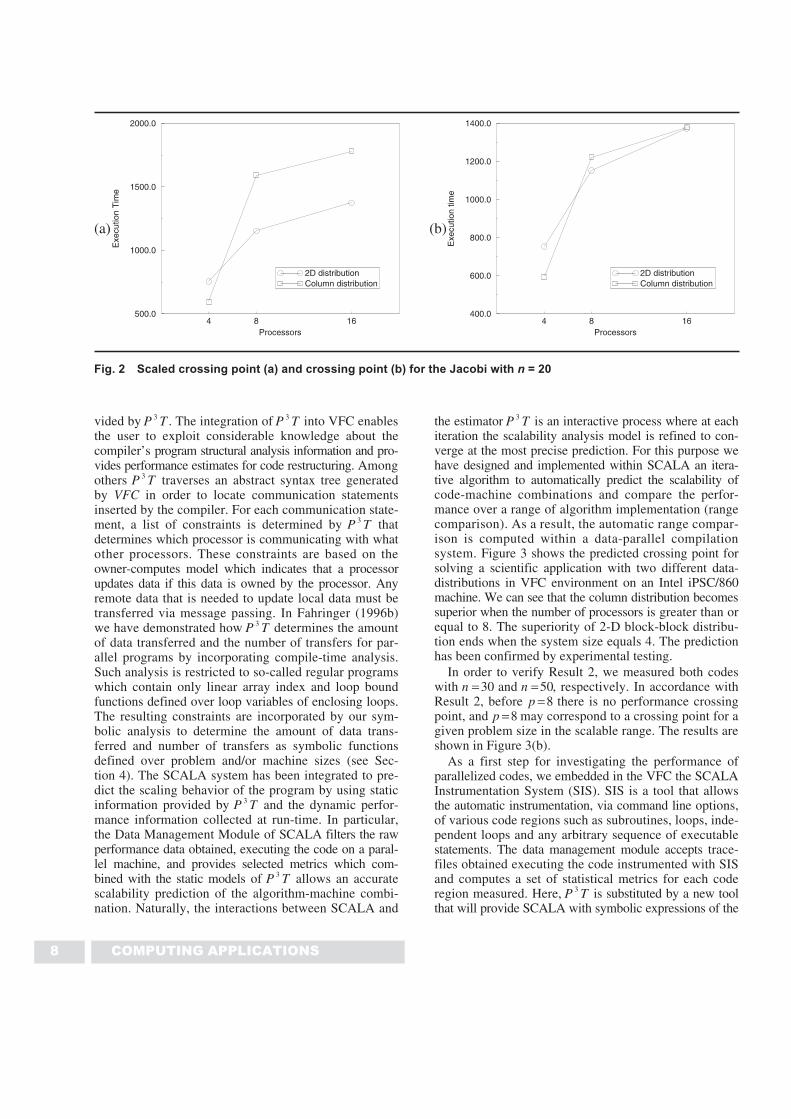
the estimator P T3 is an interactive process where at eachiteration the scalability analysis model is refined to con-verge at the most precise prediction. For this purpose wehave designed and implemented within SCALA an itera-tive algorithm to automatically predict the scalability ofcode-machine combinations and compare the perfor-mance over a range of algorithm implementation (rangecomparison). As a result, the automatic range compar-ison is computed within a data-parallel compilationsystem. Figure 3 shows the predicted crossing point forsolving a scientific application with two different data-distributions in VFC environment on an Intel iPSC/860machine. We can see that the column distribution becomessuperior when the number of processors is greater than orequal to 8. The superiority of 2-D block-block distribu-tion ends when the system size equals 4. The predictionhas been confirmed by experimental testing.
In order to verify Result 2, we measured both codeswith n = 30 and n = 50, respectively. In accordance withResult 2, before p = 8 there is no performance crossingpoint, and p = 8 may correspond to a crossing point for agiven problem size in the scalable range. The results areshown in Figure 3(b).
As a first step for investigating the performance ofparallelized codes, we embedded in the VFC the SCALAInstrumentation System (SIS). SIS is a tool that allowsthe automatic instrumentation, via command line options,of various code regions such as subroutines, loops, inde-pendent loops and any arbitrary sequence of executablestatements. The data management module accepts trace-files obtained executing the code instrumented with SISand computes a set of statistical metrics for each coderegion measured. Here, P T3 is substituted by a new toolthat will provide SCALA with symbolic expressions of the
8 COMPUTING APPLICATIONS
Fig. 2 Scaled crossing point (a) and crossing point (b) for the Jacobi with n = 20
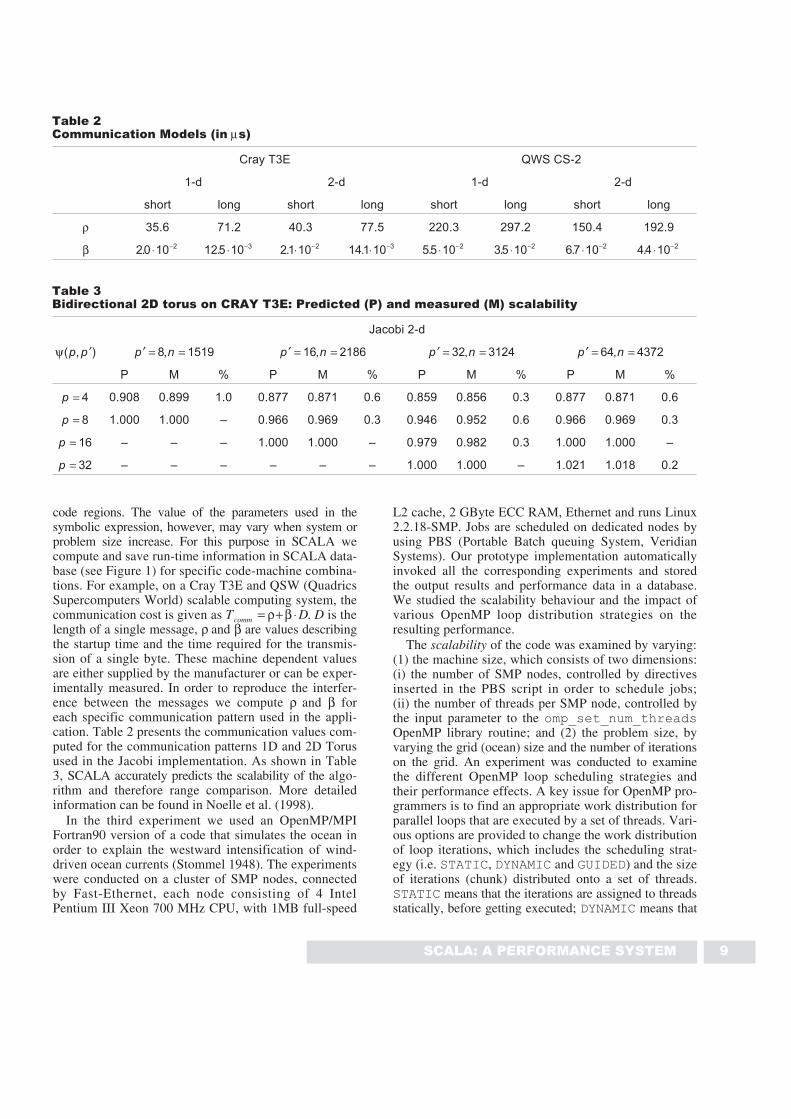
code regions. The value of the parameters used in thesymbolic expression, however, may vary when system orproblem size increase. For this purpose in SCALA wecompute and save run-time information in SCALA data-base (see Figure 1) for specific code-machine combina-tions. For example, on a Cray T3E and QSW (QuadricsSupercomputers World) scalable computing system, thecommunication cost is given as T Dcomm = + ⋅ρ β . D is thelength of a single message, ρ and β are values describingthe startup time and the time required for the transmis-sion of a single byte. These machine dependent valuesare either supplied by the manufacturer or can be exper-imentally measured. In order to reproduce the interfer-ence between the messages we compute ρ and β foreach specific communication pattern used in the appli-cation. Table 2 presents the communication values com-puted for the communication patterns 1D and 2D Torusused in the Jacobi implementation. As shown in Table3, SCALA accurately predicts the scalability of the algo-rithm and therefore range comparison. More detailedinformation can be found in Noelle et al. (1998).
In the third experiment we used an OpenMP/MPIFortran90 version of a code that simulates the ocean inorder to explain the westward intensification of wind-driven ocean currents (Stommel 1948). The experimentswere conducted on a cluster of SMP nodes, connectedby Fast-Ethernet, each node consisting of 4 IntelPentium III Xeon 700 MHz CPU, with 1MB full-speed
L2 cache, 2 GByte ECC RAM, Ethernet and runs Linux2.2.18-SMP. Jobs are scheduled on dedicated nodes byusing PBS (Portable Batch queuing System, VeridianSystems). Our prototype implementation automaticallyinvoked all the corresponding experiments and storedthe output results and performance data in a database.We studied the scalability behaviour and the impact ofvarious OpenMP loop distribution strategies on theresulting performance.
The scalability of the code was examined by varying:(1) the machine size, which consists of two dimensions:(i) the number of SMP nodes, controlled by directivesinserted in the PBS script in order to schedule jobs;(ii) the number of threads per SMP node, controlled bythe input parameter to the omp_set_num_threadsOpenMP library routine; and (2) the problem size, byvarying the grid (ocean) size and the number of iterationson the grid. An experiment was conducted to examinethe different OpenMP loop scheduling strategies andtheir performance effects. A key issue for OpenMP pro-grammers is to find an appropriate work distribution forparallel loops that are executed by a set of threads. Vari-ous options are provided to change the work distributionof loop iterations, which includes the scheduling strat-egy (i.e. STATIC, DYNAMIC and GUIDED) and the sizeof iterations (chunk) distributed onto a set of threads.STATIC means that the iterations are assigned to threadsstatically, before getting executed; DYNAMIC means that
SCALA: A PERFORMANCE SYSTEM 9
Table 2Communication Models (in µs)
Cray T3E QWS CS-2
1-d 2-d 1-d 2-d
short long short long short long short long
ρ 35.6 71.2 40.3 77.5 220.3 297.2 150.4 192.9
β 20 10 2. ⋅ − 125 10 3. ⋅ − 21 10 2. ⋅ − 141 10 3. ⋅ − 55 10 2. ⋅ − 35 10 2. ⋅ − 67 10 2. ⋅ − 44 10 2. ⋅ −
Table 3Bidirectional 2D torus on CRAY T3E: Predicted (P) and measured (M) scalability
Jacobi 2-d
ψ( , )p p ′ ′ = =p n8 1519, ′ = =p n16 2186, ′ = =p n32 3124, ′ = =p n64 4372,
P M % P M % P M % P M %
p = 4 0.908 0.899 1.0 0.877 0.871 0.6 0.859 0.856 0.3 0.877 0.871 0.6
p = 8 1.000 1.000 – 0.966 0.969 0.3 0.946 0.952 0.6 0.966 0.969 0.3
p = 16 – – – 1.000 1.000 – 0.979 0.982 0.3 1.000 1.000 –
p = 32 – – – – – – 1.000 1.000 – 1.021 1.018 0.2
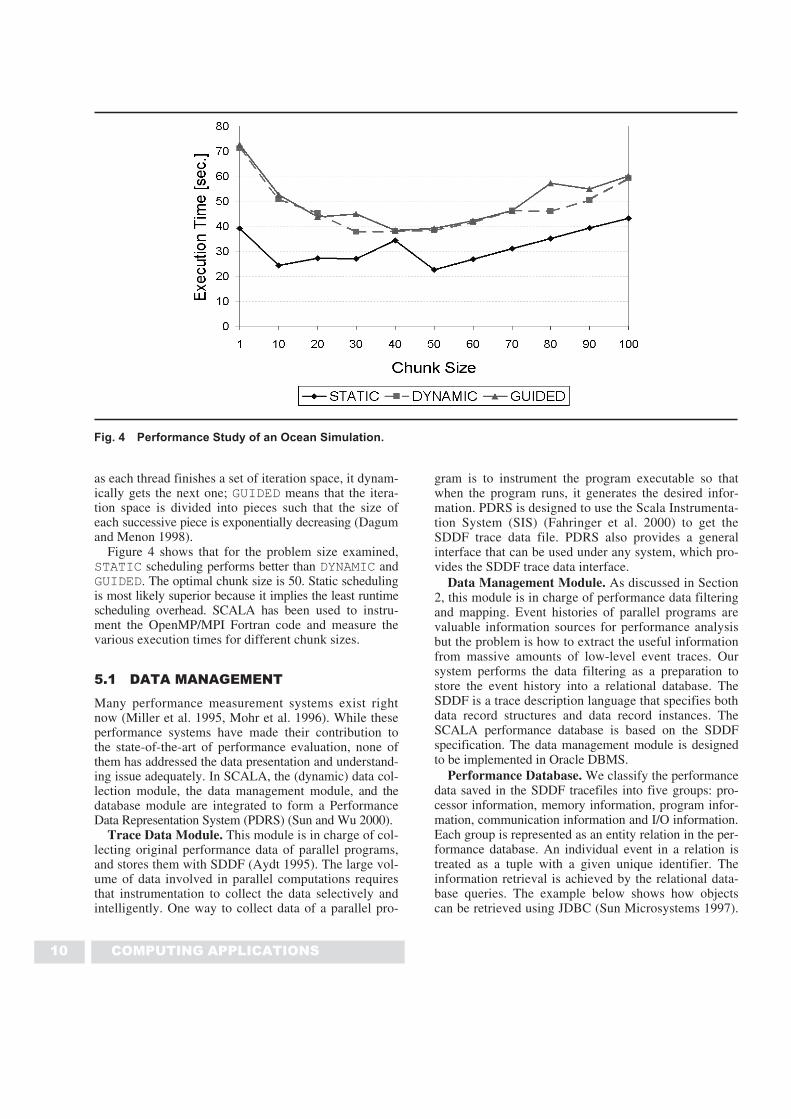
as each thread finishes a set of iteration space, it dynam-ically gets the next one; GUIDED means that the itera-tion space is divided into pieces such that the size ofeach successive piece is exponentially decreasing (Dagumand Menon 1998).
Figure 4 shows that for the problem size examined,STATIC scheduling performs better than DYNAMIC andGUIDED. The optimal chunk size is 50. Static schedulingis most likely superior because it implies the least runtimescheduling overhead. SCALA has been used to instru-ment the OpenMP/MPI Fortran code and measure thevarious execution times for different chunk sizes.
5.1 DATA MANAGEMENT
Many performance measurement systems exist rightnow (Miller et al. 1995, Mohr et al. 1996). While theseperformance systems have made their contribution tothe state-of-the-art of performance evaluation, none ofthem has addressed the data presentation and understand-ing issue adequately. In SCALA, the (dynamic) data col-lection module, the data management module, and thedatabase module are integrated to form a PerformanceData Representation System (PDRS) (Sun and Wu 2000).
Trace Data Module. This module is in charge of col-lecting original performance data of parallel programs,and stores them with SDDF (Aydt 1995). The large vol-ume of data involved in parallel computations requiresthat instrumentation to collect the data selectively andintelligently. One way to collect data of a parallel pro-
gram is to instrument the program executable so thatwhen the program runs, it generates the desired infor-mation. PDRS is designed to use the Scala Instrumenta-tion System (SIS) (Fahringer et al. 2000) to get theSDDF trace data file. PDRS also provides a generalinterface that can be used under any system, which pro-vides the SDDF trace data interface.
Data Management Module. As discussed in Section2, this module is in charge of performance data filteringand mapping. Event histories of parallel programs arevaluable information sources for performance analysisbut the problem is how to extract the useful informationfrom massive amounts of low-level event traces. Oursystem performs the data filtering as a preparation tostore the event history into a relational database. TheSDDF is a trace description language that specifies bothdata record structures and data record instances. TheSCALA performance database is based on the SDDFspecification. The data management module is designedto be implemented in Oracle DBMS.
Performance Database. We classify the performancedata saved in the SDDF tracefiles into five groups: pro-cessor information, memory information, program infor-mation, communication information and I/O information.Each group is represented as an entity relation in the per-formance database. An individual event in a relation istreated as a tuple with a given unique identifier. Theinformation retrieval is achieved by the relational data-base queries. The example below shows how objectscan be retrieved using JDBC (Sun Microsystems 1997).
10 COMPUTING APPLICATIONS
Fig. 4 Performance Study of an Ocean Simulation.

For instance, suppose that we want to get the communi-cation events that occurred in processor 0, the query
select sourcePE, destinationPE,messageLength, event_startTimestamp,event_endTimestamp from CommunicationInformation where processor = 0.
We may make the following SQL query by JDBC:
ResultSet rs = stmt.executeQuery( "selectsourcePE, destinationPE, messageLength,event_startTimestamp, event_endTimestampfrom Communication Information where
processor = 0");while (rs.next()) {Object i1 = rs.getObject("sourcePE");Object i2 =
rs.getObject("destinationPE");Object r1 =
rs.getObject("messageLength");Object r2 =
rs.getObject("event_startTimestamp");Object r3 =
rs.getObject("event_endTimestamp");}
Multiple versions of performance data are handled byspecifying a version attribute in each tuple. By specify-ing a version number in each database query, we can getmultiple versions of program performance for compari-son. In addition to the default PDRS performance param-eters, new performance parameters such as sound filescan also be added by users and be supported by thedatabase.
Relational Queries. Relational query is a functionbuilt on top of the database module to support the per-formance analysis modules. It includes four parts: Sym-bolic Analysis, Statistical Analysis, Scalability Analysis,and Performance Model Generator, corresponding to theanalysis modules. This function is implemented in JDBC.Java applications include the PDA, PVA, and GUI mod-ule implemented by Java. The JDBC provides a bridgebetween Java applications and performance database. Thisfunction finds the appropriate performance data for thePerformance Diagostic Agent (PDA) function and GUI.PDA invokes the performance modules for performanceanalysis.
Performance Diagnostic Agent (PDA). This func-tion calls for performance analysis. Its function opera-tion algorithm is as follows.
Algorithm (Performance diagnosis):
Performance analysis requests;switch (analysis type) {Statistical:
Retrieve the performance informationrequired;
Get or compute the predictedperformance range;
Compute the real result of requestedperformance parameter;
Compare the result with theperformance range;
If (the result is not in theperformance range)
Give an explanation (using graphicsand sound);
break;Scalability:Retrieve the performance information
required;Get or compute the predicted
scalability results;Compute the real scalability results;Compare the real result with the
predicted results;Explain the compared results (using
graphics and sound);break;
Models:Retrieve the performance information
required;Get the predicted performance range;Compute the real result of requested
performance parameter;Compare the result with the
performance range;If (the result is not in the
performance range)Give an explanation (using graphics
and sound);break;
Default: printf("No such analysistype");
break;}
The PDA retrieves the performance information fromthe performance database, and invokes the appropriateanalysis module for performance analysis.
5.2 BROWSER INTERFACE
A Java 3D visualization environment is also developed forthe SCALA interface. This visualization tool is designedbased on a client-server model. The server side mainlyprovides data services. At startup, the server accessescertain data files, creates data objects, and waits for theclient to call. Currently the server supports two data fileformats: Self-Defining Data Format (SDDF) and a simpletext format used by SCALA. The driving force behind theclient/server approach is to increase accessibility, asmost users may not have SDDF installed on their machines
SCALA: A PERFORMANCE SYSTEM 11

and may like to use SCALA over the net. Moreover, thecurrent distribution of SDDF supports only a few com-puting platforms. Partitioning our tool into separate objectsbased on their services makes it possible to deploy the dataserver in a central site and the client objects anywhere onthe Internet. The client is implemented in pure Java andthe data servant is implemented as a CORBA compliantobject so that it can be accessed by clients coded inother programming languages.
For effective visualization, a good environment shouldallow users to interact with graphics objects and recon-figure the interface. The basic configuration supportedby the Java interface includes changing scale and color,and selecting specific performance metrics and views.At the run-time, the user can rotate, translate, and zoomthe graphics objects. Automatic rotation similar to the ani-mation is also an enabled feature. The graphics objects arebuilt using Java 2D/3D API, which are parts of theJavaMedia suite of APIs.
We have implemented a custom canvas which servesas a drawing area for graphics objects. The paint() methodin canvas class is extended to the full capability of draw-ing a complete 2D performance graph. The classes for2D performance graphics are generic in the sense thatthe resulting graph depends only on the performancedata. Besides 2D performance graphics objects, Java 3Dis used to build three-dimensional graphics objects. Java3D uses the scene-graph based programming model inwhich individual application graphics elements are con-structed as separate objects and connected together into
a tree-like structure. It gives us high-level constructs forcreating and manipulating 3D geometry and for con-structing the structures used in rendering that geometry.As in developing 2D graphics classes, we analyze the 3Dperformance data and build several generic 3D graphicsclasses. A terrain grid class based on IndexedQuadArraycan be used to describe the performance surface. Rota-tion, translation, and zooming by mouse are supported.
Figure 5 is the kiviat view which shows the variationof cpi (sequential computing capacity), communicationlatence, and parallel speed when problem size increases.Figure 6 shows the execution time as a function of workand number of processors on a given machine. Theseviews and more are currently supported by the JAVA3D visualization tool. While this Java visualization envi-ronment is developed for SCALA, its components areloosely coupled with other SCALA components and canbe easily integrated into other performance tools. It sep-arates data objects from GUI objects and is portable andreconfigurable.
6 Conclusion
The purpose of the SCALA project is to improve thestate of the art in performance analysis of parallel codesby extending current methodologies and by testing and
12 COMPUTING APPLICATIONS
Fig. 5 Cpi, Communication Latency, and parallel speedas a Function of Problem Size.
Fig. 6 Execution Time as a Function of Work and Num-ber of Processors.

integrating newly proposed methodologies. SCALA com-bines symbolic and static analysis of the parallelized codewith dynamic performance data. The static and sym-bolic analysis are provided by the restructuring com-piler, while dynamic data are collected by executing theparallel code on a small number of processors of the tar-get machine. A performance model is then generated forpredicting the scaling behavior of the code with varyinginput data size and machine characteristics. This approachto performance prediction and analysis provides the userwith detailed information regarding the behavior of theparallelized code and the influences of the underlyingarchitecture.
Current development of SCALA has made its contri-bution to the state-of-the-art of performance evaluation.However, SCALA is a continuing research. Only a pro-totype system has been tested for the proof of concept.Many research issues remain open. In the near future weplan to continue this research with three focuses: enhancethe symbolic analysis module to support more sophisticateprogram paradigms, adopt low-level hardware monitorinformation for advanced performance analysis andcharacterization, and extend the research to grid com-puting.
ACKNOWLEDGMENTS
The authors are indebted to several individuals for theirhelp with this research. In particular, Dr. Xingfu Wuparticipated in the development of the PDRS; HongLinh Truong and Radu Prodan contributed to the imple-mentation and testing of the scalability analysis moduleand the SIS system, respectively, and Zhaohua Zhancontributed to the implementation of the visualizationenvironment. The authors are grateful to the referees fortheir valuable suggestions that helped improve the tech-nical quality and presentation of the paper.
AUTHORS BIOGRAPHIES
Xian-He Sun received his Ph.D. degree in ComputerScience from Michigan State University. He was a staffscientist at ICASE, NASA Langley Research Center andwas an associate professor in the Computer ScienceDepartment at Louisiana State University (LSU). Cur-rently he is a professor and the director of the ScalableComputing Software laboratory in the Computer ScienceDepartment at Illinois Institute of Technology (IIT), anda guest faculty member at the Argonne National Labora-tory. Dr. Sun’s research interests include parallel anddistributed processing, software systems, performanceevaluation, and scientific computing. He has publishedextensively in the field and his research has been sup-ported by DoD, DoE, NASA, NSF, and other govern-
ment agencies. He is a senior member of IEEE, a mem-ber of ACM, New York Academy of Science, PHIKAPPA PHI, and has served and is serving as the chair-man or is on the program committee for a number ofinternational conferences and workshops. He receivedthe ONR and ASEE Certificate of Recognition award in1999, and received the Best Paper Award from the Inter-national Conference on Parallel Processing (ICPP01) in2001.
Thomas Fahringer received a Masters degree in 1988and a Ph.D. in 1993, all in Computer Science from theTechnical University of Vienna, Austria. Between 1988and 1990 he was a visiting scientist at the EngineeringDesign Research Center at Carnegie Mellon Universityin Pittsburgh, PA. From 1990–1998 he was AssistantProfessor of Computer Science of Computer Science atthe Institute for Software Science, University of Vienna.Since 1998 he has been an associate professor of Com-puter Science at the Institute for Software Science, Uni-versity of Vienna. His research focuses on software toolsand programming environments for distributed and con-current systems, in particular, programming paradigmsand methods, parallelizing compilers, debuggers, sym-bolic program and performance analysis, and perfor-mance-oriented application development for cluster andGrid architectures. Readers may contact Fahringer atthe Institute for Software Science, University of Vienna,Liechtensteinstr. 22, A-1090 Vienna, Austria. e-mail:[email protected].
Mario Pantano received a Laurea degree in ComputerScience from the University of Milan, Italy in 1990 and aPh.D. in Electronic Engineering and Computer Sciencefrom the University of Pavia, Italy in 1994. From 1994to 1998 he was with the Institute for Software Technol-ogy and Parallel Systems, University of Vienna, Aus-tria, first as researcher and then as project manager of theEU Esprit project “HPF+: Optimizing HPF for AdvancedApplications”. In May 1998 he joined the Departmentof Computer Science at the University of Illinois atUrbana-Champaign. His main research interests includeperformance measurement, modeling and analysis of par-allel programs, scalability analysis, tools and run-timesystems for parallel program instrumentation and mea-surements, and design of automatic parallelization envi-ronments.
REFERENCES
Adve, V.S., Crummey, J.M., Anderson, M., Kennedy, K., Wang,J.-C., and Reed, D.A. 1995. “An integrated compilationperformance analysis environment for data parallel pro-
SCALA: A PERFORMANCE SYSTEM 13

grams,” in Proc. of Supercomputing, (San Diego, CA)December.
Aydt, R. 1995. “The Pablo Self-Defining Data Format.” Depart-ment of Computer Science, University of Illinois, ftp://bugle.cs.uiuc.edu/pub/Release/Documentation/SDDF.ps,April.
Benkner, S. 1999. “VFC: The Vienna Fortran Compiler,” Sci-entific Programming 7(1): 67–81.
Benkner, S., Andel, S., Blasko, R., Brezany, P., Celic, A.,Chapman, B., Egg, M., Fahringer, T., Hulman, J., Hou, Y.,Kelc, E., Mehofer, E., Moritsch, H., Paul, M., Sanjari,K., Sipkova, V., Velkov, B., Wender, B., and Zima, H.1995. Vienna Fortran Compilation System – Version 2.0 –User’s Guide.
Berman, F., Wolski, R., Figueira, S., Schopf, J., and Shao, G.1996. “Application-level scheduling on distributed het-erogeneous networks,” in Proc. of Supercomputing ’96.
Blume, W. and Eigenmann, R. 1994. “An Overview of SymbolicAnalysis Techniques Needed for the Effective Parallel-ization of the Perfect Benchmarks,” in Proceedings ofthe 1994 International Conference on Parallel Processing,(St. Charles, IL).
Dagum, L. and Menon, R. 1998. “OpenMP: An industry-standardAPI for shared-memory programming,” IEEE Computa-tional Science and Engineering 5(Mar.): 46–55.
Fahringer, T. 1995. “Estimating and optimizing performancefor parallel programs,” IEEE Computer 28(Nov.): 47–56.
Fahringer, T. 1996a. Automatic Performance Prediction ofParallel Programs. Kluwer Academic Publishers, Boston.
Fahringer, T. 1996b. “Compile-Time Estimation of Commu-nication Costs for Data Parallel Programs,” Journal ofParallel and Distributed Computing 39(Nov.): 46–65.
Fahringer, T. 1998. “Efficient Symbolic Analysis for Parallel-izing Compilers and Performance Estimators,” Journalof Supercomputing 12: 227–252.
Fahringer, T., and Scholz, B. 1997. “Symbolic Evaluation forParallelizing Compilers,” in Proc. of the 11th ACM Inter-national Conference on Supercomputing, (Vienna, Aus-tria), pp. 261–268, ACM Press.
Fahringer, T., Scholz, B., and Sun, X-H. 2000. “Execution-driven performance analysis for distributed and parallelsystems,” in Proc. of the Second ACM InternationalWorkshop on Software and Performance (WOSP'2000),September.
Gustafson, J., Montry, G., and Benner, R. 1988. “Develop-ment of parallel methods for a 1024-processor hyper-cube,” SIAM J. of Sci. and Stat. Computing 9: 609–638.
“High Performance FORTRAN Language Specification.”Technical Report, Version 2.0.δ, Rice University, Hous-ton, TX, October 1996.
Hwang, K. and Xu, Z. 1998. Scalable Parallel Computing.McGraw-Hill WCB.
Kumar, V., Grama, A., Gupta, A., and Karypis, G. 1994. Intro-duction to Parallel Computing, Design and Analysis ofAlgorithms. The Benjamin/Cummings Publishing Com-pany, Inc.
Miller, B.P., Callaghan, M.D., Cargille, J.M., Hollingsworth,J.K., Irvin, R.B., Karavanic, K.L., Kunchithapadam, K.,and Newhall, T. 1995. “The paradyn parallel performancemeasurement tools,” IEEE Computer 28(11).
Mohr, B., Malony, A., and Cuny, J.E. 1996. “TAU,” in ParallelProgramming Using C++ (G. Wilson, ed.), MIT Press.
Noelle, M., Pantano, M., and Sun, X-H. 1998. “Communicationoverhead: Prediction and its influence on scalability,” inProc. the International Conference on Parallel and Dis-tributed Processing Techniques and Applications, July.
Sahni, S., and Thanvantri, V. 1996. “Performance metrics:Keeping the focus on runtime,” IEEE Parallel & Dis-tributed Technology Spring: 43–56.
Stommel, H.M. 1948. “The western intensification of wind-driven ocean currents,” Transactions American Geophysi-cal Union 29: 202–206.
SUN Microsystems Inc. 1997. “JDBC: a java SQL API, version1.20,” http://www.javasoft.com/products/jdbc/index.html.
Sun, X-H. 2002. “Scalability versus execution time in scal-able systems,” Journal of Parallel and Distributed Com-puting 62: 173–192.
Sun, X-H., Pantano, M., and Fahringer, T. 1999. “Integratedrange comparison for data-parallel compilation systems,”IEEE Transactions on Parallel and Distributed Systems10: 448–458.
Sun, X-H., and Rover, D. 1994. “Scalability of parallel algo-rithm-machine combinations,” IEEE Transactions on Par-allel and Distributed Systems June: 599–613.
Sun, X-H., and Wu, X. 2000. “PDRS: A performance data rep-resentation system,” in Proc. of 5th IEEE InternationalWorkshop on High-Level Parallel Programming Modelsand Supportive Environments (HIPS2000), April.
Taylor, V., Wu, X., et al. 2000. “Prophesy: An infrastructurefor analyzing and modeling the performance of paralleland distributed applications,” in Proc. of the Ninth IEEEInternational Symposium on High Performance Distrib-uted Computing (HPDC's 2000), August.
Tu, P. 1995. Automatic Array Privatization and Demand-DrivenSymbolic Analysis. PhD thesis, University of Illinois atUrbana-Champaign.
Tu, P. and Padua, D. 1995. “Gated SSA-Based Demand-DrivenSymbolic Analysis for Parallelizing Compilers,” in 9thACM International Conference on Supercomputing, (Bar-celona, Spain), pp. 414–423, July.
Veridian Systems, “PBS: The Portable Batch System,” http://www.openpbs.org.
Whaley, R.C., and Dongarra, J. 1998. “Automatically tunedlinear algebra software,” in Proc. of Supercomputing,November.
14 COMPUTING APPLICATIONS