Embed Size (px)
Citation preview
THIS REPORT CAN BE ACCESSED AT
HTTP://WWW.SEMLERBROSSY.COM/SAYONPAY
>
NOTE: THIS REPORT WILL BE OUR LAST WEEKLY REPORT OF THE 2014 PROXY SEASON. OUR NEXT REPORT WILL BE AVAILABLE THE WEEK OF JULY 14TH. PLEASE CONTINUE TO VISIT OUR SAY ON PAY BLOG FOR UPDATES.
SEMLER BROSSY / 6.25.14
2014 RUSSELL 3000 SAY ON PAY RESULTS 1
SUMMARY OF VOTE RESULTS (n=2,123)
— One additional company failed since last week’s report; 48 Russell 3000 companies (2.3%) have so far failed Say on Pay in 2014
One company failed since our last report: Medifast
2011: 37 (1.4%) 2012: 57 (2.6%) 2013: 57 (2.5%)
— At this point last year, 43 companies in the Russell 3000 (2.3%) had failed Say on Pay
— Average vote result to date in 2014 is 91%
Notes: As of June 20, 2014. The 2014 sample includes companies that had an Annual Meeting and Say on Pay vote in calendar year 2014.
Year over year data presented in this document does not reflect a constant sample given turnover in the Russell 3000 used for each year
as well as differences in how frequently companies hold votes.
For FY 2014 Russell 3000 sample effective as of June 28, 2013.
Source: Semler Brossy data and analysis; Fund Votes LLC.
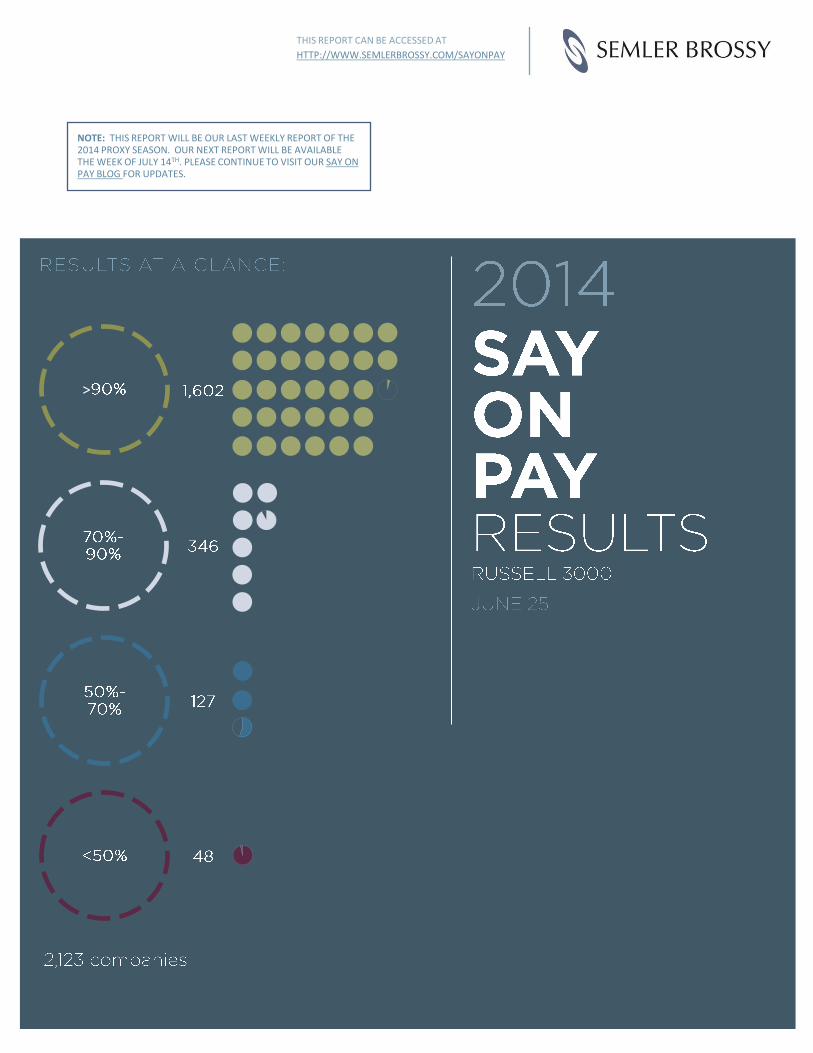
SAY ON PAY VOTE RESULTS
72% 73%76% 75%
21% 19%15% 16%
6%6% 6% 6%
1.4% 2.6% 2.5% 2.3%
0%
25%
50%
75%
100%
2011(n = 2,659)
2012(n = 2,226)
2013(n = 2,253)
2014(n = 2,123)
Below 50%
50 - 70%
70 - 90%
90%+
SEMLER BROSSY / 6.25.14
2014 RUSSELL 3000 SAY ON PAY RESULTS
2
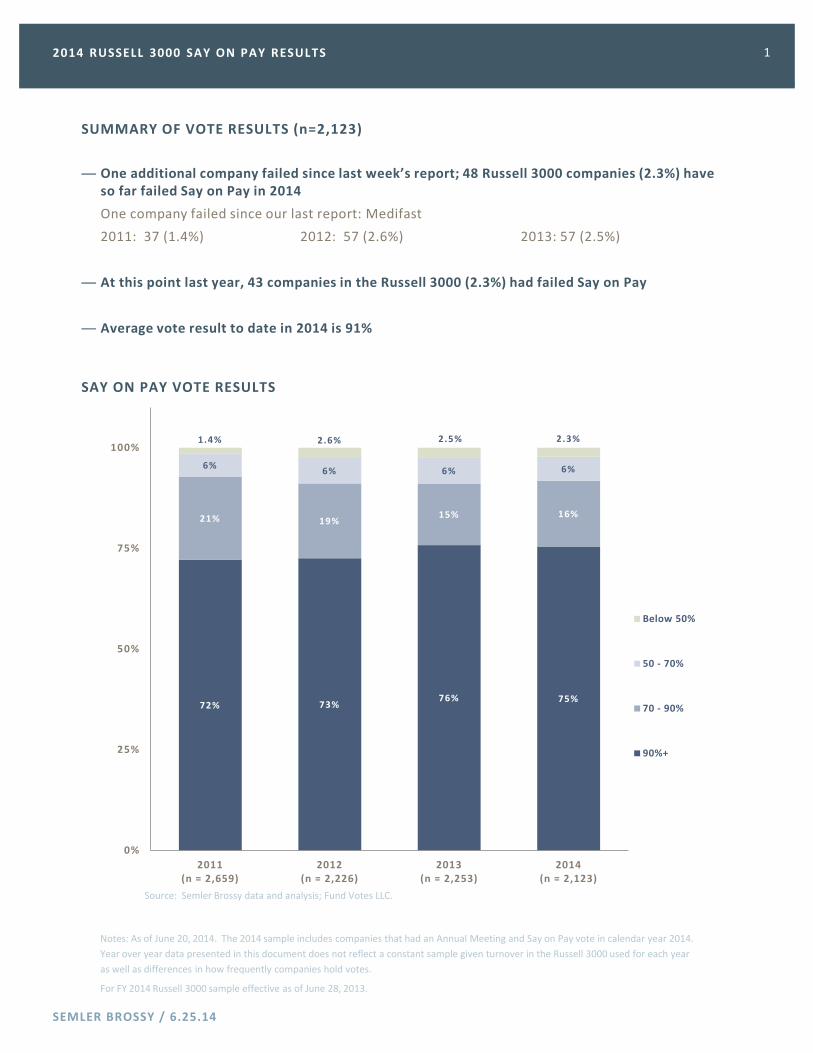
VOTE OF THE WEEK: ABERCROMBIE & FITCH
Abercrombie & Fitch (ANF) received 96% vote support in 2014 after receiving 20% support in 2013. Despite stock price underperformance, the Company’s increased year-over-year support is likely due to:
– A new employment agreement with CEO Michael Jeffries
– Redesign of annual and long-term incentive plans
– Increased use of performance-based equity with multi-year performance conditions
COMPANY INFORMATION, PERFORMANCE, AND CONTEXT
‒ Abercrombie & Fitch operates apparel and personal care stores
‒ One-, three-, and five-year TSR as of fiscal year end 2013 were -29%, -8%, and 17%, respectively
‒ In fiscal 2013, revenue decreased 9%, net income decreased 77%, and Abercrombie & Fitch was removed from the S&P 500
RESPONSE TO PRIOR SAY ON PAY RESULTS
‒ Following two years of failed Say on Pay votes, the Company engaged with stockholders representing 60% of voting shares
‒ In December 2013, the CEO entered into a new employment agreement with the Company; the new agreement addressed points of major shareholder criticism in the prior 2008 agreement by:
o Eliminating the formulaic semi-annual equity grants valued at 2.5% of total shareholder return (the mechanics of this plan were responsible for $43MM of options grants during fiscal 2011)
o Providing no retention equity upon signing (the intrinsic value of the 2009 retention grant was $77MM as of fiscal 2012)
‒ The Company’s proxy statement lists additional governance changes made in response to shareholder feedback, including separating the roles of Chairman and CEO, declassifying the Board, and replacing all Compensation Committee members who served during the negotiations of the 2008 CEO employment agreement
‒ The Company also continued a multi-year redesign of incentive plans to further increase the weighting of performance-based pay
CHANGES TO INCENTIVE PLANS
‒ Annual Incentives:
o Prior to fiscal 2013, the annual cash incentives were earned based on operating income measured over two, six-month performance periods; the cumulative performance target for 2012 was lowered 5% from the 2011 target
o For fiscal 2013, annual cash incentives were based on one twelve-month performance period; the cumulative operating income target was raised 4% over the prior year
‒ Long-Term Incentives:
o In fiscal 2012 and 2013, the CEO’s long-term incentive compensation was defined by the terms of the employment agreement; no semi-annual grants were earned in these years due to TSR performance below threshold
o Performance share awards (PSAs) granted to other executives in fiscal 2013 were based on one-year growth of adjusted diluted EPS with vesting contingent upon achieving a positive adjusted net income in fiscal 2014 and 2015
o For fiscal 2014, the PSAs granted to the CEO and other officers are subject to three-year goals: 1/3 relative TSR (with target set at the 60th percentile of comparator index), 1/3 Return on Equity, and 1/3 EBIT Margin Improvement
o PSA grants to the CEO are further subject to forfeiture if absolute TSR is negative over the three-year performance period
ISS PROPOSAL EXCERPT
‒ “A vote FOR this proposal is warranted. Following several years of low say-on-pay vote support, the company's shareholder engagement has resulted in substantive changes to the incentive program; more importantly, addressing focal issues that have been raised over the years.”
Source: Semler Brossy data and analysis; Fund Votes LLC; ISS Voting Analytics; FactSet; Abercrombie & Fitch DEF14A.
1 As disclosed in the Summary Compensation Table; 2 Financials as of the four most recently disclosed fiscal year ends (i.e., FYE2013, FYE2012, FYE2011 and FYE2010).
FY2013 FY2012 FY2011 FY2010
OUTCOME 96% 20% 25% 56%
CEO PAY 1 $2.2MM $8.2MM $48.1MM $23.2MM
1-YR TSR 2 -29% 10% -1% 56%
3-YR TSR -8% 19% 41% -15%
REVENUE $4.1B $4.5B $4.2B $3.5B
MARKET VALUE
$2.7B $4.0B $4.0B $4.2B
SEMLER BROSSY / 6.25.14
2014 RUSSELL 3000 SAY ON PAY RESULTS 3
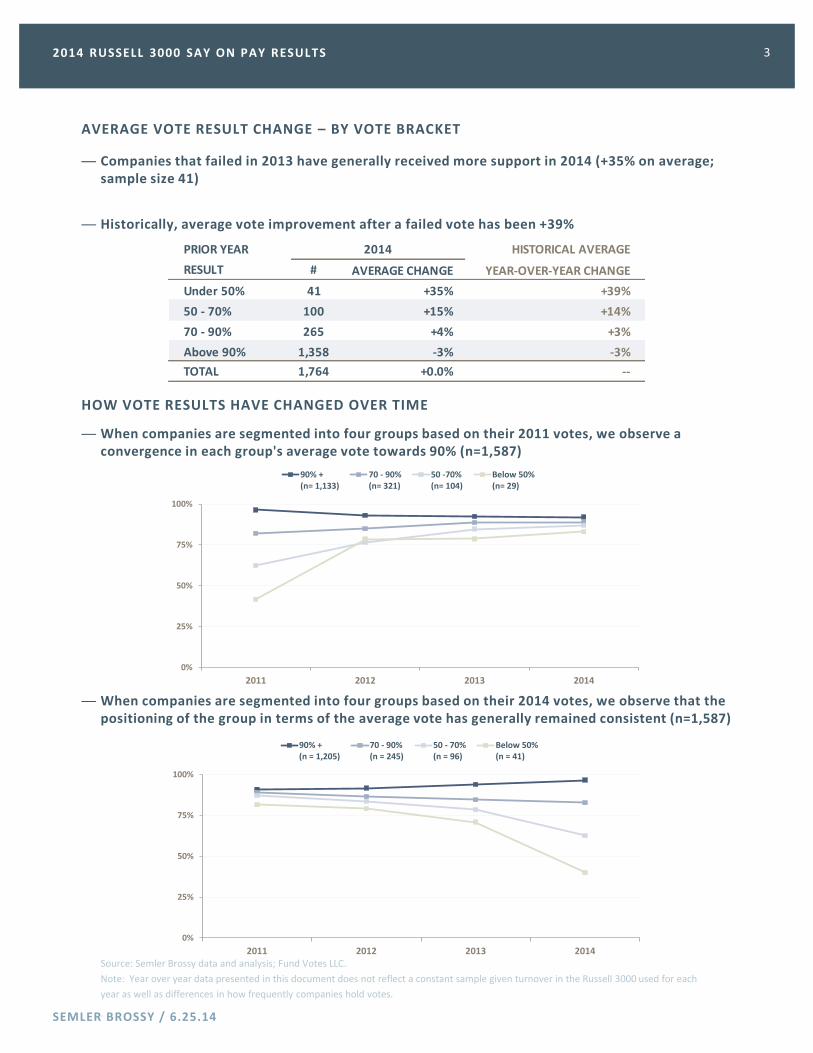
AVERAGE VOTE RESULT CHANGE – BY VOTE BRACKET
HOW VOTE RESULTS HAVE CHANGED OVER TIME
— When companies are segmented into four groups based on their 2011 votes, we observe a convergence in each group's average vote towards 90% (n=1,587)
— Companies that failed in 2013 have generally received more support in 2014 (+35% on average; sample size 41)
— Historically, average vote improvement after a failed vote has been +39%
— When companies are segmented into four groups based on their 2014 votes, we observe that the positioning of the group in terms of the average vote has generally remained consistent (n=1,587)
Source: Semler Brossy data and analysis; Fund Votes LLC.
Note: Year over year data presented in this document does not reflect a constant sample given turnover in the Russell 3000 used for each
year as well as differences in how frequently companies hold votes.
.
PRIOR YEAR 2014 HISTORICAL AVERAGE
RESULT # AVERAGE CHANGE YEAR-OVER-YEAR CHANGE
Under 50% 41 +35% +39%
50 - 70% 100 +15% +14%
70 - 90% 265 +4% +3%
Above 90% 1,358 -3% -3%
TOTAL 1,764 +0.0% --
0%
25%
50%
75%
100%
2011 2012 2013 2014
90% +(n= 1,133)
70 - 90%(n= 321)
50 -70%(n= 104)
Below 50%(n= 29)
0%
25%
50%
75%
100%
2011 2012 2013 2014
90% +(n = 1,205)
70 - 90%(n = 245)
50 - 70%(n = 96)
Below 50%(n = 41)
SEMLER BROSSY / 6.25.14
2014 RUSSELL 3000 SAY ON PAY RESULTS 4
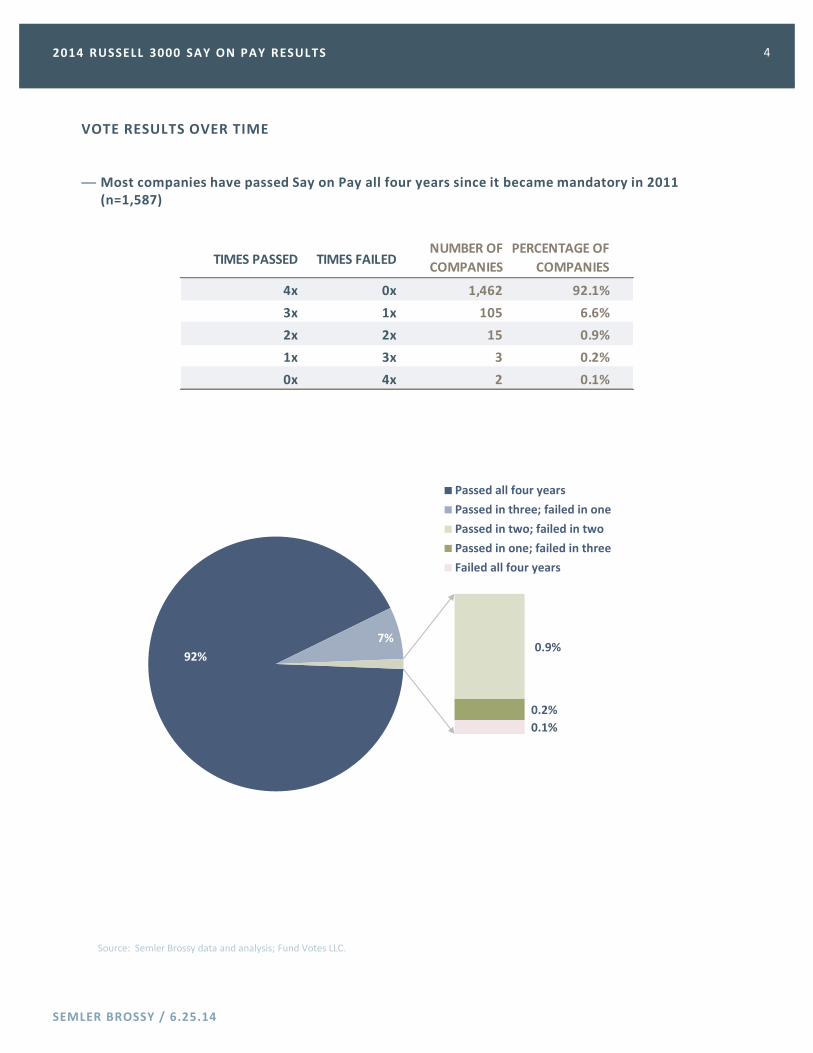
VOTE RESULTS OVER TIME
— Most companies have passed Say on Pay all four years since it became mandatory in 2011 (n=1,587)
Source: Semler Brossy data and analysis; Fund Votes LLC.
TIMES PASSED TIMES FAILEDNUMBER OF
COMPANIES
PERCENTAGE OF
COMPANIES
4x 0x 1,462 92.1%
3x 1x 105 6.6%
2x 2x 15 0.9%
1x 3x 3 0.2%
0x 4x 2 0.1%
92%
7%0.9%
0.2%
0.1%
Passed all four years
Passed in three; failed in one
Passed in two; failed in two
Passed in one; failed in three
Failed all four years
SEMLER BROSSY / 6.25.14
2014 RUSSELL 3000 SAY ON PAY RESULTS 5
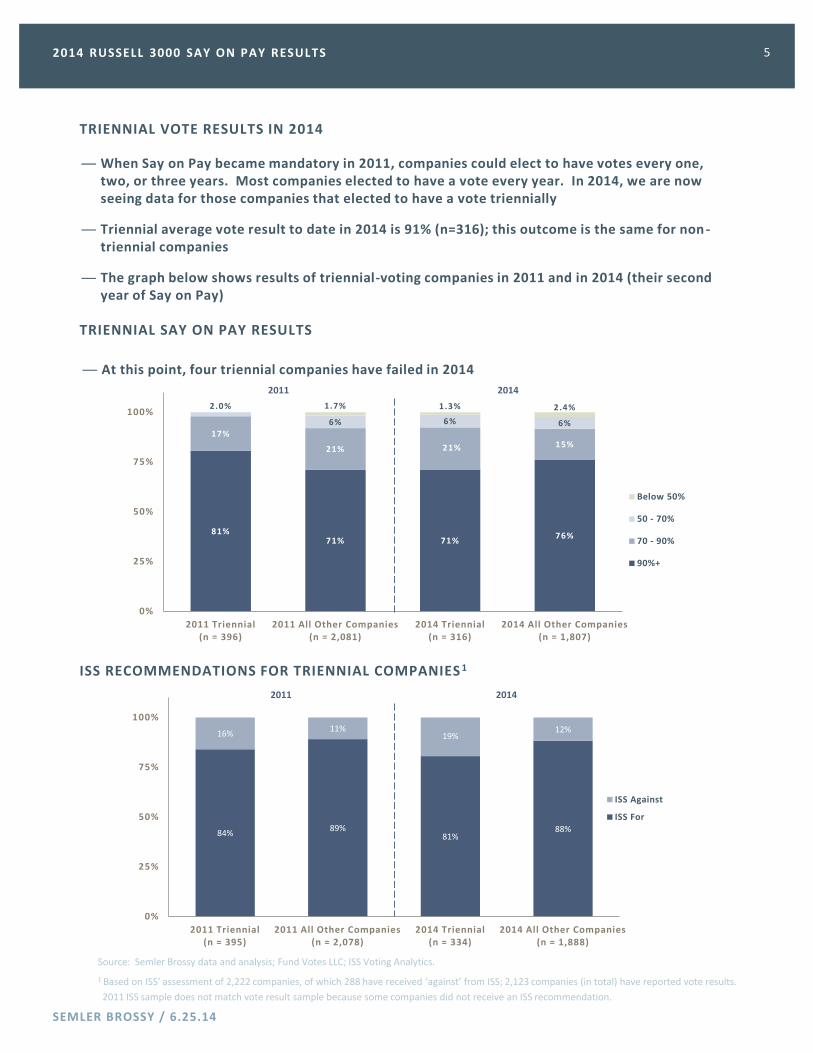
TRIENNIAL VOTE RESULTS IN 2014
ISS RECOMMENDATIONS FOR TRIENNIAL COMPANIES 1
TRIENNIAL SAY ON PAY RESULTS
— When Say on Pay became mandatory in 2011, companies could elect to have votes every one, two, or three years. Most companies elected to have a vote every year. In 2014, we are now seeing data for those companies that elected to have a vote triennially
— Triennial average vote result to date in 2014 is 91% (n=316); this outcome is the same for non-triennial companies
— The graph below shows results of triennial-voting companies in 2011 and in 2014 (their second year of Say on Pay)
— At this point, four triennial companies have failed in 2014
Source: Semler Brossy data and analysis; Fund Votes LLC; ISS Voting Analytics.
1 Based on ISS’ assessment of 2,222 companies, of which 288 have received ‘against’ from ISS; 2,123 companies (in total) have reported vote results.
2011 ISS sample does not match vote result sample because some companies did not receive an ISS recommendation.
81%71% 71%
76%
17%
21% 21% 15%
2.0%
6% 6% 6%
1.7% 1.3% 2.4%
0%
25%
50%
75%
100%
2011 Triennial(n = 396)
2011 All Other Companies(n = 2,081)
2014 Triennial(n = 316)
2014 All Other Companies (n = 1,807)
Below 50%
50 - 70%
70 - 90%
90%+
2011 2014
84%89%
81%88%
16%11%
19%12%
0%
25%
50%
75%
100%
2011 Triennial (n = 395)
2011 All Other Companies(n = 2,078)
2014 Triennial (n = 334)
2014 All Other Companies(n = 1,888)
ISS Against
ISS For
2011 2014
SEMLER BROSSY / 6.25.14
2014 RUSSELL 3000 SAY ON PAY RESULTS 6
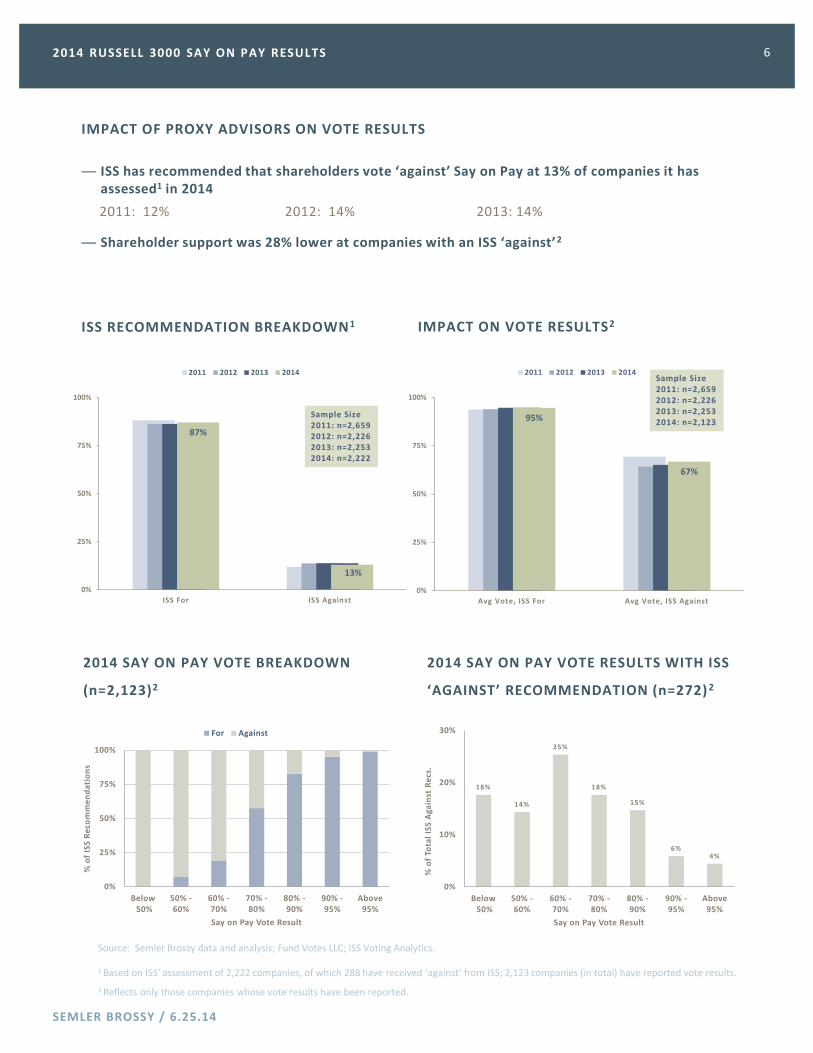
IMPACT OF PROXY ADVISORS ON VOTE RESULTS
— ISS has recommended that shareholders vote ‘against’ Say on Pay at 13% of companies it has assessed1 in 2014
2011: 12% 2012: 14% 2013: 14%
— Shareholder support was 28% lower at companies with an ISS ‘against’2
ISS RECOMMENDATION BREAKDOWN1
2014 SAY ON PAY VOTE BREAKDOWN
(n=2,123)2
2014 SAY ON PAY VOTE RESULTS WITH ISS
‘AGAINST’ RECOMMENDATION (n=272) 2
IMPACT ON VOTE RESULTS2
Source: Semler Brossy data and analysis; Fund Votes LLC; ISS Voting Analytics.
1 Based on ISS’ assessment of 2,222 companies, of which 288 have received ‘against’ from ISS; 2,123 companies (in total) have reported vote results.
2 Reflects only those companies whose vote results have been reported.
87%
13%
0%
25%
50%
75%
100%
ISS For ISS Against
2011 2012 2013 2014
Sample Size 2011: n=2,659 2012: n=2,226 2013: n=2,253 2014: n=2,222
95%
67%
0%
25%
50%
75%
100%
Avg Vote, ISS For Avg Vote, ISS Against
2011 2012 2013 2014Sample Size 2011: n=2,659 2012: n=2,226 2013: n=2,253 2014: n=2,123
0%
25%
50%
75%
100%
Below50%
50% -60%
60% -70%
70% -80%
80% -90%
90% -95%
Above 95%
% o
f IS
S R
eco
mm
en
da
tio
ns
Say on Pay Vote Result
For Against
18%
14%
25%
18%
15%
6%4%
0%
10%
20%
30%
Below50%
50% -60%
60% -70%
70% -80%
80% -90%
90% -95%
Above 95%
% o
f To
tal
ISS
Aga
inst
Re
cs.
Say on Pay Vote Result
SEMLER BROSSY / 6.25.14
2014 RUSSELL 3000 SAY ON PAY RESULTS 7
1 Includes only companies with recommendations in 2013 and 2014; also includes companies that have yet to report vote results.
Note: Year over year data presented in this document does not reflect a constant sample given turnover in the Russell 3000 used for each
year as well as differences in how frequently companies hold votes.
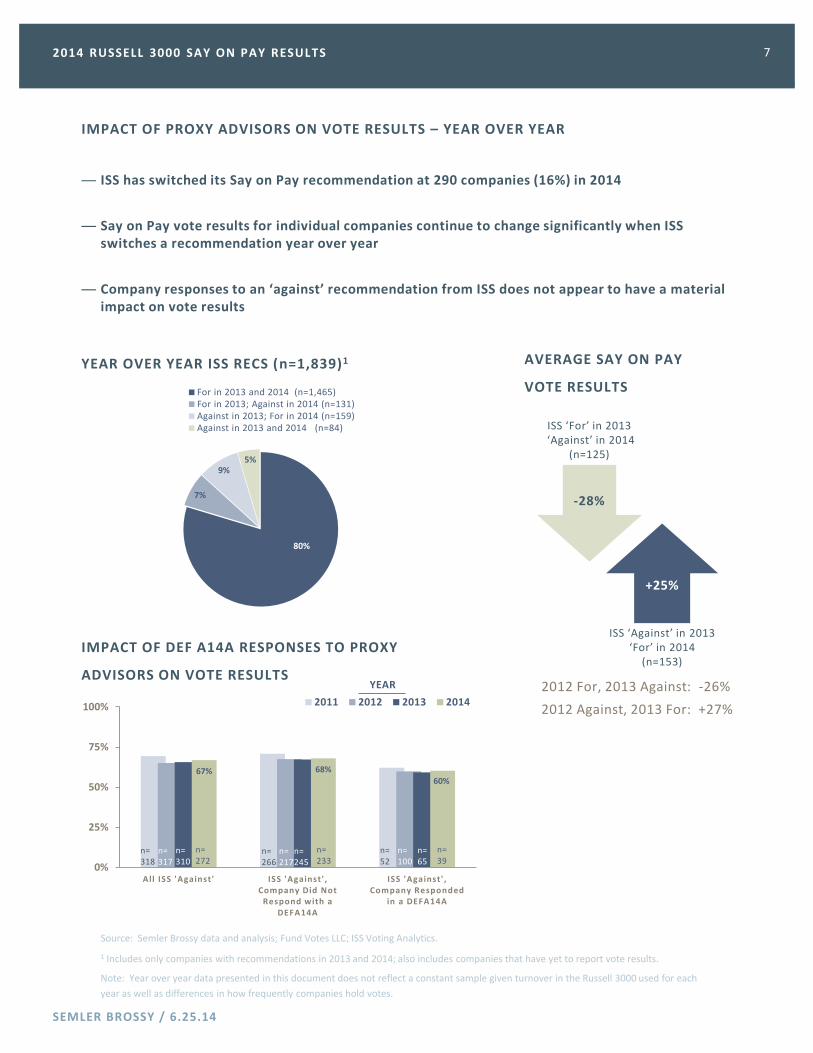
IMPACT OF PROXY ADVISORS ON VOTE RESULTS – YEAR OVER YEAR
— ISS has switched its Say on Pay recommendation at 290 companies (16%) in 2014
— Say on Pay vote results for individual companies continue to change significantly when ISS switches a recommendation year over year
— Company responses to an ‘against’ recommendation from ISS does not appear to have a material impact on vote results
IMPACT OF DEF A14A RESPONSES TO PROXY
ADVISORS ON VOTE RESULTS 2012 For, 2013 Against: -26%
2012 Against, 2013 For: +27%
-28%
+25%
ISS ‘For’ in 2013 ‘Against’ in 2014
(n=125)
ISS ‘Against’ in 2013 ‘For’ in 2014
(n=153)
Source: Semler Brossy data and analysis; Fund Votes LLC; ISS Voting Analytics.
AVERAGE SAY ON PAY
VOTE RESULTS
YEAR OVER YEAR ISS RECS (n=1,839)1
67% 68%
60%
0%
25%
50%
75%
100%
All ISS 'Against' ISS 'Against' , Company Did Not
Respond with a DEFA14A
ISS 'Against' , Company Responded
in a DEFA14A
2011 2012 2013 2014
n= 318
n= 317
n= 266
n= 217
n= 100
n= 52
n= 245
n= 65
YEAR
n= 310
n= 272
n= 233
n= 39
80%
7%
9%5%
For in 2013 and 2014 (n=1,465)For in 2013; Against in 2014 (n=131)Against in 2013; For in 2014 (n=159)Against in 2013 and 2014 (n=84)
SEMLER BROSSY / 6.25.14
2014 RUSSELL 3000 SAY ON PAY RESULTS 8
Source: Semler Brossy data and analysis; Fund Votes LLC; ISS Voting Analytics.
Note: Year over year data presented in this document does not reflect a constant sample given turnover in the Russell 3000 used for each year as well as
differences in how frequently companies hold votes.
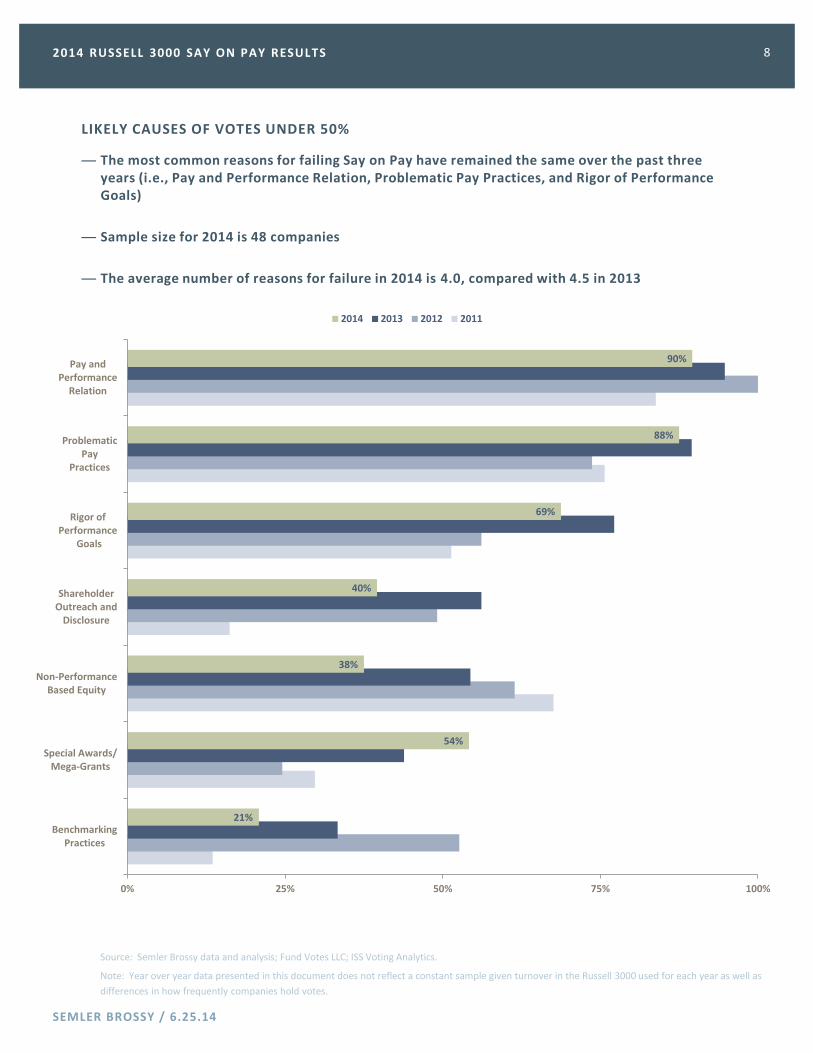
LIKELY CAUSES OF VOTES UNDER 50%
— The most common reasons for failing Say on Pay have remained the same over the past three years (i.e., Pay and Performance Relation, Problematic Pay Practices, and Rigor of Performance Goals)
— Sample size for 2014 is 48 companies
— The average number of reasons for failure in 2014 is 4.0, compared with 4.5 in 2013
21%
54%
38%
40%
69%
88%
90%
BenchmarkingPractices
Special Awards/Mega-Grants
Non-PerformanceBased Equity
ShareholderOutreach and
Disclosure
Rigor ofPerformance
Goals
ProblematicPay
Practices
Pay andPerformance
Relation
0% 25% 50% 75% 100%
2014 2013 2012 2011
SEMLER BROSSY / 6.25.14
2014 RUSSELL 3000 SAY ON PAY RESULTS 9
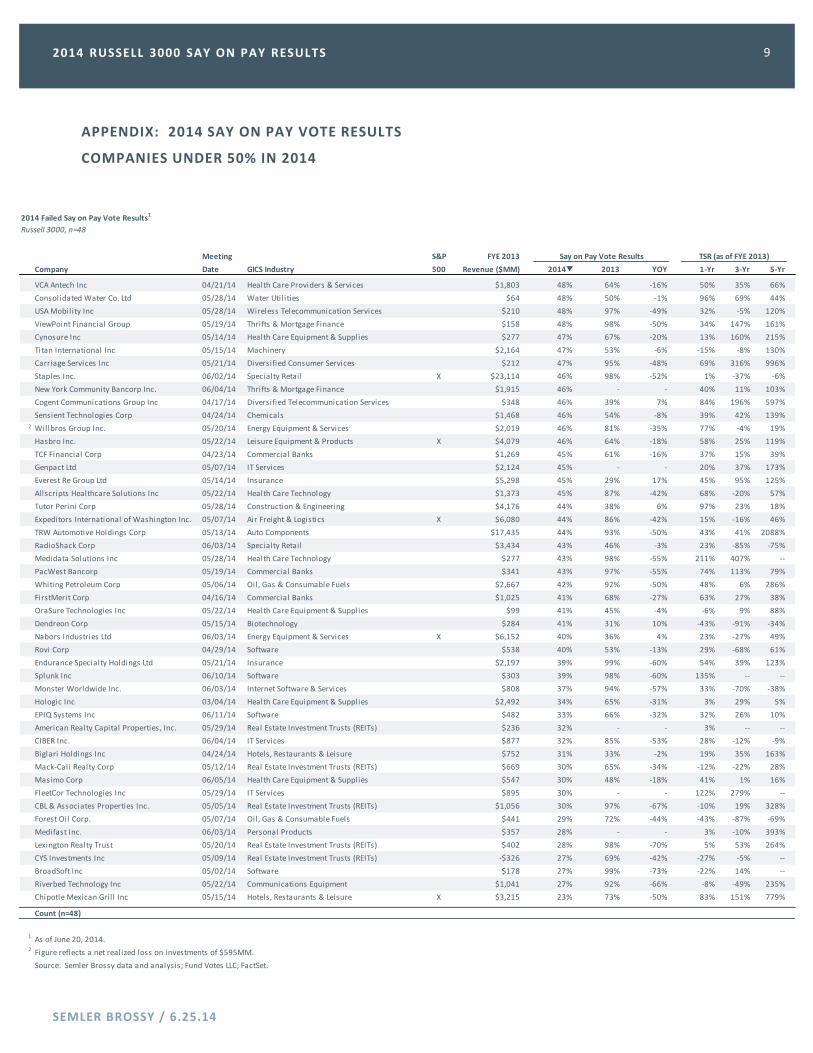
APPENDIX: 2014 SAY ON PAY VOTE RESULTS
COMPANIES UNDER 50% IN 2014
2014 Failed Say on Pay Vote Results1
Russell 3000, n=48
Meeting S&P FYE 2013 Say on Pay Vote Results TSR (as of FYE 2013)
Company Date GICS Industry 500 Revenue ($MM) 2014 2013 YOY 1-Yr 3-Yr 5-Yr
VCA Antech Inc 04/21/14 Health Care Providers & Services $1,803 48% 64% -16% 50% 35% 66%
Consolidated Water Co. Ltd 05/28/14 Water Util ities $64 48% 50% -1% 96% 69% 44%
USA Mobility Inc 05/28/14 Wireless Telecommunication Services $210 48% 97% -49% 32% -5% 120%
ViewPoint Financial Group 05/19/14 Thrifts & Mortgage Finance $158 48% 98% -50% 34% 147% 161%
Cynosure Inc 05/14/14 Health Care Equipment & Supplies $277 47% 67% -20% 13% 160% 215%
Titan International Inc 05/15/14 Machinery $2,164 47% 53% -6% -15% -8% 130%
Carriage Services Inc 05/21/14 Diversified Consumer Services $212 47% 95% -48% 69% 316% 996%
Staples Inc. 06/02/14 Specialty Retail X $23,114 46% 98% -52% 1% -37% -6%
New York Community Bancorp Inc. 06/04/14 Thrifts & Mortgage Finance $1,915 46% - - 40% 11% 103%
Cogent Communications Group Inc 04/17/14 Diversified Telecommunication Services $348 46% 39% 7% 84% 196% 597%
Sensient Technologies Corp 04/24/14 Chemicals $1,468 46% 54% -8% 39% 42% 139%2 Willbros Group Inc. 05/20/14 Energy Equipment & Services $2,019 46% 81% -35% 77% -4% 19%
Hasbro Inc. 05/22/14 Leisure Equipment & Products X $4,079 46% 64% -18% 58% 25% 119%
TCF Financial Corp 04/23/14 Commercial Banks $1,269 45% 61% -16% 37% 15% 39%
Genpact Ltd 05/07/14 IT Services $2,124 45% - - 20% 37% 173%
Everest Re Group Ltd 05/14/14 Insurance $5,298 45% 29% 17% 45% 95% 125%
Allscripts Healthcare Solutions Inc 05/22/14 Health Care Technology $1,373 45% 87% -42% 68% -20% 57%
Tutor Perini Corp 05/28/14 Construction & Engineering $4,176 44% 38% 6% 97% 23% 18%
Expeditors International of Washington Inc. 05/07/14 Air Freight & Logistics X $6,080 44% 86% -42% 15% -16% 46%
TRW Automotive Holdings Corp 05/13/14 Auto Components $17,435 44% 93% -50% 43% 41% 2088%
RadioShack Corp 06/03/14 Specialty Retail $3,434 43% 46% -3% 23% -85% -75%
Medidata Solutions Inc 05/28/14 Health Care Technology $277 43% 98% -55% 211% 407% --
PacWest Bancorp 05/19/14 Commercial Banks $341 43% 97% -55% 74% 113% 79%
Whiting Petroleum Corp 05/06/14 Oil, Gas & Consumable Fuels $2,667 42% 92% -50% 48% 6% 286%
FirstMerit Corp 04/16/14 Commercial Banks $1,025 41% 68% -27% 63% 27% 38%
OraSure Technologies Inc 05/22/14 Health Care Equipment & Supplies $99 41% 45% -4% -6% 9% 88%
Dendreon Corp 05/15/14 Biotechnology $284 41% 31% 10% -43% -91% -34%
Nabors Industries Ltd 06/03/14 Energy Equipment & Services X $6,152 40% 36% 4% 23% -27% 49%
Rovi Corp 04/29/14 Software $538 40% 53% -13% 29% -68% 61%
Endurance Specialty Holdings Ltd 05/21/14 Insurance $2,197 39% 99% -60% 54% 39% 123%
Splunk Inc 06/10/14 Software $303 39% 98% -60% 135% -- --
Monster Worldwide Inc. 06/03/14 Internet Software & Services $808 37% 94% -57% 33% -70% -38%
Hologic Inc 03/04/14 Health Care Equipment & Supplies $2,492 34% 65% -31% 3% 29% 5%
EPIQ Systems Inc 06/11/14 Software $482 33% 66% -32% 32% 26% 10%
American Realty Capital Properties, Inc. 05/29/14 Real Estate Investment Trusts (REITs) $236 32% - - 3% -- --
CIBER Inc. 06/04/14 IT Services $877 32% 85% -53% 28% -12% -9%
Biglari Holdings Inc 04/24/14 Hotels, Restaurants & Leisure $752 31% 33% -2% 19% 35% 163%
Mack-Cali Realty Corp 05/12/14 Real Estate Investment Trusts (REITs) $669 30% 65% -34% -12% -22% 28%
Masimo Corp 06/05/14 Health Care Equipment & Supplies $547 30% 48% -18% 41% 1% 16%
FleetCor Technologies Inc 05/29/14 IT Services $895 30% - - 122% 279% --
CBL & Associates Properties Inc. 05/05/14 Real Estate Investment Trusts (REITs) $1,056 30% 97% -67% -10% 19% 328%
Forest Oil Corp. 05/07/14 Oil, Gas & Consumable Fuels $441 29% 72% -44% -43% -87% -69%
Medifast Inc. 06/03/14 Personal Products $357 28% - - 3% -10% 393%
Lexington Realty Trust 05/20/14 Real Estate Investment Trusts (REITs) $402 28% 98% -70% 5% 53% 264%
CYS Investments Inc 05/09/14 Real Estate Investment Trusts (REITs) -$326 27% 69% -42% -27% -5% --
BroadSoft Inc 05/02/14 Software $178 27% 99% -73% -22% 14% --
Riverbed Technology Inc 05/22/14 Communications Equipment $1,041 27% 92% -66% -8% -49% 235%
Chipotle Mexican Gril l Inc 05/15/14 Hotels, Restaurants & Leisure X $3,215 23% 73% -50% 83% 151% 779%
Count (n=48)
1 As of June 20, 2014.2 Figure reflects a net realized loss on investments of $595MM.
Source: Semler Brossy data and analysis; Fund Votes LLC; FactSet.
SEMLER BROSSY / 6.25.14
2014 RUSSELL 3000 SAY ON PAY RESULTS 10
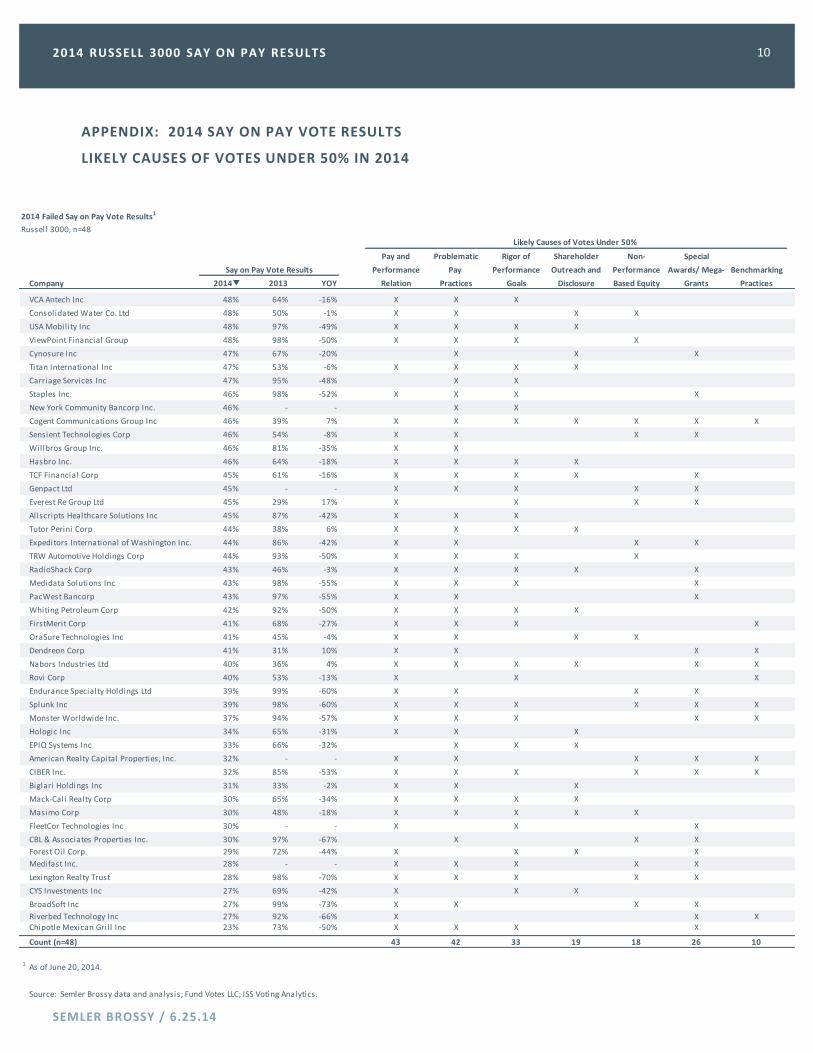
APPENDIX: 2014 SAY ON PAY VOTE RESULTS
LIKELY CAUSES OF VOTES UNDER 50% IN 2014
2014 Failed Say on Pay Vote Results1
Russell 3000, n=48
Likely Causes of Votes Under 50%
Pay and Problematic Rigor of Shareholder Non- Special
Performance Pay Performance Outreach and Performance Awards/ Mega- Benchmarking
Company 2014 2013 YOY Relation Practices Goals Disclosure Based Equity Grants Practices
VCA Antech Inc 48% 64% -16% X X X
Consolidated Water Co. Ltd 48% 50% -1% X X X X
USA Mobility Inc 48% 97% -49% X X X X
ViewPoint Financial Group 48% 98% -50% X X X X
Cynosure Inc 47% 67% -20% X X X
Titan International Inc 47% 53% -6% X X X X
Carriage Services Inc 47% 95% -48% X X
Staples Inc. 46% 98% -52% X X X X
New York Community Bancorp Inc. 46% - - X X
Cogent Communications Group Inc 46% 39% 7% X X X X X X X
Sensient Technologies Corp 46% 54% -8% X X X X
Willbros Group Inc. 46% 81% -35% X X
Hasbro Inc. 46% 64% -18% X X X X
TCF Financial Corp 45% 61% -16% X X X X X
Genpact Ltd 45% - - X X X X X
Everest Re Group Ltd 45% 29% 17% X X X X
Allscripts Healthcare Solutions Inc 45% 87% -42% X X X
Tutor Perini Corp 44% 38% 6% X X X X
Expeditors International of Washington Inc. 44% 86% -42% X X X X
TRW Automotive Holdings Corp 44% 93% -50% X X X X
RadioShack Corp 43% 46% -3% X X X X X
Medidata Solutions Inc 43% 98% -55% X X X X
PacWest Bancorp 43% 97% -55% X X X
Whiting Petroleum Corp 42% 92% -50% X X X X
FirstMerit Corp 41% 68% -27% X X X X
OraSure Technologies Inc 41% 45% -4% X X X X
Dendreon Corp 41% 31% 10% X X X X
Nabors Industries Ltd 40% 36% 4% X X X X X X
Rovi Corp 40% 53% -13% X X X
Endurance Specialty Holdings Ltd 39% 99% -60% X X X X
Splunk Inc 39% 98% -60% X X X X X X
Monster Worldwide Inc. 37% 94% -57% X X X X X
Hologic Inc 34% 65% -31% X X X
EPIQ Systems Inc 33% 66% -32% X X X
American Realty Capital Properties, Inc. 32% - - X X X X X
CIBER Inc. 32% 85% -53% X X X X X X
Biglari Holdings Inc 31% 33% -2% X X X
Mack-Cali Realty Corp 30% 65% -34% X X X X
Masimo Corp 30% 48% -18% X X X X X
FleetCor Technologies Inc 30% - - X X X
CBL & Associates Properties Inc. 30% 97% -67% X X X
Forest Oil Corp. 29% 72% -44% X X X X
Medifast Inc. 28% - - X X X X X
Lexington Realty Trust 28% 98% -70% X X X X X
CYS Investments Inc 27% 69% -42% X X X
BroadSoft Inc 27% 99% -73% X X X X
Riverbed Technology Inc 27% 92% -66% X X XChipotle Mexican Gril l Inc 23% 73% -50% X X X X
Count (n=48) 43 42 33 19 18 26 10
1 As of June 20, 2014.
Source: Semler Brossy data and analysis; Fund Votes LLC; ISS Voting Analytics.
Say on Pay Vote Results
SEMLER BROSSY / 6.25.14
2014 RUSSELL 3000 SAY ON PAY RESULTS 11
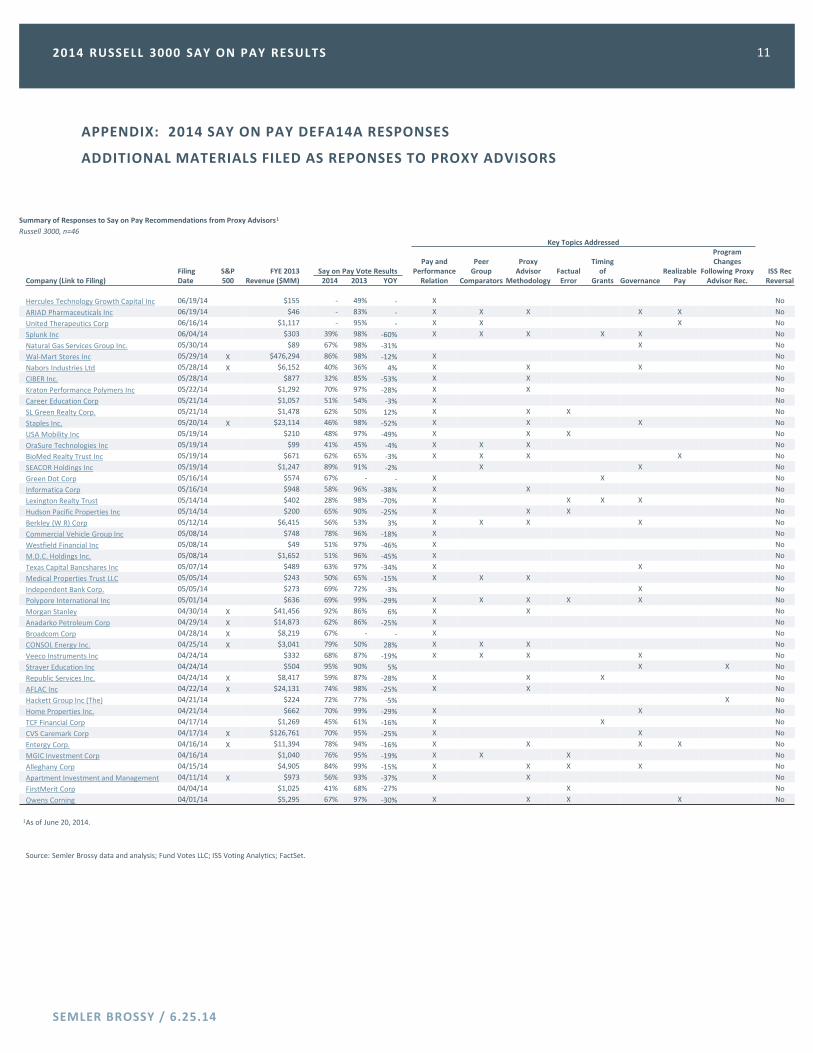
APPENDIX: 2014 SAY ON PAY DEFA14A RESPONSES
ADDITIONAL MATERIALS FILED AS REPONSES TO PROXY ADVISORS
Summary of Responses to Say on Pay Recommendations from Proxy Advisors1
Russell 3000, n=46
Key Topics Addressed
Pay and Peer Proxy Timing Program Changes
Filing S&P FYE 2013 Say on Pay Vote Results Performance Group Advisor Factual of Realizable Following Proxy ISS Rec Company (Link to Filing) Date 500 Revenue ($MM) 2014 2013 YOY Relation Comparators Methodology Error Grants Governance Pay Advisor Rec. Reversal
Hercules Technology Growth Capital Inc 06/19/14 $155 - 49% - X No
ARIAD Pharmaceuticals Inc 06/19/14 $46 - 83% - X X X X X No
United Therapeutics Corp 06/16/14 $1,117 - 95% - X X X No
Splunk Inc 06/04/14 $303 39% 98% -60% X X X X X No
Natural Gas Services Group Inc. 05/30/14 $89 67% 98% -31% X No
Wal-Mart Stores Inc 05/29/14 X $476,294 86% 98% -12% X No
Nabors Industries Ltd 05/28/14 X $6,152 40% 36% 4% X X X No
CIBER Inc. 05/28/14 $877 32% 85% -53% X X No
Kraton Performance Polymers Inc 05/22/14 $1,292 70% 97% -28% X X No
Career Education Corp 05/21/14 $1,057 51% 54% -3% X No
SL Green Realty Corp. 05/21/14 $1,478 62% 50% 12% X X X No
Staples Inc. 05/20/14 X $23,114 46% 98% -52% X X X No
USA Mobility Inc 05/19/14 $210 48% 97% -49% X X X No
OraSure Technologies Inc 05/19/14 $99 41% 45% -4% X X X No
BioMed Realty Trust Inc 05/19/14 $671 62% 65% -3% X X X X No
SEACOR Holdings Inc 05/19/14 $1,247 89% 91% -2% X X No
Green Dot Corp 05/16/14 $574 67% - - X X No
Informatica Corp 05/16/14 $948 58% 96% -38% X X No
Lexington Realty Trust 05/14/14 $402 28% 98% -70% X X X X No
Hudson Pacific Properties Inc 05/14/14 $200 65% 90% -25% X X X No
Berkley (W R) Corp 05/12/14 $6,415 56% 53% 3% X X X X No
Commercial Vehicle Group Inc 05/08/14 $748 78% 96% -18% X No
Westfield Financial Inc 05/08/14 $49 51% 97% -46% X No
M.D.C. Holdings Inc. 05/08/14 $1,652 51% 96% -45% X No
Texas Capital Bancshares Inc 05/07/14 $489 63% 97% -34% X X No
Medical Properties Trust LLC 05/05/14 $243 50% 65% -15% X X X No
Independent Bank Corp. 05/05/14 $273 69% 72% -3% X No
Polypore International Inc 05/01/14 $636 69% 99% -29% X X X X X No
Morgan Stanley 04/30/14 X $41,456 92% 86% 6% X X No
Anadarko Petroleum Corp 04/29/14 X $14,873 62% 86% -25% X No
Broadcom Corp 04/28/14 X $8,219 67% - - X No
CONSOL Energy Inc. 04/25/14 X $3,041 79% 50% 28% X X X No
Veeco Instruments Inc 04/24/14 $332 68% 87% -19% X X X X No
Strayer Education Inc 04/24/14 $504 95% 90% 5% X X No
Republic Services Inc. 04/24/14 X $8,417 59% 87% -28% X X X No
AFLAC Inc 04/22/14 X $24,131 74% 98% -25% X X No
Hackett Group Inc (The) 04/21/14 $224 72% 77% -5% X No
Home Properties Inc. 04/21/14 $662 70% 99% -29% X X No
TCF Financial Corp 04/17/14 $1,269 45% 61% -16% X X No
CVS Caremark Corp 04/17/14 X $126,761 70% 95% -25% X X No
Entergy Corp. 04/16/14 X $11,394 78% 94% -16% X X X X No
MGIC Investment Corp 04/16/14 $1,040 76% 95% -19% X X X No
Alleghany Corp 04/15/14 $4,905 84% 99% -15% X X X X No
Apartment Investment and Management 04/11/14 X $973 56% 93% -37% X X No
FirstMerit Corp 04/04/14 $1,025 41% 68% -27% X No
Owens Corning 04/01/14 $5,295 67% 97% -30% X X X X No
1 As of June 20, 2014.
Source: Semler Brossy data and analysis; Fund Votes LLC; ISS Voting Analytics; FactSet.
SEMLER BROSSY / 6.25.14
For more information on Say On Pay results, or how to subscribe to our weekly report, please contact us at [email protected], or
310.481.0180. We also welcome you to visit our website for additional articles and thought papers on all aspects of executive compensation.
THIS REPORT CAN BE ACCESSED AT
HTTP://WWW.SEMLERBROSSY.COM/SAYONPAY
Copyright 2011-2014 Semler Brossy Consulting Group, LLC. Distributed By
Semler Brossy Consulting Group, LLC. The unauthorized disclosure, use,
or dissemination of this report or any of its contents is prohibited. WWW.SEMLERBROSSY .COM
2014 RUSSELL 3000 SAY ON PAY RESULTS 12
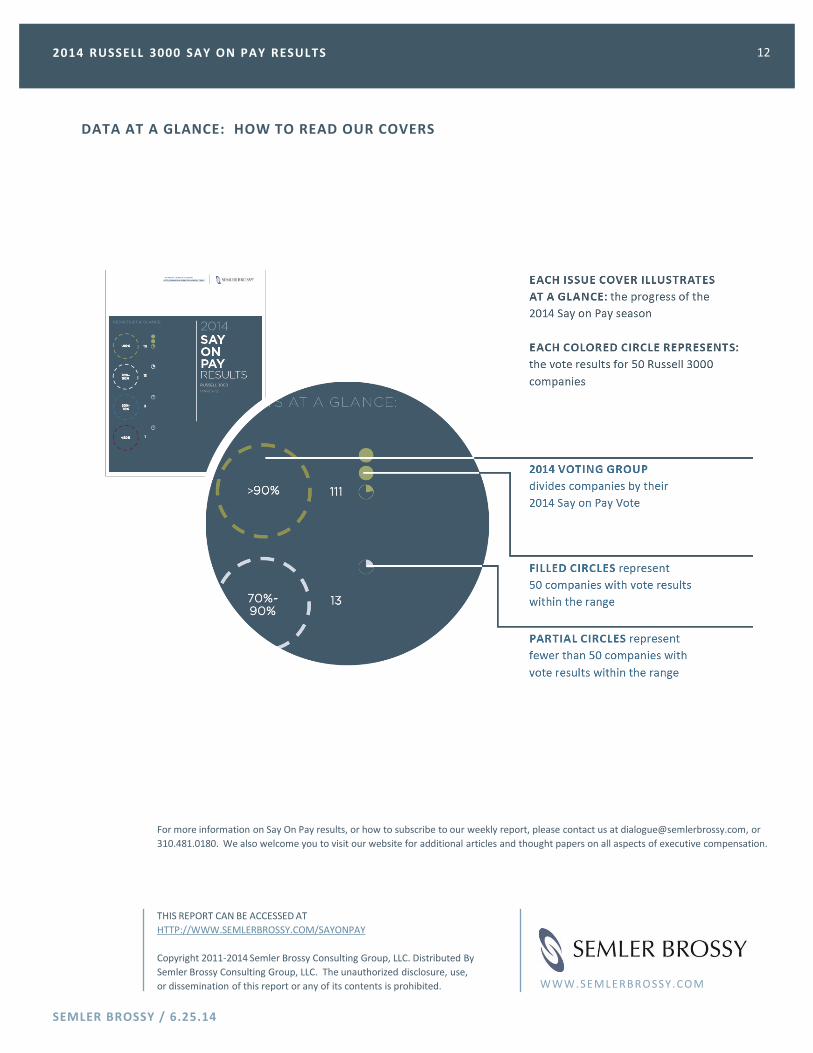
DATA AT A GLANCE: HOW TO READ OUR COVERS