Embed Size (px)
Citation preview
8/7/2019 SAW-1-Anal Chem
http://slidepdf.com/reader/full/saw-1-anal-chem 1/7
1458 ANALYT I CA L CHEMISTRY, VOL. 51, NO. 9 , AUGUST 1 9 7 9
Table IV .Homogenate at Higher Mass Resolution
T C D D Determination in Control Trout
T C D D , a ppt
sample a d d e d f o u n d recovery, %
A 10 1 1 110
B 10 1 2 120C 10 7 7 0
Mean 100
rel. sta nd. dev., % 21
__
a Results obtained at resolution 1000 o n A EI MS-30.
Results have been corrected for internal standard recovery.
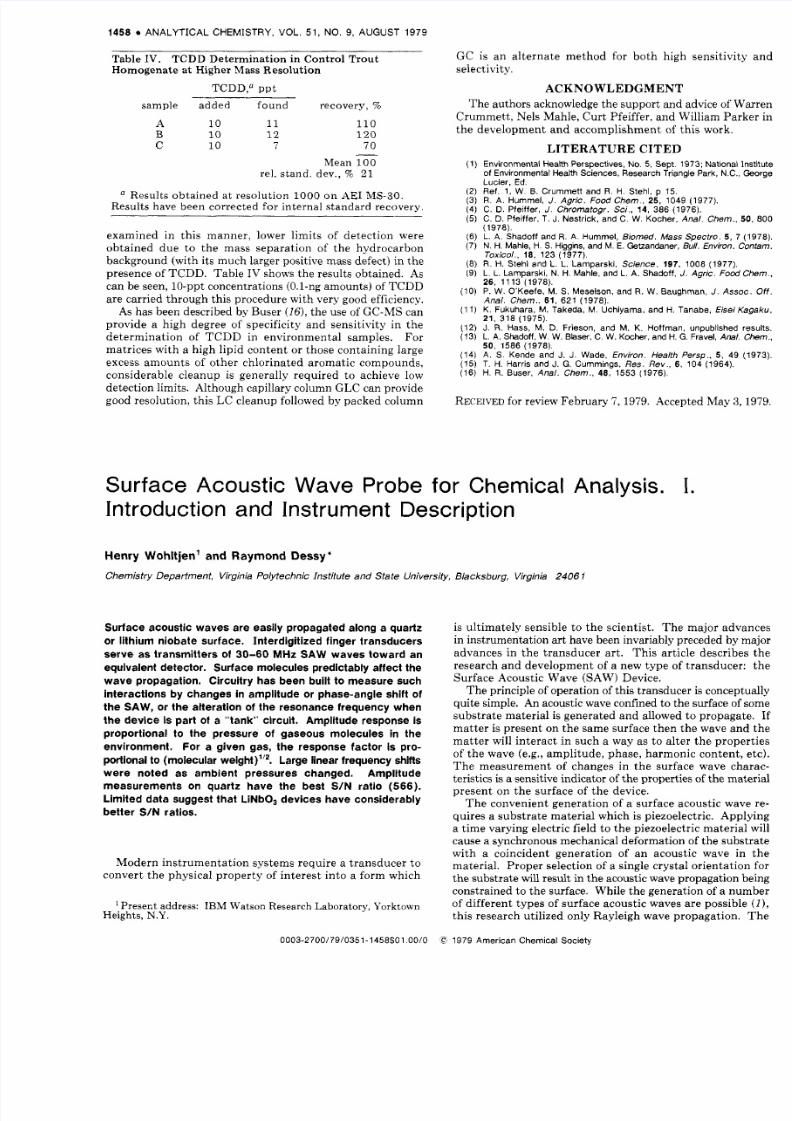
examined in this manner, lower limits of detection wereobtained due to the mass separat ion of the hydrocarbonbackground (with its much larger positive mass defect) in thepresence of TCDD. Table IV shows the results obtained. Ascan be seen , 10-p pt concentrations (0.1-ng amo unts) of T CD Dare carried through this procedure with very good efficiency.
As has been described by Buser (161, he use of GC-M S canprovide a high degree of specificity and sensitivity in thedeterminat ion of TCD D in environmental samples. Formatric es with a high lipid co nten t or those containing large
excess amo unts of other chlorinated aromatic compo unds,considerable cleanup is generally required to achieve lowdetec tion limits. Although capillary column GLC can providegood resolutio n, this LC cle anup followed by packed column
GC is an al ternate method for both high sensi t ivi ty andselectivity.
ACKNOWLEDGMENT
Th e au thors acknowledge the support a nd advice of WarrenCrum mett, Nels Mahle, Cur t Pfeiffer, and W illiam P arker inthe development an d accomplishmen t of th is work.
LITERATURE CITED
(1 ) Environmental Health Perspectives,No. 5, Sept. 1973; National Instituteof Environmental Health Sciences,Research Triangle Park, N.C., George
Lucier, Ed.( 2 ) Ref. 1, W . 6. rummett an d R. H. Stehl, p 15 .(3 ) R. A . Hummel, J . Agric. Food Chem., 25 , 1049 (1977).(4 ) C. D. Pfeiffer, J . Chromatogr. Sci., 1 4 , 386 (1976).(5 ) C. D. Pfeiffer. T. J. Nestrick, an d C. W . Kocher, Anal. Chem., 50, 80 0
(1978).(6 ) L. A . Shadoff an d R. A . Hummel, Biomed. Mass Specfro. 5 , 7 1978).(7 ) N. H. Mahle, H. S. Higgins, and M . E. Getzandaner,Bull. Environ. Contam.
roxico/.. 18, 23 (1977).(8)R . H. Stehl an d L . L. Lamparski, Science. 197, 1008 (1977).(9 ) L. L. Lamparski,N . H. Mahle, an d L. A. Shadoff, J . Agric. Fow'Chem.,
26 , 1113 (1978).(10) P. W. O'Keefe,M. S. Meselson,an d R. W . Baughman, J , Assoc. Of f .
Anal. Chem. , 61, 21 (1978) .(11) K . Fukuhara, M. Takada, M . Uchiyama, an d H. Tanabe, EiseiKagaku,
21, 18 (1975).(12) J. R. Hass, M. D. Frieson, an d M. . Hoffman, unpublished results.( 13) L. A. Shadoff,W . W. Bhser, C. W. K o c h e r , and H. G. Fravel, Anal. Chem.,
50 , 1586 (1978).(14) A. S. Kende an d J. J. Wade, Environ. Health Persp.. 5. 49 (1973).(15) T. H. Harris and J. G. Cummings, Res. R ev . , 6, 04 (1964).(16) H. R. Buser, Anal. Chem. , 4 8 , 1553 (1976).
RECEIVEDor review Februa ry 7 , 1979. Accepted May 3, 1979.
Surface Acoustic Wave Probe for Chemical Analysis. I .
Introduction and Instrument Description
Henry Wohltjen' and Raymond Dessy"
Chemistry Department, Virginia Polytechnic Institute and State University, Blacksburg, Virginia 2406 7
Surfac e acoustic wav es a re easily propagated along a quartz
or lithium niobate surface. Interdigitized finger transducers
serve as transmitters of 30-60 MHz SA W waves toward an
equivalent detector. Surface molecules predictably affect the
wa ve propagation. Circuitry has been built to meas ure such
interaction s by ch anges in amp litude or p hase-an gle shift of
the S AW , or the alteration of the r esona nce frequency when
the de vice is part of a "ta nk" circuit. Amplitude response isproportional to the pressure of gaseous molecules in the
environ men t. For a given gas, the response factor is pro-
portionalto (molecular weight)"*. Large linear frequency shifts
we re noted as ambient pressures changed. Amplitude
measurements on quartz have the best S /N ratio (566).
Limited data suggest that LiNbO:, devices hav e considerably
better S/N ratios.
Modern ins trumen tat ion systems require a t ransducer toconv ert the physical property of intere st into a form which
Present address: IBM Watson Research Laboratory, YorktownHeights, N.Y.
is ul t imately sensible to the scientis t . Th e major advancesin instrumentation art have been invariably preceded by majoradvances in the t ransducer ar t . Th is article describes theresearch an d development of a new type of t ransducer: theSurface Acoustic Wave (SAW ) Device.
The principle of operation of this transducer is conceptuallyquite simple. An acoustic wave confined to the surfac e of somesubstra te material is generated a nd allowed to propagate. Ifmatter is present on the same surface then the wave and thematter will interact in such a way as to alter the propertiesof the wave (e.g. , ampli tude , phase, harmonic co ntent , etc).The measurement of changes in the surface wave charac-teristics is a sensitive indicator of the prope rties of the m aterialpresent on the surface of th e device.
Th e convenient generation of a surface acoustic wave re-quires a sub strate m aterial which is piezoelectric. Applyinga time varying electric field to the piezoelectric material willcause a synchronous mechanical deformation of the substratewith a coincident generation of an acoustic wave in thematerial. Prop er selection of a single crystal orientation forthe substratewill result in th e acoustic wave propagation beingcon straine d to the surface. While the generation of a num ber
of d ifferen t types of surface acoustic waves are possible ( I ) ,this research utilized only Rayleigh wave propagation. T he
0003-2700/79/0351-1458$01 O O /O b 1979 American Chemical Society
8/7/2019 SAW-1-Anal Chem
http://slidepdf.com/reader/full/saw-1-anal-chem 2/7
A N A L Y T I C A L C H E M I S T RY , VOL. 51 , NO. , AUGUST 1979 1459
( d S P A C E - F I X E D P A R TI C LE LO C AT IO NFOR A TYPICAL ELASTIC SOLID TH EM A T E R I A L IS UNSTRESSED.
(b . )T H E PA R T I C L E D I SPL A C EM EN T O FA N E L A ST I C SOL I D DU E T O ARAYLEIGH. OR ACOUSTIC SURFACEWA VE, I S C OMPL EX A N D F OU N DONLY NEAR SURFACE OF TH ES O L I D .
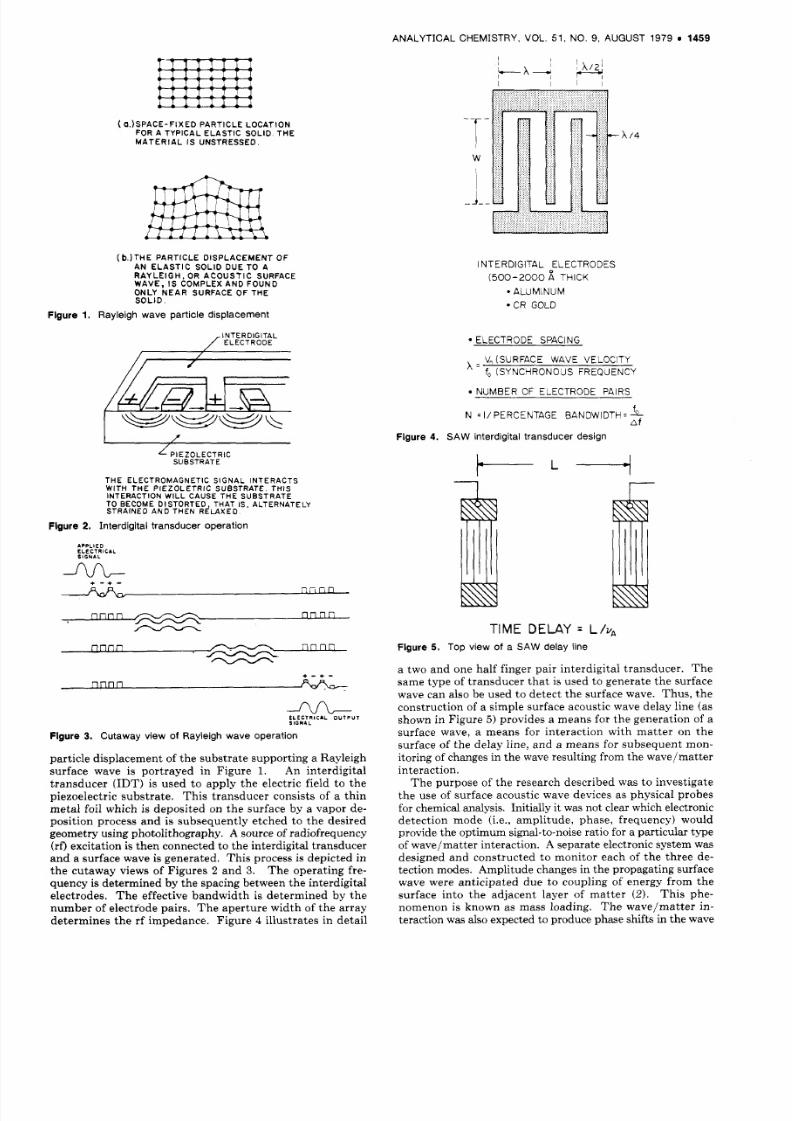
Figure 1, Rayleigh wave particle displacement
PIEZOLECTRICSUBSTRAT E
THE ELECTROMAGNETIC SIGNAL INTERACTSWITH THE PIEZOLETRIC SUBSTRATE. THISINTERACTION WILL CAUSE THE SUBSTRATETO BECOME DISTORTED T H A T I S , ALTERNATELYSTRAINED AND THEN R ~ L A X E D
Flgure 2. Interdigital transducer operation
b PPL IEDEL ECT RICALS I G N A L
A&-+ - + -
n n n n
nnnn nnnn-n n n n n n n n
+ - + -
--fvL-E L E C T R l C I L O U T P U T
S l G W L
Figure 3. Cutaway view of Rayleigh wave operation
particle displacement of th e su bstrate supporting a Rayleighsurface wave is portrayed in Figure 1. An interdigitaltransducer (IDT) is used to apply the electr ic f ie ld to thepiezoelectr ic substrate . This transducer consists of a thinmetal foil which is deposited on t he surface by a vapor de-posi tion process a nd is subsequent ly e tched to the des i redgeometry using photolithography . A source of radiofrequency(rf') excitation is then connected to th e interdigital transducerand a surface wave is generated . Th is process is depicted inth e cutaway views of Figures 2 an d 3. The operating fre-quency is determined by the spacing between the interdigitalelectrodes. Th e effective band wid th is determ ined by the
num ber of electrode pairs. T he ape rture width of the a r rayde te r m ines th e rf impedance. Figure 4 i l lustrates in d etail
- TW
i NTERDlGlTAL ELECTRODES
(500-2000 THICK
ALUMINUM
CR GOLD
x / 4
ELECTRODE SPACING
V (SURFACE WAVE VELOCITY= fo (SYNCHRONOUS FREQUENCY
NUMBER OF ELECTRODE PAIRS
N = I / PERCENTAGE BANDWIDTHof
Figure 4. S A W interdigital transducer design
1 ITIME DELAY = L/vA
Figure 5 . T o p view of a S A W delay line
a two and one half f inger pair interdigital trans duce r . Th esame type of transducer t ha t is used to generate the surfacewave can also be used to det ect the surface wave. Th us, theconstruction of a simple surface acoustic wave delay line (as
shown in Figure 5 ) provides a means for the generatio n of asurface wave, a means for interaction with matter on thesurface of the delay line, and a means for sub sequ ent mon-itoring of changes in th e wave resulting from the wave /matterinteraction.
T he purpose of the research described was to investigateth e use of surface acoustic wave devices as physical prob esfor chemical analysis. Initially it was not clear which electronicdetection mode (Le. , amplitude, phase, f requency) wouldprovide the optimum signal-to-noise ratio for a particular typeof wav e/matter interaction. A separate electronic system wasdesigned and constructed t o monitor each of the three de-tection modes. Amp litude changes in the propagating surfacewave were anticipated due to coupling of energy from thesurface into the adjacent layer of matter (2). This phe-
nomenon is known as mass loading. T he wave/m atter in-teraction was also expected to produce phas e shifts in the wave
8/7/2019 SAW-1-Anal Chem
http://slidepdf.com/reader/full/saw-1-anal-chem 3/7
1460 ANALYTICAL CHEMISTRY, VOL. 51, NO. 9 , AUGUST 1979
bC O 7 5 * r - c 7 5 +-1 C O 6 2 5
EN D V'EW
. . . ~ ~ - ~ ~... ~ ~~~~.. .
Cbfil RIDGE *EATER u7 c7
.... ~ ..... ~ ~ ........
CSVER TO P V E W
rl1 I O " AL L PIECES M A C H l N E D F R O M
3' 6 STAIN-ESS STEEL STOCK2 0 " ~~ ~~ - - -...
-1 -
~ 2 5 " - -~ ~ cf
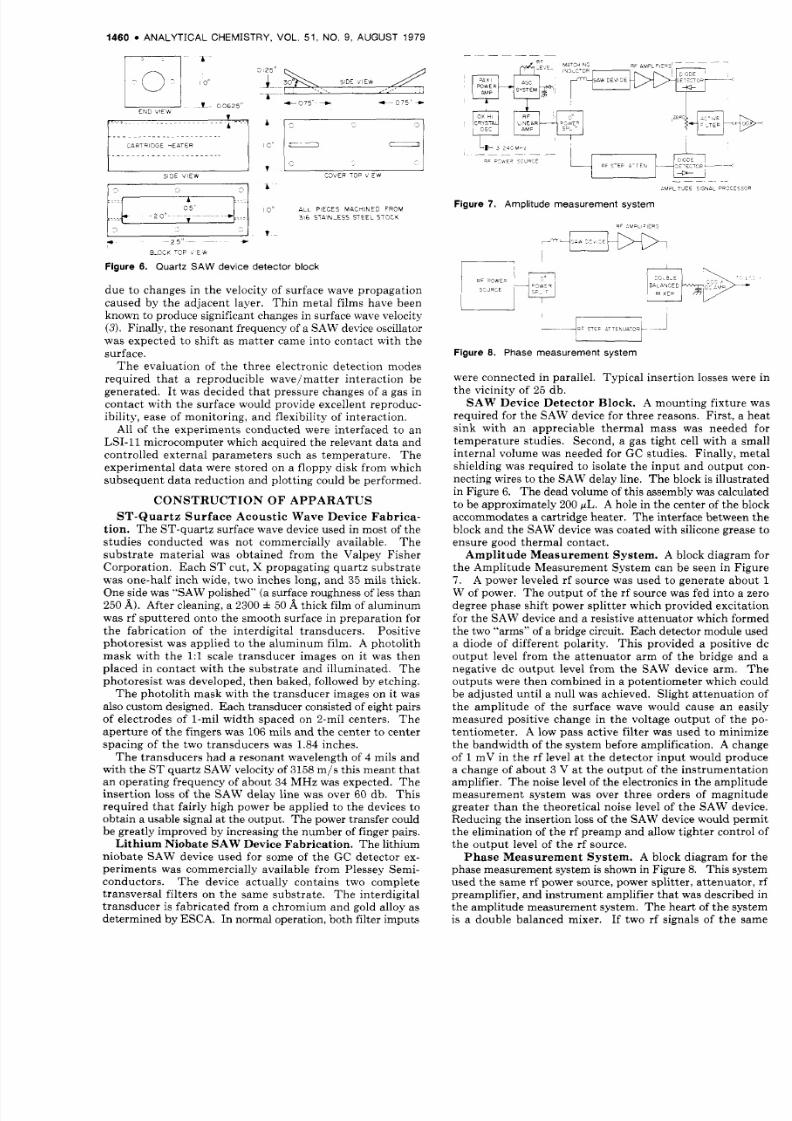
Figure 6. Quartz SAW device de tec tor block
du e to change s in the velocity of surface wave propagationcaused by the adjacent layer. Th in metal f i lms have beenknown to produce significant changes in surface wave velocity(3). Finally, the reso nant frequency of a SAW device oscillatorwas expected to shift as matter came into contact with thesurface.
The evaluat ion of the three electronic detect ion modesrequired that a reproducible wave/matter interact ion begene rated. I t was decided th at pressure changes of a gas incontact with the surface would provide excellent reproduc-ibility, ease of mo nito ring , an d flexibility of inter act ion.
All of the experiments conducted were interfaced to anLSI-11 microcomputer which acquired the relevant da ta andcontrolled external parameters such as temperature. Th eexpe rimen tal da ta were stored on a floppy disk from whichsubsequent data reduction and plotting could be performed.
C O N S T R U C T IO N O F A P P A R A T U S
S T - Q u a r t z S u r f a c e A c o us t ic W a v e D e v ic e F a b r i c a -tio n. Th e ST-q uar tz surface wave device used in most of the
stud ies cond ucted was not commercially available. Th esubstrate material was obtained from the Valpey FisherCorporat ion. Each ST cut , X propagat ing quartz su bstratewas one-half inc h wide, two inches long, and 35 mils thick.One side was "SAW polished" (a surface roughness of less tha n250 A). After cleaning, a 2300 f 50 A thick film of aluminumwas rf sp ut tered onto the sm ooth surface in preparat ion forthe fabricat ion of the interdigi tal t ransducers . Posi t ivephotoresis t was appl ied to the alum inum fi lm. A photol i thmask with the 1:l scale transducer images on it was thenplaced in contact with the substrate and i l luminated. Th ephotor esist was develop ed, then bake d, followed by etching.
Th e photol i th mask with the t ransduc er images on i t wasalso custom designed. Each transducer consisted of eight pairs
of electrodes of 1-mil width spaced on 2-mil centers. Th eape rture of the fingers was 106mils and th e center to centerspacing of the two transdu cers was 1.84 inches.
Th e t ransducers had a resonant wavelength of 4 mils andwith the ST quartz SAW velocity of 3158 m/ s this meant tha tan operating frequ ency of abou t 34 MHz was expected. T heinsertion loss of th e SAW d elay line was over 60 db. Thisrequired t ha t fairly high power be appl ied to th e devices toobtain a usable signal at the outp ut. Th e power transfer couldbe greatly improved by increasing the nu mbe r of finger pairs.
L i th ium Niobate S AW Device Fabr ica tion . The li th iumniobate SAW device used for some of the GC detector ex-periments was commercially available from Plessey Semi-condu ctors. Th e device actually contains two completetransversal f il ters on the same substrate. Th e interdigi tal
t ransduc er is fabricated from a chrom ium an d gold al loy asdeter mine d by ESCA. In normal operation, both filter imp uts
B.@iK TCP L E &
- T I
1 FF WhE" ,-uS C J P C E
I
Figure 8. Phase measurement system
were connected in parallel. Typic al insertion losses were inthe vicinity of 25 db.
SA W Device Dete ctor B lock . A mount ing fix ture wasrequired for the SAW device for three reasons. First, a heats ink with an appreciable thermal mass was needed fortempe rature studies. Second , a gas tight cell with a smallinternal volume was needed for GC studies. Finally, meta lshielding was required to isolate the input and out put con-necting wires to the SAW de lay line. T he block is illustrate din Figure 6. Th e dead volume of this assembly was calculatedto be approximately 200 gL. A hole in the cen ter of the blockaccommodates a cartridge heater. Th e interface between theblock and th e SA W device was coated w ith silicone grease to
ensure good thermal contact.Am pl i tu de Mea sure me nt Sy s tem. A b lock d iagram for
the Am pli tude Measurement System can be seen in Figure7 . A power leveled rf source was used to g enera te abo ut 1
W of power. Th e outp ut of the rf source was fed into a zerodegree phase shift power splitter which provided excita tionfor the SAW device and a resistive atten uato r which forme dthe two "arms" of a bridge circuit. Eac h detector module useda diode of differen t polarity. This provided a positive dcoutput level from the at tenuator arm of the bridge and anegat ive d c outpu t level from the SAW device arm. Th eoutp uts were then combined in a potentiometer which couldbe adjusted until a null was achieved. Slight attenua tion ofthe amplitude of the surface wave would cause an easily
measured positive change in the voltage output of the po-tent iometer. A low pass a ctive filter was used to m inimizethe bandwidth of the system before amplification. A changeof 1 mV in the rf level a t the detector in put would producea change of about 3 V at the ou tpu t of the ins t rumenta t ionamplifier. Th e noise level of the electronics in the amp litud emeasurement system was over three orders of magnitudegreater than the theoretical noise level of the SAW device.Reducing the insertion loss of the SAW device would permitthe elimination of the rf p ream p an d allow tighter control ofthe output level of the rf source.
Ph as e M e as u r em en t Sy s t em . A blo ck d iag ram fo r t h ephase measurement system is shown in Figure 8. Th is systemused th e same rf power source , power splitter, atten uato r, rfpreamplifier, a nd in strum ent amplifier t ha t was described in
the amplitude measure ment system. Th e heart of the systemis a double balanced mixer. If two rf signals of the sa me
8/7/2019 SAW-1-Anal Chem
http://slidepdf.com/reader/full/saw-1-anal-chem 4/7
ANALYT I CA L CHEMISTRY, VOL. 51, NO. 9, AUGUST 19 79 1461
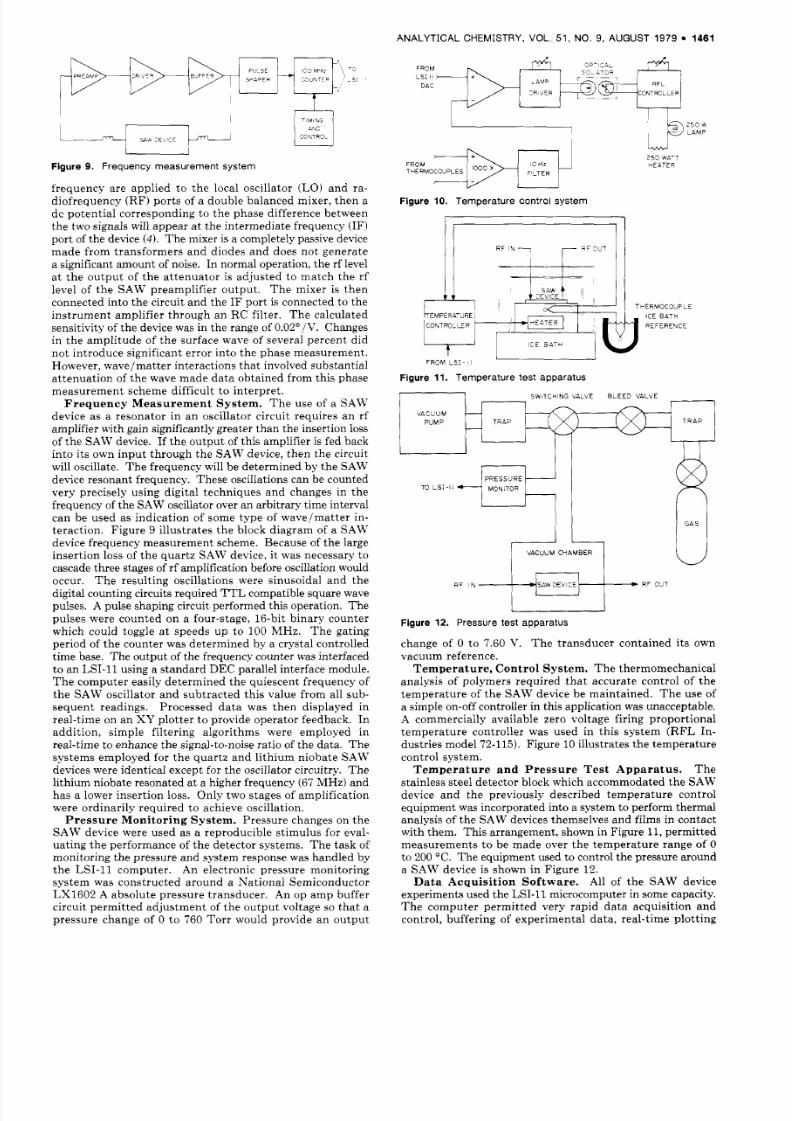
Figure 9. Frequency measurement system
frequency are applied to the local oscilla tor (LO) and ra-diofrequency (R F) ports of a do uble balanced mixer , the n adc potential corresponding to t he phase difference betweenthe two signals will app ear at the in termed iate frequency (I F)port of the device ( 4 ) . T h e mixer is a completely passive devicemade f rom t ransformers an d diodes and does not genera tea significant amo un t of noise. In norm al operation, the rf levela t the outp ut of the a t tenu a tor i s adjus ted to match the r flevel of the SAW preamplif ier outp ut. Th e mixer is then
connected into th e circuit and t he IF po rt is connected to theinstru men t amplif ier through a n RC fil ter . Th e calculatedsensitivity of the device was in the range of O . O 2 O / V . Changesin the amp litude of the surface wave of several percent d idnot in troduce signif icant error into the phase measurem ent.However, wave/m atter interactions tha t involved substantialattenuation of the wave made d ata obtained from this phasemeasurement scheme diff icult to interpret.
Frequency Measurement System. The use of a SAWdevice as a resonator in an oscillator circuit requires an rfamplifier with gain significantly greater than the insertion lossof the SA W device. If th e ou tp ut of this amplifier is fed backinto i ts own input through the SAW device, then the circuitwill oscillate. T he frequen cy will be determ ined by the SAWdevice reso nan t frequency. Th ese oscillations can be countedvery precisely using digital techniques an d changes in thefrequency of the SAW oscillator over an arbi trary time intervalcan be used as indication of some type of wave/mat te r in-teraction. Figure 9 i l lustrates the block diagram of a SAW
device frequency measurem ent scheme. Because of the largeinser tion loss of the q uar tz SAW device, it was necessary tocascade th ree stag es of rf amplification before oscillation wouldoccur. Th e resulting oscilla tions were sinusoidal an d thedigital counting circuits required T T L compatible square wavepulses. A pulse shaping circuit performed this operation. Th epulses were counted on a four-stage, 16-bit binary co unterwhich could toggle a t speeds up t o 100 M Hz . Th e ga t ingperiod of the cou nter was determi ned by a crystal controlledtim e base. Th e outp ut of the frequency counter was interfacedto an L SI-11 using a standar d DE C parallel interface module.Th e compu ter easily determined the quiescent frequency ofthe SAW oscillator an d subtracte d this value from all sub-sequent readings . Processed data was then displayed in
real- time on a n XY plott er to provide operator feedback. Inaddition, simple f i l ter ing algorithms were employed inreal-time to enhance the signal-to-noise ratio of the data . Th esys tems employed for the q uar tz and l i th ium nioba te SAWdevices were identical except for the oscillator circuitry. T helithium niobate resonated at a higher frequency (67 MH z) andhas a lower insertion loss. Only two stages of amplificatio nwere ordinarily required to achieve oscillation.
Pressure Monitoring System. Pressure changes on theSAW device were used as a reproducible stim ulus for eval-uating the performance of the detector systems. Th e task ofmonitoring th e pressure and system response was handled bythe LSI-11 compute r . An electronic pressure monitoringsys tem was const ructed a roun d a N at iona l Semiconduc torLX1602 A absolute pressure transducer . An op am p buffer
circuit permitted adju stme nt of the outp ut voltage so t ha t apressure ch ange of 0 to 760 Tor r would provide an o utpu t
2 5 3 W K T
- E A T E R
Figure 10 . Temperature control system
F R O M L S I - I I
Figure 11. Temperature test apparatus
SWITCHING VALVE BL EED VAL VE ,I-O LS I 1 1 MONITOR
A-7ACUUM CHAMBER
Figure 12. Pressure test apparatus
change of 0 to 7.60 V. Th e t ransducer conta ined i t s ownvacuum reference.
Temperature, Control System. Th e thermomechanica lanalysis of polymers required t ha t accurate con trol of th etemp erature of the SAW device be maintained. Th e use ofa simple on-off controller in this application was unaccep table.
A commercially available zero voltage firing prop ortio naltemp erature controller was used in this system ( RF L In-dustr ies model 72-115). Figure 10 illustrates the temperaturecontrol system.
T h estainless steel detector block which accom mod ated the SAWdevice and the previously described temperature controlequipm ent was incorporated into a system to perform th ermalanalysis of the SA W devices themselves an d films in con tactwith them. Thi s arrangemen t, shown in Figure 11,permittedmeasurements to be made over the tempera ture range of 0to 200 "C. T he equipment used to control the pressure arounda SAW device is shown in Figure 12.
Data Acquisition Software. All of the SAW deviceexperiments used t he LS I-11 microcomputer in some capacity.
The compute r permit ted very rapid da ta acquis i t ion andcontrol, buffer ing of ex perimental d ata , real- t ime plotting
Temperature and Pressure Test Apparatus.
8/7/2019 SAW-1-Anal Chem
http://slidepdf.com/reader/full/saw-1-anal-chem 5/7
1462 A N A L Y T I C A L C H E M I S T R Y , V OL . 51 , NO. 9, A U GU S T 1979
-1*)
04
L
w0
2
ra--I
W
c
U-J
LT
I
L'5 30 6'0 715
PRESSURE ( T O R R ) e1O-l
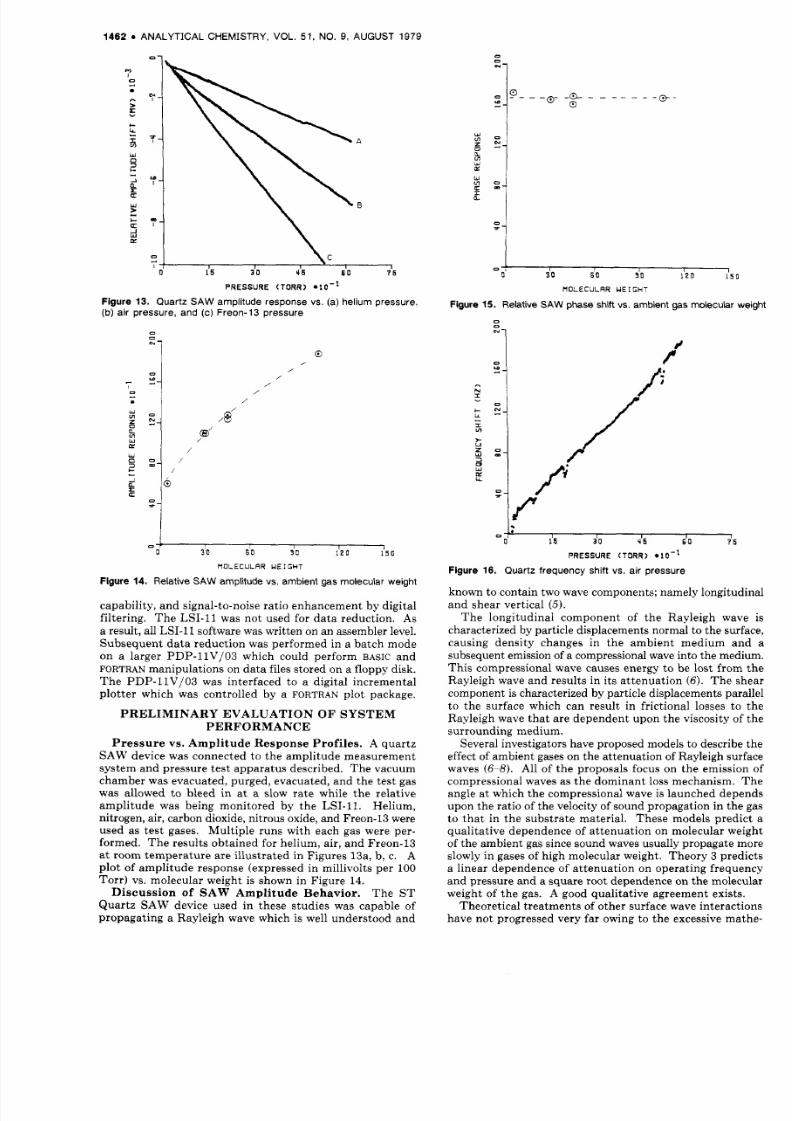
Figure 13. Quartz S A W amplitude response vs. (a)helium pressure,(b) air pressu re, and (c ) Freon-13 pressure
0
,
/
/
w9 ,if
0n0 60 30 1 2 0 150
MOL E C U L R R UEIEHT
Figure 14. Relative S A W amplitude vs. ambient gas molecular weight
capability, and signal-to-noise ratio enhan cem ent by digitalfiltering. Th e LSI- 11 was not used for da ta reduction. Asa result, all LSI-11 software was written on an assembler level.Subse quent d ata reduct ion was performed in a batch modeon a larger PDP-l1V/03 which could perform BASIC andFORTRAN manipulations on da ta files stored on a floppy disk.The PDP-l1V/03 was interfaced to a digi tal incrementalplotter which was controlled by a FORTRAN plot package.
PRELIMINARY EVALUATION OF SYSTEM
PERFORMANCE
Pressure vs. Amplitude Response Profiles. A quar tzSAW device was connected to the am pli tude measurem entsystem and pressure test apparatus described. The vacuumchamber w as evacuated, purged, evacuated, and th e test gaswas allowed to bleed in at a slow rate while the relativeam plitud e was being monitored by the LSI-11. Helium,nitrogen, air, carbon dioxide, nitrous oxide, and Freon-13 wereused as test gases. Multiple run s with each gas were per-formed. Th e resul ts obtained for hel ium, air , and Freon-13at room tem pera ture are i l lustrated in Figures 13a, b, c. A
plot of am plitud e response (expressed in m illivolts per 100
To rr) vs. molecular weight is shown in Figure 14.Discussion of SAW Amplitude Behavior. T h e ST
Quartz SAW device used in these s tudies was capable ofpropagating a Rayleigh wave which is well understood and
0
7
0 ,L----2 0 1 5 0
U OL E C U L R R UEIGHT
Figure 15. Relative S A W phase shift vs . ambient gas molecuhr weight
I:0 15 30 b S 60 7 5
0 , I I I I
PRESSURE (TOR R ) *lo-'
Figure 16. Quartz frequency shift vs. air pressure
known to contain two wave components; namely longitudinaland shear vertical ( 5 ) .
The longitudinal component of the Rayleigh wave ischaracterized by particle displacements normal to th e surface,causing densi ty changes in the ambient medium and asubsequent emission of a compressional wave into the medium.This compressional wave causes energy to be lost from theRayleigh wave and results in its attenu ation (6). T h e s hea rcompo nent is characterized by particle displac emen ts parallelto the surface which can result in frictional losses to the
Rayleigh wave tha t are depen den t upon the viscosity of thesurrounding medium.Several investigators have proposed models to describe the
effect of ambient gases on th e atten uation of Rayleigh surfacewaves (6-8). All of the proposals focus on the emission ofcompressional waves as th e dom inan t loss mechanism. T heangle at which th e compressional wave is launched d epe ndsupon the ratio of the velocity of sound propa gation in t he gasto that in the substr ate material. These models predict aqualitative dependence of attenuation on molecular weightof the a mbie nt gas since sound w aves usually propagate moreslowly in gases of high molecular weight. The ory 3 predictsa linear dependence of attenuation on operating frequencyand pressure an d a square root dependence on t he molecularweight of the gas. A good qualitative agreement exists.
Theoretical trea tme nts of other surface wave interactionshave not progressed very far owing to th e excessive mathe -
8/7/2019 SAW-1-Anal Chem
http://slidepdf.com/reader/full/saw-1-anal-chem 6/7
A N A L Y T I C A L C H E M I S T R Y , V OL . 51 , N O . 9, AUGUST 1979 1463
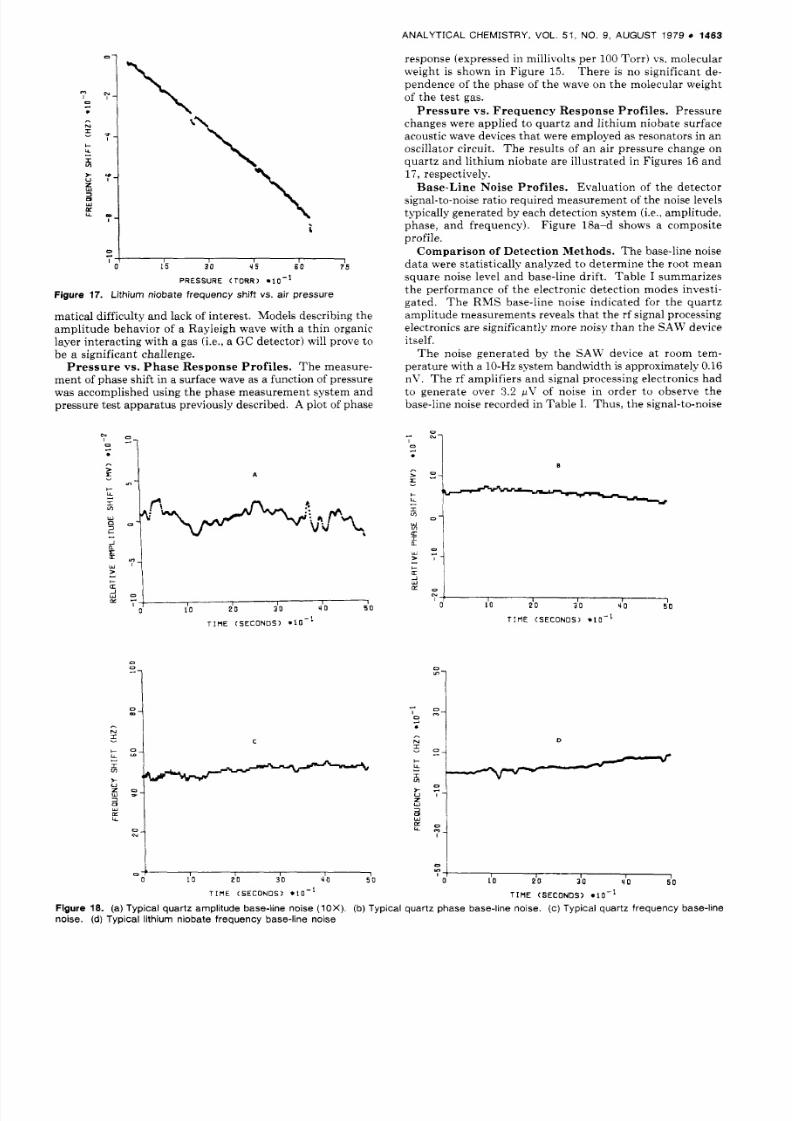
response (exp resse d in millivolts per 100 Tor r) vs. molecularweight is shown in Figure 15. There is no significant de-pendence of the phase of the wave on the molecular weightof th e test gas.
Pressure v s . Frequency Response Profiles. Pressurechanges were appl ied to q uartz an d l i thium niobate surfaceacoustic wave devices th at were employed a s resona tors in anoscillator circuit. Th e results of an air pressure cha nge onquartz a nd l i thium niobate are i l lustrated in Figures 16 a n d17 ,
respectively.Base-Line Noise Profiles. Evaluat ion of th e detectorsignal-to-noise ratio required mea surem ent of the noise levelstypically g enerated by each detec tion system (Le., amp litude,phase , and frequency). Figure 18a-d shows a compo siteprofile.
Comparison of Detection Methods. Th e base-line noisedat a were s tat is tical ly analyzed to determine the root m eansquar e noise level an d base-line drift. Ta ble I summarizesthe performance of the electronic detection modes investi-gated . The RM S base-line noise indicated for the quartzamp litude m easu rem ents reveals that th e rf signal processingelectronics are significantly more noisy than the SAU' deviceitself.
The noise generated by the SA W device at room tem-pera ture with a 10-Hz system bandwidth is approximately 0.16
nV. The rf amplifiers and signal processing electronics hadto generate over 3.2 pV of noise in order to observe thebase-line noise recorded in Ta ble I. Th us, the signal-to-noise
e)
L l
WKL..II
i?I1 5 30 4 5 6 0 7 5
PRESSURE (TORR) m 1 0 - l
Figure 17. L i th ium n ioba te f r equency sh i f t vs. a i r p ressure
matic al difficulty an d lack of interes t. Models describing theampli tude behavior of a Rayleigh wave with a thin organiclayer inte ractin g with a gas (i.e., a GC detecto r) will prove tobe a significant challenge.
Pressure vs . Phase Response Profiles. Th e measure-ment of phase shift in a surface wave as a function of pressurewas accomplished using the phase m easur eme nt system andpressure test apparatus previously described. A plot of phase
N
zul
'E '1l
Yi I.P!
I+ Iw o
I I I I 1L O 2 0 30 40 500
T I M E (SECONOS)
a '1T I M E ( S E C O N D S ) e10-l
8/7/2019 SAW-1-Anal Chem
http://slidepdf.com/reader/full/saw-1-anal-chem 7/7
1464 A NA L Y T I C A L CHE M I S TRY , V O L . 51 , NO . 9, A UG US T 1979
y1
0
' .f
. .. ... . .
I .* ' * '
N
3
' . . *. .3 1 . .
e "1 A
Table I. Typical SA W Detector Performance
500 Torrpressure signal-change to-no se
response ratio
ampli tude 9 . 7 m V 1.3 m V / m i n 5846 mV 566phase 5 . 4 m V 3 . 1 m V / m in 8 2 7 m V 1 5 3frequency 1 .3 Hz 0.75 Hzlmin 149 Hz 115
rm s
quartz noise driftbase-line base-line
LiNbO,
frequency 9.2 H z 11.0 Hzimin 6406 Hz 696
-1
001
- I
. ..
. '
10 1 I I 1 , I
6 0 9 0 12 0 1 5 C3 0
T E R P E S A T U R E (D E GR E E S C )
C
VI
1 , I I I I
TERPERRTURE (DEGREES C )
0 a n 60 9 0 1 2 0 150
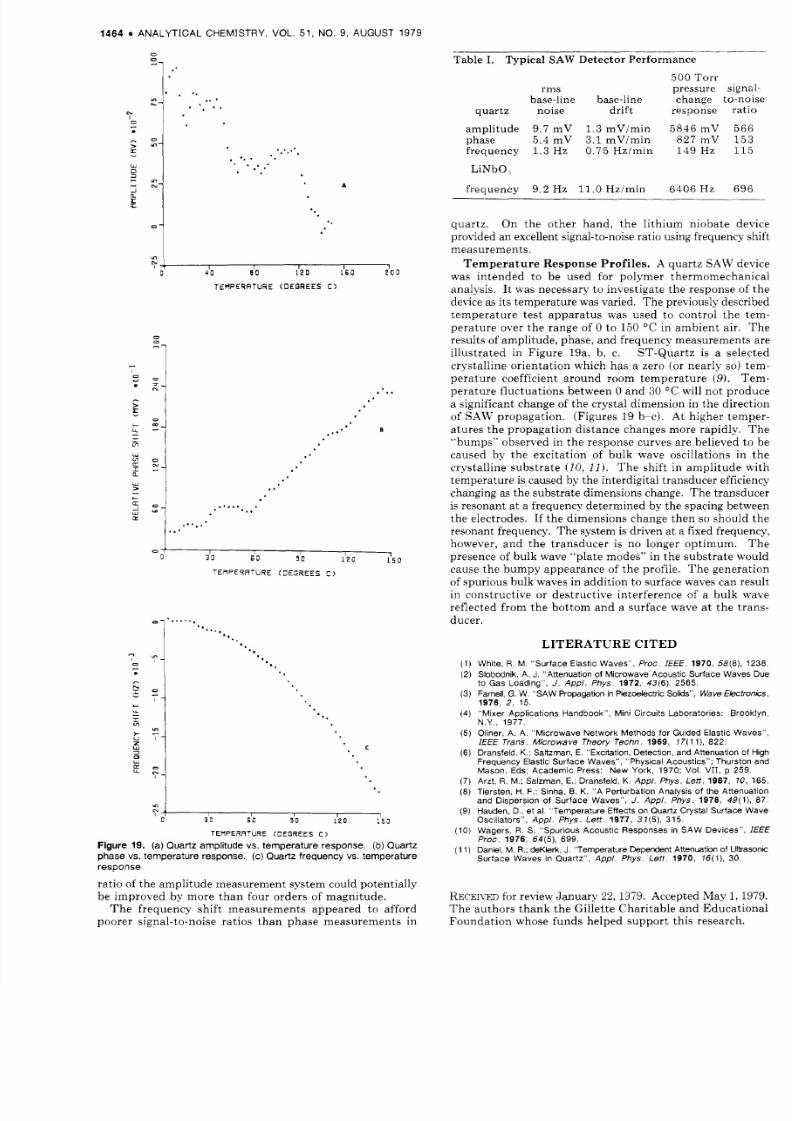
Figure 19. (a) Quartz ampl i tude vs. temperature response. ( b )Quartz
phase vs. temperature response. (c) Quartz f requency vs . temperature
response
ratio of the amp litude mea sureme nt system could potentially
be improved by more tha n four orders of magnitude.The f requency sh i f t measurements appeared to af fordpoorer s ignal-to-noise rat ios than phase measurements in
quar tz . On the o ther hand , the l ith ium n iobate deviceprovided an excellent signal-to-noise ratio using frequency shiftmeasurements .
T e m p e r a t u r e R e s p o n se P r o fi le s . A quar tz SAW devicewas intended to be used for polymer thermomechanicalanalysis. It was necessary to investigate the respo nse of thedevice as its temperatur e was varied. Th e previously describedtemperature t es t appara tus was used to cont ro l the t em-peratu re over the range of 0 t o 150 "C in amb ien t a i r . Th eresults of amplitude, phase, and frequency measurem ents areillustrated in Figure 19a, b, c. ST- Qua rtz is a selectedcrystalline orientation which has a zero (or nearly so ) t em -perature coefficient around room temperature (9). T e m -per ature fluctuat ions between 0 a n d 30 "C will not prod ucea significant change of th e crystal dimen sion in the directionof SA W propaga tion. (Figures 19 b-c). A t higher temper-atures the propagat ion dis tance changes more rapidly. T he"bumps" observed in the response curves are bel ieved to becaused by the excitation of bulk wave oscillations in thecrystall ine substra te (10,11). Th e sh i f t in am pl i tude withtem pera ture is caused by th e interdigital transduc er efficiencychanging as the substrate dimensions change. Th e transduceris resonant at a frequency determined by the spacing betweenthe electrodes. If the dimensions change then so should theresona nt frequency. T he system is driven a t a fixed frequency,however, and the t ransducer is no longer opt im um . Th epresence of bulk wave "plate modes" in the sub stra te wouldcause the bum py appearance of the profi le. Th e generat ionof spurious bulk waves in additio n to surface waves can resultin constructive or destructive interference of a bulk wavereflected f rom the bo t tom a nd a surface wave a t the t rans -ducer.
L I T E R A T U R E C I T E D
White, R. M. "Surface Elastic Waves ", R o c . I€€€. 1 9 7 0 , 58(8), 238.Slobcdnik, A. J. "Attenuation of Microwave Acoustic Surface Waves Dueto Gas Loading", J . App/ . fhys. 1 9 7 2 , 43(6), 2565.Famell, G. W. "SAW Propagation n l?ezoekctric Solids", Wave Electronics,
1 9 7 6 , 2 , 15."Mixer Applications Handbook", Mini Circuits Laboratories: Brooklyn,N.Y., 1977.Oliner, A. A. "Microwave Network Methods for Guided Elastic Waves",I€€€ Trans. Microwave Theory Techn. 1 9 6 9 , 17(11), 822.Dransfeld.K.; Sattzman, E. "Excitation, Detection, and Attenuation of HighFrequency Elastic Surface Waves", "Physical Acoustics"; Thurston andMason, Eds; Academic Press: New York, 1970; Vol . V I I , p 259.Arzt, R. M.; Salzman, E.; Dransfeld, K . Appl. Phys. Left. 1 9 6 7 , 10, 165.Tiersten, H. F.; Sinha, B. K . "A Perturbation Analysis of the Attenuationand Dispersion of Surface Wave s", J . Appl. fhys. 1 9 7 8 , 49(1). 8 7 .
Hauden, D.. et al. "Temperature Effects on Quartz Crystal Surface WaveOscillators", Appl . Phys. Lett. 1 9 7 7 , 37(5),315.Wagers, R. S. "Spurious Acoustic Responses in SAW Device s", E€€Proc. 1 9 7 6 , 64(5), 699.Daniel, M. R.; deKlerk, J. "T empera ture Dependent Attenuation of Uba sonicSurface Waves in Quartz", Appl . fhys. Lett. 1 9 7 0 , 16(1), 30.
RECEIVEDor review January 22 , 1379. Accepted M ay I , 1979.Th e au tho rs thank the Gi l le t te C har i t ab le and Educat ionalFounda t ion whose funds helped sup por t this research.