Embed Size (px)
Citation preview
A Low Carbon Society Scenario Development for Ratchaburi, Thailand
The 16th AIM International Workshop
Climate Change Research Hall, NIES 19-21 February 2011
Savitri Garivait, Sirintornthep Towprayoon, Penwadee Cheewaphongphan

ObjectiveTo develop a low carbon society (LCS) scenario forRatchaburi with an objective to support the provincialvision of self-sufficiency economy for sustainabledevelopment.
Scope & MethodologyTo quantify the GHG emissions vs. associated drivers
• Energy related activities ExSS Tools• Agriculture IPCC 2006 Guidelines
Methodology• Land Use, Land Use Change, and Forestry
IPCC 2006 Guidelines MethodologyBase Year: 2005Target Year: 2030Projection: BAU vs. CM

Ratchaburi: Facts&FiguresLocation
latitudes 13º32’15” N
longitudes 90º49’09” E
Climate
SW monsoon with very dry zones
Mean Annual Temperature
21-38ºC
Average Annual Precipitation
1,303 mm (131 days)
Total Land 5,196.5 km2

Tak
Nan
Loei
Chiang Mai
Surin
Kanchanaburi
Roi Et
Lampang
BurirumSisaket
Chiangrai
Surat Thani
Phrae
Nakhon Ratchasima
Yala
Chaiyaphum
Udon Thani
Krabi
Kalasin
Lopburi
Srakaeo
Songkhla
Phitsanu Lok
Phayao
Auttaradit
Trang
Trat
Phichit
Uthai Thani
Phetchaburi
Chonburi
Rayong
Ratchaburi
Chainat
PhetchabunKhon Kaen
Ubon Ratchathani
Mae Hong Son
Nong Khai
SukhothaiSakon Nakhon
Nakhon Sawan
Chumphon
Kampaeng Phet
Chanthaburi
Satun
Phang Nga
Lamphun
Nakhon Si Thammarat
Yasothon
Prachinburi
Suphan Buri
Narathiwat
Saraburi
Ranong
Mukdahan
Mahasarakham
Prachuap Khilikha
Nakhon Phanom
Chachoengsao
Phatthalung
Pattani
Nong Bua Lamphu
Amnaj Charoen
Bangkok
Nakhon NayokNakhon Prathom
Pathum Thani
Singburi
Phuket
Samut Prakarn
Samut Sakhon
Trat
Satun
Samut Songkham
Legend
REGION
Northern
Central
Western
Eastern
North-eastern
Southern
Location of Ratchaburi pro
RatchaburiFacts & FiguresPopulation
795,255 pp (Yr 2005)
Density
160 pp/km2 (Yr 2005)
GPP2,976 million US$
(17th rank)
GPP/capita
3,634 US$ (13th rank)

IndustryGPP
(million $US)
Primary 450
Secondary 905
Tertiary 1,621
Tertiary industry
Primary industry
Secondary industry
Year 2005
RatchaburiFacts & Figures

3) Commercial
2) Transportation 4) Residential
Energy Related Activities
1) Industrial
PassengerFreight

Agriculture Related Activities
Enteric Fermentation Manure Management Rice Cultivation
Agricultural Residues Open Burning Agricultural soil

LULUCF Related Activities
Source: Garivait and Boonman, 2010
Ratchaburi Land use 2000
Ratchaburi Land use 2007
Crop landForest landGrass landOther landSettlementWet landRatchaburi boundary
2. Forest land converts to other land (Crop land/ Grass land/ Settlement/ Wetland)
1. Other land (Crop land/Grassland/Settlement/Wetland) converts to forest land
3. Forest land remains forest land

Ratchaburi Land use change from 2000 to 2007 (1000 Ha)
%Crop land
Grass
land
Forest
land
Other
landSettlement Wet land
Forest
Plant
Total area
(2000)
Crop land 214.17 16.75 9.34 4.10 37.35 16.12 0.96 298.79 57.7
Grass land 5.46 1.78 5.23 0.63 0.98 0.32 0.01 14.41 2.8
Forest land 17.55 6.60 134.85 2.92 6.04 3.33 1.11 172.40 33.3
Other land 0.62 0.16 1.71 0.41 0.14 0.06 0.00 3.10 0.6
Settlement 7.56 1.12 0.83 0.83 6.44 1.08 0.08 17.93 3.5
Wet land 2.43 0.18 0.21 0.07 1.36 3.31 0.00 7.56 1.5
Forest
plantation1.36 0.12 0.87 0.00 0.10 0.01 0.87 3.33 0.7
Total area
(2007)249.15 26.71 153.04 8.95 52.41 24.21 3.04 517.52 100.0
% 48.1 5.2 29.6 1.7 10.1 4.7 0.6 100.0 -
%Change -9.6 +2.4 -3.7 +1.1 +6.7 +3.2 -0.1 - -
Ratchaburi Land use change
2000
2007
(during 2000 to 2007)
Source: Garivait and Boonman, 2010

Scenarios FormulationBAUHistorical Trends Analysis
Indicator Annual ChangeDemographicPopulation +0.88%Demographic composition 0‐14: ‐1.49 %, 15‐64: +1.22 %, >65: +3.14 %EconomicGPP +3.03%TransportationTrip generation +1.6%
Modal share of passenger transportation
Walk/bike: 9.30%, Motor cycle: 26.00%, Car: 17.00%, Pick up: 17.00%, Van: 17.00%, Small public vehicle: 3.00%, Large public vehicle: 10.70%

National Renewable Energy Development Plan (2008-2022)
Ratchaburi’sDevelopment Plan
2010-2013
State Railway of Thailand’s Plan
Western Region Plan
Power Development Plan
Scenarios FormulationCM Adapted from the following Plans used/may bereferred to Ratchaburi Administration

• Demography data: population/household
• Economic data: Thailand IO table, Thailand GDP, Ratchaburi’s GPP
• Transportation data: trip generation/mode share
The National Statistics Office
Office of the National Economics and Social Development Board
Office of Transport and Traffic Policy and Planning
Source of Input Data
• Building: commercial area (applied from land use data)
Land Development Department
• Energy: Ratchaburi’s energy consumption-supply/Thailand energy supply
Provincial Energy Agency/ Department of Alternative Energy Development and Efficiency

• Agricultural livestock: No. of animal
• Agricultural crop: Area/Production/Fertilization/ Residue/Residue utilization
• Land use: Land use characteristic (GIS-based)
Office of Agricultural Economics
Office of Agricultural Economic/Literature review/Field survey
Land development department
Source of input data
2006 IPCC Guidelines
• Emission factor

7621,112
2,08059
142269
466351
29
439
1,138
-648
-1,000 -500 0 500 1,000 1,500 2,000 2,500
ResidentialCommercial
IndustrialPassenger transport
Freight transportFermentation
Manure managementRice cultivation
Open burningAgricultural soilland use changeland use change
Act
iviti
es
GHG Emission (kt CO2eq)
Ratchaburi Emission, 2005
Total GHG emission
6,848 ktCO2eq
Total removal
-648 ktCO2eq
agricultural 33%
land use 6%
energy consumption
61%
Results

1,435
2,363
4,106
75
292 789
1,768
511
48 1,941
(1,578)
(2,000) (1,000) 0 1,000 2,000 3,000 4,000 5,000
Residential
Commercial
Industrial
Passenger transport
Freight transport
Fermentation
Manure management
Rice cultivation
Open burning
Agricultural soil
land use change
GHG Emission (kt CO2eq)
Activit
iesRatchaburi Emission, 2030 (BAU)
6,848
13,328
-648 -1,578-4,000
-2,000
0
2,000
4,000
6,000
8,000
10,000
12,000
14,000
16,000
Yr 2005 2030 BAU
GHG e
mission
s/remo
vals (kt
-CO2eq
)
Year
total removal
total emission
+95%
-143%
Results

Countermeasures (CM) 7 Actions for Ratchaburi LCS
Action 1 Modal Shifting in Transportation 50% of passenger-small vehicle in inner area switches to walk/bike in
2030/2005
25% of freight-large vehicle that transport goods within Ratchaburi
switches to freight-small vehicle in 2030/2005
25% of freight-large vehicle that transport goods outside Ratchaburi
switches to train in 2030/2005
Action 2 Fuel Switching in Transportation 50% of passenger-small vehicle switches to biofuel, 70% of bus switches to
biofuel in 2030/2005
70% of large vehicle switches to biofuel

Acttion 3 Fuel Switching in Industrial
22.2 ktoe (max.) from Biomass
Action 4 Energy efficiency improvement
30% of refrigerator, air-condition, fan, and lighting in
residential and commercial uses high efficiency
equipment (Label No. 5)
Action 5 Good agricultural practice (GAP)
use of pre-fermented organic matter instead of green manure or
readily decomposable organic matter
Countermeasures (CM) 7 Actions for Ratchaburi LCS

Action 6 Change in Manure Management
swine manure used as an organic fertilizer.
Action 7 Land use change
Develop 1,291 ha of abandoned paddy land to forest plantation
Countermeasures (CM) 7 Actions for Ratchaburi LCS

6,848
13,328
10,200
-648 -1,578 -1,599-4,000
-2,000
0
2,000
4,000
6,000
8,000
10,000
12,000
14,000
16,000
Yr 2005 2030 BAU 2030 CM
GH
G e
mis
sio
ns/
rem
oval
(kt-
CO
2e
q)
Year
Land use change
Change manure management
Good agricultural practice
Energy efficiency improvement
Fuel shift (renewable energy)
Fuel Switching in Transport
Mode Shifting in Transport
Removal
Emission
+95%
-23%
-1%-143%
Results

Mitigation option GHG reduction(kt-CO2eq)
% reduction/rem
oval from target year
1. Modal shifting -83.89 -0.63%2. Fuel switching in transportation -239.90 -1.80%3. Fuel shift (renewable energy) -1,805.73 -13.53%4. Energy efficiency improvement -793.11 -5.94%5. Good agricultural practice (GAP) -20.65 -1.55%6. Change manure management -135.66 -1.02%7. Land use change +21.30 +1.35%Total GHG mitigation in 2030 -3,078.94 -23.45%Total GHG removal in 2030 +21.30 +1.35%Total GHG emission in 2030 (CM) 10,200Total GHG removal in 2030 (CM) -1,599
Net emission 8,601
Summary of GHG Emissions Reduction in 2030 based on CM compared to BAU
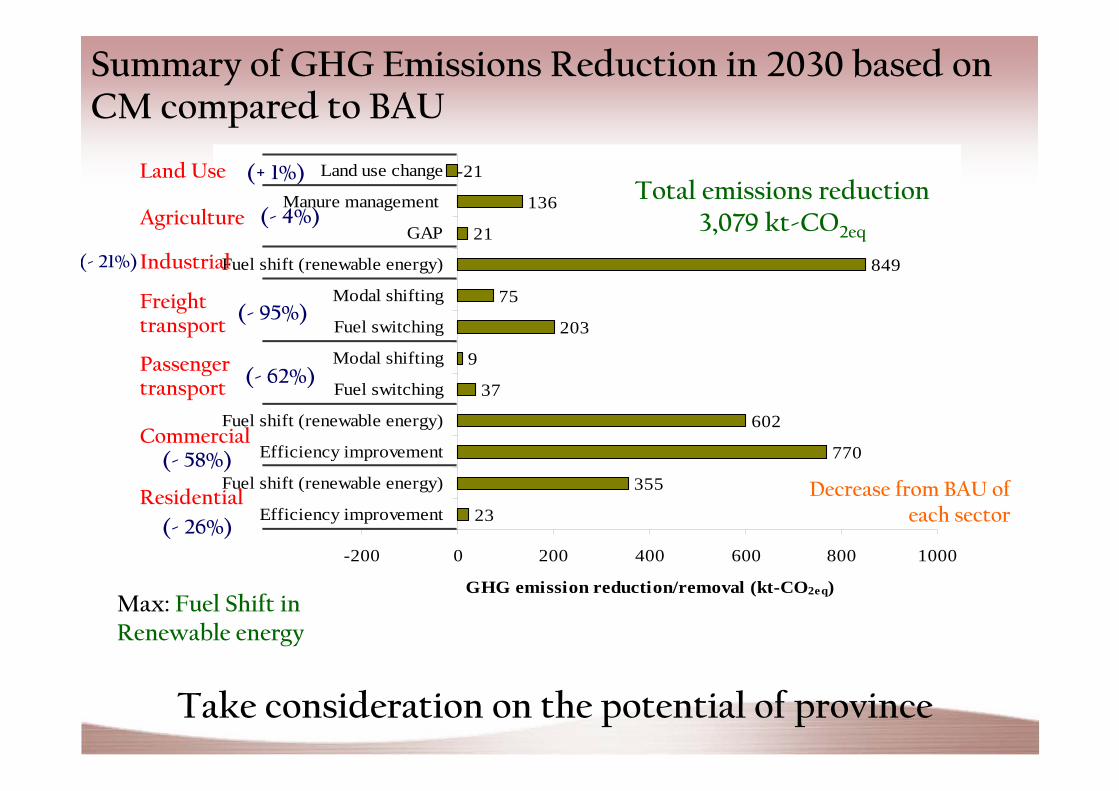
Take consideration on the potential of province
23
355
770
602
37
9
203
75
849
21
136
-21
-200 0 200 400 600 800 1000
Efficiency improvement
Fuel shift (renewable energy)
Efficiency improvement
Fuel shift (renewable energy)
Fuel switching
Modal shifting
Fuel switching
Modal shifting
Fuel shift (renewable energy)
GAP
Manure management
Land use change
GHG emission reduction/removal (kt-CO2eq)
Land Use
Agriculture
Industrial
Freight transport
Passenger transport
Commercial
Residential
Total emissions reduction 3,079 kt-CO2eq
Max: Fuel Shift in Renewable energy
(- 26%)
(- 58%)
(- 62%)
(- 21%)
(- 95%)
(- 4%)
(+ 1%)
Decrease from BAU of each sector
Summary of GHG Emissions Reduction in 2030 based on CM compared to BAU