Embed Size (px)
Citation preview

1
SaudiHealthInterviewSurvey
Results
in collaboration with

2
TableofcontentsBackground ............................................................................................................................................................................................................ 6
Survey objectives ............................................................................................................................................................................................... 7
Survey operations .................................................................................................................................................................................................. 7
Training .............................................................................................................................................................................................................. 7
Survey implementation .......................................................................................................................................................................................... 8
Survey organization ............................................................................................................................................................................................... 8
Survey flow ............................................................................................................................................................................................................. 9
(1) Household roster module ............................................................................................................................................................................. 9
(2) Questionnaire and physical measurements module .................................................................................................................................. 10
(3) Disposition codes module .......................................................................................................................................................................... 10
(4) Biochemical measurements module .......................................................................................................................................................... 10
Respondent recruitment ...................................................................................................................................................................................... 11
Confidentiality ...................................................................................................................................................................................................... 11
Data collection ..................................................................................................................................................................................................... 12
Data collection technology .............................................................................................................................................................................. 12
Study design ......................................................................................................................................................................................................... 12
Sampling ........................................................................................................................................................................................................... 13
Weighting methodology .................................................................................................................................................................................. 14
Results .................................................................................................................................................................................................................. 16
Selected SHIS findings: ......................................................................................................................................................................................... 20
Appendix 1: Saudi Health Interview Survey 2013 ................................................................................................................................................ 55
Color-coding legend ........................................................................................................................................................................................................................................................................................ 56

3
Module 1: Household roster ............................................................................................................................................................................ 57
Household roster – Survey information and consent .................................................................................................................................. 58
Household roster ......................................................................................................................................................................................... 59
Module 2a: Selected adult questionnaire for full survey ................................................................................................................................ 61
Survey information and consent – full survey ............................................................................................................................................. 62
Selected adult questionnaire – full survey ................................................................................................................................................... 63
Module 3: Disposition codes .......................................................................................................................................................................... 102
Disposition codes ....................................................................................................................................................................................... 103
Module 4: Selected adult biochemical measurements ................................................................................................................................. 108
Selected adult biochemical measurements ............................................................................................................................................... 109
FiguresandTables
Table 1: Age and sex distribution ................................................................................................................................................................................. 20 Table 2: Level of education, men ................................................................................................................................................................................. 21 Table 3: Level of education, women ............................................................................................................................................................................ 21 Table 4: Total household income, men ........................................................................................................................................................................ 22 Table 5: Household income level, women ................................................................................................................................................................... 22 Table 6: Smoking status, men ...................................................................................................................................................................................... 23 Table 7: Smoking status, women ................................................................................................................................................................................. 23 Table 8: Smokeless tobacco use .................................................................................................................................................................................. 24 Table 9: Mean age of smoking initiation ...................................................................................................................................................................... 24 Table 10: Mean years of smoking ................................................................................................................................................................................ 25 Table 11: Consumption of manufactured cigarettes ................................................................................................................................................... 25 Table 12: Consumption of shisha ................................................................................................................................................................................. 26 Table 13: Hours spent sitting per day, men ................................................................................................................................................................. 27

4
Table 14: Hours spent sitting per day, women ............................................................................................................................................................ 27 Table 15: Hours spent watching TV per day, men ....................................................................................................................................................... 28 Table 16: Hours spent watching TV per day, women .................................................................................................................................................. 28 Table 17: Physical activity level*, men ........................................................................................................................................................................ 29 Table 18: Activity level*, women ................................................................................................................................................................................. 29 Table 19: Body mass index (BMI)*, men ...................................................................................................................................................................... 30 Table 20: Body mass index (BMI)*, women ................................................................................................................................................................. 30 Table 21: Mean BMI ..................................................................................................................................................................................................... 31 Table 22: Daily servings of fruits, men ......................................................................................................................................................................... 32 Table 23: Daily servings of fruits, women .................................................................................................................................................................... 32 Table 24: Daily consumption of five or more servings of fruits ................................................................................................................................... 33 Table 25: Daily servings of vegetables, men ................................................................................................................................................................ 33 Table 26: Daily servings of vegetables, women ........................................................................................................................................................... 34 Table 27: Daily consumption of more than five servings of vegetables ...................................................................................................................... 34 Table 28: Daily servings of fresh juice, men ................................................................................................................................................................. 35 Table 29: Daily servings of fresh juice, women ............................................................................................................................................................ 35 Table 30: Daily consumption of more than five servings of fresh juice ....................................................................................................................... 36 Table 31: Daily servings of fruits, fresh juice, and vegetables, men ............................................................................................................................ 36 Table 32: Daily servings of fruits, fresh juice, and vegetables, women ....................................................................................................................... 37 Table 33: Daily consumption of more than five servings of fruits, fresh juice, and vegetables. ................................................................................. 37 Table 34: Mean of fruit, fresh juice, and vegetable servings consumed per day ........................................................................................................ 38 Table 35: Self‐rated health, men ................................................................................................................................................................................. 39 Table 36: Self‐rated health, women ............................................................................................................................................................................ 39 Table 37: Last routine medical checkup, men ............................................................................................................................................................. 40 Table 38: Last routine medical checkup, women ........................................................................................................................................................ 40 Table 39: Distance traveled for medical checkup, men ............................................................................................................................................... 41 Table 40: Distance traveled for medical checkup, women .......................................................................................................................................... 41 Table 41: Hypertension* including those on drugs ..................................................................................................................................................... 42 Table 42: Status of diagnosis, treatment, and control among those who are hypertensive, men ............................................................................. 42 Table 43: Status of diagnosis, treatment, and control among those who are hypertensive, women ........................................................................ 43
5
Table 44: Mean of measured systolic blood pressure ................................................................................................................................................. 43 Table 45: Mean of measured diastolic blood pressure................................................................................................................................................ 44 Table 46: Measured pre‐hypertension ........................................................................................................................................................................ 44 Table 47: Diabetes* including those on drugs ............................................................................................................................................................. 45 Table 48: Status of diagnosis, treatment and control among those who are diabetic, men ...................................................................................... 45 Table 49: Status of diagnosis, treatment and control among those who are diabetic, women ................................................................................. 46 Table 50: Pre‐diabetes* measured by HbA1C ............................................................................................................................................................. 46 Table 51: Mean of measured HbA1c Level .................................................................................................................................................................. 47 Table 52: Hypercholesterolemia*, including those on drugs ...................................................................................................................................... 48 Table 53: Status of diagnosis, treatment and control among those who are hypercholesterolemic, men ................................................................ 48 Table 54: Status of diagnosis, treatment and control among those who are hypercholesterolemic, women ........................................................... 49 Table 55: Measured pre‐hypercholesterolemia .......................................................................................................................................................... 49 Table 56: Mean of measured total blood cholesterol ................................................................................................................................................. 50 Table 57: Vitamin D levels, men .................................................................................................................................................................................. 51 Table 58: Vitamin D levels, women .............................................................................................................................................................................. 51 Table 59: consumption of vitamin D supplements ...................................................................................................................................................... 52 Table 60: Mean of measured blood vitamin D level .................................................................................................................................................... 52 Table 61: Self‐reported chronic conditions, by sex ...................................................................................................................................................... 53
Figure 1: Survey flow 54

6
Background
The Kingdom of Saudi Arabia (KSA) has made large strides in improving health standards over the past two decades. The Kingdom has seen a
dramatic shift in its burden of disease profile, transitioning away from communicable, maternal, and perinatal causes and toward non‐
communicable diseases. The leading causes of death for females in 2010 in the KSA were ischemic heart disease (IHD) followed by
cerebrovascular disease, representing 18% and 17% of total deaths, respectively. In comparison, IHD was the leading cause of death for males,
followed by road traffic injuries and cerebrovascular diseases. Diabetes mellitus ranked sixth, causing 3.7% of the total deaths in males, while in
females it ranked seventh, causing 3.8% of total deaths in 2010. Risk factors for death, such as high blood pressure, high fasting plasma glucose
(FPG), and high body mass index (BMI), among men of all ages ranked second, third, and fourth in 2010, whereas in females these risk factors
ranked first, fourth, and third, respectively. Dietary risk factors contributed to 25% and 24% of deaths among males and females, respectively,
while in both males and females physical activity was ranked as the sixth risk factor for deaths in 2010.
The Ministry of Health of the KSA is currently investing in reforming its health information systems and began a five‐year collaboration with the
Institute for Health Metrics and Evaluation (IHME) in 2012 to implement an integrated health information system in the Kingdom. The first step
of this collaboration is to implement a population‐based surveillance system that integrates multiple data sources to track the risk factors for
chronic diseases at the local level. This system will capture the complete spectrum of relevant information from socioeconomic context and
health risk factors to disease incidence and the resulting cascade of hospitalizations, outpatient visits, and use of and adherence to
interventions. It will enable the Kingdom of Saudi Arabia to gain more information regarding health outcomes, health risk factors, health
services, and socioeconomic determinants. Furthermore, it will allow them to evaluate disparities in health and tailor interventions confronting
chronic disease in the Kingdom of Saudi Arabia.

7
Survey objectives
The primary objective of the Saudi Health Interview Survey (SHIS) was to collect data on health and demographic characteristics in order to
assess the prevalence of several chronic conditions and identify their risk factors. The information provided by the survey will help the Ministry
of Health better understand the health of people in the Kingdom of Saudi Arabia and provide a sound basis to better develop and implement
preventive and curative programs throughout the Kingdom.
Survey operations
The MOH has implemented and overseen the operation of the survey, including planning and conducting fieldwork and processing collected
data. MOH staff was responsible for overseeing the day‐to‐day technical operations, including recruiting and training field and data‐processing
staff and supervising office and field operations.
Financial support for the survey was provided by the Kingdom of Saudi Arabia. The Institute for Health Metrics and Evaluation (IHME) provided
technical assistance when required.
Training
Joint and separate in‐depth trainings were held for supervisors and local interviewers. During the training, survey experts from IHME and MOH
introduced all aspects of the protocol and survey content, including methodology for physical measurement, to supervisors and interviewers. In
addition, in‐class practice was conducted in order to familiarize the interviewers with the instrument, and the intended purpose of each
question was clearly explained. The training sessions included familiarizing interviewers and supervisors with using the computer software
(DatStat) that was used for data collection. Interviewers learned DatStat and practiced administering the questionnaire and submitting the
surveys in class.

8
A pilot study was conducted to familiarize the interviewers with the operation and the issues that might be encountered in the field. A final
version of the survey was finalized based on the results of the pilot, and a final training was conducted in each region for all interviewers before
the start of the survey.
Survey implementation
Each local survey area was composed of a supervisor and approximately 20 interviewers (10 two‐person teams). Interviewers visited households
in teams of two consisting of one male and one female to ensure that respondents were interviewed by a member of the same sex.
Lenovo notebooks were used in administering and transmitting the data via a secure link to MOH. The Health Interview Survey comprises four
modules, which are discussed in detail in the following sections. The questions have been specifically selected to provide information on
demographics, morbidity, effective coverage, and leading health conditions within the population.
Survey organization
The SHIS includes the following modules (described in detail later in this document):
I. Household roster (Module 1) II. Selected adult questionnaire (Module 2, part 1)
a. Socio‐demographic information b. Tobacco use c. Diet d. General health status and functional health status e. Physical activity f. Access to and utilization of health care g. Oral health

9
h. History of chronic conditionsi. Inventory of medications for chronic conditionsj. Miscellaneous health behaviors
III. Selected adult physical measurements (Module 2, part 2)a. Anthropometryb. Blood pressure, heart rate, and respiration
IV. Disposition codes (Module 3)V. Selected adult biochemical measurements (completed at a local clinic) (Module 4)
a. Fasting lipid profileb. Hemoglobin A1cc. Vitamin D
Please refer to Appendix 1 for the full instrument.
Survey flow
The flow of the survey and linkage between different steps is summarized in Figure 1. As the figure shows, there are four main components to
the SHIS: (1) the household roster, (2) questionnaire and physical measurements, (3) disposition codes, and (4) biochemical measurements.
Details on each section are provided below.
(1) Household roster module
The SHIS starts with the household roster; after the household head was successfully identified, the interviewer administered the household
roster module to them. If the head of household was away or unable to answer, a household member aged 15 years or older could fill in
information for the roster. This module lasts about five minutes. Information collected for this module was used to randomly select an adult for
the following modules. Specifically, at the end of the household roster module, the DatStat software randomly selected an eligible person from
the list of all eligible persons in that household to participate in the rest of the survey.

10
(2) Questionnaire and physical measurements module
This module has two sub‐components: 1) questionnaire and 2) physical measurements.
Once the randomly selected individual was successfully contacted and consent was obtained, a series of demographic and health questions were
asked, followed by recording of physical measurements. These physical measurements include weight, height, waist circumference, blood
pressure, and heart and respiration rates. Omron HN286 (SN:201207‐03163F) was used to measure weight. Omron M6 Comfort (HEM‐7223‐E)
was used to measure blood pressure. At the end of this module, respondents were invited to visit their local health clinic to have their blood
drawn and tested.
(3) Disposition codes module
This module captures information used to calculate response rates and determines the final status of each contact with the selected household.
When a survey was stopped at any point such as the end of or during a module, Datastat required a disposition code. When a survey was
completed, the final disposition code was assigned as complete. This allowed the survey managers to monitor progress and assign work in the
field. At the end of the survey, the disposition codes were used to compute the response rate.
(4) Biochemical measurements module
Participants were referred to a local clinic, where their blood was drawn for testing. After blood had been drawn from the participant, the local
clinic shipped the blood sample collected to King Fahd Medical City (KFMC) in Riyadh for analysis. The blood collected was tested for fasting lipid
profile, hemoglobin A1c, and Vitamin D. The survey used a central lab to ensure the standardization of all measurements. Roche Hitachi COBAS
8000 was used to measure total cholesterol, HDL, LDL, triglycerides, and vitamin D. COBAS INTEGRA400 plus was used to measure HbA1c.

11
DatStat was used to enter values at clinics and the lab, and this information was then transmitted to the MOH. The household ID (HHID) was
used for data entry at all levels. Date and time of when the blood sample was taken and questions about drugs (such as insulin) that might have
been taken by the participant during that day were collected at the clinic. When the sample was analyzed at KFMC lab, a lab technician entered
and transmitted the results of the blood analysis on DatStat.
Respondent recruitment
The potential respondents were contacted by staff trained in interview procedures. Each potential respondent was informed about the purpose
of the study and the approximate time needed for the interview. Written or verbal informed consent for participation was sought from each
respondent. Potential respondents had the right to refuse participation, and a respondent could refuse to participate in the study at any given
time. The respondent information sheet and informed consent form were translated into and administered in Arabic.
Confidentiality
All interviews were conducted with the respondent without the presence of another person from the household. Each respondent was identified
by a unique identifier (HHID) and not by his or her name. The roster was administered to the head of the household or the most knowledgeable
person of the house if the head of the household was not present at the time of the first contact. The roster included all members of the family
listed according to their date of birth. A random member aged 15 or older was selected for the interview. The data transmitted to MOH had the
HHID and not the personal identity of the respondents (i.e., names of the respondents were not collected by questions in the survey and hence
not transmitted to the MOH).

12
Data collection
All interviews and physical measurements were done on a one‐to‐one basis. Each interview consisted of one interviewer and another
interviewer responsible for physical measurements. Each team consisted of one male and one female interviewer to ensure that if a female was
selected for the interview, a female interviewer could administer the questionnaire. No other person was present other than the respondent
and the interviewer. Each respondent was identified by their HHID number.
Data‐collection technology
DatStat software was used for data collection. This data entry program included range and consistency checks to control the quality of data
entered. The data collected through this software were immediately sent to MOH’s server and were constantly monitored and checked for
quality purposes. All computers had connections to the internet for continuous data upload and feedback. This allowed timely feedback to
interviewers in the field, thereby allowing better data‐collection results. MOH was responsible for translating the survey into Arabic, and IHME
programmed the survey in Arabic using DatStat. The final instrument covered information about socio‐demographic data; tobacco consumption,
diet, and physical activity pattern; history of blood pressure and diabetes; anthropometric and blood pressure measurements; and biochemical
assessment of total and HDL cholesterol and triglycerides, hemoglobin A1c, and vitamin D.
Study design
The SHIS is based on a multistage representative sample of adults 15 years or older. The survey was conducted covering all regions in the
Kingdom of Saudi Arabia using probability proportional to size. This study was used to estimate the prevalence of some of the risk factors of non‐
communicable diseases through interview, physical examination, and laboratory examination of blood samples of study participants.
13
Sampling
A multistage stratified probability sample was developed to recruit the study participants while ensuring probability proportionate to size for
each stratum. Stratification was based the 13 regions of the Kingdom (Al Riyadh; Makkah Al Moukarrama; Eastern Region; Northern Borders;
Madinah; Jezan; Aseer; Najran; Qaseem; Tabuk; Hail ; Al‐Jouf; Al‐Baha).
The Census Bureau of the Kingdom of Saudi Arabia has divided the Kingdom into small clusters of households (averaging about 140 household in
each cluster) and labeled them as enumeration units. These enumeration units serve as primary sampling units (PSU) for the survey. The number
of households in each PSU depends upon the population size, density, and geographical spread of the area. Therefore, the congested cities have
more households in a PSU as compared to more scattered rural areas.
A probability proportional to size sample of PSUs was randomly selected from each of 13 administrative regions. Fourteen households from each
PSU (enumeration unit) were randomly selected and contacted. A total of 12,000 households were selected and contacted. A total of 10,827
completed the survey and were invited to the local health clinics. The remaining 1,173 completed part of the roster or all of it, but the selected
adult did not complete the rest of the survey (Module 2). The sections in the survey that were administered at the household (Modules 1 and 2)
had a 90% response rate (10,827/12,000). A total of 5,941 individuals went to the local clinics and provided blood samples for analyses. The
section of the survey that was administered at the clinic (Module 4) had a response rate of 55% (5,941/10,827), or a final response rate of 49.5%
(5,941/12,000). All survey weights were post‐stratified to the general Saudi population and to the composition of the selected adults. Hence, the
methodology adjusted for self‐selection bias in the clinic part of the survey. Indeed, participants who went to the clinic were more likely to be
older women with certain pre‐conditions. Consequently, our weights accounted for this bias.

14
Weighting methodology
As previously described, sampling was performed using the regions as strata and the primary sampling unit created by the census bureau in each
region. There were 13 strata in total. Two sets of sample weights were generated and incorporated into the merged datasets for analysis. We
define an individual’s probability of selection as the total number of sampled individuals in his or her strata divided by the total number of
households in that strata and the number of individuals eligible for selection in his or her household.
p N , ,
N , , N , ,
An individual’s selection weight is defined as the inverse of the probability of selection.
w1
p
The selection weight is multiplied by a post‐stratification factor to account for differences in the demographic distribution in our sample and the
total population of Saudi Arabia. The post‐stratified person‐weight more fully incorporates information about the sample gleaned from the 2013
KSA census. The post‐stratification factor is defined as the ratio of the percentage of individuals in that selected individual’s age and sex group in
the Saudi population to the percentage of individuals in that selected individual’s age and sex group in our sample.
w , w%pop , ,
%pop , ,
This post‐stratified person‐weight is used when analyzing all data collected in the household.

15
For individuals who have completed Module 4, we computed an additional weight that should be used for all data collected in the laboratory.
The non‐post‐stratified laboratory weight is defined as the ratio of the total number of sampled individuals in that individual’s strata to the
number of individuals in that individual’s strata from whom laboratory data were collected and multiplied by the individual’s selection weight
computed above.
wN , ,
N , ,w
The individual’s non‐post‐stratified laboratory weight is multiplied by a post‐stratification factor using a predicted probability derived from a
logistic regression on an individual’s age group, sex, diabetes status, self‐reported health, recent health clinic visits, and smoking status. An
additional demographic post‐stratification factor is applied to account for differences in the demographic characteristics of individuals
completing Module 4 and the Saudi population. Finally, we apply a factor F to adjust the post‐stratified lab weight to represent the sample
estimated population of individuals 15 years of age and older in Saudi as predicted using a weighted tabulation of our post‐stratified person‐
weight.
w , w p F%pop
%pop ,
This weight was used for all the data collected at the clinics.

16
Results
SHIS is a cross‐sectional study covering all 13 regions of KSA that uses a multi‐staged representative sample of adults 15 years and older. This
study estimates the prevalence of non‐communicable diseases and its risk factors in the Kingdom. The following is a brief summary of the key
findings of our study.
The prevalence of obesity in Saudi Arabia ranged from 13.6% in young adults aged 15‐24 to 48% in adults aged 55‐64. 24.1 % of males and 33.5%
of females have a body mass index (BMI) above 30 kg/m2. 33.4% of males and 28.0% of females are overweight, with a BMI between 25 kg/m2
and 30 kg/m2.
The prevalence of hypertension also increased across age groups from 3.4% among those aged 15‐24 to 48.4% among those aged 55 to 64 and
65.2% among those aged 65 and older. Borderline hypertension was noted in 46.5% (3.0 million) of males and 34.3% (2.1 million) of females.
About 1.1 million Saudi men and 0.8 million Saudi women are hypertensive, with 0.5 million men and 0.4 million women who have been
diagnosed with hypertension. 0.4 million men and 0.3 million women are on medication for hypertension; however, 0.2 million men and 0.2
million women have uncontrolled elevated blood pressure.
The prevalence of hypercholesterolemia increased with age and ranged from 5.7% among those aged 25‐34 to 28.7% among those aged 65 and
older. 19.5% (1.3 million) of males and 20.6% (1.2 million) of females have borderline hypercholesterolemia. About 0.7 million Saudi men and 0.5
million Saudi women are hypercholesterolemic, with 0.4 million men and 0.3 million women diagnosed with hypercholesterolemia. 0.2 million
men and 0.1 million women are on medication for hypercholesterolemia; however, only 7.44% of hypercholesterolemic men and women who
are treated have uncontrolled elevated blood cholesterol.
The prevalence of diabetes increased with age and ranged from 7.8% among those aged 25‐34 to 50.4% among those aged 65 and older.
Borderline diabetes was present in 17.0% (1.2 million) of males and 15.5% (1 million) of females. 1.0 million Saudi men and 0.7 million Saudi
women are diabetic, with approximately 0.6 million men and 0.5 million women diagnosed with diabetes. 0.5 million men and 0.3 million
women are on medication for their diabetes; however, about 0.2 million of those men and 0.2 million of those women have uncontrolled

17
diabetes. Moreover, 4.5% of men and 3.5% of females in KSA have asthma, whereas only 0.1% of men and 0.4% of females have reported to
have cancer.
The findings of SHIS call for more efforts to prevent the chronic disease risk factors. Programs to improve diet, reduce smoking, and increase
physical activity are urgently needed. The high rates of diabetes, high blood pressure, and high cholesterol levels in a young population are
alarming. These rates will continue to increase as the Saudi population is aging. Moreover, the high prevalence of borderline and undiagnosed
conditions as well as the lack of compliance with medical treatment call for campaigns of early detection and health education. Awareness
campaigns need to highlight the importance of compliance with medication, the impact of shisha and smoking on health, and the interrelated
risks of total caloric intake and physical activity with obesity.
The MOH is about to launch a health census that will provide a comprehensive picture of the burden of disease in the Kingdom. This includes
assessing the prevalence of communicable and non‐communicable diseases as well as injuries among populations in Saudi. The results of the
census will be essential for implementing effective health policies that aim to create a better health system in the Kingdom that is based on
prevention and early detection. The census will also give accurate information related to access to health care by facility by region, which is
crucial in building a stronger and more efficient health system.
Why are SHIS findings different from those previously reported by other studies? SHIS was based on a nationally representative household sample designed to produce national and regional estimates. All interviewers and
supervisors used a standardized methodology for households’ selection and data collection. All laboratory work was done in a standardized
approach at a central location. SHIS used computer‐assisted personal interviewing (CAPI) to improve the quality and the timeliness of data. The
computer software used in data collection (DatStat) included range and consistency checks for all variables, hence eliminating interviewers’
errors. Moreover, the software picked the eligible household member at random from a roster, hence eliminating selection bias at the
household.
18
Finally, SHIS applied an advanced statistical approach in post‐collection management of the data. The final weights used for individuals were
based on the probability of selection and a post‐stratification factor to ensure a representative sample of the Kingdom. More importantly, SHIS
adjusted for self‐selection bias among those who went to the clinic and those who did not. In health studies, sick persons or those who are not
feeling well are more likely to accept physical exams and undergo blood analyses (refer to the table below). SHIS weights adjusted for this bias
and applied an approach to correct the estimates to be representative of the general population and not of those who decided to go to the
clinics.

19
Table: Clinical visit participation bias
Participated in the lab exam Bivariate analysis Multivariate analysisFactors Categories No (row %) Yes (row %) Chi2 P value Adjusted OR 95% CIGender Males 3,085 (58.2) 2,211 (41.8) 15.6 < 0.001 Reference
Females 3,010 (54.5) 2,515 (45.5) 1.2 1.1 – 1.3Age 15 – 24 1,406 (59.0) 976 (41.0) 76.8 < 0.001 Reference
25 – 34 1,672 (60.6) 1,085 (39.4) 0.9 0.8 – 1.035 – 44 1,314 (56.2) 1,025 (43.8) 1.05 0.9 – 1.245 – 54 774 (50.9) 746 (49.1) 1.2 1.1 – 1.455 – 64 455 (52.8) 407 (47.2) 1.2 1.0 – 1.465 – 74 249 (45.9) 293 (54.1) 1.6 1.3 – 2.075+ 173 (51.9) 160 (48.1) 1.2 1.0 – 1.6
Routine medical check‐up Never 4,468 (56.8) 3,401 (43.2) 7.6 0.05Within 2013 997 (54.4) 837 (45.6) within 2012 391 (54.0) 333 (46.0) 2005 – 2011 241 (60.2) 159 (39.8)
Fruits and vegetables consumption < 5 servings per day 5,592 (56.30 4,337 (43.7) 0.02 0.9
5+ servings per day 343 (56.4) 265 (43.6) Current smoking status Non‐smoker 5,189 (54.8) 4,272 (45.2) 65.6 < 0.001
Smoker 908 (66.5) 458 933.5) BMI kg/m2 < 25 2,070 (59.7) 1,398 (40.3) 67.7 < 0.001 Reference
25.00–29.99 1,195 (57.5) 1,477 (42.5) 1.1 0.9 – 1.230.00–34.99 1,577 (51.5) 1,482 (48.5) 1.3 1.1 – 1.4
≥ 35 185 (44.8) 228 (55.2) 1.7 1.3 – 2.1Self‐rated health Excellent or very good 4,626 (58.7) 3,249 (41.3) 73.1 < 0.001
Good 1,026 (50.5) 1,004 (49.5) Fair or poor 420 (47.7) 461 (52.3)
Asthma No 5,880 (56.5) 4,532 (43.5) 4.6 0.03Yes 200 (51.0) 192 (49.0)
COPD No 6,066 (56.3) 4,709 (43.7) 0.7 0.4Yes 14 (48.3) 15 (51.7)
Pre‐diabetes No 5,996 (56.6) 4,603 (43.4) 20.5 < 0.001 ReferenceYes 83 (40.7) 121 (59.3) 1.7 1.2 – 2.2
Diabetes No 5,415 (57.3) 4,027 (42.7) 31.4 < 0.001Yes 616 (49.0) 641 (51.0)
Blood pressure No 5,518 (57.0) 4,161 (43.0) 21.9 < 0.001Yes 511 (49.4) 523 (50.6)
Cholesterol No 5,574 (57.0) 4,206 (43.0) 16.3 < 0.001Yes 379 (49.5) 387 (50.5)
Total 6,097 (56.3) 4,730 (43.7)

20
Selected SHIS findings:
Table 1: Age and sex distribution
Men Women Total Age N Weighted % SE N Weighted % SE N Weighted % SE
15 ‐ 24 1189 51.3 1.32 1193 48.7 1.32 2382 100 0.7225 ‐ 34 1254 51.1 1.30 1503 48.9 1.30 2757 100 0.5135 ‐ 44 1132 45.4 1.35 1207 54.6 1.35 2339 100 0.4 45 ‐ 54 722 49.0 1.66 798 51.0 1.66 1520 100 0.3955 ‐ 64 439 55.4 2.30 423 44.6 2.30 862 100 0.2965+ 517 59.1 2.32 358 40.9 2.32 875 100 0.19Total 5253 50.6 0.69 5482 49.4 0.69 10735 100

21
Table 2: Level of education, men
Can’t read or write Can read and write Primary school completed
Intermediate school completed
Completed school or high school
College/university completed Post‐graduate degree
Age N Weighted %
(SE) N Weighted %(SE) N Weighted %
(SE) N Weighted % (SE) N Weighted %
(SE) N Weighted % (SE) N Weighted %
(SE)
15 ‐ 24 2 0.2 (0.13) 25 3.5
(0.75) 126 10.8(1.10) 428 35.4
(1.77) 528 42.4(1.84) 79 7.7
(1.03) 0 N/A(N/A)
25 ‐ 34 9 0.8 (0.29) 13 1.4
(0.47) 63 5.0(0.73) 140 11.2
(1.20) 526 43.1(1.89) 481 37.0
(1.79) 21 1.6(0.42)
35 ‐ 44 17 2 (0.63) 30 2.5
(0.55) 89 8.9(1.13) 152 13.2
(1.36) 419 38.2(1.89) 381 31.5
(1.78) 42 3.7(0.67)
45 ‐ 54 29 3.1 (0.76) 52 8.0
(1.33) 114 16.7(1.87) 139 18.5
(1.86) 208 30.0(2.20) 152 19.1
(1.78) 25 4.6(1.03)
55 ‐ 64 74 17.3 (2.51) 60 12.5
(2.09) 97 23.3(2.71) 70 17
(2.35) 64 15.3(2.33) 63 12.6
(1.83) 10 2.0(0.79)
65+ 231 43.0 (2.97) 92 16.5
(2.09) 94 21.1(2.54) 42 8.3
(1.62) 29 6.3(1.49) 23 4.0
(0.95) 5 0.7(0.30)
Total 362 4.2 (0.31) 272 4.7
(0.41) 583 11.3(0.60) 971 22.5
(0.87) 1774 36.8(0.96) 1179 18.8
(0.70) 103 1.6(0.19)
Table 3: Level of education, women
Can’t read or write Can read and write Primary school completed
Intermediate school completed
Completed school or high school
College/university completed Post‐graduate degree
Age N Weighted %
(SE) N Weighted %(SE) N Weighted
% (SE) N Weighted % (SE) N Weighted %
(SE) N Weighted % (SE) N Weighted %
(SE)
15 ‐ 24 16 1.1 (0.39) 41 4.3
(0.79) 118 9.5(1.11) 346 27.5
(1.67) 481 41.5(1.86) 187 16.0
(1.38) 2 0.1(0.05)
25 ‐ 34 51 3.3 (0.65) 71 4.7
(0.70) 135 8.5(1.04) 171 11.3
(1.09) 486 31.5(1.65) 563 39.2
(1.77) 21 1.5(0.38)
35 ‐ 44 140 11.3 (1.22) 107 10.2
(1.24) 142 14.8(1.48) 172 15.4
(1.42) 251 20.2(1.46) 373 26.8
(1.62) 21 1.3(0.32)
45 ‐ 54 297 34.9 (2.18) 124 17.4
(1.89) 109 14.2(1.64) 83 11.7
(1.54) 90 11.0(1.31) 86 9.6
(1.25) 8 1.3(0.55)
55 ‐ 64 283 66.4 (3.12) 60 15.4
(2.53) 28 6.0(1.29) 22 6.1
(1.52) 17 3.5(1.01) 10 2.3
(0.87) 2 0.3(0.24)
65+ 322 89.5 (2.01) 19 5.6
(1.53) 6 1.5(0.64) 4 1.4
(0.80) 4 1.5(0.87) 1 0.1
(0.13) 1 0.3(0.29)
Total 1109 14.5 (0.59) 422 7.8
(0.51) 538 10.3(0.60) 798 17.9
(0.79) 1329
28.3(0.92) 1220 20.5
(0.77) 55 0.8(0.12)

22
Table 4: Total household income, men
Less than 3,000 riyal
3,000 to less than 5,000 riyal
5,000 to less than 7,000 riyal
7,000 to less than 10,000 riyal
10,000 to less than 15,000 riyal
15,000 riyal or more
Age N Weighted
% (SE) N Weighted % (SE) N Weighted %
(SE) N Weighted % (SE) N Weighted %
(SE) N Weighted % (SE)
15 ‐ 24 187 20.2(1.75) 183 19.5(1.72) 134 13.0(1.45) 160 19.3(1.77) 122 15.1(1.61) 95 12.9(1.48) 25 ‐ 34 118 10.5(1.18) 198 18.5(1.58) 231 19.7(1.58) 304 24.8(1.68) 171 13.5(1.27) 132 13.0(1.32) 35 ‐ 44 74 6.6(0.97) 122 11.0(1.20) 171 14.6(1.40) 222 20.7(1.67) 284 27.1(1.82) 180 20.0(1.65) 45 ‐ 54 47 7.3(1.38) 112 16.2(1.87) 95 13.4(1.62) 130 19.2(1.97) 131 19.9(1.99) 147 23.9(2.14) 55 ‐ 64 65 17.8(2.72) 104 27.9(3.02) 62 15.0(2.24) 49 12.4(2.25) 51 11.3(1.96) 62 15.6(2.28) 65+ 158 30.5(2.84) 110 29.2(3.09) 62 15.8(2.47) 42 9.2(1.80) 48 8.9(1.54) 32 6.5(1.64) Total 649 14.4(0.76) 829 18.7(0.83) 755 15.2(0.74) 907 19.7(0.84) 807 16.5(0.77) 648 15.3(0.74)
Table 5: Household income level, women
Less than 3,000 riyal
3,000 to less than 5,000 riyal
5,000 to less than 7,000 riyal
7,000 to less than 10,000 riyal
10,000 to less than 15,000 riyal 15,000 riyal or more
Age N Weighted
% (SE) N Weighted % (SE) N Weighted
% (SE) N Weighted % (SE) N Weighted %
(SE) N Weighted % (SE)
15 ‐ 24 173 21.7(1.91) 187 23.2(1.92) 135 13.5(1.49) 161 17.0(1.63) 122 13.2(1.45) 86 11.3(1.38) 25 ‐ 34 162 15.3(1.53) 220 20.2(1.71) 221 14.1(1.22) 307 25.2(1.67) 179 13.8(1.34) 121 11.3(1.32) 35 ‐ 44 125 14.1(1.58) 171 19.0(1.76) 175 16.2(1.55) 161 16.5(1.62) 179 19.1(1.68) 147 15.2(1.50) 45 ‐ 54 127 22.0(2.40) 130 19.4(2.01) 96 12.9(1.57) 89 15.0(1.81) 88 14.4(1.78) 88 16.3(2.01) 55 ‐ 64 122 31.1(3.47) 54 22.1(3.72) 46 15.6(2.80) 35 12.6(2.94) 34 10.2(2.09) 30 8.3(1.79) 65+ 174 57.1(4.13) 38 13.1(2.39) 21 11.9(2.98) 20 9.0(2.64) 11 4.9(1.85) 11 4.0(1.39) Total 883 20.7(0.93) 800 20.9(0.94) 694 14.1(0.74) 773 18.0(0.83) 613 14.1(0.74) 483 12.2(0.71)

23
Table 6: Smoking status, men
Never Ex Current daily Current non‐daily
Age N Weighted % SE N Weighted % SE N Weighted % SE N Weighted % SE
15 ‐ 24 943 81.2 1.46 42 2.7 0.55 191 14.9 1.33 11 1.2 0.4825 ‐ 34 771 62.0 1.83 83 7.6 1.01 374 29.0 1.72 19 1.4 0.3835 ‐ 44 688 60.5 1.92 105 8.8 1.08 321 29.6 1.82 14 1.1 0.3745 ‐ 54 455 63.5 2.34 66 10.0 1.51 188 25.7 2.13 8 0.8 0.3655 ‐ 64 279 61.8 3.09 66 13.5 1.95 89 23.1 2.82 5 1.6 0.8265+ 406 74.7 3.80 67 15.5 2.32 37 9.1 2.00 3 0.7 0.42Total 3,542 70.5 0.87 429 6.8 0.44 1,200 21.5 0.79 60 1.2 0.23 Table 7: Smoking status, women
Never Ex Current daily Current non‐daily
Age N Weighted % SE N Weighted
% SE N Weighted % SE N Weighted
% SE
15 ‐ 24 1,169 98.5 0.48 8 0.7 0.35 5 0.5 0.31 6 0.3 0.11 25 ‐ 34 1,475 98.5 0.37 6 0.4 0.17 11 0.5 0.17 6 0.6 0.29 35 ‐ 44 1,178 98.0 0.45 6 0.7 0.28 14 0.7 0.21 6 0.6 0.29 45 ‐ 54 771 96.5 0.84 2 0.5 0.50 24 2.9 0.69 1 0.1 0.08 55 ‐ 64 404 95.1 1.87 4 0.7 0.46 15 4.2 1.82 0 N/A N/A 65+ 347 98.0 0.81 3 0.3 0.19 8 1.7 0.79 0 N/A N/A Total 5,344 97.9 0.27 29 0.6 0.17 77 1.1 0.20 19 0.4 0.09

24
Table 8: Smokeless tobacco use
Men Women Total
Age N Weighted % SE N Weighted % SE N Weighted % SE
15 ‐ 24 19 1.1 0.33 0 N/A N/A 19 0.6 0.17 25 ‐ 34 33 1.6 0.37 4 0.4 0.37 37 1.1 0.26 35 ‐ 44 28 2.0 0.54 1 0 0.02 29 0.9 0.25 45 ‐ 54 14 1.8 0.66 2 0.6 0.53 16 1.2 0.42 55 ‐ 64 13 1.9 0.67 2 0.5 0.37 15 1.3 0.41 65+ 9 1.6 0.71 5 1.8 1.09 14 1.7 0.62 Total 116 1.5 0.20 14 0.3 0.11 130 0.9 0.12
Table 9: Mean age of smoking initiation
Men Women Total
Age N Mean Lower 95 % CI Upper 95% CI Mean Lower 95% CI Upper 95% CI Mean Lower 95% CI Upper 95% CI
15 ‐ 24 244 16.24 15.7 16.7 17.76 16.7 18.7 16.35 15.9 16.8 25 ‐ 34 478 18.67 18.2 19 18.43 14.3 22.5 18.66 18.2 19.0 35 ‐ 44 441 19.8 19.3 20.3 25.71 22.5 28.9 20.09 19.5 20.6 45 ‐ 54 263 20.66 19.8 21.4 23.31 17.5 29 20.86 20.0 21.7 55 – 64 160 20.61 19.6 21.5 18.5 12.2 24.7 20.43 19.4 21.4 65+ 107 22.37 20.7 24 22.5 14.3 30.6 22.38 20.8 24.0

25
Table 10: Mean years of smoking
Men Women Total
Age N Mean Lower 95% CI Upper 95% CI N Mean Lower 95% CI Upper 95% CI N Mean Lower 95% CI Upper 95% CI
15 ‐ 24 244 4.6 4.12 5.06 20 3.1 1.9 4.2 264 4.5 4.0 4.9 25 ‐ 34 478 11.4 10.9 11.84 24 11.2 6.5 15.8 502 11.4 10.9 11.8 35 ‐ 44 441 19.4 18.9 20.03 26 13.6 10.2 16.9 467 19.2 18.6 19.8 45 ‐ 54 263 28.5 27.6 29.47 27 25.7 20.2 31.2 290 28.3 27.4 29.3 55 ‐ 64 160 37.7 36.68 38.83 19 40.2 33.5 46.9 179 38 36.9 39.1 65+ 107 49.6 47.34 51.82 11 47.5 37.4 57.6 118 49.4 47.3 51.6
Table 11: Consumption of manufactured cigarettes
Men Women Total
Age N Weighted % SE N Weighted % SE N Weighted % SE
15 ‐ 24 195 15.6 1.38 10 0.7 0.33 205 8.3 0.75 25 ‐ 34 367 28.7 1.72 13 0.8 0.22 380 14.9 0.95 35 ‐ 44 312 28.7 1.82 8 0.6 0.25 320 13.2 0.92 45 ‐ 54 188 25.4 2.12 20 2.4 0.63 208 13.6 1.16 55 ‐ 64 89 23.2 2.82 7 3.3 1.81 96 14.3 1.81 65+ 38 9.3 2.00 7 1.6 0.76 45 6.1 1.24 Total 1,189 21.6 0.80 65 1.1 0.20 1,254 11.4 0.44

26
Table 12: Consumption of shisha
Men Women Total
Age N Weighted % SE N Weighted % SE N Weighted % SE
15 ‐ 24 191 14.7 1.33 10 0.7 0.33 201 7.9 0.73 25 ‐ 34 365 27.9 1.69 16 1.1 0.32 381 14.8 0.95 35 ‐ 44 314 28.1 1.78 17 1.1 0.32 331 13.3 0.91 45 ‐ 54 186 25.1 2.11 24 2.9 0.69 210 13.8 1.16 55 ‐ 64 86 23.0 2.84 13 4.0 1.81 99 14.5 1.83 65+ 35 8.5 1.88 8 1.8 0.79 43 5.8 1.18 Total 1,177 20.9 0.78 88 1.4 0.21 1,265 11.3 0.43
27
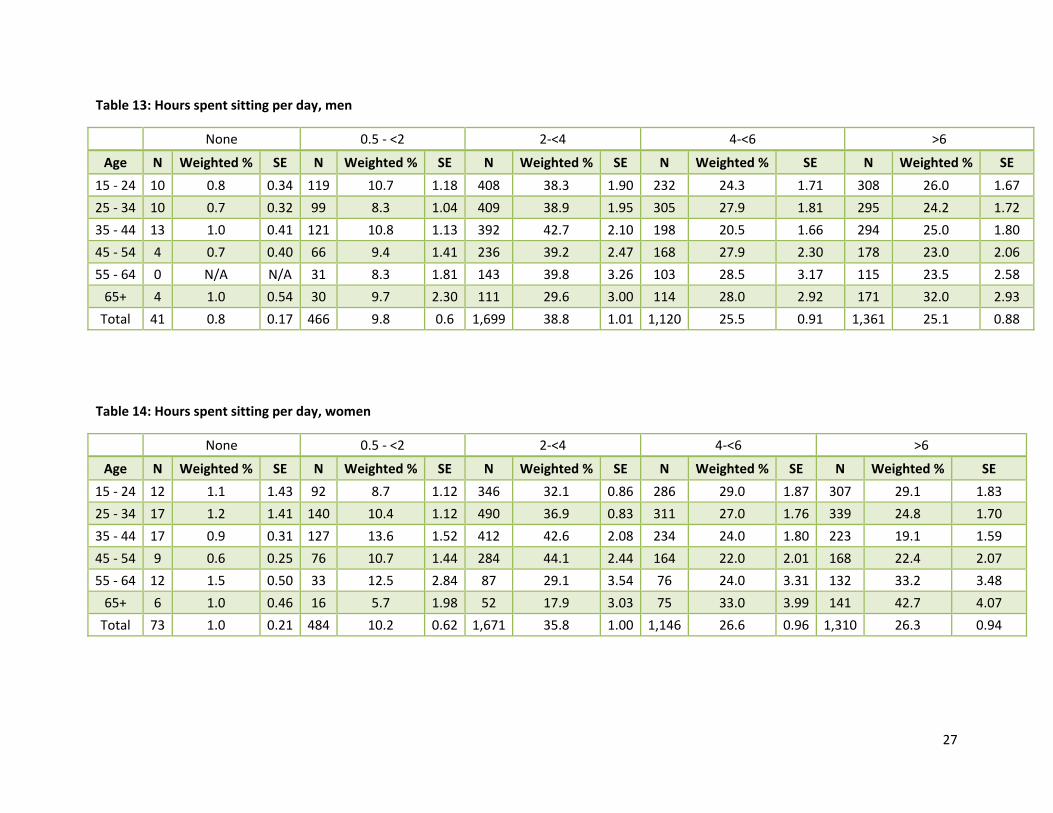
Table 13: Hours spent sitting per day, men
None 0.5 ‐ <2 2‐<4 4‐<6 >6
Age N Weighted % SE N Weighted % SE N Weighted % SE N Weighted % SE N Weighted % SE
15 ‐ 24 10 0.8 0.34 119 10.7 1.18 408 38.3 1.90 232 24.3 1.71 308 26.0 1.67 25 ‐ 34 10 0.7 0.32 99 8.3 1.04 409 38.9 1.95 305 27.9 1.81 295 24.2 1.72 35 ‐ 44 13 1.0 0.41 121 10.8 1.13 392 42.7 2.10 198 20.5 1.66 294 25.0 1.80 45 ‐ 54 4 0.7 0.40 66 9.4 1.41 236 39.2 2.47 168 27.9 2.30 178 23.0 2.06 55 ‐ 64 0 N/A N/A 31 8.3 1.81 143 39.8 3.26 103 28.5 3.17 115 23.5 2.58 65+ 4 1.0 0.54 30 9.7 2.30 111 29.6 3.00 114 28.0 2.92 171 32.0 2.93 Total 41 0.8 0.17 466 9.8 0.6 1,699 38.8 1.01 1,120 25.5 0.91 1,361 25.1 0.88
Table 14: Hours spent sitting per day, women
None 0.5 ‐ <2 2‐<4 4‐<6 >6
Age N Weighted % SE N Weighted % SE N Weighted % SE N Weighted % SE N Weighted % SE 15 ‐ 24 12 1.1 1.43 92 8.7 1.12 346 32.1 0.86 286 29.0 1.87 307 29.1 1.83 25 ‐ 34 17 1.2 1.41 140 10.4 1.12 490 36.9 0.83 311 27.0 1.76 339 24.8 1.70 35 ‐ 44 17 0.9 0.31 127 13.6 1.52 412 42.6 2.08 234 24.0 1.80 223 19.1 1.59 45 ‐ 54 9 0.6 0.25 76 10.7 1.44 284 44.1 2.44 164 22.0 2.01 168 22.4 2.07 55 ‐ 64 12 1.5 0.50 33 12.5 2.84 87 29.1 3.54 76 24.0 3.31 132 33.2 3.48 65+ 6 1.0 0.46 16 5.7 1.98 52 17.9 3.03 75 33.0 3.99 141 42.7 4.07 Total 73 1.0 0.21 484 10.2 0.62 1,671 35.8 1.00 1,146 26.6 0.96 1,310 26.3 0.94
28
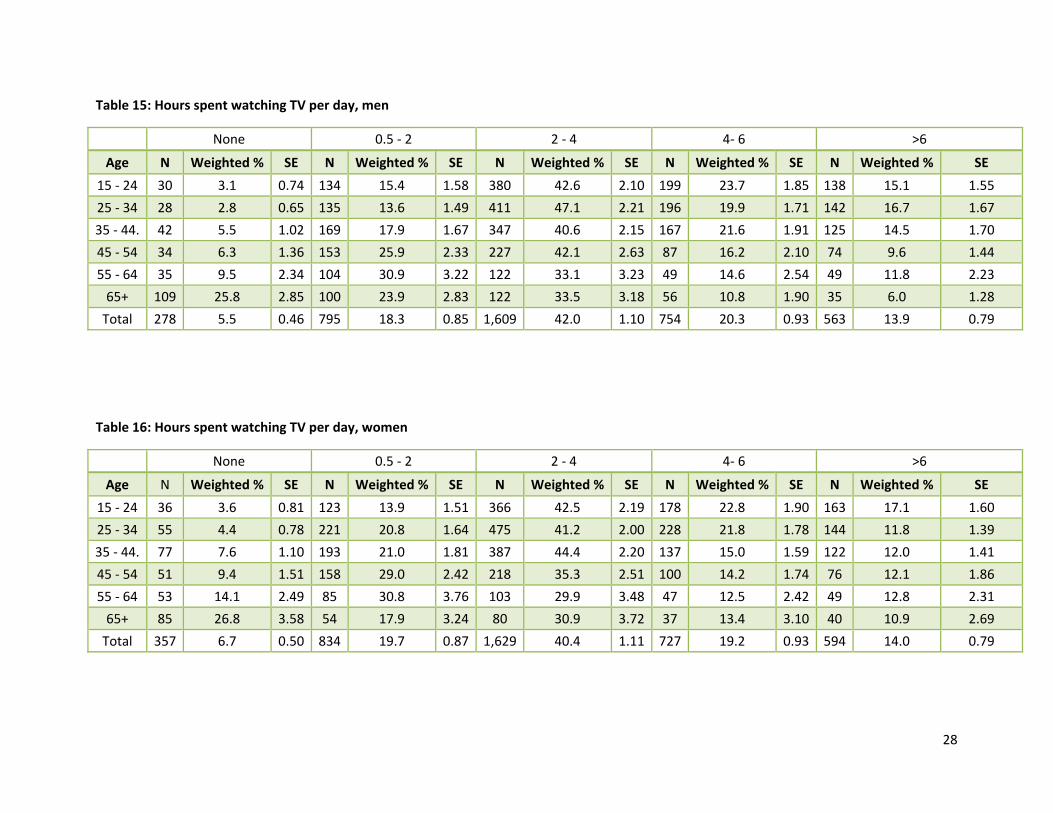
Table 15: Hours spent watching TV per day, men
None 0.5 ‐ 2 2 ‐ 4 4‐ 6 >6
Age N Weighted % SE N Weighted % SE N Weighted % SE N Weighted % SE N Weighted % SE
15 ‐ 24 30 3.1 0.74 134 15.4 1.58 380 42.6 2.10 199 23.7 1.85 138 15.1 1.55 25 ‐ 34 28 2.8 0.65 135 13.6 1.49 411 47.1 2.21 196 19.9 1.71 142 16.7 1.67 35 ‐ 44. 42 5.5 1.02 169 17.9 1.67 347 40.6 2.15 167 21.6 1.91 125 14.5 1.70 45 ‐ 54 34 6.3 1.36 153 25.9 2.33 227 42.1 2.63 87 16.2 2.10 74 9.6 1.44 55 ‐ 64 35 9.5 2.34 104 30.9 3.22 122 33.1 3.23 49 14.6 2.54 49 11.8 2.23 65+ 109 25.8 2.85 100 23.9 2.83 122 33.5 3.18 56 10.8 1.90 35 6.0 1.28 Total 278 5.5 0.46 795 18.3 0.85 1,609 42.0 1.10 754 20.3 0.93 563 13.9 0.79
Table 16: Hours spent watching TV per day, women
None 0.5 ‐ 2 2 ‐ 4 4‐ 6 >6
Age N Weighted % SE N Weighted % SE N Weighted % SE N Weighted % SE N Weighted % SE
15 ‐ 24 36 3.6 0.81 123 13.9 1.51 366 42.5 2.19 178 22.8 1.90 163 17.1 1.60 25 ‐ 34 55 4.4 0.78 221 20.8 1.64 475 41.2 2.00 228 21.8 1.78 144 11.8 1.39 35 ‐ 44. 77 7.6 1.10 193 21.0 1.81 387 44.4 2.20 137 15.0 1.59 122 12.0 1.41 45 ‐ 54 51 9.4 1.51 158 29.0 2.42 218 35.3 2.51 100 14.2 1.74 76 12.1 1.86 55 ‐ 64 53 14.1 2.49 85 30.8 3.76 103 29.9 3.48 47 12.5 2.42 49 12.8 2.31 65+ 85 26.8 3.58 54 17.9 3.24 80 30.9 3.72 37 13.4 3.10 40 10.9 2.69 Total 357 6.7 0.50 834 19.7 0.87 1,629 40.4 1.11 727 19.2 0.93 594 14.0 0.79

29
Table 17: Physical activity level*, men
Not active Low Moderate High level
Age N Weighted % SE N Weighted % SE N Weighted % SE N Weighted % SE
15 ‐ 24 223 16.9 1.33 217 18.2 1.45 194 17.2 1.38 555 47.7 1.8525 ‐ 34 362 27.8 1.63 252 20.2 1.51 185 14.2 1.38 455 37.8 1.8335 ‐ 44 321 26.2 1.64 276 29.5 1.86 183 15.9 1.49 352 28.4 1.6945 ‐ 54 188 21.9 1.86 209 31.3 2.25 121 17.3 1.78 204 29.6 2.2355 ‐ 64 149 27.2 2.63 118 31.0 2.99 77 19.1 2.56 95 22.7 2.6765+ 232 37.9 2.82 128 27.1 2.71 65 12.2 1.94 92 22.8 2.65Total 1,475 22.9 0.76 1,200 23.1 0.81 825 16.2 0.73 1,753 37.8 0.97*A low level of physical activity is considered as a total of less than 150 minutes of moderate to intense activity per week. A moderate level ofphysical activity is considered as a total of 15–300 minutes of moderate to intense activity per week. A high level of physical activity is considered as a total of more than 450 minutes of moderate to intense activity per week.
Table 18: Activity level*, women
Not active Low Moderate High Level
Age N Weighted % SE N Weighted % SE N Weighted % SE N Weighted % SE 15 ‐ 24 520 41.6 1.84 339 30.9 1.78 143 11.1 1.15 191 16.5 1.3925 ‐ 34 730 45.1 1.76 382 27.6 1.65 137 9.1 1.08 254 18.2 1.4535 ‐ 44 627 48.1 1.90 297 28 1.75 111 8.6 1.10 172 15.3 1.4445 ‐ 54 418 51.6 2.31 204 26.4 2.04 81 9.4 1.28 95 12.5 1.5455 ‐ 64 247 54.2 3.44 96 28.3 3.28 31 4.9 1.00 49 12.6 2.3865+ 257 70.6 3.69 56 20.7 3.62 23 4.2 1.21 22 4.5 1.21Total 2,799 46.5 0.97 1,374 28.6 0.91 526 9.4 0.57 783 15.5 0.72*A low level of physical activity is considered as a total of less than 150 minutes of moderate to intense activity per week. A moderate level ofphysical activity is considered as a total of 15–300 minutes of moderate to intense activity per week. A high level of physical activity is considered as a total of more than 450 minutes of moderate to intense activity per week.

30
Table 19: Body mass index (BMI)*, men
< 18.5 kg/m2 18.5 – 25.0 kg/m2 25.0 – 30.0kg/m2 30.0 ‐ 40.0 kg/m2 > 40 kg/m2
Age N Weighted % SE N Weighted % SE N Weighted % SE N Weighted % SE N Weighted % SE
15 ‐ 24 164 14.4 1.32 544 47.4 1.89 284 24.9 1.56 131 11.3 1.23 26 2.1 0.52 25 ‐ 34 41 3.6 0.85 376 32.1 1.80 479 39.4 1.85 286 21.9 1.54 40 3.1 0.69 35 ‐ 44 9 1.0 0.39 252 23.7 1.75 439 37.9 1.90 352 33.1 1.86 47 4.3 0.81 45 ‐ 54 8 1.9 0.78 160 21.6 1.94 275 40.6 2.41 232 34.6 2.36 13 1.3 0.46 55 ‐ 64 3 0.6 0.39 101 24.0 2.80 175 39.5 3.07 136 33.3 3.05 13 2.6 0.90 65+ 13 2.0 0.72 152 31.9 2.90 196 38.3 2.94 136 26.4 2.62 5 1.4 0.74 Total 238 7.1 0.59 1,585 35.4 0.98 1,848 33.4 0.91 1,273 21.6 0.78 144 2.5 0.30 *BMI is calculated as the person’s weight in kilograms divided by their squared height in meters. Table 20: Body mass index (BMI)*, women
< 18.5 kg/m2 18.5 – 25.0 kg/m2 25.0 – 30.0 kg/m2 30.0 ‐ 40.0 kg/m2 > 40 kg/m2
Age N Weighted % SE N Weighted % SE N Weighted % SE N Weighted % SE N Weighted % SE
15 ‐ 24 131 12.3 1.27 568 50.5 1.92 272 23.4 1.60 152 12.0 1.19 18 1.9 0.53 25 ‐ 34 49 4.2 0.78 422 29.0 1.66 509 33.6 1.71 413 28.9 1.63 54 4.4 0.81 35 ‐ 44 13 1.8 0.57 210 18.0 1.51 377 30.7 1.75 483 43.7 1.95 67 5.8 0.89 45 ‐ 54 8 0.7 0.29 91 13.8 1.67 225 28 2.05 371 47.1 2.34 78 10.5 1.48 55 ‐ 64 2 0.2 0.15 42 9.4 1.79 109 27.3 3.18 203 53.5 3.51 42 9.6 1.94 65+ 6 2.0 1.00 70 20.8 3.01 107 33.6 3.70 145 39.9 3.68 12 3.7 1.22 Total 209 6.3 0.55 1,403 32.3 0.98 1,599 28 0.87 1,767 28.8 0.85 271 4.7 0.39 *BMI is calculated as the person’s weight in kilograms divided by their squared height in meters.

31
Table 21: Mean BMI
Men Women Total
Age N Mean SE N Mean SE N Mean SE 15 ‐ 24 1,134 24.2 0.22 1,134 24.4 0.21 2,268 24.3 0.1525 ‐ 34 1,213 27.2 0.22 1,435 27.7 0.21 2,648 27.5 0.1535 ‐ 44 1,090 28.8 0.22 1,140 30.1 0.24 2,230 29.5 0.1745 ‐ 54 684 28.5 0.24 761 31.3 0.29 1,445 29.9 0.1955 ‐ 64 426 28.5 0.33 393 32.0 0.37 819 30.1 0.2665+ 500 27.4 0.32 339 29.5 0.45 839 28.2 0.27

32
Table 22: Daily servings of fruit, men
<1 1 2 – 4 >5
Age N Weighted % SE N Weighted % SE N Weighted % SE N Weighted % SE
15 ‐ 24 918 81.6 1.47 131 11.7 1.25 64 5.6 0.84 15 1.1 0.3425 ‐ 34 918 77.0 1.68 143 13.4 1.38 95 8.1 1.10 19 1.5 0.4035 ‐ 44 796 73.9 1.77 156 14.3 1.36 92 8.7 1.22 31 3.0 0.6845 ‐ 54 471 67.7 2.28 105 15.6 1.78 90 14.3 1.73 19 2.4 0.6655 ‐ 64 294 75.3 2.72 64 13.0 1.90 40 9.8 2.06 7 1.9 0.8665+ 344 73.4 2.62 78 15.4 2.14 51 9.6 1.74 12 1.6 0.54Total 3,741 77.0 0.82 677 13.2 0.68 432 8.1 0.52 103 1.7 0.21 Table 23: Daily servings of fruit, women
<1 1 2 – 4 >5
Age N Weighted % SE N Weighted % SE N Weighted % SE N Weighted % SE 15 ‐ 24 922 84.0 1.41 119 10.3 1.19 71 5.6 0.82 8 0.6 0.28 25 ‐ 34 1,105 81.0 1.40 181 11.2 1.09 97 6.0 0.81 25 2.1 0.61 35 ‐ 44 848 74.0 1.77 155 14.7 1.49 110 9.7 1.13 15 1.6 0.50 45 ‐ 54 556 78.0 1.93 110 13.0 1.54 50 6.4 1.14 17 2.7 0.79 55 ‐ 64 295 76.0 3.09 47 10.9 1.97 28 10.8 2.58 9 2.1 0.87 65+ 260 77.0 3.58 47 14.7 3.06 20 6.9 2.14 2 1.5 1.22 Total 3,986 80.0 0.78 659 11.8 0.64 376 6.8 0.47 76 1.5 0.22

33
Table 24: Daily consumption of five or more servings of fruit
Men Women Total
Age N Weighted % SE N Weighted % SE N Weighted % SE
15 ‐ 24 15 1.1 0.34 8 0.6 0.28 23 0.9 0.22 25 ‐ 34 19 1.5 0.40 25 2.1 0.61 44 1.8 0.36 35 ‐ 44 31 3.0 0.68 15 1.6 0.50 46 2.2 0.41 45 ‐ 54 19 2.4 0.66 17 2.7 0.79 36 2.6 0.51 55 ‐ 64 7 1.9 0.86 9 2.1 0.87 16 2.0 0.61 65+ 12 1.6 0.54 2 1.5 1.22 14 1.6 0.59 Total 103 1.7 0.21 76 1.5 0.22 179 1.6 0.16 Table 25: Daily servings of vegetables, men
<1 1 2 – 4 >5
Age N Weighted % SE N Weighted % SE N Weighted % SE N Weighted % SE 15 ‐ 24 722 65.7 1.75 263 22.3 1.52 148 9.9 1.06 23 2.0 0.5525 ‐ 34 684 59.7 1.88 278 24.3 1.64 186 12.7 1.24 35 3.3 0.6135 ‐ 44 600 57.8 1.94 259 24 1.71 199 14.3 1.25 41 3.8 0.7645 ‐ 54 386 56.3 2.41 158 23.5 2.12 124 16.2 1.71 26 4.1 0.9555 ‐ 64 225 54.8 3.26 104 28.3 3.01 68 14.0 2.26 13 2.9 0.9165+ 313 65.7 2.85 93 17.1 2.18 78 15.0 2.18 11 2.2 0.84Total 2,930 61.5 0.95 1,155 23.3 0.83 803 12.4 0.61 149 2.9 0.31

34
Table 26: Daily servings of vegetables, women
<1 1 2 – 4 >5
Age N Weighted % SE N Weighted % SE N Weighted % SE N Weighted % SE
15 ‐ 24 697 57.7 1.91 295 26.8 1.73 120 10.8 1.19 34 4.7 0.9525 ‐ 34 831 58.7 1.81 383 25.9 1.64 184 11.2 1.10 45 4.2 0.8435 ‐ 44 652 57.3 1.91 309 25.5 1.68 163 12.8 1.26 38 4.4 0.8745 ‐ 54 430 57.5 2.33 196 25.2 2.00 107 13.7 1.72 26 3.6 0.8555 ‐ 64 209 52.6 3.59 102 25.4 3.03 64 16.0 2.69 13 5.9 2.1265+ 215 57.5 3.92 74 22.9 3.29 39 14.8 3.06 6 4.8 2.22Total 3,034 57.5 0.98 1,359 26.0 0.89 677 12.0 0.63 162 4.5 0.47 Table 27: Daily consumption of more than five servings of vegetables
Men Women Total
Age N Weighted % SE N Weighted % SE N Weighted % SE
15 ‐ 24 23 2.0 0.55 34 4.7 0.95 57 3.3 0.54 25 ‐ 34 35 3.3 0.61 45 4.2 0.84 80 3.8 0.52 35 ‐ 44 41 3.8 0.76 38 4.4 0.87 79 4.2 0.59 45 ‐ 54 26 4.1 0.95 26 3.7 0.85 52 3.9 0.64 55 ‐ 64 13 2.9 0.91 13 5.9 2.12 26 4.2 1.08 65+ 11 2.2 0.85 6 4.8 2.20 17 3.2 1.03 Total 149 2.9 0.31 162 4.5 0.47 311 3.7 0.28

35
Table 28: Daily servings of fresh juice, men
<1 1 2 – 4 >5
Age N Weighted % SE N Weighted % SE N Weighted % SE N Weighted % SE
15 ‐ 24 1,038 91.6 1.07 58 5.7 0.88 19 2.2 0.62 8 0.5 0.2325 ‐ 34 1,047 89.5 1.20 80 7.0 0.94 25 2.7 0.76 10 0.8 0.2835 ‐ 44 986 90.6 1.20 59 6.4 1.01 24 2.2 0.53 7 0.9 0.4645 ‐ 54 607 87.6 1.63 44 7.4 1.28 26 4.1 0.96 6 0.9 0.5555 ‐ 64 373 92.5 1.62 21 5.0 1.35 7 1.3 0.59 4 1.2 0.7365+ 457 93.4 1.58 19 4.9 1.41 7 1.6 0.77 2 0.1 0.09Total 4,508 90.7 0.59 281 6.2 0.48 108 2.4 0.33 37 0.7 0.15
Table 29: Daily servings of fresh juice, women
<1 1 2 – 4 >5
Age N Weighted % SE N Weighted % SE N Weighted % SE N Weighted % SE
15 ‐ 24 1,025 92.5 1.00 55 4.8 0.80 19 2.1 0.57 6 0.6 0.28 25 ‐ 34 1,293 90.1 1.22 76 6.9 1.05 27 2.1 0.61 9 0.9 0.33 35 ‐ 44 1,014 90.6 1.15 64 5.8 0.84 26 3.2 0.75 2 0.5 0.35 45 ‐ 54 699 94.3 1.09 26 3.8 0.86 8 1.2 0.53 3 0.7 0.44 55 ‐ 64 356 91.7 2.01 18 6.5 1.82 6 1.9 0.92 0 N/A N/A 65+ 308 93.1 1.83 13 4.8 1.58 6 1.2 0.66 2 0.9 0.72 Total 4,695 91.9 0.55 252 5.4 0.45 92 2.1 0.30 22 0.6 0.16

36
Table 30: Daily consumption of more than five servings of fresh juice
Men Women Total
Age N Weighted % SE N Weighted % SE N Weighted % SE
15 ‐ 24 8.0 0.5 0.23 6.0 0.6 0.28 14.0 0.6 0.18 25 ‐ 34 10.0 0.8 0.28 9.0 0.9 0.33 19.0 0.8 0.22 35 ‐ 44 7.0 0.9 0.46 2.0 0.5 0.35 9.0 0.6 0.28 45 ‐ 54 6.0 0.9 0.55 3.0 0.7 0.44 9.0 0.8 0.35 55 ‐ 64 4.0 1.2 0.73 0.0 N/A N/A 4.0 0.7 0.41 65+ 2.0 0.1 0.09 2.0 0.9 0.72 4.0 0.4 0.29 Total 37.0 0.7 0.15 22.0 0.6 0.16 59.0 0.6 0.11 Table 31: Daily servings of fruit, fresh juice, and vegetables, men
<1 1 2 – 4 >5
Age N Weighted % SE N Weighted % SE N Weighted % SE N Weighted % SE 15 ‐ 24 384 36.1 1.82 405 32.7 0.74 323 25.8 1.60 63 5.4 0.8625 ‐ 34 328 27.8 1.77 407 34.4 0.81 405 30.5 1.71 82 7.4 1.0035 ‐ 44 263 25.6 1.74 393 34.9 0.87 361 31.4 1.83 100 8.1 1.0045 ‐ 54 150 21.8 2.04 235 33.4 2.28 244 33.1 2.26 79 11.7 1.5255 ‐ 64 123 32.9 3.11 143 31.7 2.88 126 27.3 2.81 35 8.2 1.7465+ 172 34.6 2.87 140 28.8 2.74 158 30.2 2.78 39 6.3 1.27Total 1,420 30.9 0.94 1,723 33.2 0.92 1,617 28.7 0.87 398 7.2 0.49

37
Table 32: Daily servings of fruit, fresh juice, and vegetables, women
<1 1 2 – 4 >5
Age N Weighted % SE N Weighted % SE N Weighted % SE N Weighted % SE
15 ‐ 24 399 36.2 1.83 403 31.0 1.73 303 24.8 1.64 66 8.0 1.1225 ‐ 34 385 29.6 1.65 528 35.2 1.74 471 27.7 1.56 91 7.5 1.0535 ‐ 44 306 27.8 1.74 445 35.1 1.82 342 28.3 1.74 89 8.9 1.1445 ‐ 54 239 32.9 2.23 272 33.6 2.16 222 26.6 2.04 52 6.9 1.2055 ‐ 64 112 27.0 3.10 143 32.8 3.22 122 30.9 3.17 28 9.2 2.4765+ 131 35.5 3.50 112 29.1 3.42 90 26.2 2.26 14 9.3 3.00Total 1,572 32.4 0.93 1903 33.0 0.91 1,550 26.6 0.86 340 8.0 0.57
Table 33: Daily consumption of more than five servings of fruit, fresh juice and vegetables.
Men Women Total
Age N Weighted % SE N Weighted % SE N Weighted % SE 15 ‐ 24 63 5.4 0.86 66 8 1.12 129 6.6 0.71 25 ‐ 34 82 7.4 1.00 91 7.5 1.05 173 7.4 0.73 35 ‐ 44 100 8.1 1.00 89 8.9 1.15 189 8.5 0.77 45 ‐ 54 79 11.7 1.52 52 6.9 1.20 131 9.3 0.97 55 ‐ 64 35 8.2 1.74 28 9.2 2.47 63 8.7 1.46 65+ 39 6.3 1.27 14 9.3 2.99 53 7.5 1.43 Total 398 7.2 0.49 340 8.0 0.57 738 7.6 0.38

38
Table 34: Mean of fruit, fresh juice, and vegetable servings consumed per day
Men Women Total
Age N mean Lower CI Upper CI N mean Lower CI Upper CI N mean Lower CI Upper CI
15 ‐ 24 1,189 0.1 0.06 0.2 1,193 0.1 0.04 0.18 2,382 0.1 0.08 0.17 25 ‐ 34 1,254 0.3 0.24 0.38 1,503 0.3 0.28 0.39 2,757 0.3 0.28 0.37 35 ‐ 44 1,132 0.4 0.37 0.49 1,207 0.3 0.27 0.39 2,339 0.4 0.33 0.42 45 ‐ 54 722 0.5 0.45 0.61 798 0.3 0.17 0.33 1,520 0.4 0.33 0.44 55 ‐ 64 439 0.3 0.2 0.42 423 0.2 0.13 0.36 862 0.3 0.2 0.36 65+ 517 0.2 0.04 0.27 358 ‐0.1 ‐0.2 0.09 875 0.1 ‐0.02 0.16

39
Table 35: Self‐rated health, men
Excellent or very good Good Fair or poor
Age N Weighted % SE N Weighted % SE N Weighted % SE
15 ‐ 24 1,075 90.3 1.12 84 7.5 1.00 29 2.2 0.54 25 ‐ 34 1,098 87.7 1.17 123 10.1 1.09 31 2.1 0.46 35 ‐ 44. 938 79.9 1.72 155 17.0 1.63 34 3.1 0.73 45 ‐ 54 509 67.2 2.29 156 24.7 2.11 55 8.1 1.37 55 ‐ 64 249 56.2 3.12 124 30.5 2.92 66 13.3 2.03 65+ 171 31.9 2.79 184 38.0 2.93 161 30.1 2.69 Total 4,040 80.3 0.73 826 14.5 0.65 376 5.1 0.38
Table 36: Self‐rated health, women
Excellent or very good Good Fair or poor
Age N Weighted % SE N Weighted % SE N Weighted % SE 15 ‐ 24 1,010 85.0 1.35 146 11.4 1.18 33 3.6 0.7425 ‐ 34 1,232 83.1 1.27 222 14.6 1.21 45 2.3 0.4535 ‐ 44. 857 71.0 1.73 289 23.6 1.59 59 5.4 0.9345 ‐ 54 433 54.8 2.31 266 34.2 2.19 94 11.0 1.5155 ‐ 64 161 41.8 3.46 148 37.3 3.28 110 20.9 2.5165+ 87 26.5 3.24 122 37.1 3.70 148 36.5 3.58Total 3,780 73.8 0.81 1,h193 19.5 0.72 489 6.7 0.45

40
Table 37: Last routine medical checkup, men
Never Within 2013 Within 2012 2‐ 6 years ago
Age N Weighted % SE N Weighted % SE N Weighted % SE N Weighted % SE
15 ‐ 24 1,015 86.5 1.28 85 7.3 1.00 56 3.9 0.71 31 2.2 0.5425 ‐ 34 950 76.4 1.59 159 13.6 1.30 86 5.1 0.73 57 4.9 0.8435 ‐ 44. 766 66.6 1.87 202 18.9 1.58 97 8.6 1.05 66 5.9 1.0245 ‐ 54 436 56.8 2.38 188 29.2 2.23 64 9.9 1.42 34 4.1 0.8655 ‐ 64 250 59.5 3.07 122 24.7 2.60 42 9.3 1.89 25 6.5 1.6365+ 311 58.1 2.95 148 30.7 2.79 43 8.9 1.69 15 2.3 0.69Total 3,728 74.8 0.81 904 15.2 0.66 388 6.2 0.43 228 3.8 0.36 Table 38: Last routine medical checkup, women
Never Within 2013 Within 2012 2‐6 years ago
Age N Weighted % SE N Weighted % SE N Weighted % SE N Weighted % SE 15 ‐ 24 983 83.4 1.35 117 9.0 1.02 60 4.9 0.79 33 2.6 0.6025 ‐ 34 1,149 76.2 1.52 215 13.5 1.17 83 5.8 0.84 56 4.5 0.8335 ‐ 44. 902 73.1 1.68 194 16.6 1.39 76 7.3 1.03 35 3.0 0.6345 ‐ 54 536 67.5 1.16 178 21.2 1.85 54 7.6 1.26 29 3.8 0.9055 ‐ 64 282 66.9 3.16 105 23.8 2.81 27 6.7 1.66 8 2.6 1.2065+ 209 60.7 3.63 110 27.6 3.23 31 10.5 2.46 7 1.2 0.52Total 4,061 76.3 0.79 919 14.3 0.62 331 6.2 0.45 168 3.2 0.34

41
Table 39: Distance traveled for medical checkup, men
< 5 km 5 ‐ 10 km 10 ‐ 50 km 50 ‐ 100 km
Age N Weighted % SE N Weighted % SE N Weighted % SE N Weighted % SE
15 ‐ 24 143 71.4 4.17 35 18.7 3.78 20 8.9 2.33 3 0.9 0.8025 ‐ 34 203 63.8 3.41 62 18.9 2.91 64 16.0 2.27 4 1.3 0.8235 ‐ 44. 238 60.8 3.34 72 19.0 2.62 68 19.8 2.82 2 0.5 0.3445 ‐ 54 182 66.3 3.48 51 16.5 2.68 47 16.3 2.72 2 0.9 0.7355 ‐ 64 117 62.8 4.63 36 19.5 3.93 29 16.8 3.49 3 0.9 0.5665+ 125 55.9 4.63 32 19.4 4.00 46 23.0 3.81 3 1.7 1.14Total 1,008 64.9 1.62 288 18.5 1.39 274 15.6 1.14 17 1.0 0.32 Table 40: Distance traveled for medical checkup, women
< 5 km 5 ‐ 10 km 10 ‐ 50 km 50 ‐ 100 km
Age N Weighted % SE N Weighted % SE N Weighted % SE N Weighted % SE 15 ‐ 24 97 54.3 4.85 36 18.8 3.90 44 26.6 4.25 1 0.3 0.3325 ‐ 34 162 58.2 3.94 67 21.4 3.50 56 18.6 2.94 6 1.7 0.8635 ‐ 44. 110 49.3 4.36 49 21.7 3.60 53 24.1 3.78 6 4.9 2.5245 ‐ 54 117 54.1 4.22 56 20.5 3.23 51 22.5 3.61 4 2.9 1.5455 ‐ 64 65 60.4 6.06 24 22.8 5.82 25 14.3 3.14 3 2.5 1.4565+ 69 58.8 6.06 19 16.9 4.59 30 22.1 4.81 2 2.1 1.52Total 620 55.0 2.02 251 20.4 1.69 259 22.4 1.71 22 2.1 0.57

42
Table 41: Hypertension* including those on drugs
Men Women Total
Age N Weighted % SE N Weighted % SE N Weighted % SE
15 ‐ 24 50 4.2 0.75 24 2.4 0.63 74 3.4 0.49 25 ‐ 34 135 10.3 1.06 69 4.1 0.66 204 7.3 0.63 35 ‐ 44 216 21.1 1.61 149 13.3 1.37 365 16.9 1.05 45 ‐ 54 232 35.3 2.37 224 26.9 2.04 456 31 1.56 55 ‐ 64 209 48.3 3.17 214 48.4 3.44 423 48.4 2.33 65+ 318 68 2.66 217 60.9 3.62 535 65.2 2.16 Total 1,160 17.7 0.67 897 12.5 0.57 2,057 15.1 0.44 *An individual is considered hypertensive if their systolic blood pressure was 140 mmHg or more, or if their diastolic blood pressure was 90 mmHg or more, or if they have been diagnosed and are currently treated for hypertension but their systolic and diastolic blood pressure are below the cited cut‐off points. Table 42: Status of diagnosis, treatment, and control among those who are hypertensive, men
Undiagnosed Untreated Treated controlled Treated uncontrolled
Age N Weighted % SE N Weighted % SE N Weighted % SE N Weighted % SE
15 ‐ 24 48 97.8 1.62 1 1.0 0.98 0 N/A N/A 1 1.3 1.2725 ‐ 34 104 77.4 4.51 14 10.6 3.09 10 8.5 3.48 6 3.5 1.5135 ‐ 44 160 74.7 3.67 17 7.4 2.07 18 10.2 2.74 16 7.7 2.1345 ‐ 54 136 61.7 4.12 13 5.3 1.76 35 16.7 3.29 44 16.3 2.9155 ‐ 64 93 41.6 4.64 11 5.7 2.13 42 20.4 3.80 62 32.3 4.5465+ 117 39.0 3.71 17 4.6 1.47 60 17.6 2.88 117 38.8 3.74Total 658 61.2 1.90 73 5.8 0.82 165 13.9 1.38 246 19.1 1.50

43
Table 43: Status of diagnosis, treatment and control among those who are hypertensive, women
Undiagnosed Untreated Treated controlled Treated uncontrolled
Age N Weighted % SE N Weighted % SE N Weighted % SE N Weighted % SE 15 ‐ 24 22 95.6 3.25 0 N/A N/A 1 2.6 2.59 1 1.9 1.8925 ‐ 34 57 84.8 5.28 4 7.3 3.97 3 4.0 2.99 3 3.9 2.2635 ‐ 44 97 63.7 5.44 9 9.9 4.12 22 12.1 3.14 18 14.3 3.9445 ‐ 54 103 45.0 4.34 11 5.8 2.39 44 21.6 3.76 64 27.5 4.0355 ‐ 64 84 44.7 4.97 4 1.4 2.94 64 30.2 4.25 57 23.8 4.0965+ 68 32.1 4.71 12 4.2 1.38 61 30.0 4.74 73 33.7 4.66Total 431 52.9 2.37 40 4.9 1.10 195 20.5 1.83 216 21.7 1.89 Table 44: Mean of measured systolic blood pressure
Men Women Total
Age N Mean SE N Mean SE N Mean SE 15 ‐ 24 1,180 116.0 0.38 1,178 109.1 0.43 2,358 112.6 0.3025 ‐ 34 1,238 120.0 0.34 1,489 111.3 0.39 2,727 115.8 0.2835 ‐ 44 1,122 123.3 0.49 1,183 116.0 0.49 2,305 119.3 0.3645 ‐ 54 705 129.0 0.75 789 123.3 0.83 1,494 126.1 0.5755 ‐ 64 435 135.1 1.14 417 129.2 1.32 852 132.5 0.8865+ 514 142.3 1.33 355 136.7 1.91 869 140.0 1.14

44
Table 45: Mean of measured diastolic blood pressure
Men Women Total
Age N Mean SE N Mean SE N Mean SE 15 ‐ 24 1,179 74.1 0.30 1,175 72.8 0.28 2,354 73.5 0.2025 ‐ 34 1,228 78.4 0.27 1,484 74.8 0.28 2,712 76.6 0.2035 ‐ 44 1,119 81.4 0.38 1,180 77.7 0.33 2,299 79.4 0.2545 ‐ 54 705 83.2 0.45 789 81.1 0.46 1,494 82.1 0.3355 ‐ 64 435 85.8 0.57 415 83.1 0.75 850 84.6 0.4665+ 514 84.5 0.70 355 83.3 0.94 869 84.0 0.57
Table 46: Measured pre‐hypertension
Men Women Total
Age N Weighted % SE N Weighted % SE N Weighted % SE 15 ‐ 24 454 38.7 1.82 295 24.5 1.62 749 31.8 1.2425 ‐ 34 651 54.7 1.88 485 34.4 1.73 1,136 44.8 1.3135 ‐ 44 610 54.6 1.96 501 43.3 1.92 1,111 48.4 1.3845 ‐ 54 373 51.4 2.43 366 37.1 2.32 739 49.2 1.6855 ‐ 64 224 53.3 3.16 186 43.3 3.41 410 49.3 2.3365+ 201 32.8 2.65 141 39.2 3.63 342 35.4 2.17Total 2,513 46.5 0.98 1,974 34.3 0.91 4,487 40.5 0.68*An individual is considered pre‐hypertensive if their systolic blood pressure was 120 mmHg to less than 140 mmHg, or if their diastolic blood pressure was 80 mmHg to less than 90 mmHg

45
Table 47: Diabetes* including those on drugs
Men Women Total
Age N Weighted % SE N Weighted % SE N Weighted % SE
15 ‐ 24 30 4.0 0.96 37 5.4 1.19 67 4.7 0.76 25 ‐ 34 47 9.5 1.74 51 5.9 1.07 98 7.8 1.06 35 ‐ 44 86 14.5 1.90 79 10.5 1.58 165 12.4 1.23 35 ‐ 44 123 30.9 3.22 136 22.5 2.52 259 26.9 2.09 55 ‐ 64 132 53.0 4.53 107 41.6 4.93 239 47.8 3.36 65+ 175 51.8 3.94 96 48.2 5.02 271 50.4 3.11 Total 593 14.8 0.88 506 11.7 0.79 1,099 13.4 0.59 *An individual is considered diabetic if their blood HbA1c level was 6.5% or more, or if they have been diagnosed and are currently treated for diabetes but their blood HbA1c level was less than 6.5%. Table 48: Status of diagnosis, treatment, and control among those who are diabetic, men
Undiagnosed Untreated Treated controlled Treated uncontrolled
Age N Weighted % SE N Weighted % SE N Weighted % SE N Weighted % SE
15 ‐ 24 25 92.8 3.83 1 1.4 1.43 0 N/A N/A 3 5.7 3.5025 ‐ 34 29 71.7 7.77 1 1.4 1.45 14 26.0 7.60 2 0.9 0.6835 ‐ 44 41 42.5 6.80 3 2.3 1.47 23 28.6 6.36 18 26.5 6.3345 ‐ 54 38 24.5 5.05 6 3.5 1.65 51 50.5 6.20 26 21.5 4.8155 ‐ 64 32 24.0 5.38 1 0.4 0.42 53 38.5 5.57 45 37.1 5.7065+ 29 19.2 5.88 2 1.2 1.09 70 46.1 5.70 73 33.5 5.21Total 194 40.2 3.14 14 1.8 0.54 211 35.1 2.76 167 22.9 2.31

46
Table 49: Status of diagnosis, treatment, and control among those who are diabetic, women
Undiagnosed Untreated Treated controlled Treated uncontrolled
Age N Weighted % SE N Weighted % SE N Weighted % SE N Weighted % SE
15 ‐ 24 29 84.8 6.40 0 N/A N/A 5 12.7 6.11 2 2.6 1.8425 ‐ 34 40 81.0 6.68 0 N/A N/A 6 9.8 5.08 5 9.2 4.7935 ‐ 44 47 54.6 7.95 0 N/A N/A 18 23.3 6.28 14 22.0 7.0045 ‐ 54 44 31.8 5.49 1 0.1 0.07 35 27.3 5.50 56 40.9 6.1155 ‐ 64 24 33.8 7.80 2 0.3 0.24 50 45.1 7.02 31 20.8 4.8065+ 11 10.0 4.02 3 3.4 2.35 39 44.1 7.14 41 42.6 7.25Total 195 48.4 3.33 6 0.5 0.30 153 27.8 2.71 149 23.4 2.49 Table 50: Pre‐diabetes* measured by HbA1C
Men Women Total
Age N Weighted % SE N Weighted % SE N Weighted % SE
15 ‐ 24 77 12.9 1.95 75 14.1 2.09 152 13.5 1.43 25 ‐ 34 85 15.4 2.03 105 13.1 1.71 190 14.3 1.34 35 ‐ 44 114 22.7 2.59 131 17.9 1.97 145 20.2 1.62 45 ‐ 54 85 21.0 2.88 92 19.8 2.70 177 20.5 1.98 55 ‐ 64 61 28.4 4.25 44 17.1 4.03 105 23.2 2.98 65+ 66 21.0 3.26 44 21.3 1.03 110 21.2 2.53 Total 488 17.0 1.10 491 15.5 1.08 979 16.3 0.77 *An individual is considered pre‐diabetic if their blood HbA1c level was 5.7% to less than 6.5%.

47
Table 51: Mean of measured HbA1c Level
Men Women Total
Age N Mean SE of the mean N Mean SE of the mean N Mean SE of the mean
15 ‐ 24 457 5.5 0.04 453 5.5 0.05 910 5.5 0.03 25 ‐ 34 425 5.6 0.07 606 5.5 0.05 1031 5.6 0.05 35 ‐ 44 426 5.8 0.07 545 5.7 0.07 971 5.8 0.05 45 ‐ 54 313 6.0 0.09 387 6.0 0.09 700 6.0 0.06 55 ‐ 64 199 6.7 0.15 185 6.3 0.27 384 6.5 0.15 65+ 272 6.4 0.11 161 6.5 0.16 433 6.4 0.09

48
Table 52: Hypercholesterolemia*, including those on drugs
Men Women Total
Age N Weighted % SE N Weighted % SE N Weighted % SE 15 ‐ 24 20 4.1 1.23 26 2.9 0.99 46 3.5 0.80 25 ‐ 34 39 5.7 1.19 53 5.6 0.95 92 5.7 0.78 35 ‐ 44 69 13.3 2.13 64 8.7 1.44 133 10.9 1.27 45 ‐ 54 72 20.0 2.88 58 12.1 2.20 130 16.3 1.85 55 ‐ 64 53 20.7 3.56 61 19.5 3.23 114 20.2 2.44 65+ 77 27.6 3.60 52 30.5 4.88 129 28.7 2.91 Total 330 9.5 0.80 314 7.3 0.64 644 8.5 0.52 *An individual is considered hypercholesterolemic if their blood total cholesterol level was 6.2 mmol/L or more, or if they have been diagnosed and are currently treated for hypercholesterolemia but their blood total cholesterol level was less than 6.5 mmol/L. Table 53: Status of diagnosis, treatment, and control among those who are hypercholesterolemic, men
Undiagnosed Untreated Treated controlled Treated uncontrolled
Age N Weighted % SE N Weighted % SE N Weighted % SE N Weighted % SE 15 ‐ 24 20 100 0 0 N/A N/A 0 N/A 0 0 N/A N/A 25 ‐ 34 36 93.2 6.24 1 6.5 6.24 1 0.3 0.26 0 N/A N/A 35 ‐ 44 46 63.4 8.42 5 8.8 4.25 14 25.6 7.89 3 2.2 1.4345 ‐ 54 39 54.3 8.21 4 5.9 3.37 23 36.2 8.16 3 3.6 2.4555 ‐ 64 19 38.8 9.66 1 0.6 0.65 31 60.1 9.64 1 0.5 0.4665+ 14 17.0 5.59 1 1.1 1.08 59 81.0 5.72 2 1.0 0.80Total 174 62.6 3.93 12 4.1 1.42 128 31.9 3.69 9 1.4 0.66

49
Table 54: Status of diagnosis, treatment, and control among those who are hypercholesterolemic, women
Undiagnosed Untreated Treated controlled Treated uncontrolled
Age N Weighted % SE N Weighted % SE N Weighted % SE N Weighted % SE 15 ‐ 24 26 100.0 0 0 N/A N/A 0 N/A N/A 0 N/A N/A 25 ‐ 34 49 95.4 2.94 1 2.6 2.55 2 2.0 1.47 0 N/A N/A 35 ‐ 44 47 73.7 7.90 6 11.0 6.13 8 14.1 5.92 2 1.2 0.8945 ‐ 54 28 63.3 8.62 1 4.6 4.54 25 31.1 7.73 1 0.9 0.9255 ‐ 64 19 33.1 8.07 5 7.6 3.51 32 54.6 8.45 2 4.7 3.2965+ 17 35.5 10.01 0 N/A N/A 24 45.3 10.58 9 19.2 7.08Total 186 68.9 3.68 13 4.6 1.68 91 23.0 3.06 14 3.5 1.13 Table 55: Measured pre‐hypercholesterolemia
Men Women Total
Age N Weighted % SE N Weighted % SE N Weighted % SE 15 ‐ 24 52 10.3 1.83 77 14.0 2.13 129 12.0 1.40 25 ‐ 34 115 21.1 2.47 157 22.5 2.40 272 21.7 1.73 35 ‐ 44 144 30.1 2.93 159 25.6 2.38 303 27.8 1.89 45 ‐ 54 99 30.1 3.38 139 30.8 3.06 238 30.4 2.29 55 ‐ 64 64 30.0 2.25 57 30.0 5.40 121 30.0 3.38 65+ 87 26.0 3.65 48 17.4 3.49 135 22.8 2.67 Total 561 19.5 1.17 637 20.6 1.22 1198 20.0 0.85 **An individual is considered pre‐hypercholesterolemic if their blood total cholesterol level was 5.18 to less than 6.2 mmol/L.

50
Table 56: Mean of measured total blood cholesterol
Men Women Total
Age N Mean SE of the mean N Mean SE of the mean N Mean SE of the mean15 ‐ 24 514 4.2 0.05 553 4.4 0.05 1067 4.3 0.04 25 ‐ 34 483 4.7 0.06 683 4.7 0.05 1166 4.7 0.04 35 ‐ 44 500 5.0 0.06 630 4.8 0.05 1130 4.9 0.04 45 ‐ 54 344 5.1 0.08 438 5.0 0.07 782 5.0 0.05 55 ‐ 64 214 4.9 0.09 220 5.1 0.09 434 5.0 0.06 65+ 314 4.7 0.08 187 5.0 0.12 501 4.8 0.06

51
Table 57: Vitamin D levels, men
Insufficient* Sufficient* Toxic levels*
Age N Weighted % SE N Weighted % SE N Weighted % SE
15 ‐ 24 228 48.8 2.97 274 50.6 2.97 5 0.62 0.36 25 ‐ 34 175 39.7 3.14 296 59.8 3.14 2 0.54 0.41 35 ‐ 44 169 34.8 2.93 320 64.7 2.94 3 0.50 0.31 45 ‐ 54 112 32.4 3.56 229 67.6 3.56 0 N/A N/A 55 ‐ 64 60 28.6 4.22 150 70.7 4.24 2 0.74 0.54 65+ 62 20.5 3.06 239 77.2 3.18 10 2.35 1.05 Total 806 40.6 1.60 1,508 58.8 1.60 22 0.60 0.19 *Vitamin D insufficiency is considered at blood vitamin D level < 28 ng/mL, and sufficiency is considered at blood vitamin D levels between 28 and 107 ng/mL. Higher levels of blood vitamin D are considered toxic. Table 58: Vitamin D levels, women
Insufficient* Sufficient* Toxic levels*
Age N Weighted % SE N Weighted % SE N Weighted % SE 15 ‐ 24 371 72.4 2.55 184 27.5 2.55 2 0.1 0.08 25 ‐ 34 372 59.0 2.83 285 40.1 2.82 8 0.9 0.38 35 ‐ 44 340 59.1 2.76 270 39.6 2.74 11 1.2 0.54 45 ‐ 54 203 51.9 3.47 213 46.6 3.47 12 1.5 0.58 55 ‐ 64 87 47.1 5.47 125 51.1 5.43 3 1.8 1.24 65+ 61 38.9 5.45 120 60.9 5.45 1 0.1 0.13 Total 1,434 62.6 1.45 1197 36.6 1.45 37 0.7 0.15 *Vitamin D insufficiency is considered at blood vitamin D level < 28 ng/mL, and sufficiency is considered at blood vitamin D levels between 28 and 107 ng/mL. Higher levels of blood vitamin D are considered toxic.

52
Table 59: Consumption of vitamin D supplements
Men Women Total
Age N Weighted % SE N Weighted % SE N Weighted % SE 15 ‐ 24 4 0.5 0.28 11 2.5 0.92 15 1.4 0.44 25 ‐ 34 8 3.1 1.75 33 5.9 1.41 41 4.4 1.14 35 ‐ 44 7 2.0 1.01 29 3.4 0.79 36 2.8 0.63 45 ‐ 54 7 2.6 1.02 27 5.9 1.51 34 4.2 0.89 55 ‐ 64 6 1.8 0.82 19 8.0 2.18 25 4.6 1.08 65+ 7 1.5 0.73 8 5.1 2.45 15 2.9 1.04 Total 39 1.6 0.44 127 4.2 0.55 166 2.8 0.35
Table 60: Mean of measured blood vitamin D level
Men Women Total
Age N Mean SE of the mean N Mean SE of the mean N Mean SE of the mean15 ‐ 24 507 32.7 1.11 557 25.4 0.82 1,064 29.2 0.72 25 ‐ 34 473 34.3 1.12 665 29.2 0.92 1,138 32.0 0.76 35 ‐ 44 492 35.0 0.91 621 30.6 1.06 1,113 32.7 0.71 45 ‐ 54 341 36.0 1.13 428 33.3 1.4 769 34.7 0.89 55 ‐ 64 212 41.4 1.89 215 38 2.58 427 39.9 1.58 65+ 311 46.7 1.77 182 38.9 2.48 493 43.8 1.5

53
Table 61: Self‐reported chronic conditions, by sex
Men Women Total
Condition N Weighted % SE N Weighted % SE N Weighted % SE Stroke 35 0.4 0.08 20 0.3 0.10 55 0.3 0.06
Cardiac arrest 53 0.7 0.15 18 0.3 0.09 71 0.5 0.09Myocardial infarction 52 0.7 0.14 19 0.3 0.07 71 0.5 0.08
Heart failure 27 0.4 0.11 14 0.2 0.07 41 0.3 0.06Atrial fibrillation 20 0.3 0.10 20 0.3 0.08 40 0.3 0.06Renal failure 38 0.6 0.12 21 0.3 0.09 59 0.4 0.08
Cancer 7 0.1 0.05 18 0.4 0.12 25 0.3 0.07COPD 19 0.2 0.06 10 0.1 0.06 29 0.2 0.04Asthma 210 4.5 0.42 180 3.5 0.38 390 4.0 0.28

54
Figure 1: Survey flow
Locate HH Identify head of HH and obtain
consent
Complete HH Roster
(Module 1)
Randomly select
Obtain consent and then complete Selected Adult Questionnaire and Physical Measurement
(Module2)
Refer participant to local clinic
Ship blood samples to KFMC in
‐Fill in first half of Module 4 on DatStat
‐Draw blood
LOCAL CLINICTest blood sample for fasting
lipid profile, HbA1C and Vitamin D
KFMC
Enter results of blood testing onto DatStat (fill out second half of
KFMC lab Tech
If the interviewer couldn’t start the survey, had to stop the survey for any reason or if the survey was completed by finishing Module 2, the interviewer will need to fill out Module 3 to indicate whether the survey has stopped (and why), hasn’t started (and why) or if it’s complete.

55
Appendix 1: Saudi Health Interview Survey 2013
Kingdom of Saudi Arabia Health Interview Survey (SHIS)
Pilot for Chronic Non-Communicable Diseases
2013
in collaboration with
and the

56
Color-Coding Legend
Highlighted text = Interviewer instructions * Highlighted text = Other programming notes Highlighted text = Item for Declined Respondent Module Highlighted text = Item for Proxy Respondent Module
*Interviewer instructions are also in italics. Any italicized text that is not highlighted in yellow must be translated to Arabic. Interviewer instructions that are highlighted in yellow should NOT be translated to Arabic.

57
Module 1: Household roster

58
Household roster – Survey information and consent Module 1: Household Roster – Survey Information and Consent
Location and Date Response Code
1. Cluster/Centre/Village name
village_name_roster
STEPS I2
2. Interviewer ID (region – team number – member number)
└─┴─┘ - └─┴─┘ - └─┴─┘ region team # member #
interviewer_id_rosterv1 interviewer_id_region_rv1 interviewer_id_team_rv1
interviewer_id_member_rv1
3. Visit 1 Date
└─┴─┘ └─┴─┘ └─┴─┴─┴─┘ dd mm yyyy
v1_date_roster v1_date_year_roster
v1_date_month_roster v1_date_day_roster
STEPS I4
4. Start time of interview (24 hour clock)
└─┴─┘: └─┴─┘ hrs mins
v1_start_time v1_start_time_hour_roster v1_start_time_min_roster
STEPS I7
Consent, Interview Language and Name
5. Consent has been read and obtained Yes=1 No=0 If no, end
consent_roster_v1
STEPS I5
6. First Name First name=1 Specify in open text field
Don’t know=77 Decline to respond=88
firstname_roster_v1
STEPS I9
Additional Information that may be helpful consent-lang-name_add_info
7. Contact phone number where possible Specify in open text field telephone_roster_v1
STEPS I10

59
Household roster
Module 1: Household Roster
Interviewer: Please collect information from the head of the household or the adult who has the most knowledge about the members of the household.
1.
IF YOU ARE SPEAKING TO THE HEAD OF THE HOUSEHOLD: Beginning with you, what are the names of the usual members of this household? IF YOU ARE NOT SPEAKING TO THE HEAD OF THE HOUSEHOLD: Beginning with the head of the household, what are the names of the usual members of this household? IF THERE IS A BABY THAT HAS YET TO BE NAMED, WRITE “BABY.”
Name of household member 1=1 Specify in open text field Name of household member 2=2 Specify in open text field Name of household member 3=3 Specify in open text field
....
.... ….
Name of household member 30=30 Specify in open text field
ID_name
2. {Name of household member} The following questoins are specifically about the individual named above. ID_name1
3. Is this person male or female? Male=1 Female=2 ID_sex1
4. How old was this person on his/her last birthday? ENTER AGE IN YEARS AND MONTHS FOR ALL CHILDREN UNDER 5 YEARS. OTHERWISE, JUST ENTER AGE IN YEARS.
Years=YR Specify in open text field Months=MO Specify in open text field
Don’t know=DK Decline to respond=NR
ID_age1
5. What is this person’s date of birth? Date of birth=1 Specify in open text field)
Don’t know=77 Decline to respond=88
ID_dob1

60
6. What is the relationship of this person with the head of the household? (SELECT ONE)
Head of the household=1 Spouse=2
Biological child=3 Adopted / stepchild=4
Grandchild=5 Niece / nephew=6
Aunt / uncle=7 Cousin=8
Mother / father=9 Sister / brother=10
Daughter-in-law / son-in-law=11 Sister-in-law / brother-in-law=12
Grandparent=13 Mother-in-law / father-in-law=14
Other relative=15 Non-relative=16
Other, please specify=97 Specify in open text field Don’t know=77
Decline to respond=88
ID_relationship1
7.
What is this person’s current marital status? INTERVIEWER: ONLY ASK IF THE PERSON IS OLDER THAN 15. (SELECT ONE)
Never been married=1 Married=2
Divorced=3 Separated=4 Widowed=5
Other, please specify=97 Specify in open text field Don’t know=77
Decline to respond=88
ID_marital_status1
8. List the members of the household that have been named by the individual being interviewed. Have we missed anybody in the household?
Yes=1 No=0
Don’t know=77 Decline to respond=88
ID_missing_members
9. {Response:SELECTED_ADULT_CALC} has been selected to participate in the survey. Please make arrangements to interview this individual. Is the individual available now?
Yes=1 If Yes, move onto Selected Adult Questionnaire No=0 If No, move onto Disposition Codes Survey random_selection_result
10. Please continue on to the Selected Adult Questionnaire. epc1_sa
11. Please continue to the Disposition Codes Survey to fill out the result of the
visit.
epc2_dc
Interviewer: Randomly select one household member aged 15 years or older and make arrangements to interview that individual.

61
Module 2a: Selected adult questionnaire for full survey

62
Survey Information and Consent – Full Survey Module 2a: Selected Adult Questionnaire – Survey Information and
Consent
# Location and Date Response Code
1 Please enter the name of the selected adult selected_adult_name
2 Cluster/Centre/Village name
village_name
STEPS I2
3 Interviewer ID
└─┴─┘ - └─┴─┘ - └─┴─┘ region team # member #
interviewer_id_visit1 interviewer_id_region_v1 interviewer_id_team_v1
interviewer_id_member_v1
STEPS I3
4 Visit 1 Date
└─┴─┘ └─┴─┘ └─┴─┴─┴─┘ dd mm yyyy
v1_date v1_date_year
v1_date_month v1_date_day
5 Start time of interview (24 hour clock)
└─┴─┘: └─┴─┘ hrs mins
v1_start_time v1_start_time_hour
v1_start_min
I7
Consent, Interview Language and Name
6 Consent has been read and obtained Yes=1 No=0 If no, end
consent_v1
I5
7 First Name First name=1 Specify in open text field
Don’t know=77 Decline to respond=88
firstname_v1
I9
Additional Information that may be helpful consent-lang-name_add_info
8 Contact phone number where possible Specify in open text field telephone_v1
I10

63
Selected Adult Questionnaire – Full Survey Module 2a: Selected Adult Questionnaire
# Question Response Code
Section 1: Sociodemographic Information
9 Sex (Record Male / Female as observed) Male=1 Female=2
sex
STEPS C1
How old are you? Age, in years=1 Specify in open text field
Don’t know=77 Decline to respond=88
age
STEPS C3
What is the highest level of education you have completed? [INSERT COUNTRY-SPECIFIC CATEGORIES] (SELECT ONE)
Can’t read or write=1 Can read and write=2
Primary school completed=3 Intermediate school completed=4
High school completed=5 College/University completed=6
Post graduate degree=7 Technical training=8
Don’t know=77 Decline to respond=88
education
STEPS C5
What is your marital status? (SELECT ONE)
Never married=1 Currently married=2
Separated=3 Divorced=4 Widowed=5
Don’t know=77 Decline to respond=88
marital_status
STEPS C7
Are your parents related (consanguineous marriage)?
First degree cousins=1 Second degree cousins=2
Other relation between them=4 Not related=0
Don’t know=77 Decline to respond=88
parent_relationship
MOHSA

64
Which of the following best describes your main work status over the past 12 months? [INSERT COUNTRY-SPECIFIC CATEGORIES] (SELECT ONE)
Government employee=1 Non-government employee=2
Self-employed=3 Non-paid=4
Student=5 Homemaker=6
Retired=7 Unemployed (able to work)=8
Unemployed (unable to work)=9 Don’t know=77
Decline to respond=88
work_status
C8
STEPS C8
Can you give an estimate of the monthly household income if I read some options to you? Is it [INSERT QUINTILE VALUES IN LOCAL CURRENCY] (READ OPTIONS)
Less than 3000 Riyal=1 3000 Riyal to less than 5000 Riyal=2 5000 Riyal to less than 7000 Riyal=3
7000 Riyal to less than 10000 Riyal=4 10000 Riyal to less than 15000 Riyal=5
15000 Riyal to less than 20000 Riyal=6 20000 to less than 30000=7
30000 Riyal or more=8
Don't Know=77 Decline to respond=88
income_estimate
C11
STEPS C11
# Question Response Code
Section 2: Tobacco Use
Now I am going to ask you some questions about various health behaviours. This includes things like smoking, eating fruits and vegetables and physical activity. Let's start with tobacco.
Have you ever smoked any tobacco products, such as cigarettes, cigars or pipes or Shisha? (USE SHOWCARD)
Yes=1 No=0 If No, go to tobacco_smokeless
Don’t know=77 If Don’t know, go to tobacco_smokeless Decline to respond=88 If Decline to respond, go to tobacco_smokeless
tobacco_smoker_ever
STEPS T1a
Do you currently smoke any tobacco products, such as cigarettes, cigars, pipes or Shisha? (USE SHOWCARD)
Yes=1 No=0 If No, go to tobacco_age_start
Don’t know=77 If Don’t know, go to tobacco_age_start Decline to respond=88 If Decline to respond, go to tobacco_age_start
tobacco_smoker_current
STEPTS T1
Do you currently smoke tobcco products, such as cigarettes, cigars, pipes, or Sisha, daily?
Yes=1 No=0 If If No, go to tobacco_age_start
Don’t know-77 If Don’t know, go to tobacco_age_start Decline to respond=88 If Decline to respond, go to tobacco_age_start
tobacco_smoker_daily

65
How old were you when you first started smoking daily?
Age=1 Specify in open text field Never smoked daily=0 If Never smoked daily, go to tobacco_quit
Don’t know=77 Decline to respond=88
tobacco_age_start
STEPS T3
2
On average, how many manufactured cigarettes do you (did you) smoke each day? (USE SHOW CARD) (SELECT ONE)
Number of manufactured cigarettes per day=1 Specify in open text field Don’t know=77
Decline to respond=88
tobacco_cigarettes
STEPS T5a
2
On average, how many hand-rolled cigarettes do you (did you) smoke each day? (USE SHOW CARD) (SELECT ONE)
Number of hand-rolled cigarettes per day=1 Specify in open text field Don’t know=77
Decline to respond=88
tobacco_cigarettes2
STEPS T5b
2
On average, how many pipes full of tobacco do you (did you) smoke each day? (USE SHOW CARD) (SELECT ONE)
Number of pipes full of tobacco per day=1 Specify in open text field Don’t know=77
Decline to respond=88
tobacco_pipes
STEPS T5c
2
On average, how many cigars, cheroots, and/or cigarillos do you (did you) smoke each day? (USE SHOW CARD) (SELECT ONE)
Number of cigars, cheroots, and/or cigarillos per day=1 Specify in open text field Don’t know=77
Decline to respond=88
tobacco_cigars
STEPS T5d
2
On average, how many shisha do you (did you smoke) each day? (USE SHOW CARD) (SELECT ONE)
Amount of shisha per day=1 Specify in open text field Don’t know=77
Decline to respond=88
tobacco_shisha
STEPS X5
2
On average, how many sugar-flavored shisha do you(did you smoke) each day? (USE SHOW CARD) (SELECT ONE)
Amount of sugar-flavored shisha per day=1 Specify in open text field Don’t know=77
Decline to respond=88
tobacco_sugar_sisha
MOHSA
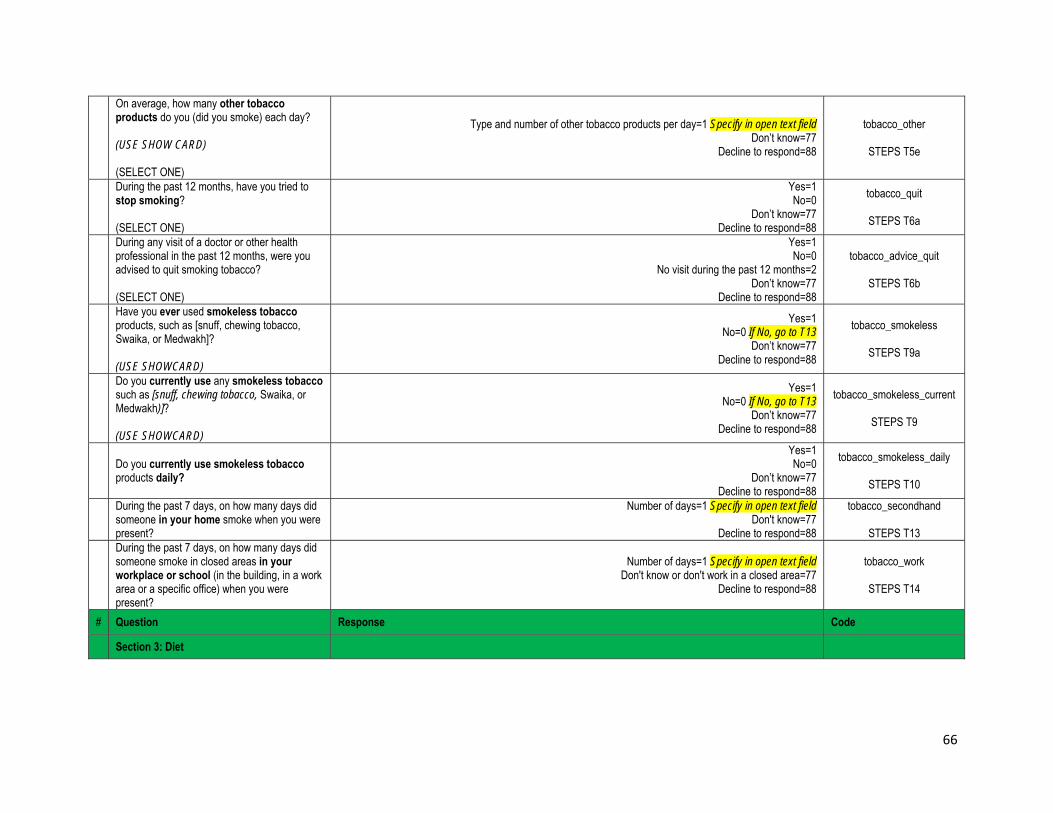
66
2
On average, how many other tobacco products do you (did you smoke) each day? (USE SHOW CARD) (SELECT ONE)
Type and number of other tobacco products per day=1 Specify in open text field Don’t know=77
Decline to respond=88
tobacco_other
STEPS T5e
2During the past 12 months, have you tried to stop smoking? (SELECT ONE)
Yes=1 No=0
Don’t know=77 Decline to respond=88
tobacco_quit
STEPS T6a
2
During any visit of a doctor or other health professional in the past 12 months, were you advised to quit smoking tobacco? (SELECT ONE)
Yes=1 No=0
No visit during the past 12 months=2 Don’t know=77
Decline to respond=88
tobacco_advice_quit
STEPS T6b
2
Have you ever used smokeless tobacco products, such as [snuff, chewing tobacco, Swaika, or Medwakh]? (USE SHOWCARD)
Yes=1 No=0 If No, go to T13
Don’t know=77 Decline to respond=88
tobacco_smokeless
STEPS T9a
3
Do you currently use any smokeless tobacco such as [snuff, chewing tobacco, Swaika, or Medwakh)]? (USE SHOWCARD)
Yes=1 No=0 If No, go to T13
Don’t know=77 Decline to respond=88
tobacco_smokeless_current
STEPS T9
3 Do you currently use smokeless tobacco products daily?
Yes=1 No=0
Don’t know=77 Decline to respond=88
tobacco_smokeless_daily
STEPS T10
3During the past 7 days, on how many days did someone in your home smoke when you were present?
Number of days=1 Specify in open text field Don't know=77
Decline to respond=88
tobacco_secondhand
STEPS T13
3
During the past 7 days, on how many days did someone smoke in closed areas in your workplace or school (in the building, in a work area or a specific office) when you were present?
Number of days=1 Specify in open text field Don't know or don't work in a closed area=77
Decline to respond=88
tobacco_work
STEPS T14
# Question Response Code
Section 3: Diet

67
The next questions ask about what you usually eat. I have a nutrition card here that shows you some examples of local food. Each picture represents the size of a serving. As you answer these questions please think of a typical week in the last year.
3
In a typical week, on how many days do you eat fruit? Please include fresh, frozen, or canned fruit, for example figs, grapes, oranges, bananas, or apples. Do not include juices, blended fruits, or dried fruits. (USE SHOWCARD)
Number of days=1 Speficy in open text field, If Zero days, go to diet_juice Don't Know=77
Decline to respond=88
diet_fruit
STEPS D1
3How many servings of fruit do you eat on one of those days? (USE SHOWCARD)
Number of servings=1 Specify in open text field Don't Know=77
Decline to respond=88
diet_fruit_servings
STEPS D2
3
In a typical week, on how many days do you drink 100% fruit juices, including blended fruits? Do not include “nectars”. (USE SHOWCARD)
Number of days=1 Speficy in open text field, If Zero days, go to diet_vegetables Don't Know=77
Decline to respond=88
diet_juice
DHQ2 4
3How many servings of 100% fruit juices do you drink on one of those days? (USE SHOWCARD)
Number of servings=1 Specify in open text field Don't Know=77
Decline to respond=88
diet_juice_servings
DHQ2 4a
3
In a typical week, on how many days do you eat vegetables? Please include raw, cooked, canned, or frozen vegetables. Please do not include rice, potatoes, or cooked dried beans such as kidney beans, pinto beans, or lentils. (USE SHOWCARD)
Number of days=1 Speficy in open text field, If Zero days, go to diet_darkfish Don't Know=77
Decline to respond=88
diet_vegetables
STEPS D3
3How many servings of vegetables do you eat on one of those days? (USE SHOWCARD)
Number of servings=1 Specify in open text field Don't Know=77
Decline to respond=88
diet_vegetables_servings
STEPS D4

68
4
In a typical week, on how many days do you eat dark meat fish, such as salmon, tuna fish, mackerel, sardines, bluefish, or swordfish, whether fresh or canned? (USE SHOWCARD)
Number of days=1 Speficy in open text field, If Zero days, go to diet_otherfish Don't Know=77
Decline to respond=88
diet_darkfish
IHME MDCC / BRFFS diet_darkfish
4How many servings of dark meat fish do you eat on one of those days? (USE SHOWCARD)
Number of servings=1 Specify in open text field Don't Know=77
Decline to respond=88
diet_darkfish_servings
D19
4 In a typical week, how many days do you eat other fish?
Number of days=1 Speficy in open text field, If Zero days, go to diet_redmeat Don't Know=77
Decline to respond=88
diet_otherfish
STEPS D9c
4 How many servings of other fish do you eat on one of those days?
Number of servings=1 Specify in open text field Don't Know=77
Decline to respond=88
diet_otherfish_servings
STEPS D10c
4 In a typical week, how many days do you eat red meat?
Number of days=1 Speficy in open text field, If Zero days, go to diet_poultry Don't Know=77
Decline to respond=88
diet_redmeat
STEPS D9a
4 How many servings of red meat do you eat on one of those days?
Number of servings=1 Specify in open text field Don't Know=77
Decline to respond=88
diet_redmeat_servings
STEPS D10a
4 In a typical week, how many days do you eat poultry meat (including chicken)?
Number of days=1 Speficy in open text field, If Zero days, go to diet_shrimp Don't Know=77
Decline to respond=88
diet_poultry
STEPS D9b
4 How many servings of poultry meat (including chicken) do you eat on one of those days?
Number of servings=1 Specify in open text field Don't Know=77
Decline to respond=88
diet_poultry_servings
STEPS D10b
4 In a typical week, how many days do you eat shrimp?
Number of days=1 Speficy in open text field, If Zero days, go to diet_procmeat Don't Know=77
Decline to respond=88
diet_shrimp
MOHSA
4 How many servings of shrimp do you eat on one of those days?
Number of servings=1 Specify in open text field Don't Know=77
Decline to respond=88
diet_shrimp_servings
MOHSA
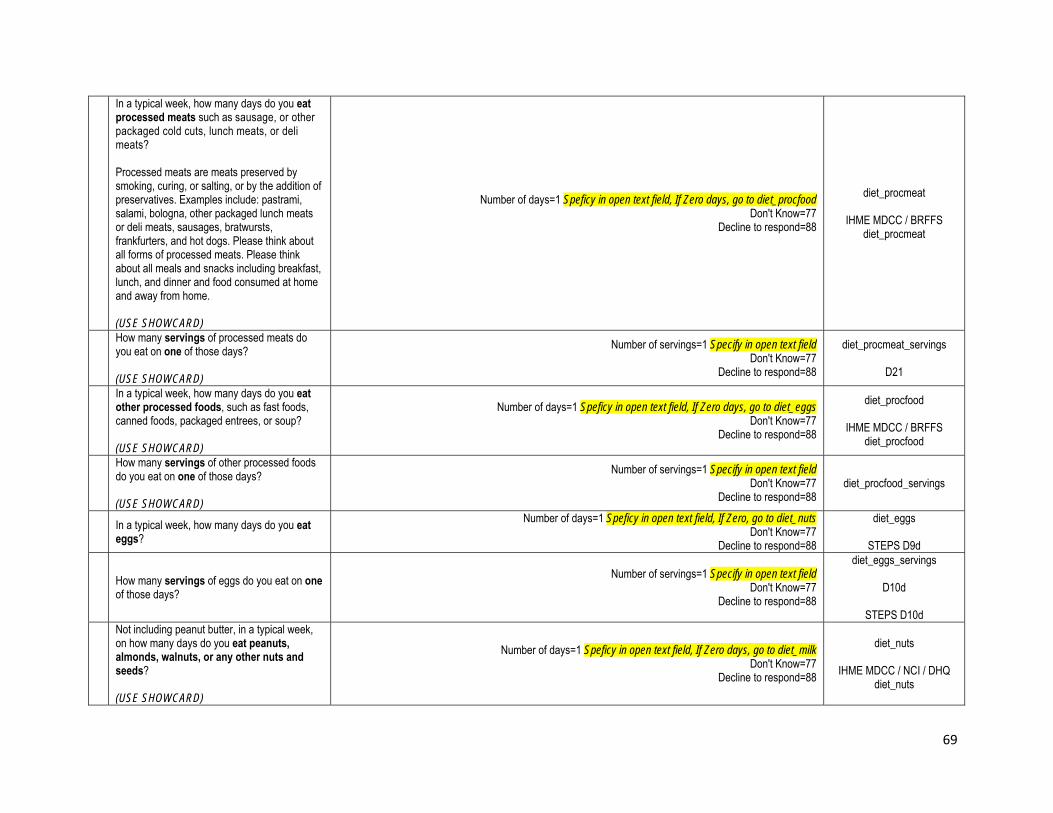
69
5
In a typical week, how many days do you eat processed meats such as sausage, or other packaged cold cuts, lunch meats, or deli meats? Processed meats are meats preserved by smoking, curing, or salting, or by the addition of preservatives. Examples include: pastrami, salami, bologna, other packaged lunch meats or deli meats, sausages, bratwursts, frankfurters, and hot dogs. Please think about all forms of processed meats. Please think about all meals and snacks including breakfast, lunch, and dinner and food consumed at home and away from home. (USE SHOWCARD)
Number of days=1 Speficy in open text field, If Zero days, go to diet_procfood Don't Know=77
Decline to respond=88
diet_procmeat
IHME MDCC / BRFFS diet_procmeat
5How many servings of processed meats do you eat on one of those days? (USE SHOWCARD)
Number of servings=1 Specify in open text field Don't Know=77
Decline to respond=88
diet_procmeat_servings
D21
5
In a typical week, how many days do you eat other processed foods, such as fast foods, canned foods, packaged entrees, or soup? (USE SHOWCARD)
Number of days=1 Speficy in open text field, If Zero days, go to diet_eggs Don't Know=77
Decline to respond=88
diet_procfood
IHME MDCC / BRFFS diet_procfood
5How many servings of other processed foods do you eat on one of those days? (USE SHOWCARD)
Number of servings=1 Specify in open text field Don't Know=77
Decline to respond=88
diet_procfood_servings
5 In a typical week, how many days do you eat eggs?
Number of days=1 Speficy in open text field, If Zero, go to diet_nuts Don't Know=77
Decline to respond=88
diet_eggs
STEPS D9d
5 How many servings of eggs do you eat on one of those days?
Number of servings=1 Specify in open text field Don't Know=77
Decline to respond=88
diet_eggs_servings
D10d
STEPS D10d
5
Not including peanut butter, in a typical week, on how many days do you eat peanuts, almonds, walnuts, or any other nuts and seeds? (USE SHOWCARD)
Number of days=1 Speficy in open text field, If Zero days, go to diet_milk Don't Know=77
Decline to respond=88
diet_nuts
IHME MDCC / NCI / DHQ diet_nuts

70
5
How many servings of nuts and seeds do you eat on one of those days? Please consider a serving to be a 40 grams of nuts or seeds. (USE SHOWCARD)
Number of servings=1 Specify in open text field Don't Know=77
Decline to respond=88 diet_nuts_servings
5 In a typical week, how many days do you drink milk?
Number of days=1 Speficy in open text field, If Zero, go to diet_laban Don't Know=77
Decline to respond=88
diet_milk
STEPS D11a
5 How many servings of milk do you usually drink on one of those days?
Number of servings=1 Specify in open text field Don't Know=77
Decline to respond=88
diet_milk_servings
STEPS D12a
6 In a typical week, how many days do you consume laban?
Number of days=1 Speficy in open text field, If Zero, go to diet_yogurt Don't Know=77
Decline to respond=88
diet_laban
STEPS D11b
6 How many servings of laban do you usually consume on one of those days?
Number of servings=1 Specify in open text field Don't Know=77
Decline to respond=88
diet_laban_servings
STEPS D12b
6 In a typical week, how many days do you eat yogurt?
Number of days=1 Speficy in open text field, If Zero, go to diet_labneh Don't Know=77
Decline to respond=88
diet_yogurt
STEPS D11c
6 How many servings of yogurt do you usually consume on one of those days?
Number of servings=1 Specify in open text field Don't Know=77
Decline to respond=88
diet_yogurt_servings
STEPS D12c
6 In a typical week, how many days do you consume labneh?
Number of days=1 Speficy in open text fiel, If Zero, go to diet_cheese Don't Know=77
Decline to respond=88
diet_labneh
STEPS D11d
6 How many servings of labneh do you usually consume on one of those days?
Number of servings=1 Specify in open text field Don't Know=77
Decline to respond=88
diet_labneh_servings
STEPS D12d
6 In a typical week, how many days do you eat cheese?
Number of days=1 Speficy in open text field, If Zero, go to diet_soda Don't Know=77
Decline to respond=88
diet_cheese
STEPS D11e
6 How many servings of cheese do you usually eat on one of those days?
Number of servings=1 Specify in open text field Don't Know=77
Decline to respond=88
diet_cheese_servings
STEPS D12e
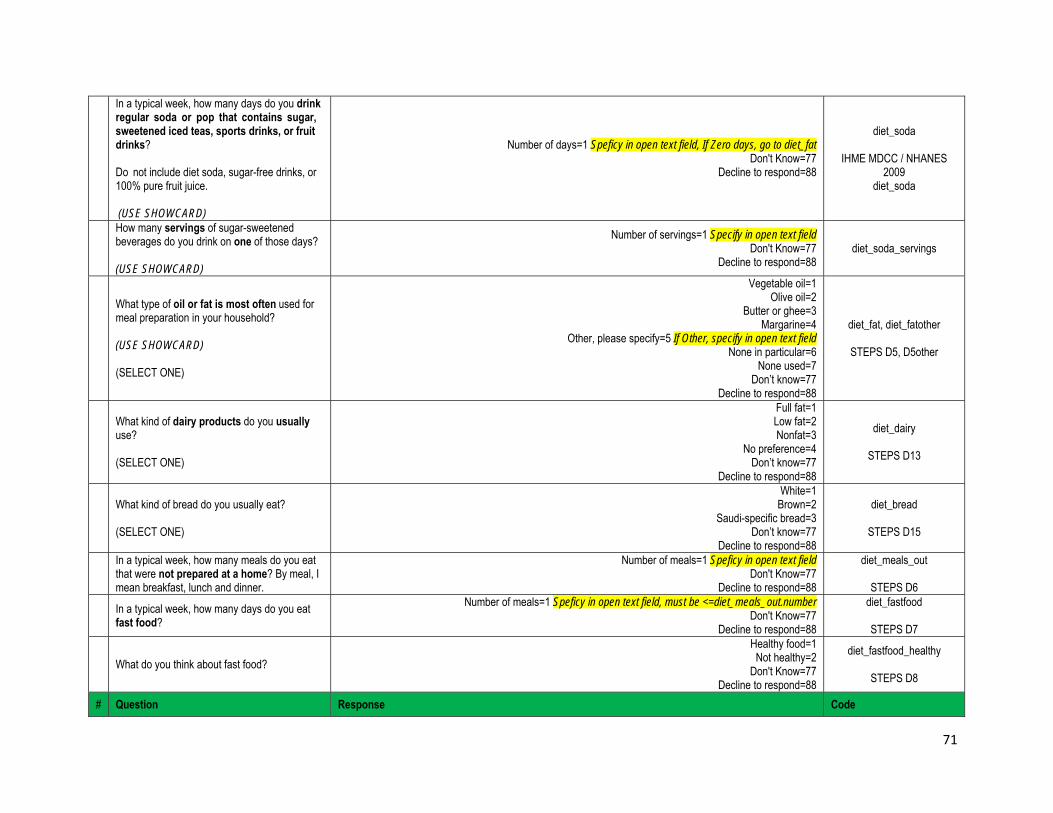
71
6
In a typical week, how many days do you drink regular soda or pop that contains sugar, sweetened iced teas, sports drinks, or fruit drinks? Do not include diet soda, sugar-free drinks, or 100% pure fruit juice. (USE SHOWCARD)
Number of days=1 Speficy in open text field, If Zero days, go to diet_fat Don't Know=77
Decline to respond=88
diet_soda
IHME MDCC / NHANES 2009
diet_soda
6How many servings of sugar-sweetened beverages do you drink on one of those days? (USE SHOWCARD)
Number of servings=1 Specify in open text field Don't Know=77
Decline to respond=88 diet_soda_servings
What type of oil or fat is most often used for meal preparation in your household? (USE SHOWCARD) (SELECT ONE)
Vegetable oil=1 Olive oil=2
Butter or ghee=3 Margarine=4
Other, please specify=5 If Other, specify in open text field None in particular=6
None used=7 Don’t know=77
Decline to respond=88
diet_fat, diet_fatother
STEPS D5, D5other
What kind of dairy products do you usually use? (SELECT ONE)
Full fat=1 Low fat=2 Nonfat=3
No preference=4 Don’t know=77
Decline to respond=88
diet_dairy
STEPS D13
What kind of bread do you usually eat? (SELECT ONE)
White=1 Brown=2
Saudi-specific bread=3 Don’t know=77
Decline to respond=88
diet_bread
STEPS D15
In a typical week, how many meals do you eat that were not prepared at a home? By meal, I mean breakfast, lunch and dinner.
Number of meals=1 Speficy in open text field Don't Know=77
Decline to respond=88
diet_meals_out
STEPS D6
In a typical week, how many days do you eat fast food?
Number of meals=1 Speficy in open text field, must be <=diet_meals_out.number Don't Know=77
Decline to respond=88
diet_fastfood
STEPS D7
What do you think about fast food? Healthy food=1 Not healthy=2
Don't Know=77 Decline to respond=88
diet_fastfood_healthy
STEPS D8
# Question Response Code

72
Section 4: General Health Status and Functional Health Status
Next are some questions about your general health including some questions about specific physical symptoms you may have experienced, your ability to do different daily activities, and how you have been feeling. Although some of these questions may seem similar, it is important that we ask them all.
In general, would you say your health is excellent, very good, good, fair, or poor? INTERVIEWER: If respondent asks about timeframe, say “Please answer according to how you have been during the past 30 days.” . (SELECT ONE)
1=Excellent 2=Very good 3=Good 4=Fair 5=Poor 77=Don’tknow 88=Decline to respond
health1 declined1
proxy1 PROMIS
GLOBAL1
Compared with 12 months ago, would you say your health in general is now better, worse, or about the same? (SELECT ONE)
3=Better 1=Worse 2=About the same 77=Don’tknow 88=Decline to respond
health2 declined2
proxy2 IHME
NHANES 2009 WAHS SF-36 NHIS
Now thinking about your physical health, which includes physical illness and injury, for how many days during the past 30 days was your physical health not good? (SELECT ONE)
Enter number of days: ____ 77=Don’tknow 88=Decline to respond
physhealth BRFSS 2011
During the past 12 months, about how many days did you miss work at a job or business because of illness or injury? (Do not include maternity leave.) (SELECT ONE)
Enter number of days: ____ 995=Do not work 77=Don’t know 88=Decline to respond
health3 declined3
proxy3 IHME
NHIS 2010
8
Do you now have any health problem that requires you to use special equipment, such as a cane, a wheelchair, a special bed, or a special telephone? (SELECT ONE)
1=Yes 0=No 77=Don’tknow 88=Decline to respond
health4 declined4
proxy4 NHANES PFQ.090
NHIS 2010

73
8
Does your health now limit you in doing vigorous activities, such as running, lifting heavy objects, or participating in strenuous sports? …Not at all, very little, somewhat, quite a lot, or can you not do these activities because of your health? (SELECT ONE)
1=Not at all 2=Very little 3=Somewhat 4=Quite a lot 5=Cannot do (skip to # / physfxn4) 77=Don’tknow 88=Decline to respond
physfxn1 IHME
PROMIS PFA1
8
Are you able to climb up five steps? …Without any difficulty, with a little difficulty, with some difficulty, with much difficulty, or are you unable to do this? (SELECT ONE)
1=Without any difficulty 2=With a little difficulty 3=With some difficulty 4=With much difficulty 5=Unable to do 77=Don’tknow 88=Decline to respond
phsyfxn4 PROMIS PFB10
8
During the past 30 days, how difficult was it to perform your work or house activities? …Without any difficulty, with a little difficulty, with some difficulty, with much difficulty, or are you unable to do this? (SELECT ONE)
1=Without any difficulty 2=With a little difficulty 3=With some difficulty 4=With much difficulty 5=Unable to do 77=Don’tknow 88=Decline to respond
phys_usual_activities
MOHSA
8
During the past 30 days, how difficult was it to perform any of the following activities: walking a short distance, standing from a seated position, standing for a short period of time, climbing one step of stairs? …Without any difficulty, with a little difficulty, with some difficulty, with much difficulty, or are you unable to do this? (SELECT ONE)
1=Without any difficulty 2=With a little difficulty 3=With some difficulty 4=With much difficulty 5=Unable to do 77=Don’tknow 88=Decline to respond
phys_heart_health
MOHSA
Next are some questions about specific symptoms you may have experienced.
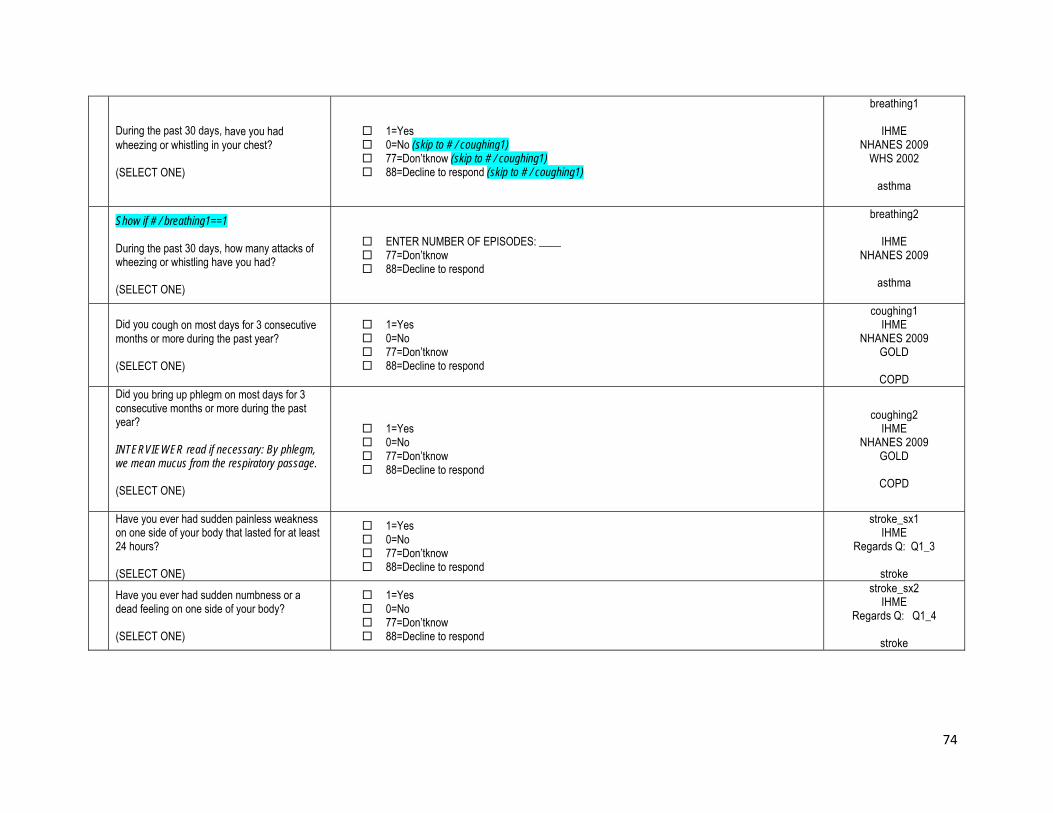
74
8
During the past 30 days, have you had wheezing or whistling in your chest? (SELECT ONE)
1=Yes 0=No (skip to # / coughing1) 77=Don’tknow (skip to # / coughing1) 88=Decline to respond (skip to # / coughing1)
breathing1
IHME NHANES 2009
WHS 2002
asthma
8
Show if # / breathing1==1 During the past 30 days, how many attacks of wheezing or whistling have you had? (SELECT ONE)
ENTER NUMBER OF EPISODES: ____ 77=Don’tknow 88=Decline to respond
breathing2
IHME NHANES 2009
asthma
8
Did you cough on most days for 3 consecutive months or more during the past year? (SELECT ONE)
1=Yes 0=No 77=Don’tknow 88=Decline to respond
coughing1 IHME
NHANES 2009 GOLD
COPD
8
Did you bring up phlegm on most days for 3 consecutive months or more during the past year? INTERVIEWER read if necessary: By phlegm, we mean mucus from the respiratory passage. (SELECT ONE)
1=Yes 0=No 77=Don’tknow 88=Decline to respond
coughing2 IHME
NHANES 2009 GOLD
COPD
8
Have you ever had sudden painless weakness on one side of your body that lasted for at least 24 hours? (SELECT ONE)
1=Yes 0=No 77=Don’tknow 88=Decline to respond
stroke_sx1 IHME
Regards Q: Q1_3
stroke
9Have you ever had sudden numbness or a dead feeling on one side of your body? (SELECT ONE)
1=Yes 0=No 77=Don’tknow 88=Decline to respond
stroke_sx2 IHME
Regards Q: Q1_4
stroke

75
9
Have you ever suddenly lost the ability to understand what people were saying or lost the ability to express yourself verbally or in writing for at least 24 hours? (SELECT ONE)
1=Yes 0=No 77=Don’tknow 88=Decline to respond
stroke_sx3 IHME
Regards
stroke
These next questions are about your hearing.
9Do you have deafness or trouble hearing in one or both ears without the help of a hearing aid? (SELECT ONE)
Yes=1 No=0
Don’t know=77 Decline to respond=88
hearing1 GC13 Q5034.
9
Which statement best describes your hearing (without a hearing aid)? Would you say your hearing is excellent, good, that you have a little trouble, moderate trouble, a lot of trouble, or that you are deaf? (SELECT ONE)
Excellent=1 Good=2
A little trouble=3 Moderate trouble=4
A lot of trouble=5 Deaf=6
Don’t know=77 Decline to respond=88
hearing2 NHANES 2009
AUQ.131
Now I would like to ask you questions about your vision. These questions are for all respondents regardless of whether or not you wear glasses or contact lenses. If you wear glasses or contact lenses, answer as if you are wearing them.
9Do you wear glasses or contact lenses? (SELECT ONE)
Yes=1 No=0
Don’t know=77 Decline to respond=88
vision1 WHS 2002
9{show if vision1==1} Please answer the following questions taking into account your glasses or contact lenses.
sec4_vision_glasses-contacts
9
In the last 30 days, how much difficulty did you have in seeing and recognizing a person you know across the road (i.e. from a distance of about 20 meters)? (SELECT ONE)
None=1 Mild=2
Moderate=3 Severe=4
Extreme/Cannot do=5 Don’t know=77
Decline to respond=88
vision2 WHS 2002

76
9
In the last 30 days, how much difficulty did you have in seeing and recognizing an object at arm’s length or in reading? (SELECT ONE)
None=1 Mild=2
Moderate=3 Severe=4
Extreme/Cannot do=5 Don’t know=77
Decline to respond=88
vision3 WHS 2002
# Question Response Code
Section 5: Physical Activity
Next I am going to ask you about the time you spend doing different types of physical activity in a typical week. Please answer these questions even if you do not consider yourself to be a physically active person.
Work
Think first about the time you spend doing work. Think of work as the things that you have to do such as paid or unpaid work, study/training, household chores, harvesting food/crops, fishing or hunting for food, seeking employment. [Insert other examples if needed]. In answering the following questions 'vigorous-intensity activities' are activities that require hard physical effort and cause large increases in breathing or heart rate; 'moderate-intensity activities' are activities that require moderate physical effort and cause small increases in breathing or heart rate.
9
Does your work involve vigorous-intensity activity that causes large increases in breathing or heart rate like [carrying or lifting heavy loads, digging or construction work] for at least 10 minutes continuously? [INSERT EXAMPLES] (USE SHOWCARD) (SELECT ONE)
Yes=1 No=0 If No, go to work_modactivity
Don’t know=77 If Don’t know, go to work_modactivity Decline to respond==88 If Decline to respond, go to work_modactivity
work_vigactivity
STEPS P1

77
9
In a typical week, on how many days do you do vigorous-intensity activities as part of your work? (SELECT ONE)
Number of days=1 Specify in open text field Don’t know=77
Decline to respond=88
work_vigactivity_days
STEPS P2
How much time do you spend doing vigorous-intensity activities at work on a typical day? (SELECT ONE)
Hours per day=1 Specify in open text field Minutes per day=2 Specify in open text field
Don’t know=77 Decline to respond=88
work_vigactivity_time
STEPS P3
Does your work involve moderate-intensity activity, that causes small increases in breathing or heart rate such as brisk walking [or carrying light loads] for at least 10 minutes continuously? [INSERT EXAMPLES] (USE SHOWCARD) (SELECT ONE)
Yes=1 No=0 If No, go to travel_walk10
Don’t know=77 If Don’t know, go to travel_walk10 Decline to respond==88 If Decline to respond, go to travel_walk10
work_modactivity
STEPS P4
In a typical week, on how many days do you do moderate-intensity activities as part of your work? (SELECT ONE)
Number of days=1 Specify in open text field Don’t know=77
Decline to respond=88
work_modactivity_days
STEPS P5
How much time do you spend doing moderate-intensity activities at work on a typical day? (SELECT ONE)
Hours per day=1 Specify in open text field Minutes per day=2 Specify in open text field
Don’t know=77 Decline to respond=88
work_modactivity_time
STEPS P6
Travel to and from places
The next questions exclude the physical activities at work that you have already mentioned. Now I would like to ask you about the usual way you travel to and from places. For example to work, for shopping, to the market, to your place of worship. [Insert other examples if needed]
Do you walk for at least 10 minutes continuously to get to and from places? (SELECT ONE)
Yes=1 No=0 If No, go to rec_vigactivity
Don’t know=77 If Don’t know, go to rec_vigactivity Decline to respond==88 If Decline to respond, go to rec_vigactivity
travel_walk10
STEPS P7

78
In a typical week, on how many days do you walk for at least 10 minutes continuously to get to and from places? (SELECT ONE)
Number of days=1 Specify in open text field Don’t know=77
Decline to respond=88
travel_walk10_days
STEPS P8
How much time do you spend walking for travel on a typical day? (SELECT ONE)
Hours per day=1 Specify in open text field Minutes per day=2 Specify in open text field
Don’t know=77 Decline to respond=88
travel_walk10_time
STEPS P9
Recreational activities
The next questions exclude the work and transport activities that you have already mentioned. Now I would like to ask you about sports, fitness and recreational activities (leisure), [Insert relevant terms].
Do you do any vigorous-intensity sports, fitness or recreational (leisure) activities that cause large increases in breathing or heart rate like [running or football] for at least 10 minutes continuously? [INSERT EXAMPLES] (USE SHOWCARD) (SELECT ONE)
Yes=1 No=0 If No, go to rec_modactivity
Don’t know=77 If Don’t know, go to rec_modactivity Decline to respond==88 If Decline to respond, go to rec_modactivity
rec_vigactivity
STEPS P10
In a typical week, on how many days do you do vigorous-intensity sports, fitness or recreational (leisure) activities? (SELECT ONE)
Number of days=1 Specify in open text field Don’t know=77
Decline to respond=88
rec_vigactivity_days
STEPS P11
How much time do you spend doing vigorous-intensity sports, fitness or recreational activities on a typical day? (SELECT ONE)
Hours per day=1 Specify in open text field Minutes per day=2 Specify in open text field
Don’t know=77 Decline to respond=88
rec_vigactivity_time
STEPS P12
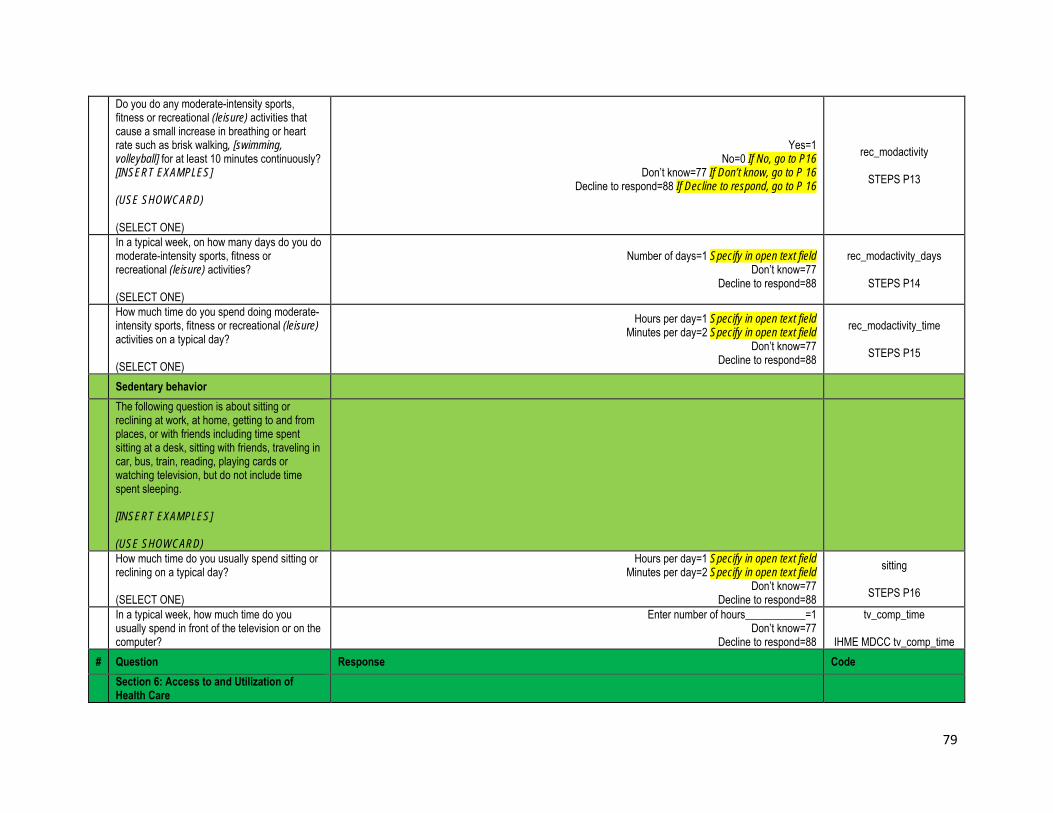
79
Do you do any moderate-intensity sports, fitness or recreational (leisure) activities that cause a small increase in breathing or heart rate such as brisk walking, [swimming, volleyball] for at least 10 minutes continuously? [INSERT EXAMPLES] (USE SHOWCARD) (SELECT ONE)
Yes=1 No=0 If No, go to P16
Don’t know=77 If Don’t know, go to P 16 Decline to respond=88 If Decline to respond, go to P 16
rec_modactivity
STEPS P13
In a typical week, on how many days do you do moderate-intensity sports, fitness or recreational (leisure) activities? (SELECT ONE)
Number of days=1 Specify in open text field Don’t know=77
Decline to respond=88
rec_modactivity_days
STEPS P14
How much time do you spend doing moderate-intensity sports, fitness or recreational (leisure) activities on a typical day? (SELECT ONE)
Hours per day=1 Specify in open text field Minutes per day=2 Specify in open text field
Don’t know=77 Decline to respond=88
rec_modactivity_time
STEPS P15
Sedentary behavior
The following question is about sitting or reclining at work, at home, getting to and from places, or with friends including time spent sitting at a desk, sitting with friends, traveling in car, bus, train, reading, playing cards or watching television, but do not include time spent sleeping. [INSERT EXAMPLES] (USE SHOWCARD)
How much time do you usually spend sitting or reclining on a typical day? (SELECT ONE)
Hours per day=1 Specify in open text field Minutes per day=2 Specify in open text field
Don’t know=77 Decline to respond=88
sitting
STEPS P16
In a typical week, how much time do you usually spend in front of the television or on the computer?
Enter number of hours___________=1 Don’t know=77
Decline to respond=88
tv_comp_time
IHME MDCC tv_comp_time # Question Response Code
Section 6: Access to and Utilization of Health Care

80
The next questions are about your access to health care and your utilization of health care services.
In what year did you last visit a doctor or other health professional for a routine checkup? A routine checkup is a general physical exam, not an exam for a specific injury, illness, or condition. (SELECT ONE)
1=Enter year (YYYY): ____ Specify in open text field 995=Never 77=Don’tknow 88=Decline to respond
hc_checkup_yr
How far away was the facility you attended from your home? (SELECT ONE)
1=Enter distance (km): ___ Specify in open text field 77=Don’t know 88=Decline to respond
hc_checkup_dist
How long did it take you to get there? Interviewer: If less than one hour, record minutes. (SELECT ONE)
1=Enter number of hours: ___ Specify in open text field 2=Enter number of minutes: ___ Specify in open text field 77=Don’t know 88=Decline to respond
hc_checkup_time
In what year did you last visit a hospital for medical attention for any reason? (SELECT ONE)
1=Enter year (YYYY): ____ Specify in open text field 995=I have never been to a hospital for medical attention. If Never, go to hc_clinic_yr 77=Don’tknow 88=Decline to respond
hc_hosp_yr
What was the type of the hospital that you last visited for medical attention for any reason? (SELECT ONE)
{This is a dropdown list} Governmental(MOH)=1
National Guard=2 Armed Forces=3
Military hospital=4 Private hospital=5
Other =6 Don’t know=77
Decline to respond=88
hc_hosp_type
What was the reason for your last visit to a hospital? (SELECT ONE)
Illness=1 Injury=2
Immunization=3 Other preventive service=4
Other, please specify=5 If Other, specify in open text field Don’t know=77
Decline to respond=88
hc_hosp_reason

81
In what year did you last visit a clinic for medical attention for any reason? (SELECT ONE)
1=Enter year (YYYY): ____ Specify in open text field 995=I have never been to a clinic for medical attention. If Never, go to hc_doctor_yr 77=Don’tknow 88=Decline to respond
hc_clinic_yr
What was the type of the clinic that you last visited for medical attention for any reason? (SELECT ONE)
{This is a dropdown list} Governmental (MOH)=1
National Guard=2 Armed Forces=3
Military clinic=4 Private clinic=5
Other =6 Don’t know=77
Decline to respond=88
hc_clinic_type
What was the reason for your last visit to a clinic? (SELECT ONE)
Illness=1 Injury=2
Immunization=3 Other preventive service=4
Other, please specify=5 If Other, specify in open text field Don’t know=77
Decline to respond=88
hc_clinic_reason
In what year did you last visit a doctor or other health professional for any other reason? (SELECT ONE)
Enter year: ____________ Specify in open text field 995=I have never visited a doctor or other health professional. If never, go to hc_usual_provider
77=Don’t know 88=Decline to respond
hc_doctor_yr
What was that reason? (SELECT ONE)
Illness=1 Injury=2
Immunization=3 Other preventive service=4
Other, please specify=5 If Other, specify in open text field Don’t know=77
Decline to respond=88
hc_doctor_reason
How far away was the facility you attended from your home? (SELECT ONE)
Enter distance (km): ___ Specify in open text field Don’t know=77
Decline to respond=88 hc_doctor_dist
How long did it take you to get there? Interviewer: If less than one hour, record minutes. (SELECT ONE)
Enter number of hours: ___ Specify in open text field Enter number of minutes: ___ Specify in open text field
Don’t know=77 Decline to respond=88
hc_doctor_time

82
Is there a clinic, doctor’s office, or other place that you usually go to when you are sick or need advice about your health care? (SELECT ONE)
There is ONE place=1 There is MORE THAN ONE place=2
No=0 Don’t know=77
Decline to respond=88
hc_usual_provider WAHS
NHANES HUQ.030
Breast Cancer
Show if respondent is a woman (sex=2) age 20 or older (age.age>=35 & age.age<120):
Do you know what a self-breast examination is? (SELECT ONE)
1=Yes 0=No 77=Don’t know 88=Refuse to respond
hc_breast_selfexam
MOHSA
How many times during the past 12 months have you self-examined your breasts?
Number of times ____ 77=Don’t know 88=Refuse to respond
hc_breast_selfexam1 hc_breast_selfexam1number
MOHSA
How many times during the past 12 months have you visited a doctor’s office or other health professional for a (clinical) breast examination?
Number of times___ 77=Don’t know 88= Refuse to respond
hc_breast_clinic hc_breast_clinicnumber
MOHSA
If you have children, how long did you breast-feed your last (or youngest) child?
Number of breast-feeding months ___ 77=Don’t know 88=Refuse to respond
hc_breast_feeding hc_breastfeedingmonths
MOHSA
If you have ever had a mammogram, in what year did you last have a mammogram? A mammogram is a screening test for breast tumors and cancers using a special type of x-ray.
Enter year (YYYY): ____ 995=Never 77=Don’tknow 88=Decline to respond
hc_mammogram_yr
# Question Response Code
Section 7: Oral Health During the past 12 months how many times did you visit a dental clinic for a check up (without any dental problem)? (SELECT ONE)
Never=0 Once=1
More than once=2 Don’t know=77
Decline to respond=88
oral_checkup
STEPS L1
During the past 12 months how many times did you visit a dental clinic for a dental complaint? (SELECT ONE)
Never=0 Once=1
More than once=2 Don’t know=77
Decline to respond=88
oral_complaint
STEPS L1a

83
How many times do you brush your teeth using a brush and tooth paste? (SELECT ONE)
Twice a day, or more=3 Once a day=2
Less than once a day=1 Never=0
oral_brush
STEPS L2
How many times per day do you floss your teeth?
Don’t floss=0 Less than once per day=1
Once per day=2 2 or more times per day=3
Don’t know=77 Refuse to respond=88
oral_floss
MOHSA
How many times do you use Miswak to clean your teeth? (SELECT ONE)
Twice a day, or more=3 Once a day=2
Less than once a day=1 Never=0
oral_miswak
STEPS L3
# Question Response Code
Section 8: History of Chronic Conditions
Now, we are asking about a variety of specific medical events that you may have experienced and medical conditions that you may have been diagnosed with in your lifetime.
Has a doctor or other health professional ever told you that you had a cerebral infarction, otherwise known as a stroke or brain attack? INTERVIEWER: Do not accept self-diagnosed or diagnosed by a person who is not a doctor or other health professional. (SELECT ONE)
1=Yes 0=No (skip to # / cardiacarrest) 77=Don’tknow (skip to # / cardiacarrest) 88=Decline to respond (skip to # / cardiacarrest)
stroke declined21
proxy21 IHME
In what year did you first receive this diagnosis? (SELECT ONE)
Enter year (YYYY): _____ Specify in open field text 77=Don’tknow 88=Decline to respond
stroke_dx_yr IHME
During the past 30 days, or since your diagnosis, have you ever taken medication for this condition? (SELECT ONE)
1=Yes, currently taking medication 2=Yes, previously took medication, but not currently 0=No, never took medication 77=Don’tknow 88=Decline to respond
stroke_meds IHME

84
Has a doctor or other health professional ever told you that you had a cardiac arrest, otherwise known as a cardiopulmonary arrest, circulatory arrest, or sudden death? (This is different from a heart attack. This would be a time when you were unconscious because your heart stopped suddenly, and you needed to be revived with CPR or defibrillation paddles.) INTERVIEWER: Do not accept self-diagnosed or diagnosed by a person who is not a doctor or other health professional. (SELECT ONE)
1=Yes 0=No (skip to # / mi) 77=Don’tknow (skip to # / mi) 88=Decline to respond (skip to # / mi)
cardiacarrest declined22
proxy22 IHME
In what year did you first receive this diagnosis? (SELECT ONE)
Enter year (YYYY): _____ Specify in open field text 77=Don’tknow 88=Decline to respond
cardiacarrest_dx_yr IHME
During the past 30 days, or since your diagnosis, have you ever taken medication for this condition? (SELECT ONE)
1=Yes, currently taking medication 2=Yes, previously took medication, but not currently 0=No, never took medication 77=Don’tknow 88=Decline to respond
cardiacarrest_meds IHME
Has a doctor or other health professional ever told you that you had a myocardial infarction, otherwise known as a heart attack? INTERVIEWER: Do not accept self-diagnosed or diagnosed by a person who is not a doctor or other health professional. (SELECT ONE)
1=Yes 0=No (skip to # / chd) 77=Don’tknow (skip to # / chd) 88=Decline to respond (skip to # / chd)
mi declined23
proxy23 IHME
In what year did you first receive this diagnosis? (SELECT ONE)
Enter year (YYYY): _____ Specify in open field text 77=Don’tknow 88=Decline to respond
mi_dx_yr IHME
During the past 30 days, or since your diagnosis, have you ever taken medication for this condition? (SELECT ONE)
1=Yes, currently taking medication 2=Yes, previously took medication, but not currently 0=No, never took medication 77=Don’tknow 88=Decline to respond
mi_meds IHME

85
Has a doctor or other health professional ever told you that you had congestive heart failure, otherwise known as heart failure, cardiomyopathy or having a “weak” heart? INTERVIEWER: Do not accept self-diagnosed or diagnosed by a person who is not a doctor or other health professional. (SELECT ONE)
1=Yes 0=No (skip to # / afib) 77=Don’tknow (skip to # / afib) 88=Decline to respond (skip to # / afib)
chf declined25
proxy25 IHME
In what year did you first receive this diagnosis? (SELECT ONE)
Enter year (YYYY): _____ Specify in open field text 77=Don’tknow 88=Decline to respond
chf_dx_yr
IHME
During the past 30 days, or since your diagnosis, have you ever taken medication for this condition? (SELECT ONE)
1=Yes, currently taking medication 2=Yes, previously took medication, but not currently 0=No, never took medication 77=Don’tknow 88=Decline to respond
chf_meds IHME
Has a doctor or other health professional ever told you that you had atrial fibrillation, otherwise known as irregular rhythm or “A-Fib”? (This is an irregular heart rhythm related to abnormal electrical conduction in the heart.) INTERVIEWER: Do not accept self-diagnosed or diagnosed by a person who is not a doctor or other health professional. (SELECT ONE)
1=Yes 0=No (skip to # / asthma) 77=Don’tknow (skip to # / asthma) 88=Decline to respond (skip to # / asthma)
afib declined26
proxy26 IHME
In what year did you first receive this diagnosis? (SELECT ONE)
Enter year (YYYY): _____ Specify in open field text 77=Don’tknow 88=Decline to respond
afib_dx_yr IHME
During the past 30 days, or since your diagnosis, have you ever taken medication for this condition? (SELECT ONE)
1=Yes, currently taking medication 2=Yes, previously took medication, but not currently 0=No, never took medication 77=Don’tknow 88=Decline to respond
afib_meds IHME

86
Has a doctor or other health professional ever told you that you had asthma, otherwise known as reactive airway disease? INTERVIEWER: Do not accept self-diagnosed or diagnosed by a person who is not a doctor or other health professional. (SELECT ONE)
1=Yes 0=No (skip to # / copd) 77=Don’tknow (skip to # / copd) 88=Decline to respond (skip to # / copd)
asthma declined27
proxy27 IHME
In what year did you first receive this diagnosis? (SELECT ONE)
Enter year (YYYY): _____ Specify in open field text 77=Don’tknow 88=Decline to respond
asthma_dx_yr IHME
During the past 30 days, or since your diagnosis, have you ever taken medication for this condition? (SELECT ONE)
1=Yes, currently taking medication 2=Yes, previously took medication, but not currently 0=No, never took medication 77=Don’tknow 88=Decline to respond
asthma_meds IHME
During the last 12 months did you have an attack of asthma? (SELECT ONE)
Yes=1 No=0
Don’t know=77 Decline to respond=88
asthma_attack
STEPS S3
During the past 12 months, has your asthma gotten worse?
\ Yes=1 \ No=0
\Don’t know=77 88\Decline to respond=88
asthma_worsen
MOHSA
During the past 12 months, how many times have you visited the hospital or emergency room because of worsening asthma symptoms?
1= Enter number of times: ______ Specify in open text field 0=Did not visit the hospital or ER 77=Don’t know 88= Decline to respond
asthma_hospital
MOHSA
Has a doctor or other health professional ever told you that you had chronic obstructive pulmonary disease, otherwise known as COPD, emphysema, or chronic bronchitis? INTERVIEWER: Do not accept self-diagnosed or diagnosed by a person who is not a doctor or other health professional. (SELECT ONE)
1=Yes 0=No (skip to # / dm) 77=Don’tknow (skip to # / dm) 88=Decline to respond (skip to # / dm)
copd declined28
proxy28 IHME

87
In what year did you first receive this diagnosis? (SELECT ONE)
Enter year (YYYY): _____ Specify in open field text 77=Don’tknow 88=Decline to respond
copd_dx_yr IHME
During the past 30 days, or since your diagnosis, have you ever taken medication for this condition? (SELECT ONE)
1=Yes, currently taking medication 2=Yes, previously took medication, but not currently 0=No, never took medication 77=Don’tknow 88=Decline to respond
copd_meds IHME
Have you ever had your blood sugar measured by a doctor or other health professional? (SELECT ONE)
Yes=1 No=0
Don’t know=77 Decline to respond=88
bloodsugar
STEPS H7
Has a doctor or other health professional ever told you that you had diabetes mellitus, otherwise known as diabetes, sugar diabetes, high blood glucose, or high blood sugar? If YES and respondent is female (c1==2): Was this only when you were pregnant? INTERVIEWER: Do not accept self-diagnosed or diagnosed by a person who is not a doctor or other health professional. (SELECT ONE)
1=Yes 2=Yes, but only during pregnancy (skip to # / predm) 0=No (skip to # / predm) 77=Don’tknow (skip to # / predm) 88=Decline to respond (skip to # / predm)
dm declined29
proxy29 IHME
BRFSS
What type of diabetes do you have? 1=Type 1 2=Type 2 77=I don’t know 88=decline to repond
dm_type
MOHSA
How old were you when you first received a diagnosis of diabetes mellitus?
1=Enter age: ______ Specify in open text field 77=Don’t know 88=Decline to respond
dm_dx_age dm_dx_agetext
MOHSA
In what year did you first receive this diagnosis? (SELECT ONE)
Enter year (YYYY): _____ Specify in open field text 77=Don’tknow 88=Decline to respond
dm_dx_yr IHME
During the past 30 days, or since your diagnosis, have you ever taken medication for this condition? (SELECT ONE)
1=Yes, currently taking medication 2=Yes, previously took medication, but not currently 0=No, never took medication 77=Don’tknow 88=Decline to respond
dm_meds IHME

88
In the last month did you visit a physician or other health professional for the management of your diabetes? (SELECT ONE)
Yes=1 No=0
Don’t know=77 Decline to respond=88
dm_management
STEPS H12
Please consider the following question with respect to the 6 types of treatment or advice below: Are you currently receiving any of the following treatments / advice for diabetes prescribed by a doctor or other health professional? (SELECT ONE FOR EACH TYPE OF TREATMENT / ADVICE)
dm_treatment
STEPS
Insulin Yes=1 No=0
Don’t know=77 Decline to respond=88
dm_insulin
STEPS H9a
Drugs (medication) that you have taken in the past two weeks
Yes=1 No=0
Don’t know=77 Decline to respond=88
dm_medications
STEPS H9b
Special prescribed diet Yes=1 No=0
Don’t know=77 Decline to respond=88
dm_diet
STEPS H9c
Advice or treatment to lose weight Yes=1 No=0
Don’t know=77 Decline to respond=88
dm_loseweight
STEPS H9d
Advice or treatment to stop smoking Yes=1 No=0
Don’t know=77 Decline to respond=88
dm_quitsmoking
STEPS H9e
Advice to start or do more exercise Yes=1 No=0
Don’t know=77 Decline to respond=88
dm_exercise
STEPS H9f
Have you ever seen a traditional healer for diabetes or raised blood sugar? (SELECT ONE)
Yes=1 No=0
Don’t know=77 Decline to respond=88
dm_healer
STEPS H10

89
Are you currently taking any herbal or traditional remedy for your diabetes? (SELECT ONE)
Yes=1 No=0
Don’t know=77 Decline to respond=88
dm_herbalmed
STEPS H11
Do you test your blood sugar at home? (SELECT ONE)
Yes=1 No=0
Don’t know=77 Decline to respond=88
dm_bloodsugar_home
STEPS H12
Do you visit the diabetes clinic or your doctor for diabetes on a regular basis? (SELECT ONE)
Yes=1 No=0
Don’t know=77 Decline to respond=88
dm_reg_clinicvisit
STEPS H13
Is there a family history of diabetes, do your parents (father or mother), children, brothers, or sisters suffer from diabetes? (SELECT ONE)
Yes=1 No=0
Don’t know=77 Decline to respond=88
dm_fmhx
STEPS H14
Has a doctor or other health professional ever told you that you had pre-diabetes mellitus, otherwise known as pre-diabetes, borderline diabetes, impaired fasting glucose, impaired glucose tolerance, or impaired sugar tolerance? Show if YES and respondent is female (c1==2): Was this only when you were pregnant? INTERVIEWER: Do not accept self-diagnosed or diagnosed by a person who is not a doctor or other health professional. (SELECT ONE)
1=Yes 2=Yes, but only during pregnancy (skip to # / renalfail) 0=No (skip to # / renalfail) 77=Don’tknow (skip to # / renalfail) 88=Decline to respond (skip to # / renalfail)
predm declined30
proxy30 IHME
BRFSS
In what year did you first receive this diagnosis? (SELECT ONE)
Enter year (YYYY): _____ Specify in open field text 77=Don’tknow 88=Decline to respond
predm_dx_yr IHME
During the past 30 days, or since your diagnosis, have you ever taken medication for this condition? (SELECT ONE)
1=Yes, currently taking medication 2=Yes, previously took medication, but not currently 0=No, never took medication 77=Don’tknow 88=Decline to respond
predm_meds IHME

90
Has a doctor or other health professional ever told you that you had chronic renal failure, otherwise known as chronic kidney failure, chronic renal disease, or chronic kidney disease? INTERVIEWER: Do not accept self-diagnosed or diagnosed by a person who is not a doctor or other health professional. (SELECT ONE)
1=Yes 0=No (skip to # / hpn) 77=Don’tknow (skip to # / hpn) 88=Decline to respond (skip to # / hpn)
renalfail declined31
proxy31 IHME
In what year did you first receive this diagnosis? (SELECT ONE)
Enter year (YYYY): _____ Specify in open field text 77=Don’tknow 88=Decline to respond
renalfail_dx_yr IHME
During the past 30 days, or since your diagnosis, have you ever taken medication for this condition? (SELECT ONE)
1=Yes, currently taking medication 2=Yes, previously took medication, but not currently 0=No, never took medication 77=Don’tknow 88=Decline to respond
renalfail_meds IHME
Have you ever had your blood pressure measured by a doctor or other health professional? (SELECT ONE)
Yes=1 No=0
Don’t know=77 Decline to respond=88
bloodpressure
STEPS H1
Has a doctor or other health professional ever told you that you had hypertension, otherwise known as high blood pressure? Show if YES and respondent is female (sex==2): Was this only when you were pregnant? INTERVIEWER: Do not accept self-diagnosed or diagnosed by a person who is not a doctor or other health professional. (SELECT ONE)
1=Yes 2=Yes, but only during pregnancy (skip to # / hce) 0=No (skip to # / hce) 77=Don’tknow (skip to # / hce) 88=Decline to respond (skip to # / hce)
hpn declined32
proxy32 IHME
BRFSS STEPS H2a
In what year did you first receive this diagnosis? (SELECT ONE)
Enter year (YYYY): _____ Specify in open field text 77=Don’tknow 88=Decline to respond
hpn_dx_yr IHME
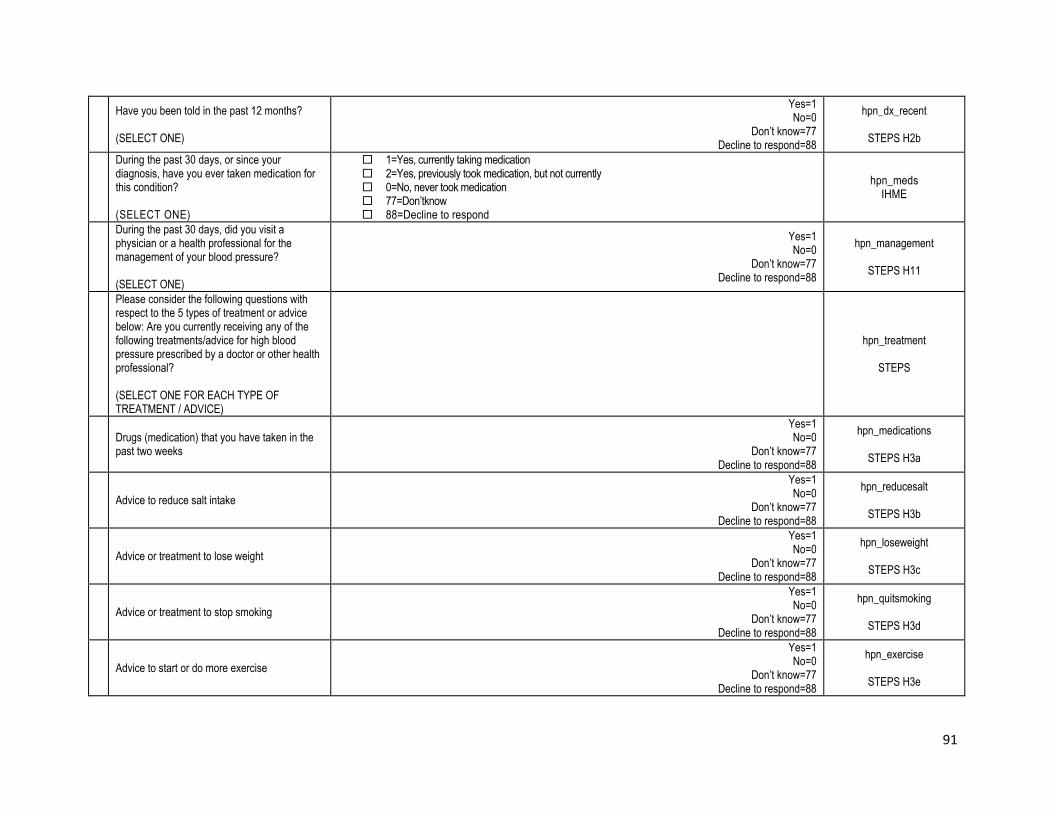
91
Have you been told in the past 12 months? (SELECT ONE)
Yes=1 No=0
Don’t know=77 Decline to respond=88
hpn_dx_recent
STEPS H2b
During the past 30 days, or since your diagnosis, have you ever taken medication for this condition? (SELECT ONE)
1=Yes, currently taking medication 2=Yes, previously took medication, but not currently 0=No, never took medication 77=Don’tknow 88=Decline to respond
hpn_meds IHME
During the past 30 days, did you visit a physician or a health professional for the management of your blood pressure? (SELECT ONE)
Yes=1 No=0
Don’t know=77 Decline to respond=88
hpn_management
STEPS H11
Please consider the following questions with respect to the 5 types of treatment or advice below: Are you currently receiving any of the following treatments/advice for high blood pressure prescribed by a doctor or other health professional? (SELECT ONE FOR EACH TYPE OF TREATMENT / ADVICE)
hpn_treatment
STEPS
Drugs (medication) that you have taken in the past two weeks
Yes=1 No=0
Don’t know=77 Decline to respond=88
hpn_medications
STEPS H3a
Advice to reduce salt intake Yes=1 No=0
Don’t know=77 Decline to respond=88
hpn_reducesalt
STEPS H3b
Advice or treatment to lose weight Yes=1 No=0
Don’t know=77 Decline to respond=88
hpn_loseweight
STEPS H3c
Advice or treatment to stop smoking Yes=1 No=0
Don’t know=77 Decline to respond=88
hpn_quitsmoking
STEPS H3d
Advice to start or do more exercise Yes=1 No=0
Don’t know=77 Decline to respond=88
hpn_exercise
STEPS H3e

92
Have you ever seen a traditional healer for raised blood pressure or hypertension? (SELECT ONE)
Yes=1 No=0
Don’t know=77 Decline to respond=88
hpn_healer
STEPS H4
Are you currently taking any herbal or traditional remedy for your raised blood pressure? (SELECT ONE)
Yes=1 No=0
Don’t know=77 Decline to respond=88
hpn_herbalmed
STEPS H6
Is there a family history of hypertension or do one of your parents (father or mother), children, brothers or sisters suffer from high blood pressure (hypertension)? (SELECT ONE)
Yes=1 No=0
Don’t know=77 Decline to respond=88
hpn_fmhx
STEPS H6
Has a doctor or other health professional ever told you that you had hypercholesterolemia, otherwise known as high or abnormal blood cholesterol? INTERVIEWER: Do not accept self-diagnosed or diagnosed by a person who is not a doctor or other health professional. (SELECT ONE)
1=Yes 0=No (skip to canev) 77=Don’tknow (skip to canev) 88=Decline to respond (skip to canev)
hce declined33
proxy33 IHME
In what year did you first receive this diagnosis? (SELECT ONE)
Enter year (YYYY): _____ Specify in open field text 77=Don’tknow 88=Decline to respond
hce_dx_yr IHME
During the past 30 days, or since your diagnosis, have you ever taken medication for this condition? (SELECT ONE)
1=Yes, currently taking medication 2=Yes, previously took medication, but not currently 0=No, never took medication 77=Don’tknow 88=Decline to respond
hce_meds IHME
Has a doctor or other health professional ever told you that you had cancer or a malignancy of any kind? (SELECT ONE)
Yes=1 No=0 Go to meds_chron_cond (if one of the medication questions in this section==yes) or go to N1a (if no
medications taken in this section) Don’t know=77 Go to meds_chron_cond (if one of the medication questions in this section==yes) or N1a (if
no medications taken in this section) Decline to respond=88 Go to meds_chron_cond (if one of the medication questions in this section==yes) or
N1a (if no medications taken in this section)
canev NHIS 2012 CAN.130

93
What kind of cancer was it? Interviewer: Enter code for the first kind of cancer. (SELECT ONE)
Bladder=01 Blood=02 Bone=03 Brain=04
Breast=05 Cervix=06 Colon=07
Esophagus=08 Gallbladder=09
Kidney=10 Larynx-Windpipe=11
Leukemia=12 Liver=13 Lung=14
Lymphoma=15 Melanoma=16
Mouth/Tongue/Lip=17 Ovary=18
Pancreas=19 Prostate=20 Rectum=21
Skin (non-melanoma)=22 Skin (don’t know what kind)=23
Soft tissue (muscle or fat)=24 Stomach=25
Testis=26 Throat-Pharynx=27
Thyroid=28 Uterus=29
Other, please specify=30 Specify in open text field Don’t know=77
Decline to respond=88
cankind NHIS 2012 ANC.140
In what year did you first receive this diagnosis? (SELECT ONE)
Enter year (YYYY): _____ Specify in open field text 77=Don’tknow 88=Decline to respond
can_dx_yr
During the past 30 days, or since your diagnosis, have you ever taken medication for this condition? (SELECT ONE)
1=Yes, currently taking medication 2=Yes, previously took medication, but not currently 0=No, never took medication 77=Don’tknow 88=Decline to respond
can_meds
# Question Response Code

94
Section 9: Inventory of Medications for Chronic Conditions {only shown if respondent answered yes to one of the medication questions in section 8}
You have indicated that you have taken medication for one or more of the conditions that we just discussed. Have you taken any of these medications in the past 30 days? (SELECT ONE)
1=Yes 0=No If No, go to N1a 77=Don’tknow If Don’t know, go to N1a 88=Decline to respond If Decline to respond, go to N1a
meds_chron_cond
{only shown if respondent answered yes to one of the medication questions in section 8 & responded yes to meds_chron_cond (meds_chron_cond==1)} Now, you will be asked specific questions about each of the medications that you have taken in the past 30 days for any of the chronic conditions mentioned in this survey. This includes any prescription medications or over-the-counter medications you might have used. Please gather all of these medications so we may review them together. Being able to refer to the information printed on the labels of your medication and supplement containers will help you to answer the following questions.
What is the name of the medication? If you have the medication container in front of you, please read the name of the medication that is printed on the container? (SELECT ONE)
Enter name of medication: ____ (verify spelling, if possible) Specify in open text field 77=Don’tknow 88=Decline to respond
med_name1 …
med_name10
IHME MDCC
What is the strength of this medication? If you have the medication container in front of you, please read the drug strength that is printed on the container. (For example, 10mg per tablet.) (SELECT ONE)
Enter strength of medication: ____ Specify in open text field 77=Don’tknow 88=Decline to respond
med_strength1 …
med_strength10
IHME MDCC
What is the main reason you were prescribed this medication? (SELECT ONE)
Enter reason: ____ Specify in open text field 77=Don’tknow 88=Decline to respond
med_reason1 …
med_reason10
IHME MDCC

95
For how long have you been prescribed this medication? (SELECT ONE)
Enter number of days: ____ Specify in open text field Enter number of weeks: ____ Specify in open text field Enter number of months: ____ Specify in open text field Enter number of years: ____ Specify in open text field 77=Don’tknow 88=Decline to respond
med_dur1 …
med_dur10
IHME MDCC
Many patients find it difficult to take all their medications exactly as prescribed. In the past 30 days, how often did you use this medication? (SELECT ONE)
4=Every day 3=Every other day 2=At least once a week 1=Less than once a week 0=Never 77=Don’tknow 88=Decline to respond
med_freq1 …
med_freq10
IHME MDCC
What are exact dosing instructions for this medication? If you have the medication container in front of you, please read the dosing instructions that are printed on the container. (For example, 1 pill twice a day.) (SELECT ONE)
Enter dosing instructions: ____ Specify in open text field 77=Don’tknow 88=Decline to respond
med_doseinstr1 …
med_doseinstr10
IHME MDCC
It can be very hard to follow dosing instructions exactly as prescribed. Below is a list of common reasons why people may not take their medications exactly as prescribed. Please let me know if any of these apply to you: (SELECT ALL THAT APPLY)
1=I felt better 2=I did not feel better 3=I felt worse 4=Medication made me feel better 5=Medication did not make me feel better 6=Medication made me feel worse 7=Experienced side effects from medication 8=Didn’t like the taste of medication 9=Forgot to take medication 10=Did not understand the dosing instructions 11=Medication is too expensive to take all the time 12=Was unable to obtain a refill prescription 13=Doctor or other health professional told me to stop 14=Other reason If Other, specify in open text field 95=Not applicable. I take this medication exactly as prescribed 77=Don’tknow 88=Decline to respond
med_nonadhere1 …
med_nonadhere10
IHME MDCC
Do you take another medication? (SELECT ONE)
1=Yes 0=No 77=Don’tknow 88=Decline to respond
another_med1 …
another_med10
IHME MDCC

96
{ SHOW IF another_med10==1} Please list the names of any other medications that you used in the past 30 days. Do not include any medications that you told us about before. (SELECT ALL THAT APPLY)
Enter name of medication: ____ (verify spelling, if possible) Enter name of medication: ____ (verify spelling, if possible) Enter name of medication: ____ (verify spelling, if possible) Enter name of medication: ____ (verify spelling, if possible) Enter name of medication: ____ (verify spelling, if possible) Enter name of medication: ____ (verify spelling, if possible) Enter name of medication: ____ (verify spelling, if possible) Enter name of medication: ____ (verify spelling, if possible) Enter name of medication: ____ (verify spelling, if possible) Enter name of medication: ____ (verify spelling, if possible) 77=Don’tknow 88=Decline to respond
med_other1 …
med_other10
IHME MDCC
Who usually pays for your medications? (SELECT ONE)
1= Governmental health facility (medical center / hospital) 2=Private health insurance 3=Out-of-pocket 4=Charity / donation 77=Don’t know 88=Decline to respond
med_insurance
Vitamin D
How long are you usually exposed to direct sunlight during the week (in minutes)?
1=Duration in minutes _____ Specify in open text field 77=Don’t know 88=Decline to respond
sunlight sunlightmins
Do you take vitamin D supplements regularly? 1= Yes 0=No 777=Don’t know 999= Decline to respond
vitamind
# Question Response Code
Section 10: Miscellaneous Health Behaviors Do you know the telephone number for the Red Crescent? (SELECT ONE)
Yes1 No=0
Don’t know=77 Decline to respond=88
tel_red_crescent
STEPS N1a
What is the telephone number for the Red Crescent? (SELECT ONE)
Enter telephone number: ________ Specify in open text field Don’t know=77
Decline to respond=88
tel_num_red_crescent
STEPS N1a
Do you know the telephone number for the Civil Defense? (SELECT ONE)
Yes1 No=0
Don’t know=77 Decline to respond=88
tel_civil_defense
STEPS N1b

97
What is the telephone number for the Civil Defense? (SELECT ONE)
Enter telephone number: ________ Specify in open text field Don’t know=77
Decline to respond=88
tel_num_civil_defense
STEPS N1b
Do you know the telephone number for the Traffic Police? (SELECT ONE)
Yes1 No=0
Don’t know=77 Decline to respond=88
tel_traffic_police
STEPS N1v
What is the telephone number for the Traffic Police? (SELECT ONE)
Enter telephone number: ________ Specify in open text field Don’t know=77
Decline to respond=88
tel_num_traffic_police
STEPS N1c
If respondent is male (c1==1): Have you ever had a driving license? (SELECT ONE)
Yes=1 No=0
Don’t know=77 Decline to respond=88
driver_license
STEPS N2
If respondent is male (c1==1): Do you talk on your mobile while driving using the handset? (SELECT ONE)
Never=1 Sometimes=2
Always=3 Don t drive=4
Don’t know=77 Decline to respond=88
driving_cellphone
STEPS N3
If respondent is male (c1==1): Do you talk on your mobile while driving using some hands free accessory? (SELECT ONE)
Never=1 Sometimes=2
Always=3 Don t drive=4
Don’t know=77 Decline to respond=88
driving_handsfree
STEPS N4
If respondent is male (c1==1): Do you follow speed limits while driving? (SELECT ONE)
Never=1 Sometimes=2
Always=3 Don t drive=4
Don’t know=77 Decline to respond=88
driving_speedlimit
STEPS N5
If respondent is male (c1==1): Do you use seatbelts while driving? (SELECT ONE)
Never=1 Sometimes=2
Always=3 Don t drive=4
Don’t know=77 Decline to respond=88
driving_seatbelt
STEPS N6

98
Do you use seat belt while travelling in the front passenger seat? (SELECT ONE)
Never=1 Sometimes=2
Always=3 Don’t know=77
Decline to respond=88
driving_seatbelt_front
STEPS N7
Do you use seat belt while travelling in the back passenger seat? (SELECT ONE)
Never=1 Sometimes=2
Always=3 Don’t know=77
Decline to respond=88
driving_seatbelt_back
STEPS N8
Do you have smoke detector installed in your house?
Yes=1 No=0
Don’t know=77 Decline to respond=88
house_smokedetector
Selected Adult Physical Measurements
# Question Response Code
Section 1: Anthropometry
23
23 Height Measurement: sec1_height
23 Height (in centimeters) Enter height (cm): Specify in open text field Declined measurement or could not measure participant’s height=88
pe_height pe_heightcm
M3
STEPS M3
23 Weight Measurement: sec1_weight
23 Weight (in kilograms) Enter weight (kg): Specify in open text field
Too heavy for scale=2 Declined measurement or could not measure participant’s height=88
pe_weight weightkg
M4
STEPS M4
24 Waist Measurement: sec1_waist_hip_thigh
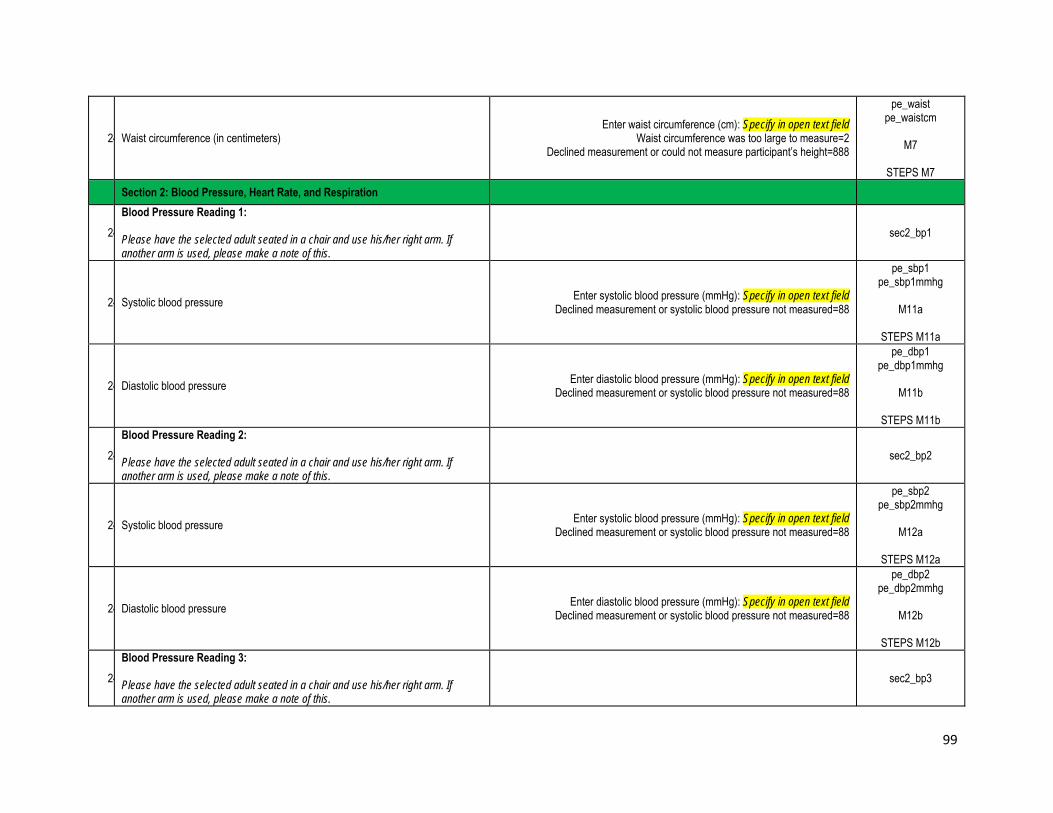
99
24 Waist circumference (in centimeters) Enter waist circumference (cm): Specify in open text field
Waist circumference was too large to measure=2 Declined measurement or could not measure participant’s height=888
pe_waist pe_waistcm
M7
STEPS M7
Section 2: Blood Pressure, Heart Rate, and Respiration
24Blood Pressure Reading 1: Please have the selected adult seated in a chair and use his/her right arm. If another arm is used, please make a note of this.
sec2_bp1
24 Systolic blood pressure Enter systolic blood pressure (mmHg): Specify in open text field Declined measurement or systolic blood pressure not measured=88
pe_sbp1 pe_sbp1mmhg
M11a
STEPS M11a
24 Diastolic blood pressure Enter diastolic blood pressure (mmHg): Specify in open text field Declined measurement or systolic blood pressure not measured=88
pe_dbp1 pe_dbp1mmhg
M11b
STEPS M11b
24Blood Pressure Reading 2: Please have the selected adult seated in a chair and use his/her right arm. If another arm is used, please make a note of this.
sec2_bp2
24 Systolic blood pressure Enter systolic blood pressure (mmHg): Specify in open text field Declined measurement or systolic blood pressure not measured=88
pe_sbp2 pe_sbp2mmhg
M12a
STEPS M12a
24 Diastolic blood pressure Enter diastolic blood pressure (mmHg): Specify in open text field Declined measurement or systolic blood pressure not measured=88
pe_dbp2 pe_dbp2mmhg
M12b
STEPS M12b
24Blood Pressure Reading 3: Please have the selected adult seated in a chair and use his/her right arm. If another arm is used, please make a note of this.
sec2_bp3

100
24 Systolic blood pressure Enter systolic blood pressure (mmHg): Specify in open text field Declined measurement or systolic blood pressure not measured=88
pe_sbp3 pe_sbp3mmhg
M13a
STEPS M13a
25 Diastolic blood pressure Enter diastolic blood pressure (mmHg): Specify in open text field Declined measurement or systolic blood pressure not measured=88
pe_dbp3 pe_dbp3mmhg
M13b
STEPS M13b
25 Notes on blood pressure readings, if any: Specify in open text field
pe_bp_notes
M13c
IHME MDCC
25During the past two weeks, have you been treated for raised blood pressure with drugs (medication) prescribed by a doctor or other health professional? (SELECT ONE)
Yes=1 No=0
Don’t know=77 Decline to respond=88
pe_bp_meds
M14
STEPS M14 25 Heart Rate Readings: sec2_heart_rate
25 Heart rate reading 1 Enter beats per minute: Specify in open text field Declined measurement or heart rate not measured=88
pe_heart1 pe_heartbpm
M16a
STEPS M16a
25 Heart rate reading 2 Enter beats per minute: Specify in open text field Declined measurement or heart rate not measured=88
pe_heart2 pe_heartbpm
M16b
STEPS M16b
25 Heart rate reading 3 Enter beats per minute: Specify in open text field Declined measurement or heart rate not measured=88
pe_heart3 pe_heart3bpm
M16c
STEPS M16c
25 Respiratory Rate: sec2_resp_spo2_siro
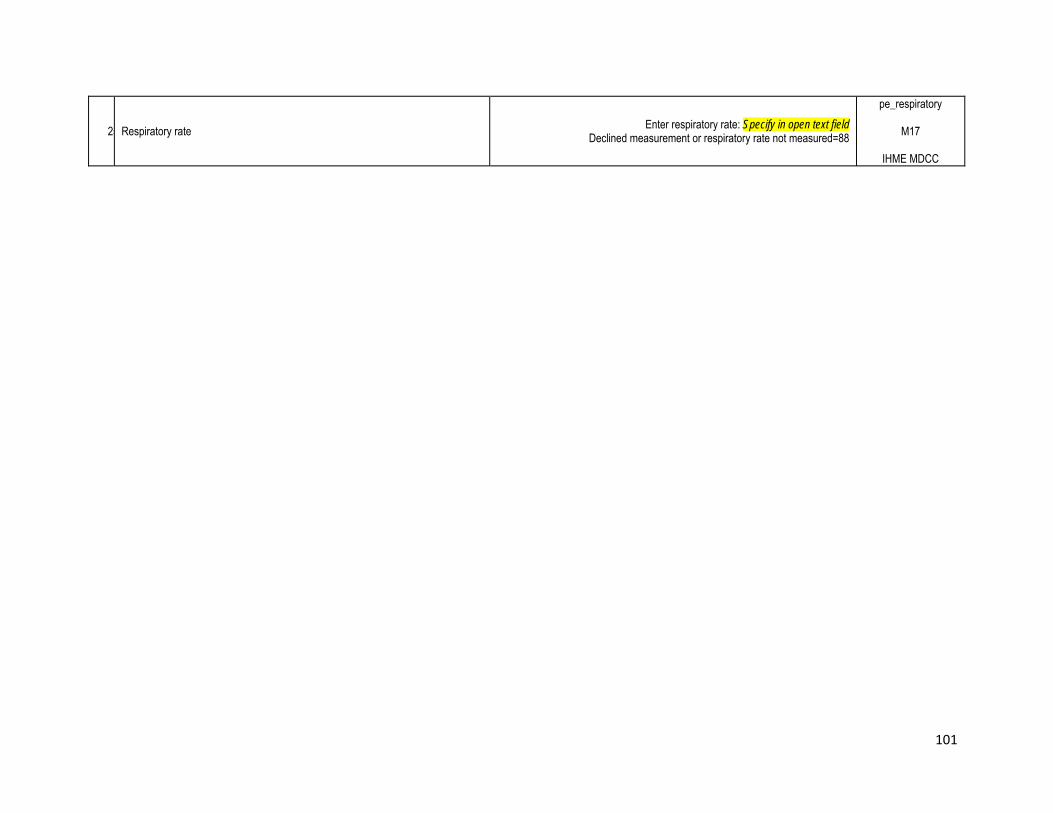
101
25 Respiratory rate Enter respiratory rate: Specify in open text field Declined measurement or respiratory rate not measured=88
pe_respiratory
M17
IHME MDCC

102
Module 3: Disposition Codes
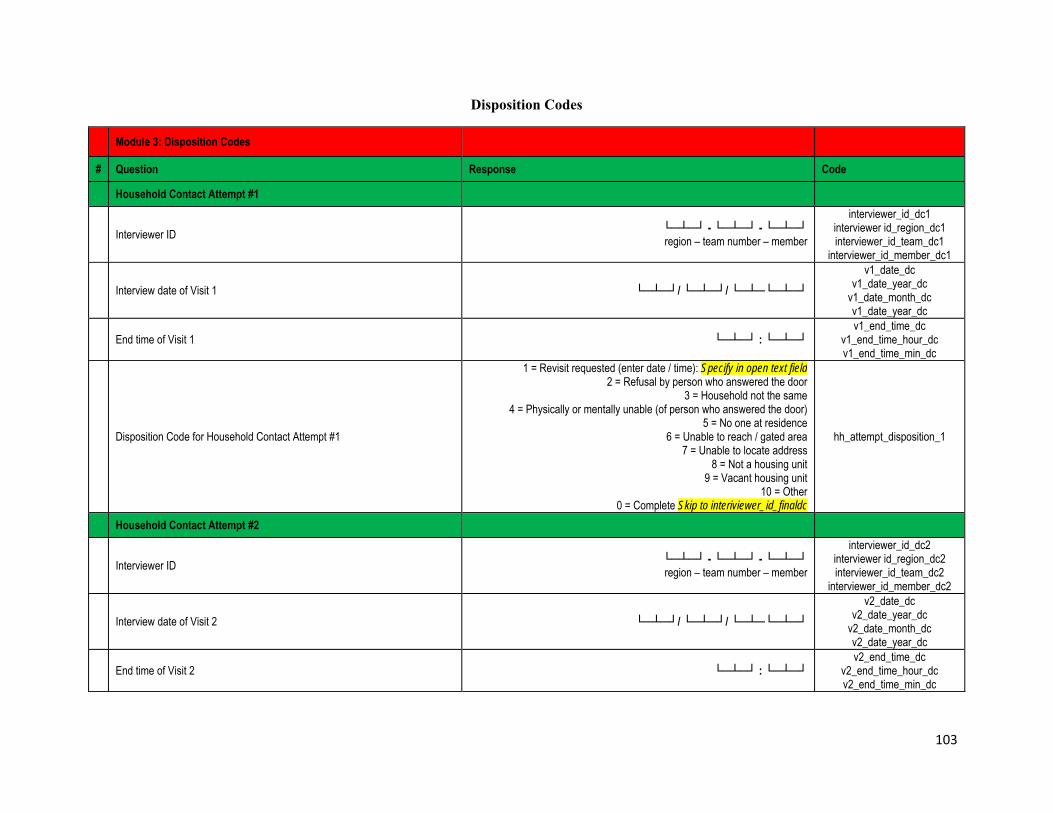
103
Disposition Codes
Module 3: Disposition Codes
# Question Response Code
Household Contact Attempt #1
Interviewer ID └─┴─┘ - └─┴─┘ - └─┴─┘ region – team number – member
interviewer_id_dc1 interviewer id_region_dc1 interviewer_id_team_dc1
interviewer_id_member_dc1
Interview date of Visit 1 └─┴─┘/ └─┴─┘/ └─┴─└─┴─┘ v1_date_dc
v1_date_year_dc v1_date_month_dc v1_date_year_dc
End time of Visit 1 └─┴─┘ : └─┴─┘ v1_end_time_dc
v1_end_time_hour_dc v1_end_time_min_dc
Disposition Code for Household Contact Attempt #1
1 = Revisit requested (enter date / time): Specify in open text field 2 = Refusal by person who answered the door
3 = Household not the same 4 = Physically or mentally unable (of person who answered the door)
5 = No one at residence 6 = Unable to reach / gated area
7 = Unable to locate address 8 = Not a housing unit
9 = Vacant housing unit 10 = Other
0 = Complete Skip to interiviewer_id_finaldc
hh_attempt_disposition_1
Household Contact Attempt #2
Interviewer ID └─┴─┘ - └─┴─┘ - └─┴─┘ region – team number – member
interviewer_id_dc2 interviewer id_region_dc2 interviewer_id_team_dc2
interviewer_id_member_dc2
Interview date of Visit 2 └─┴─┘/ └─┴─┘/ └─┴─└─┴─┘ v2_date_dc
v2_date_year_dc v2_date_month_dc v2_date_year_dc
End time of Visit 2 └─┴─┘ : └─┴─┘ v2_end_time_dc
v2_end_time_hour_dc v2_end_time_min_dc

104
Disposition Code for Household Contact Attempt #2
1 = Revisit requested (enter date / time): Specify in open text field 2 = Refusal by person who answered the door
3 = Household not the same 4 = Physically or mentally unable (of person who answered the door)
5 = No one at residence 6 = Unable to reach / gated area
7 = Unable to locate address 8 = Not a housing unit
9 = Vacant housing unit 10 = Other
0 = Complete Skip to interiviewer_id_finaldc
hh_attempt_disposition_2
Household Contact Attempt #3
Interviewer ID └─┴─┘ - └─┴─┘ - └─┴─┘ region – team number – member
interviewer_id_dc3 interviewer id_region_dc3 interviewer_id_team_dc3
interviewer_id_member_dc3
Interview date of Visit 3 └─┴─┘/ └─┴─┘/ └─┴─└─┴─┘ v3_date_dc
v3_date_year_dc v3_date_month_dc v3_date_year_dc
End time of Visit 3 └─┴─┘ : └─┴─┘ v3_end_time_dc
v3_end_time_hour_dc v3_end_time_min_dc
Disposition Code for Household Contact Attempt #3
1 = Revisit requested (enter date / time): Specify in open text field 2 = Refusal by person who answered the door
3 = Household not the same 4 = Physically or mentally unable (of person who answered the door)
5 = No one at residence 6 = Unable to reach / gated area
7 = Unable to locate address 8 = Not a housing unit
9 = Vacant housing unit 10 = Other
0 = Complete Skip to interiviewer_id_finaldc
hh_attempt_disposition_3
Household Contact Attempt #4
Interviewer ID └─┴─┘ - └─┴─┘ - └─┴─┘ region – team number – member
interviewer_id_dc4 interviewer id_region_dc4 interviewer_id_team_dc4
interviewer_id_member_dc4
Interview date of Visit 4 └─┴─┘/ └─┴─┘/ └─┴─└─┴─┘ v4_date_dc
v4_date_year_dc v4_date_month_dc v4_date_year_dc

105
End time of Visit 4 └─┴─┘ : └─┴─┘ v4_end_time_dc
v4_end_time_hour_dc v4_end_time_min_dc
Disposition Code for Household Contact Attempt #4
1 = Revisit requested (enter date / time): Specify in open text field 2 = Refusal by person who answered the door
3 = Household not the same 4 = Physically or mentally unable (of person who answered the door)
5 = No one at residence 6 = Unable to reach / gated area
7 = Unable to locate address 8 = Not a housing unit
9 = Vacant housing unit 10 = Other
0 = Complete Skip to interiviewer_id_finaldc
hh_attempt_disposition_4
Household Contact Attempt #5
Interviewer ID └─┴─┘ - └─┴─┘ - └─┴─┘ region – team number – member
interviewer_id_dc5 interviewer id_region_dc5 interviewer_id_team_dc5
interviewer_id_member_dc5
Interview date of Visit 5 └─┴─┘/ └─┴─┘/ └─┴─└─┴─┘ v5_date_dc
v5_date_year_dc v5_date_month_dc v5_date_year_dc
End time of Visit 5 └─┴─┘ : └─┴─┘ v5_end_time_dc
v5_end_time_hour_dc v5_end_time_min_dc
Disposition Code for Household Contact Attempt #5
1 = Revisit requested (enter date / time): Specify in open text field 2 = Refusal by person who answered the door
3 = Household not the same 4 = Physically or mentally unable (of person who answered the door)
5 = No one at residence 6 = Unable to reach / gated area
7 = Unable to locate address 8 = Not a housing unit
9 = Vacant housing unit 10 = Other
0 = Complete Skip to interiviewer_id_finaldc
hh_attempt_disposition_5
Household Contact Attempt #6
Interviewer ID └─┴─┘ - └─┴─┘ - └─┴─┘ region – team number – member
interviewer_id_dc6 interviewer id_region_dc6 interviewer_id_team_dc6
interviewer_id_member_dc6

106
Interview date of Visit 6 └─┴─┘/ └─┴─┘/ └─┴─└─┴─┘ v6_date_dc
v6_date_year_dc v6_date_month_dc v6_date_year_dc
End time of Visit 6 └─┴─┘ : └─┴─┘ v6_end_time_dc
v6_end_time_hour_dc v6_end_time_min_dc
Disposition Code for Household Contact Attempt #6
1 = Revisit requested (enter date / time): Specify in open text field 2 = Refusal by person who answered the door
3 = Household not the same 4 = Physically or mentally unable (of person who answered the door)
5 = No one at residence 6 = Unable to reach / gated area
7 = Unable to locate address 8 = Not a housing unit
9 = Vacant housing unit 10 = Other
0 = Complete Skip to interiviewer_id_finaldc
hh_attempt_disposition_6
Final Result of Interview (Final Disposition Codes)
Interviewer ID └─┴─┘ - └─┴─┘ - └─┴─┘ region – team number – member
interviewer_id_finaldc interviewer id_region_finaldc interviewer_id_team_finaldc
interviewer_id_member_finaldc
Final date of interview └─┴─┘/ └─┴─┘/ └─┴─└─┴─┘ final_disposition_visit_date final_disposition_date_day
final_disposition_date_month final_disposition_date_year
End time of final interview └─┴─┘ : └─┴─┘ final_disposition_end_time final_disposition_time_hour final_disposition_time_min
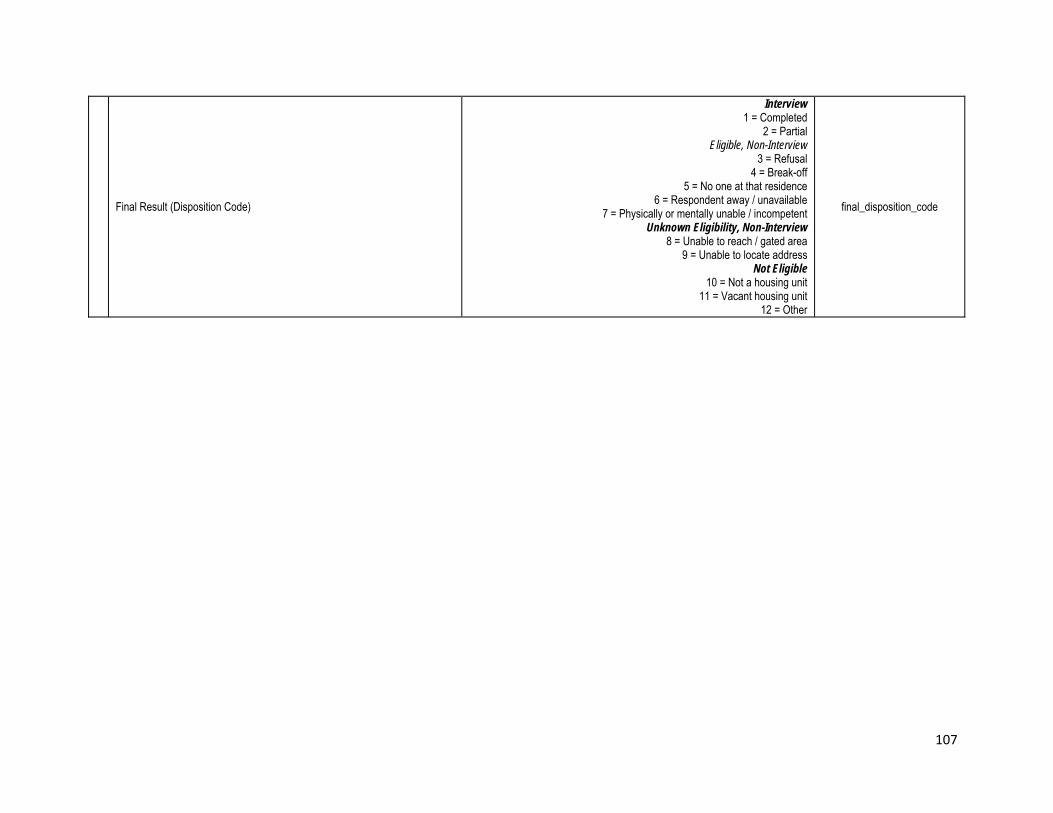
107
Final Result (Disposition Code)
Interview 1 = Completed
2 = Partial Eligible, Non-Interview
3 = Refusal 4 = Break-off
5 = No one at that residence 6 = Respondent away / unavailable
7 = Physically or mentally unable / incompetent Unknown Eligibility, Non-Interview
8 = Unable to reach / gated area 9 = Unable to locate address
Not Eligible 10 = Not a housing unit
11 = Vacant housing unit 12 = Other
final_disposition_code

108
Module 4: Selected adult biochemical measurements
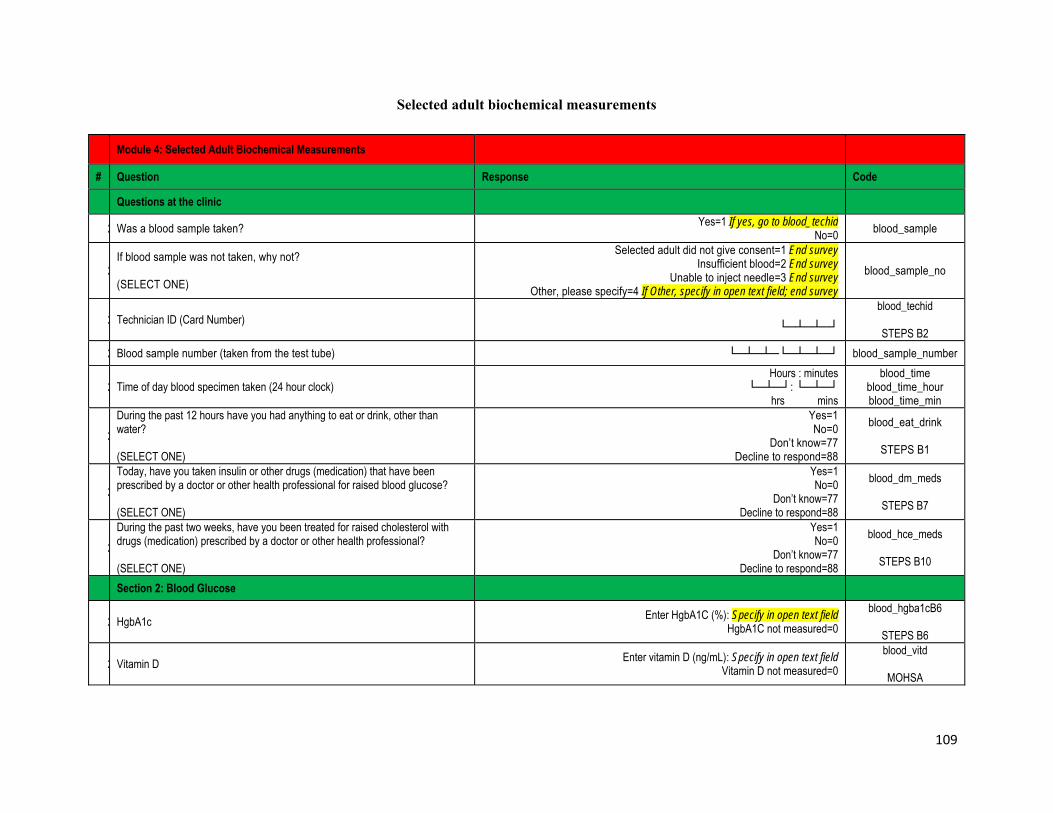
109
Selected adult biochemical measurements
Module 4: Selected Adult Biochemical Measurements
# Question Response Code
Questions at the clinic
2 Was a blood sample taken? Yes=1 If yes, go to blood_techid No=0 blood_sample
2If blood sample was not taken, why not? (SELECT ONE)
Selected adult did not give consent=1 End survey Insufficient blood=2 End survey
Unable to inject needle=3 End survey Other, please specify=4 If Other, specify in open text field; end survey
blood_sample_no
2 Technician ID (Card Number) └─┴─┴─┘
blood_techid
STEPS B2 2 Blood sample number (taken from the test tube) └─┴─┴─└─┴─┴─┘ blood_sample_number
2 Time of day blood specimen taken (24 hour clock) Hours : minutes
└─┴─┘: └─┴─┘ hrs mins
blood_time blood_time_hour blood_time_min
2During the past 12 hours have you had anything to eat or drink, other than water? (SELECT ONE)
Yes=1 No=0
Don’t know=77 Decline to respond=88
blood_eat_drink
STEPS B1
2Today, have you taken insulin or other drugs (medication) that have been prescribed by a doctor or other health professional for raised blood glucose? (SELECT ONE)
Yes=1 No=0
Don’t know=77 Decline to respond=88
blood_dm_meds
STEPS B7
2During the past two weeks, have you been treated for raised cholesterol with drugs (medication) prescribed by a doctor or other health professional? (SELECT ONE)
Yes=1 No=0
Don’t know=77 Decline to respond=88
blood_hce_meds
STEPS B10
Section 2: Blood Glucose
2 HgbA1c Enter HgbA1C (%): Specify in open text field HgbA1C not measured=0
blood_hgba1cB6
STEPS B6
2 Vitamin D Enter vitamin D (ng/mL): Specify in open text field Vitamin D not measured=0
blood_vitd
MOHSA

110
2Total cholesterol
Enter total cholesterol (mmol/L): Specify in open text field Total cholesterol not measured=0
blood_totcholesterol
B9
STEPS B9
2 Triglycerides Enter triglyceride (mmol/L): Specify in open text field Triglycerides not measured=0
blood_triglycerides
MOHSA
2 HDL Enter HDL (mmol/L): Specify in open text field HDL not measured=0
blood_hdl
MOHSA
3 LDL Enter LDL (mmol/L): Specify in open text field LDL not measured=0
blood_ldl
MOHSA