Embed Size (px)
Citation preview

SAUDI BASIC INDUSTRIES CORPORATION
(SABIC) AND ITS SUBSIDIARIES (A Saudi Joint Stock Company)
CONSOLIDATED FINANCIAL STATEMENTS
FOR THE YEAR ENDED 31 DECEMBER 2018 AND
INDEPENDENT AUDITOR’S REPORT
SAUDI BASIC INDUSTRIES CORPORATION (SABIC) AND ITS SUBSIDIARIES
(A Saudi Joint Stock Company)
CONSOLIDATED FINANCIAL STATEMENTS
FOR THE YEAR ENDED 31 DECEMBER 2018
INDEX Pages
Independent auditor’s report -
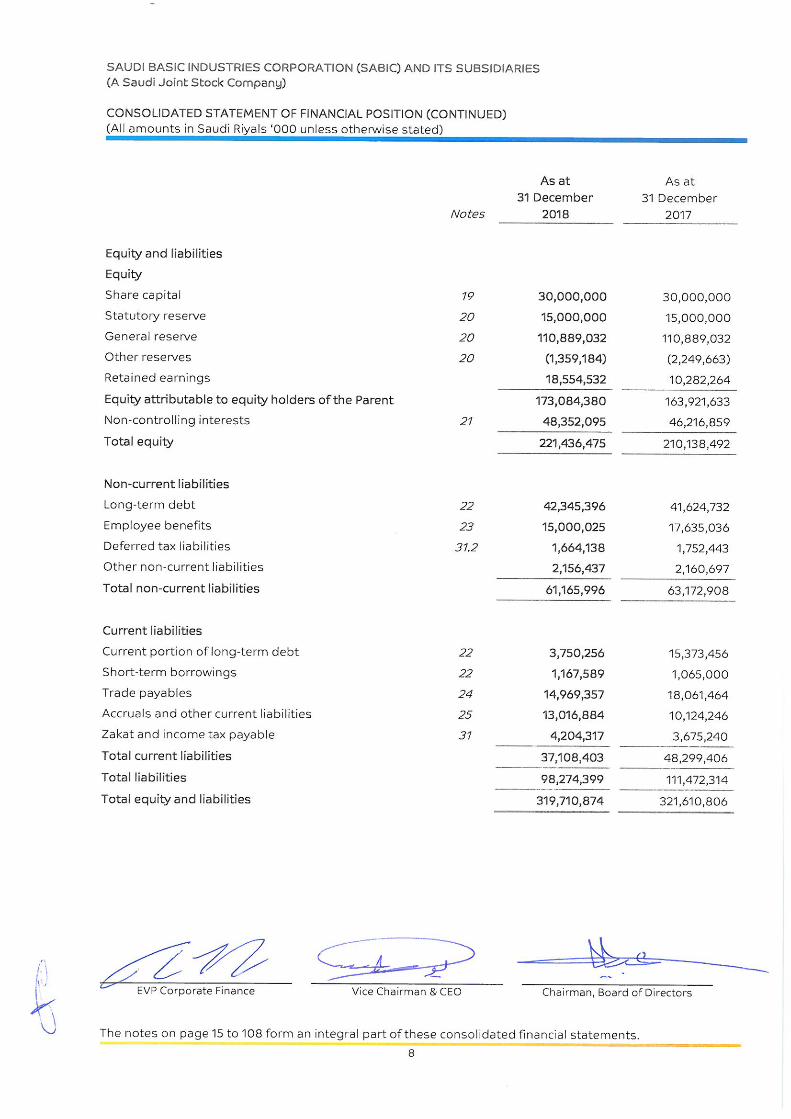
Consolidated statement of financial position 7 – 8
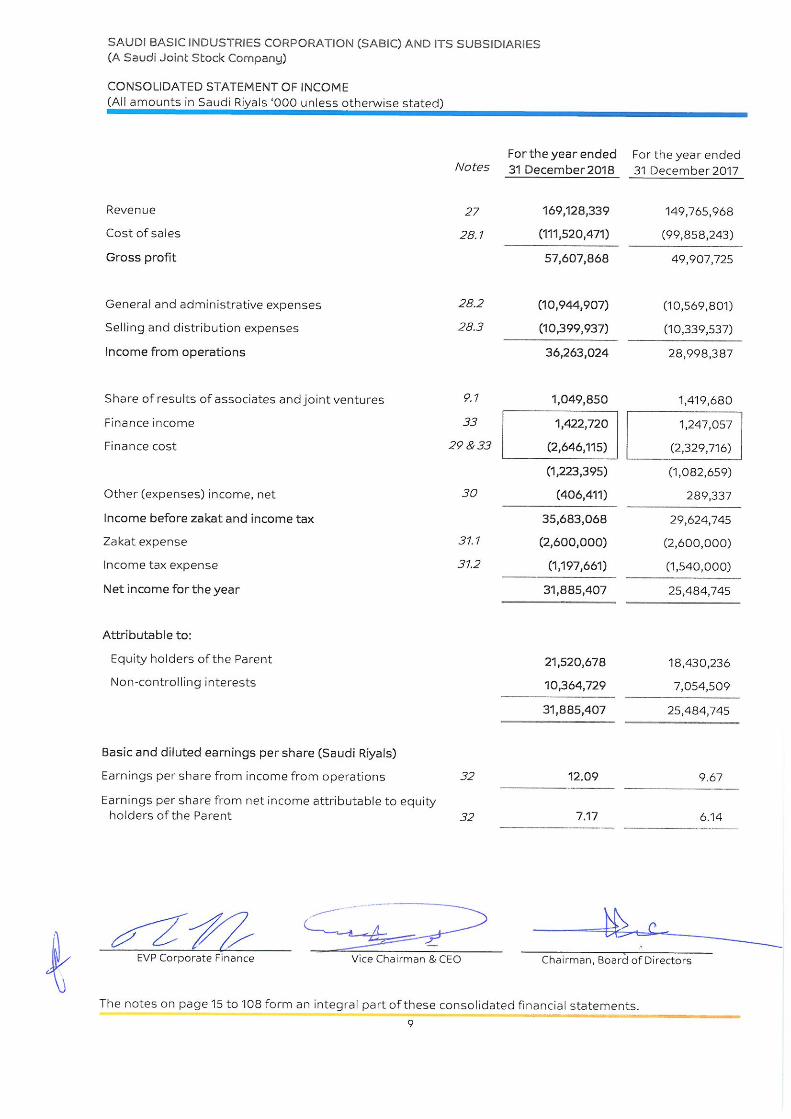
Consolidated statement of income 9
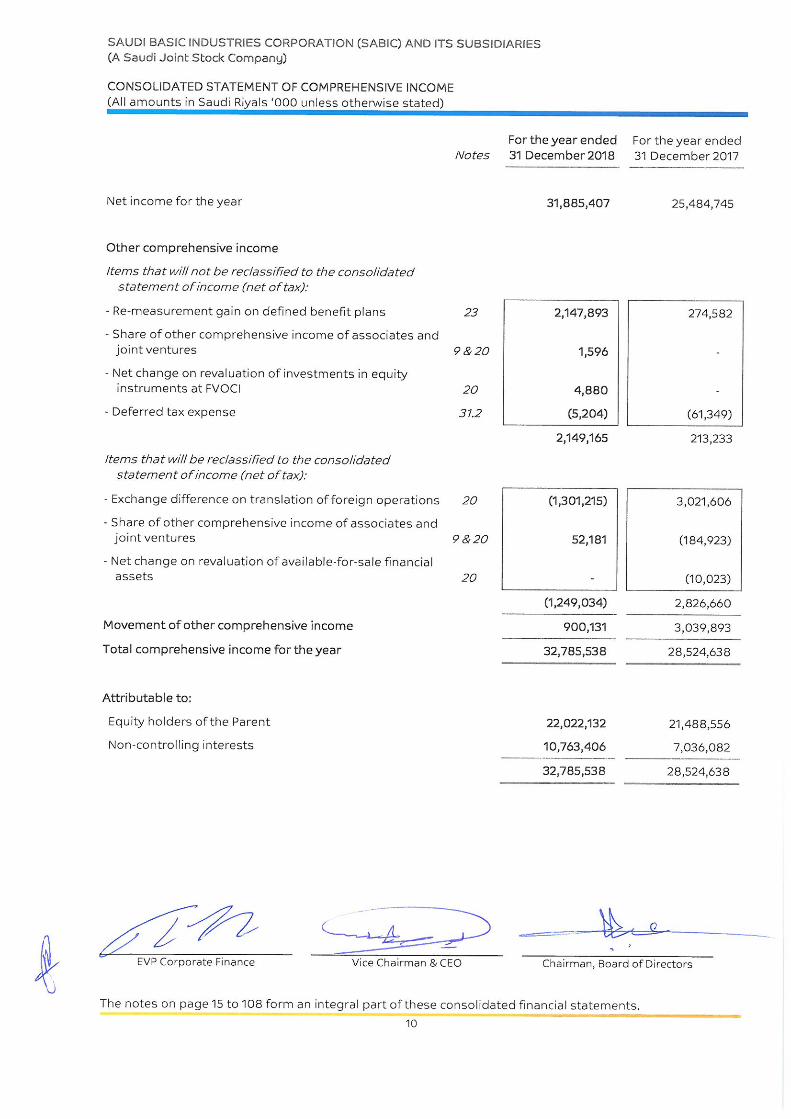
Consolidated statement of comprehensive income 10
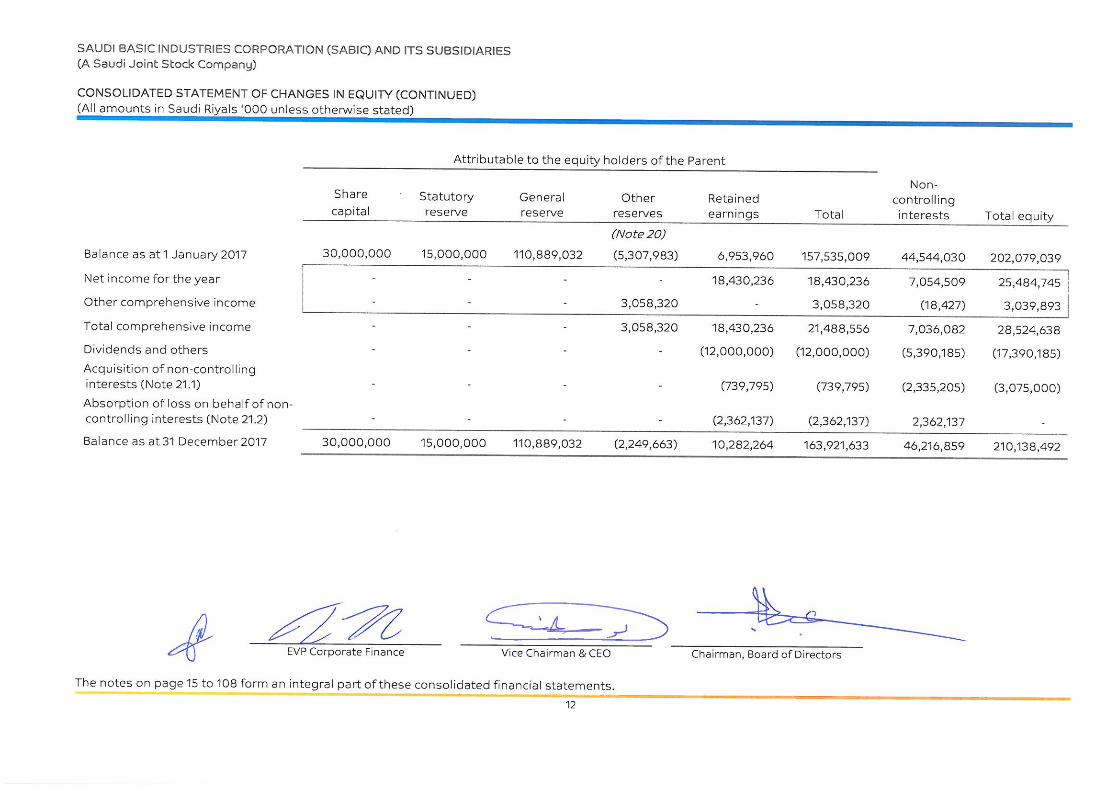
Consolidated statement of changes in equity 11 – 12
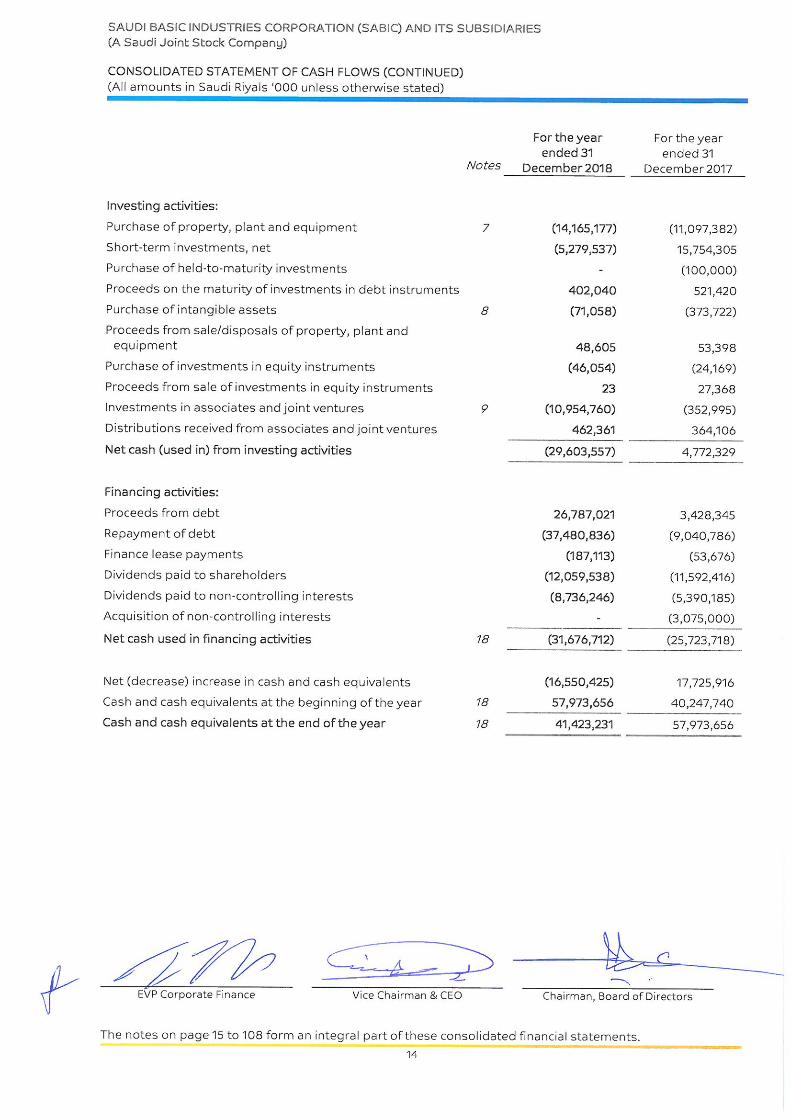
Consolidated statement of cash flows 13 – 14
Notes to the consolidated financial statements 15 – 108


SAUDI BASIC INDUSTRIES CORPORATION (SABIC) AND ITS SUBSIDIARIES
(A Saudi Joint Stock Company)
NOTES TO THE CONSOLIDATED STATEMENTS
For the year ended 31 December 2018
(All amounts in Saudi Riyals ‘000 unless otherwise stated)
15
1. Corporate information
Saudi Basic Industries Corporation (“SABIC” or “the Parent”) is a Saudi Joint Stock Company established
pursuant to Royal Decree Number M/66 dated 13 Ramadan 1396H (corresponding to 6 September 1976)
registered in Riyadh under commercial registration No. 1010010813 dated 14 Muharram 1397H
(corresponding to 4 January 1977). SABIC is 70% owned by the Government of the Kingdom of Saudi Arabia
(“KSA”) and 30% by the private sector.
The registered office is located at Qurtubah district, P.O. Box 5101, Riyadh 11422, KSA.
SABIC and its subsidiaries (collectively the “Group”) are engaged in manufacturing, marketing and
distribution of chemicals, polymers, high performance plastics, agri-nutrients and metal products in global
markets.
The consolidated financial statements of the Group for the year ended 31 December 2018 were authorised
for issue in accordance with a resolution of the Board of Directors on 12 March 2019.
2. Basis of preparation and accounting policies
2.1 Basis of preparation
These consolidated financial statements have been prepared in accordance with International Financial
Reporting Standards (“IFRS”) and its interpretations as issued by the International Accounting Standards
Board (“IASB”) as endorsed in KSA and other standards and pronouncements that are issued by the Saudi
Organisation for Certified Public Accountants (“SOCPA”) (collectively referred to as “IFRS as endorsed in
KSA”).
Certain prior period’s figures have been reclassified to conform to the current period’s presentation
(Note 38).
The consolidated financial statements are prepared under the historical cost convention, except for financial
instruments, which are measured at fair value at the end of each reporting period. Historical cost is generally
based on the fair value of the consideration given in exchange for goods and services at the time of the
transaction.
Fair value is the price that would be received to sell an asset or paid to transfer a liability in an orderly
transaction between market participants at the measurement date, regardless whether that price is directly
observable or estimated using another technique. In estimating the fair value of an asset or a liability, the
Group takes into account the characteristics of the asset or liability, if market participants would take those
characteristics into account when pricing the asset or liability at the measurement date. Fair value for
measurement and/or disclosure purposes in these consolidated financial statements is determined on such
a basis, except for leasing transactions that are within the scope of IAS 17 ‘Leases’, and measurements that
have some similarities to fair value but are not fair value, such as net realizable value in IAS 2 ‘Inventories’ or
value in use in IAS 36 ‘Impairment of Assets’.
The Group has categorized its financial assets and liabilities into a three-level fair value hierarchy, based on
the degree to which the lowest level inputs to fair value measurement are observable and the significance
of the inputs to the fair value measurement as a whole, which are described as follows:
Level 1: Quoted (unadjusted) market prices in active markets for identical assets or liabilities
Level 2: Valuation techniques for which the lowest level input that is significant to the fair value
measurement is directly or indirectly observable
Level 3: Valuation techniques for which the lowest level input that is significant to the fair value
measurement is unobservable
SAUDI BASIC INDUSTRIES CORPORATION (SABIC) AND ITS SUBSIDIARIES
(A Saudi Joint Stock Company)
NOTES TO THE CONSOLIDATED STATEMENTS (CONTINUED)
For the year ended 31 December 2018
(All amounts in Saudi Riyals ‘000 unless otherwise stated)
16
2. Basis of preparation and accounting policies (continued)
2.2 Basis of consolidation
The consolidated financial statements comprise the financial statements of SABIC and entities controlled by
SABIC, except for joint operations which are consolidated based on the Group’s relative share in the
arrangement.
Consolidation of a subsidiary begins when SABIC obtains control over the subsidiary and ceases when SABIC
loses control of the subsidiary. Assets, liabilities, income and expenses of a subsidiary acquired or disposed
during the period are included in the consolidated financial statements from the date SABIC gains control
until the date SABIC ceases to control the subsidiary. Refer Note 3.2.2 for judgements applied by SABIC to
assess control. SABIC re-assesses whether or not it controls an investee if facts and circumstances indicate
that there are changes to the elements of control.
Net income or loss and each component of Other Comprehensive Income (“OCI”) are attributed to the equity
holders of the Parent of the Group and to the non-controlling interests, even if this results in the non-
controlling interests having a deficit balance. When necessary, adjustments are made to the financial
statements of subsidiaries to bring their accounting policies into line with the Group’s accounting policies.
All intra-group asset and liabilities, equity, income, expenses and cash flows relating to transactions
between members of the Group are eliminated in full on consolidation.
Non-controlling interests in the results and equity of subsidiaries are shown separately in the consolidated
statement of financial position, consolidated statement of income, consolidated statement of
comprehensive income and consolidated statement of changes in equity. A change in the ownership interest
of a subsidiary, without a loss of control, is accounted for as an equity transaction.
If SABIC loses control over a subsidiary, it de-recognises the related assets (including goodwill, if applicable),
liabilities, non-controlling interests and other components of equity, while any resulting gain or loss is
recognized in the consolidated statement of income.
2.3 Foreign currencies
The consolidated financial statements are presented in Saudi Riyals (SR), which is the functional currency of
the Parent. For each entity, the Group determines the functional currency and items included in the financial
statements of each entity are measured using that functional currency.
Transactions and balances
Transactions in foreign currencies are initially recorded by the Group’s entities at their respective functional
currencies’ spot rates at transaction date. Monetary assets and liabilities denominated in foreign currencies
are translated at the functional currency spot rates of exchange at the reporting date.
Differences arising on settlement or translation of monetary items are recognised in the consolidated
statement of income with the exception of monetary items that are designated as part of the hedge of the
Group’s net investment of a foreign operation. These are recognised in OCI until the net investment is
disposed, at which time, the cumulative amount is reclassified to consolidated statement of income. Tax
charges and credits attributable to exchange differences on those monetary items are also recorded in OCI.
Non-monetary items that are measured in terms of historical cost in a foreign currency are translated using
the exchange rates at the dates of the initial transactions. Non-monetary items measured at fair value in a
foreign currency are translated using the exchange rates at the date when the fair value is determined. The
gain or loss arising on translation of non-monetary items measured at fair value is treated in line with the
recognition of gain or loss on change in fair value of the item.
SAUDI BASIC INDUSTRIES CORPORATION (SABIC) AND ITS SUBSIDIARIES
(A Saudi Joint Stock Company)
NOTES TO THE CONSOLIDATED STATEMENTS (CONTINUED)
For the year ended 31 December 2018
(All amounts in Saudi Riyals ‘000 unless otherwise stated)
17
2. Basis of preparation and accounting policies (continued)
2.3 Foreign currencies (continued)
Group’s companies
On consolidation, the assets and liabilities of foreign operations are translated into SR at the rate of
exchange prevailing at the reporting date and their statements of income are translated at exchange rates
prevailing at the transactions dates. The exchange differences arising on translation for consolidation are
recognised in OCI. On disposal of a foreign operation, the component of OCI relating to that particular
foreign operation is recognised in the consolidated statement of income.
Any goodwill arising on the acquisition of a foreign operation and any fair value adjustments to the carrying
amounts of assets and liabilities arising on the acquisition are treated as assets and liabilities of the foreign
operation and translated at the spot rate of exchange at the reporting date.
3. Significant accounting estimates, assumptions and judgements
The preparation of the Group’s financial statements requires management to make judgements, estimates
and assumptions at reporting date that affect the reported amounts of revenues, expenses, assets and
liabilities, and the disclosure of contingent liabilities. However, uncertainty about these assumptions and
estimates could result in outcomes that could require material adjustments in the future to the carrying
amount of the asset or liability affected.
The estimates and assumptions are based upon experience and various other factors that are believed to
be reasonable under the circumstances and are used to judge the carrying values of assets and liabilities
that are not readily apparent from other sources. The estimates and underlying assumptions are reviewed
on an ongoing basis. Revisions to accounting estimates are recognised in the period in which the estimates
are revised, if the changed estimates affect both current and future periods.
Other disclosures relating to the Group’s exposure to risks and uncertainties include:
Capital management, financial instrument risk management and policies (Note 36)
Sensitivity analysis disclosures (Notes 23 and 36)
3.1 Estimates and assumptions
The key assumptions concerning the future and other key sources of estimation uncertainty at the reporting
date, that have a significant risk of causing material differences in the carrying amounts of assets and
liabilities within the next financial period, are disclosed below. The Group used these assumptions and
estimates on the basis available when the consolidated financial statements were prepared. However,
existing circumstances and assumptions about future developments may change due to market changes or
circumstances arising that are beyond the control of the Group. Such changes are reflected in the
assumptions when they occur.
3.1.1 Impairment of non-financial assets
Impairment exists when the carrying value of an asset or Cash Generating Unit ("CGU") exceeds its
recoverable amount, which is the higher of its fair value less costs of disposal and its value in use. The fair
value less costs of disposal is based on available data from binding sales transactions, conducted at arm’s
length, for similar assets or observable market prices less incremental costs for disposing the asset. The
value in use is based on a Discounted Cash Flow ("DCF") model. The cash flows are derived from the budget
and business plan for the next five years and do not include restructuring activities that the Group is not yet
committed to or significant future investments that will enhance the performance of the CGU being tested.
The recoverable amount is sensitive to the discount rate used for the DCF model as well as the expected
future net cash-inflows and the growth rate used for extrapolation purposes. The key assumptions used to
determine the recoverable amount for the different CGUs are disclosed in Notes 7 and 8.
SAUDI BASIC INDUSTRIES CORPORATION (SABIC) AND ITS SUBSIDIARIES
(A Saudi Joint Stock Company)
NOTES TO THE CONSOLIDATED STATEMENTS (CONTINUED)
For the year ended 31 December 2018
(All amounts in Saudi Riyals ‘000 unless otherwise stated)
18
3. Significant accounting estimates, assumptions and judgements (continued)
3.1 Estimates and assumptions (continued)
3.1.2 Purchase price allocation interest in Clariant AG (“Clariant”)
Upon acquiring control or significant influence over a company, the Group has to follow the policy for
business combinations. In the specific case of acquiring significant influence over Clariant, management had
to allocate its consideration paid to the fair value of assets and liabilities at the date of acquisition. As
Clariant is stock listed, the Group had to rely on only publically available information to assess the fair value
of the assets and liabilities at that time. The fair values of non-current assets and working capital were
derived from similar transactions in the petrochemical industry, including estimating the value of customer
lists, licenses and useful life of intangible assets and plants and equipment.
3.1.3 Measurement of financial instruments (Notes 10, 11, 13 & 15)
By adopting IFRS 9, the Group is required to make judgements about:
The regional and business related risk profiles of the Group’s customers to assess the Expected Credit
Losses (“ECL”) on trade receivables.
The basis to determine the fair value of its investments in equity instruments, in reference to similar kind
of investments being sold in the market. The selection of the investments to determine the basis
requires judgement by management to recognise investments in equity instruments at Fair Value
through Other Comprehensive Income (“FVOCI”). For fair value determination, these investments qualify
as level 3 items (Note 2.1).
3.1.4 Provisions
By their nature, the measurement of provisions depend upon estimates and assessments whether the
criteria for recognition have been met, including estimates of the probability of cash outflows. The Group’s
estimates related to provisions for environmental matters are based on the nature and seriousness of the
contamination, as well as on the technology required for remediation. Provisions for litigation are based on
an estimate of costs, taking into account legal advice and other information available.
3.1.5 Defined employee benefit plans (Note 23)
Post-employment defined benefits plans, end-of-service benefits plans, indemnity payments and other
long-term employee related liabilities represent obligations that will be settled in the future and require
actuarial valuations to determine these obligations. The Group is required to make assumptions regarding
variables such as discount rates, rate of salary increase, longevity, employee turnover and future healthcare
costs, if applicable. Changes in key assumptions can have a significant impact on the projected benefit
obligations and employee defined benefit costs. All assumptions are reviewed each reporting date.
Defined benefit obligations are discounted at a rate set by reference to market yields at the end of the
reporting period on high quality corporate or government bonds. Significant judgement is required when
setting the criteria for bonds to be included in the population from which the yield curve is derived. The most
significant criteria considered for the selection of bonds include the size of the bonds, quality of the
corporate bonds and the identification of outliers which are excluded, if any.
3.1.6 Accounting for income tax (Note 31.2)
As part of the process of preparing consolidated financial statements, the Group estimates income tax in
each of the jurisdictions it operates. This process involves estimating current tax expense and temporary
differences between carrying amounts of assets and liabilities for financial reporting purposes and the
related tax bases. Temporary differences result in deferred tax assets and liabilities, which are included in
the consolidated statement of financial position. Deferred tax assets and liabilities are carried at nominal
value.
SAUDI BASIC INDUSTRIES CORPORATION (SABIC) AND ITS SUBSIDIARIES
(A Saudi Joint Stock Company)
NOTES TO THE CONSOLIDATED STATEMENTS (CONTINUED)
For the year ended 31 December 2018
(All amounts in Saudi Riyals ‘000 unless otherwise stated)
19
3. Significant accounting estimates, assumptions and judgements (continued)
3.1 Estimates and assumptions (continued)
3.1.6 Accounting for income tax (Note 31.2) (continued)
The Group assesses periodically the likelihood whether deferred tax assets will be recovered from future
taxable income, to the extent these deferred tax assets are recorded. Deferred tax assets are recognised for
unused tax losses to the extent that it probable that the taxable profit will be available against which the
losses can be utilised. Significant management judgment is required to determine the amount of deferred
tax assets that can be recognised, based upon the likely timing and the level of future taxable profits,
together with future tax planning strategies.
3.2 Critical judgements in applying accounting standards
In addition to the application of the judgement in the above-mentioned estimates and assumptions, the
following critical judgements have the most significant effect on the amounts recognised in the consolidated
financial statements:
3.2.1 Component parts of plant and equipment
The Group’s plant and equipment are broken down into significant components and depreciated on a
straight-line basis over their economic useful lives. Judgement is required in ascertaining the significant
components of a larger asset. In defining the significance of a component, the Group considers quantitative
materiality of the component part as well as qualitative factors such as difference in useful life as compared
to related asset.
3.2.2 Determination of control, joint control and significant influence
Subsidiaries are all investees over which the Group has control. Management considers that it controls an
entity when the Group is exposed to or has rights to the majority of the variable returns from its involvement
with the investee and the ability to use its power over the investee to affect the amount of those returns
through its power to direct the relevant activities of the investees.
Generally, there is a presumption that a majority of voting rights results in control. To support this
presumption and when the Group has equal or less than a majority of the voting or similar rights of an
investee, the Group considers all other relevant facts and circumstances in assessing whether it has power
over an investee, including any contractual and other such arrangements which may affect the activities
which impact investees’ return.
3.2.2.1 Assessing control over consolidated subsidiaries
The determination about whether the Group has power depends on such relevant activities, the way
decisions about the relevant activities are made and the rights the Group has, in relation to the investees.
In certain cases where the Group owns less than 50% of voting rights, it may still be the single largest
shareholder with presence on the governing body giving it power to direct relevant activities of the
investees, whereby the other shareholders individually do not hold sufficient voting rights and power to
overrule the Group’s directions. There is no prior instance of other shareholders collaborating to exercise
their votes collectively or to out-vote the Group.
Management has considered the integration of all KSA investees (where the Group has equal or less than a
majority of the voting rights) within the Group structure and located in the industrial cities in KSA, the ability
of the Group to impact the majority of the variable returns of the investees through the provision of various
key services to such investees, the relationship of the Group with other entities which may impact returns of
investees, appointment of certain key management personnel and various other such factors.
SAUDI BASIC INDUSTRIES CORPORATION (SABIC) AND ITS SUBSIDIARIES
(A Saudi Joint Stock Company)
NOTES TO THE CONSOLIDATED STATEMENTS (CONTINUED)
For the year ended 31 December 2018
(All amounts in Saudi Riyals ‘000 unless otherwise stated)
20
3. Significant accounting estimates, assumptions and judgements (continued)
3.2 Critical judgements in applying accounting standards (continued)
3.2.2.1 Assessing control over consolidated subsidiaries (continued)
Based on above considerations, the Group believes:
There is a pattern of past and existing practice of the Group’s involvement in the relevant activities of
these investees resulting in an impact on their returns and also indicating a more than passive interest
of the Group in such investees; and
The Group has created an ecosystem in which the set-up and function of these investees and their inter-
relationship with the Group leads towards a judgement of ‘control’.
Hence, the Group has consolidated those KSA investees, which meet the above criteria as part of the Group’s
consolidated financial statements.
4. Changes in accounting policies
Effective 1 January 2018, the Group has applied two new accounting standards, International Financial
Reporting Standard 9 ‘Financial Instruments’ (“IFRS 9”) and IFRS 15 ‘Revenue from Contracts with Customers’ (“IFRS 15”).
4.1 IFRS 9 - Financial Instruments
The Group has adopted IFRS 9 and has opted for the modified retrospective approach for the adoption
without changing the comparative financial information presented. The difference between the carrying
amounts of the financial assets resulting from adopting IFRS 9 are recognised in retained earnings and other
reserves as at 1 January 2018. Accordingly, the information presented for 2017 does not reflect the
requirements of IFRS 9 and therefore is not comparable to the information presented for 2018 under IFRS 9.
The financial liabilities are not affected.
The following assessments have been made based on the facts and circumstances at the date of initial
application:
The determination of the business model within which a financial asset is held
The designation and revocation of previous designated financial assets as measured at Fair Value
through Income Statement (“FVIS”)
The designation of certain investments in equity instruments not held for trading as FVOCI
The designation of debt instruments as financial assets at amortised cost
SAUDI BASIC INDUSTRIES CORPORATION (SABIC) AND ITS SUBSIDIARIES
(A Saudi Joint Stock Company)
NOTES TO THE CONSOLIDATED STATEMENTS (CONTINUED)
For the year ended 31 December 2018
(All amounts in Saudi Riyals ‘000 unless otherwise stated)
21
4. Changes in accounting policies (continued)
4.1 IFRS 9 - Financial Instruments (continued)
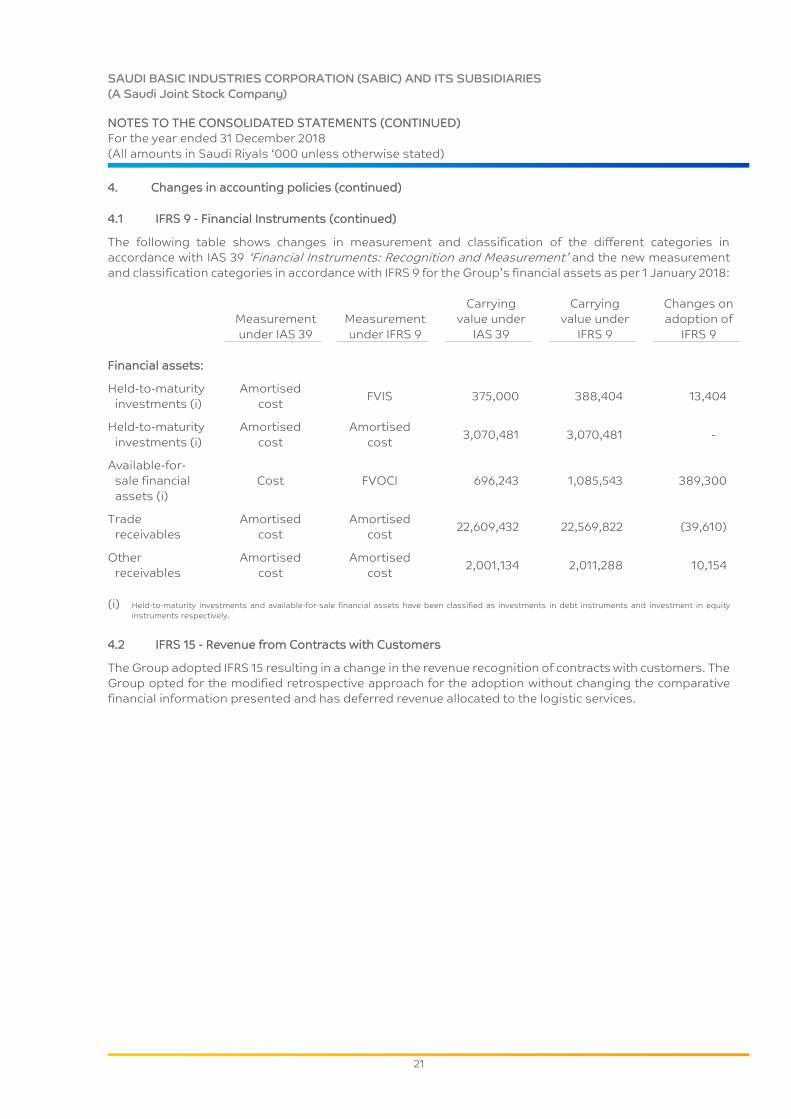
The following table shows changes in measurement and classification of the different categories in
accordance with IAS 39 ‘Financial Instruments: Recognition and Measurement’ and the new measurement
and classification categories in accordance with IFRS 9 for the Group’s financial assets as per 1 January 2018:
Measurement
under IAS 39
Measurement
under IFRS 9
Carrying
value under
IAS 39
Carrying
value under
IFRS 9
Changes on
adoption of
IFRS 9
Financial assets:
Held-to-maturity
investments (i)
Amortised
cost FVIS
375,000 388,404 13,404
Held-to-maturity
investments (i)
Amortised
cost
Amortised
cost
3,070,481 3,070,481 -
Available-for-
sale financial
assets (i)
Cost FVOCI
696,243 1,085,543 389,300
Trade
receivables
Amortised
cost
Amortised
cost
22,609,432 22,569,822 (39,610)
Other
receivables
Amortised
cost
Amortised
cost
2,001,134 2,011,288 10,154
(i) Held-to-maturity investments and available-for-sale financial assets have been classified as investments in debt instruments and investment in equity
instruments respectively.
4.2 IFRS 15 - Revenue from Contracts with Customers
The Group adopted IFRS 15 resulting in a change in the revenue recognition of contracts with customers. The
Group opted for the modified retrospective approach for the adoption without changing the comparative
financial information presented and has deferred revenue allocated to the logistic services.
SAUDI BASIC INDUSTRIES CORPORATION (SABIC) AND ITS SUBSIDIARIES
(A Saudi Joint Stock Company)
NOTES TO THE CONSOLIDATED STATEMENTS (CONTINUED)
For the year ended 31 December 2018
(All amounts in Saudi Riyals ‘000 unless otherwise stated)
22
4. Changes in accounting policies (continued)
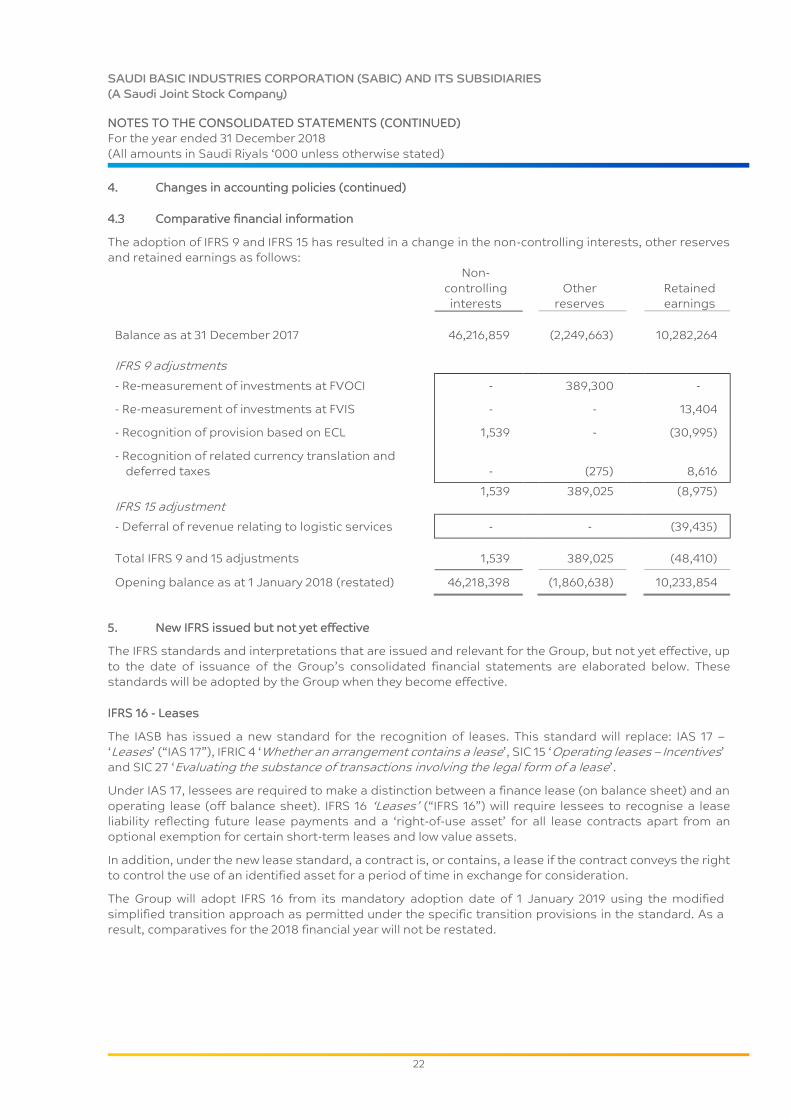
4.3 Comparative financial information
The adoption of IFRS 9 and IFRS 15 has resulted in a change in the non-controlling interests, other reserves
and retained earnings as follows:
Non-
controlling
interests
Other
reserves
Retained
earnings
Balance as at 31 December 2017 46,216,859 (2,249,663) 10,282,264
IFRS 9 adjustments
- Re-measurement of investments at FVOCI - 389,300 -
- Re-measurement of investments at FVIS - - 13,404
- Recognition of provision based on ECL 1,539 - (30,995)
- Recognition of related currency translation and
deferred taxes
- (275) 8,616
1,539 389,025 (8,975)
IFRS 15 adjustment
- Deferral of revenue relating to logistic services - - (39,435)
Total IFRS 9 and 15 adjustments 1,539 389,025 (48,410)
Opening balance as at 1 January 2018 (restated) 46,218,398 (1,860,638) 10,233,854
5. New IFRS issued but not yet effective
The IFRS standards and interpretations that are issued and relevant for the Group, but not yet effective, up
to the date of issuance of the Group’s consolidated financial statements are elaborated below. These
standards will be adopted by the Group when they become effective.
IFRS 16 - Leases
The IASB has issued a new standard for the recognition of leases. This standard will replace: IAS 17 –
‘Leases’ (“IAS 17”), IFRIC 4 ‘Whether an arrangement contains a lease’, SIC 15 ‘Operating leases – Incentives’
and SIC 27 ‘Evaluating the substance of transactions involving the legal form of a lease’.
Under IAS 17, lessees are required to make a distinction between a finance lease (on balance sheet) and an
operating lease (off balance sheet). IFRS 16 ‘Leases’ (“IFRS 16”) will require lessees to recognise a lease
liability reflecting future lease payments and a ‘right-of-use asset’ for all lease contracts apart from an
optional exemption for certain short-term leases and low value assets.
In addition, under the new lease standard, a contract is, or contains, a lease if the contract conveys the right
to control the use of an identified asset for a period of time in exchange for consideration.
The Group will adopt IFRS 16 from its mandatory adoption date of 1 January 2019 using the modified
simplified transition approach as permitted under the specific transition provisions in the standard. As a
result, comparatives for the 2018 financial year will not be restated.
SAUDI BASIC INDUSTRIES CORPORATION (SABIC) AND ITS SUBSIDIARIES
(A Saudi Joint Stock Company)
NOTES TO THE CONSOLIDATED STATEMENTS (CONTINUED)
For the year ended 31 December 2018
(All amounts in Saudi Riyals ‘000 unless otherwise stated)
23
5. New IFRS issued but not yet effective (continued)
IFRS 16 - Leases (continued)
The Group has not used the practical expedient of applying IFRS 16 to only those contracts that were
previously identified as leases under IAS 17. In applying IFRS 16 for the first time, the Group has used the
following practical expedients permitted by the standard:
the use of a single discount rate to a portfolio of leases with reasonably similar characteristics
the accounting for operating leases with a remaining lease term of less than 12 months as at 1 January
2019 as short-term leases
the exclusion of initial direct costs for the measurement of the right-of-use asset at the date of initial
application
the use of hindsight in determining the lease term where the contract contains options to extend or
terminate the lease; and
the election, by class of underlying asset, not to separate non-lease components from lease
components, and instead account for each lease component and any associated non-lease
components as a single lease component.
On adoption of IFRS 16, the Group will recognise lease liabilities and associated right-of-use assets in
relation to contracts that have been concluded as leases under the principles of IFRS 16. The liabilities will
be measured at the present value of the remaining lease payments, discounted using the Group’s
incremental borrowing rate as of 1 January 2019. The associated rights-of-use assets will be measured at
the amount equal to the lease liability, adjusted by the amount of any prepaid or accrued lease payments
relating to that lease recognised in the consolidated statement of financial position as at 31 December 2018.
The Group is in the process of finalizing its calculation of the final amount for the right-of-use assets and
lease liability as at 1 January 2019. The impact is expected to be between 1-3% of total assets and 5-7% of
total liabilities. There will be no impact on retained earnings on 1 January 2019. The impact of adopting
IFRS 16 on the Group’s net income for 2019 will be insignificant.
IFRIC Interpretation 23 - Uncertainty over Income Tax Treatment
The Interpretation addresses accounting for income taxes when tax treatments involve uncertainty that
affects the application of IAS 12 ‘Income Taxes’ (“IAS 12”) and does not apply to taxes or levies outside the
scope of IAS 12, nor does it specifically include requirements relating to interest and penalties associated
with uncertain tax treatments.
The Interpretation specifically addresses the following:
Whether an entity considers uncertain tax treatments separately
The assumptions an entity makes about the examination of tax treatments by taxation authorities
How an entity determines taxable results, tax bases, unused tax losses, unused tax credits and tax rates
How an entity considers changes in facts and circumstances
An entity must determine whether to consider each uncertain tax treatment separately or together with one
or more other uncertain tax treatments. The approach that better predicts the resolution of the uncertainty
should be followed. The interpretation is effective for annual reporting periods beginning on or after 1
January 2019, but certain transition reliefs are available. The Group expects no significant impact from this
interpretation and will adopt from its effective date.

SAUDI BASIC INDUSTRIES CORPORATION (SABIC) AND ITS SUBSIDIARIES
(A Saudi Joint Stock Company)
NOTES TO THE CONSOLIDATED STATEMENTS (CONTINUED)
For the year ended 31 December 2018
(All amounts in Saudi Riyals ‘000 unless otherwise stated)
24
5. New IFRS issued but not yet effective (continued)
Amendments to IAS 19 – Plan Amendment Curtailment or Settlement
The Amendments to IAS 19 ‘Employee Benefits’ specifies how companies determine pension expenses when
changes to a defined benefit pension plan occur.
The Amendments require a company to use the updated assumptions from this re-measurement to
determine current service cost and net interest for the remainder of the reporting period after the change to
the plan. The amendments are effective on or after 1 January 2019. The Group expects no significant impact
from these Amendments and will adopt from its effective date.
Amendment to IFRS 3 – Business Combinations
The Amendment narrowed and clarified the definition of a business. It also permits a simplified assessment
of whether an acquired set of activities and assets is a group of assets rather than a business. The
Amendment is effective for business combinations which are entered into for annual reporting periods
beginning on or after 1 January 2020. The Group will apply the Amendment from its effective date.
6. Summary of significant accounting polices
The significant accounting policies adopted by the Group in preparing these consolidated financial
statements are applied consistently and are described below:
Business combinations and goodwill
Business combinations are accounted for using the acquisition method. The cost of an acquisition is
measured as the aggregate of the consideration transferred which is measured at fair value on the
acquisition date and the amount of any non-controlling interests in the acquiree. For each business
combination, the Group elects whether to measure the non-controlling interests in the acquiree at fair value
or at proportionate share of the acquiree’s identifiable net assets. Acquisition-related costs are expensed in
the consolidated statement of income when incurred.
When the Group acquires a business, it assesses the financial assets acquired and financials liabilities
assumed for appropriate classification and designation in accordance with the contractual terms, economic
circumstances and pertinent conditions as at the acquisition date. Any contingent consideration to be
transferred by the acquirer will be recognized at fair value at the acquisition date. Contingent consideration
classified as an asset or liability that is a financial instrument and within the scope of IFRS 9 ‘Financial Instruments’, is measured at fair value with the changes in fair value recognized in the consolidated
statement of income or OCI.
Goodwill is initially measured at cost, being the excess of the aggregate of the consideration transferred
and the amount recognised for non-controlling interests, and any previous interest held, over the net
identifiable assets acquired and liabilities assumed. If the fair value of the net assets acquired is in excess
of the aggregate consideration transferred, the Group re-assesses whether it has correctly identified all of
the assets acquired and all of the liabilities assumed. If the reassessment still results in an excess the gain
is recognised in the consolidated statement of income.
After initial recognition, goodwill is measured at cost less any accumulated impairment losses, if applicable.
For the purpose of impairment testing, goodwill acquired in a business combination is, from the acquisition
date, allocated to each of the Group’s CGUs that are expected to have benefit from the combination,
irrespective of whether other assets or liabilities of the acquiree are assigned to those units. Where goodwill
has been allocated to a CGU and part of the operation within that unit is disposed off, the goodwill
associated with the disposed operation is included in the carrying amount of the operation when
determining the gain or loss on disposal. Goodwill disposed in these circumstances is measured based on
the relative values of the disposed operation and the portion of the CGU retained.
SAUDI BASIC INDUSTRIES CORPORATION (SABIC) AND ITS SUBSIDIARIES
(A Saudi Joint Stock Company)
NOTES TO THE CONSOLIDATED STATEMENTS (CONTINUED)
For the year ended 31 December 2018
(All amounts in Saudi Riyals ‘000 unless otherwise stated)
25
6. Summary of significant accounting polices (continued)
Investments in associates and joint arrangements
Investments in associates
An associate is an entity over which the Group has significant influence. Significant influence is the power to
participate in the financial and operating policy decisions of the investee, but is not control or joint control
over those policies. Judgement is required, particularly where the Group owns shareholding and voting
rights of generally 15% and above, the Group assessed not to have ‘control’ or ‘joint control’ over such
investees.
Investments in joint arrangements
Investments in joint arrangements are classified as either joint operations or joint ventures. The
classification depends on the contractual rights and obligations of each investor, rather than the legal
structure of the joint arrangement. Joint control is the contractually agreed sharing of control of an
arrangement, which exists only when decisions about the relevant activities require unanimous consent of
the parties sharing control.
Joint operations
A joint operation is an arrangement whereby the parties that have joint control on the arrangement
have rights to the assets, and obligations for the liabilities, relating to the arrangement. The Group
recognises its direct right to the assets, liabilities, revenues and expenses of joint operations and its
share of any jointly held assets or incurred liabilities, revenues and expenses for its joint operations.
Joint ventures
A joint venture is a type of joint arrangement whereby the parties that have joint control of the
arrangement have rights to the net assets of the joint venture. Interests in joint ventures are accounted
for using the equity method, after initially being recognised at cost in the consolidated statement of
financial position.
Under the equity method of accounting, the investments in an associate or joint venture are initially
recognised at cost and adjusted thereafter to recognise the Group’s share of the post-acquisition results
in the consolidated statement of income, and the Group’s share of movements in OCI in the consolidated
statement of comprehensive income. Dividends received or receivable from associates and joint ventures
are recognised as a reduction in the carrying amount of the investment.
When the Group’s share of losses in an equity-accounted investment equals or exceeds its interest in the
entity, including any other unsecured long-term receivables, the Group does not recognise further losses,
unless it is liable due to constructive or legal obligations on behalf of the other entity.
Unrealised gains on transactions between the Group and its associates and joint ventures are eliminated to
the extent of the Group’s interest in these entities. Unrealised losses are also eliminated unless the
transaction provides evidence of an impairment of the asset transferred.
Upon loss of significant influence over the associate or joint control over the joint venture, the Group
measures and recognises any retained investment at its fair value. Any difference between the carrying
amount of the associate or joint venture upon loss of significant influence or joint control and the fair value
of the retained investment and proceeds from disposal is recognised in the consolidated statement of
income.
When the Group ceases to consolidate or equity account for an investment because of a loss of control, joint
control or significant influence, any retained interest in the entity is re-measured to its fair value with the
change in carrying amount recognised in the consolidated statement of income. This fair value becomes the
initial carrying amount for the purposes of subsequently accounting for the retained interest as an associate,
joint venture or financial asset. In addition, any amounts previously recognised in OCI in respect of that entity
are accounted for as if the Group had directly disposed of the related assets or liabilities. This may mean
that amounts previously recognised in OCI are reclassified to the consolidated statement of income.
SAUDI BASIC INDUSTRIES CORPORATION (SABIC) AND ITS SUBSIDIARIES
(A Saudi Joint Stock Company)
NOTES TO THE CONSOLIDATED STATEMENTS (CONTINUED)
For the year ended 31 December 2018
(All amounts in Saudi Riyals ‘000 unless otherwise stated)
26
6. Summary of significant accounting polices (continued)
Investments in associates and joint arrangements (continued)
If the ownership interest in a joint venture or an associate is reduced but joint control or significant influence
is retained, only a proportionate share of the amounts previously recognised in OCI, except for the items
that will not be reclassified to the consolidated statement of comprehensive income, are reclassified to the
consolidated statement of income, where appropriate.
Current versus non-current classification
The Group presents assets and liabilities in the consolidated statement of financial position based on
current and non-current classification. An asset is current when it is:
Expected to be realised or intended to be sold or consumed in normal operating cycle;
Expected to be realised within twelve months after the reporting period; or
Cash or cash equivalent unless restricted from being exchanged or used to settle a liability for at least
twelve months after the reporting period.
All other assets are classified as non-current.
A liability is current when it is due to be settled within twelve months after the reporting period. The Group
classifies all other liabilities as non-current.
Deferred tax assets and liabilities are classified as non-current assets and liabilities.
Zakat and tax
Zakat
Zakat is levied at the higher of adjusted income subject to zakat or the zakat base in accordance with the
Regulations of the General Authority of Zakat and Tax (“GAZT”) in KSA. The Group computes its zakat by
using the zakat base, which makes this a levy not based on income subject to zakat. The zakat provision is
charged to the consolidated statement of income. Differences, if any, resulting from the final assessments
are adjusted in the period of their finalisation.
Current Income tax
Current income tax assets and liabilities are measured at the amount expected to be recovered from or paid
to the relevant tax authorities.
Deferred tax
Deferred tax is provided for using the balance sheet method on temporary differences at the reporting date
between the tax bases of assets and liabilities and their carrying amounts for financial reporting purposes.
Deferred tax assets and liabilities are measured at the tax rates that are expected to apply in the period when
the asset is realised or the liability is settled, based on tax rates and tax law enacted or substantively enacted
at the reporting date. Deferred tax assets and deferred tax liabilities are offset, if a legally enforceable right
exists to set off current tax assets and current tax liabilities and the deferred taxes relate to the same taxable
entity and the same tax authority.
The carrying amount of deferred tax assets is reviewed at each reporting date and reduced to the extent that
it is no longer probable that sufficient taxable profit will be available to allow all or part of the deferred tax
asset to be utilised.
Government grants
Government grants are recognised when there is reasonable assurance that the grant will be received and
all attached conditions will be complied with. When the grant relates to an expense item, it is recognised in
the consolidated statement of income over the period necessary to match the grant on a systematic basis
to the costs that it is intended to compensate.
SAUDI BASIC INDUSTRIES CORPORATION (SABIC) AND ITS SUBSIDIARIES
(A Saudi Joint Stock Company)
NOTES TO THE CONSOLIDATED STATEMENTS (CONTINUED)
For the year ended 31 December 2018
(All amounts in Saudi Riyals ‘000 unless otherwise stated)
27
6. Summary of significant accounting polices (continued)
Government grants (continued)
Where the grant relates to an asset, it is recognised in the consolidated statement of financial position as
deferred income and released to the consolidated statement of income in equal amounts over the expected
useful life of the related asset. When the Group receives non-monetary grants, the asset and the grant are
recorded gross at its fair value and released to the consolidated statement of income over the expected
useful life and pattern of consumption of the benefit of the underlying asset by equal annual instalments.
Property, plant and equipment
Property, plant and equipment are stated at cost, net of accumulated depreciation and accumulated
impairment losses, if any. Such costs include the cost of replacing part of the plant and equipment and
borrowing costs for long-term construction projects if the recognition criteria are met. When significant
parts of plant and equipment are required to be replaced in intervals, the Group recognizes and depreciates
them separately based on its specific useful lives. Likewise, when a major inspection is performed, its cost
is recognized in the carrying amount of the plant and equipment as a replacement if the recognition criteria
are satisfied. All other repair and maintenance costs are recognized in the consolidated statement of income
as incurred. The present value of the expected cost for the decommissioning of the asset after its use is
included in the cost of the respective asset if the recognition criteria for a provision are met.
Depreciation is calculated on a straight-line basis over the useful life of the asset as follows:
Buildings 13 to 40 years
Plant and equipment 4 to 50 years
Furniture, fixtures and vehicles 3 to 10 years
Land and assets under construction, which are not ready for their intended use, are not depreciated.
An item of property, plant and equipment and any significant part initially recognized is de-recognised upon
disposal or when no future economic benefits are expected from its continued use or disposal. Any gain or
loss arising on derecognizing the asset (calculated as the difference between the net disposal proceeds and
the carrying amount of the asset) is included in the consolidated statement of income when the asset is de-
recognised.
The assets’ residual values, useful lives and methods of depreciation are periodically reviewed, and adjusted
prospectively in case of a significant change in the assets technological capabilities or estimated planned
use.
Leases
The determination of whether an arrangement is, or contains, a lease is based on the substance of the
arrangement at the inception of the lease. The arrangement is, or contains, a lease if fulfilment of the
arrangement is dependent on the use of a specific asset or assets and the arrangement conveys a right to
use the asset or assets, even if that right is not explicitly specified in the arrangement.
A lease is classified at the inception date as a finance lease or an operating lease. A lease that substantially
transfers all the risks and rewards incidental to ownership to the Group is classified as a finance lease.
Finance leases are recognised at the commencement of the lease at the inception date fair value of the
leased property or, if lower, at the present value of the minimum lease payments. Lease payments are
apportioned between finance charges and reduction of the lease liability so as to achieve a constant rate of
interest on the remaining balance of the liability. Finance charges are recognized in finance costs in the
consolidated statement of income.
A leased asset is depreciated over the useful life of the asset. However, if there is no reasonable certainty
that the Group will obtain ownership by the end of the lease term, the asset is depreciated over the shorter
of the estimated useful life of the asset and the lease term.
An operating lease is a lease other than a finance lease. Operating lease payments are recognized as an
operating expense in the consolidated statement of income on a straight-line basis over the lease term.
SAUDI BASIC INDUSTRIES CORPORATION (SABIC) AND ITS SUBSIDIARIES
(A Saudi Joint Stock Company)
NOTES TO THE CONSOLIDATED STATEMENTS (CONTINUED)
For the year ended 31 December 2018
(All amounts in Saudi Riyals ‘000 unless otherwise stated)
28
6. Summary of significant accounting polices (continued)
Property, plant and equipment (continued)
Borrowing costs
Borrowing costs consist of interest and other costs that the Group incurs in connection with the borrowing
of funds. Borrowing costs directly attributable to the acquisition, construction or production of a qualifying
asset that necessarily takes a substantial period of time to get ready for its intended use or sale are
capitalized as part of the costs of these assets, until such time as the asset is substantially ready for its
intended use.
Investment income earned on the temporary investment of specific borrowings pending their expenditure
on qualifying assets is deducted for the borrowing costs eligible for capitalization. All other borrowing costs
are expensed in the period they occur.
Intangible assets
Intangible assets are measured at cost upon initial recognition. Intangible assets acquired in a business
combination are measured at fair value at the date of acquisition. Following initial recognition, intangible
assets are carried at cost less any accumulated amortization and accumulated impairment losses, if any.
Intangible assets with finite lives are amortised over the useful economic life and assessed for impairment
whenever there is an indicator that the intangible asset may be impaired. The estimated useful life and
amortization method are reviewed at the end of each reporting period, with the effect of any changes in
estimate being accounted for on a prospective basis. The amortization expense on intangible assets with
finite lives is recognized in the consolidated statement of income in the expense category that is consistent
with the function of the intangible asset.
Research costs are expensed as incurred. Development expenditures on an individual project are recognized
as an intangible asset when the Group can demonstrate:
The technical feasibility of completing the intangible asset so that the asset will be available for use or
sale
Its intention to complete and its ability and intention to use or sell the asset
How the asset will generate future economic benefits
The availability of resources to complete the asset
The ability to measure reliably the expenditure during development
Amortization of the intangible asset begins when development is complete and the asset is available for
use. It is amortised over the period of expected future benefit. Amortization is recorded in the consolidated
statement of income. During the period of development, the asset is tested for impairment annually.
Technology and innovation expense related to product development is recorded in the consolidated
statement of income in other operating expense and expense related to process improvement is recorded
in cost of sales.
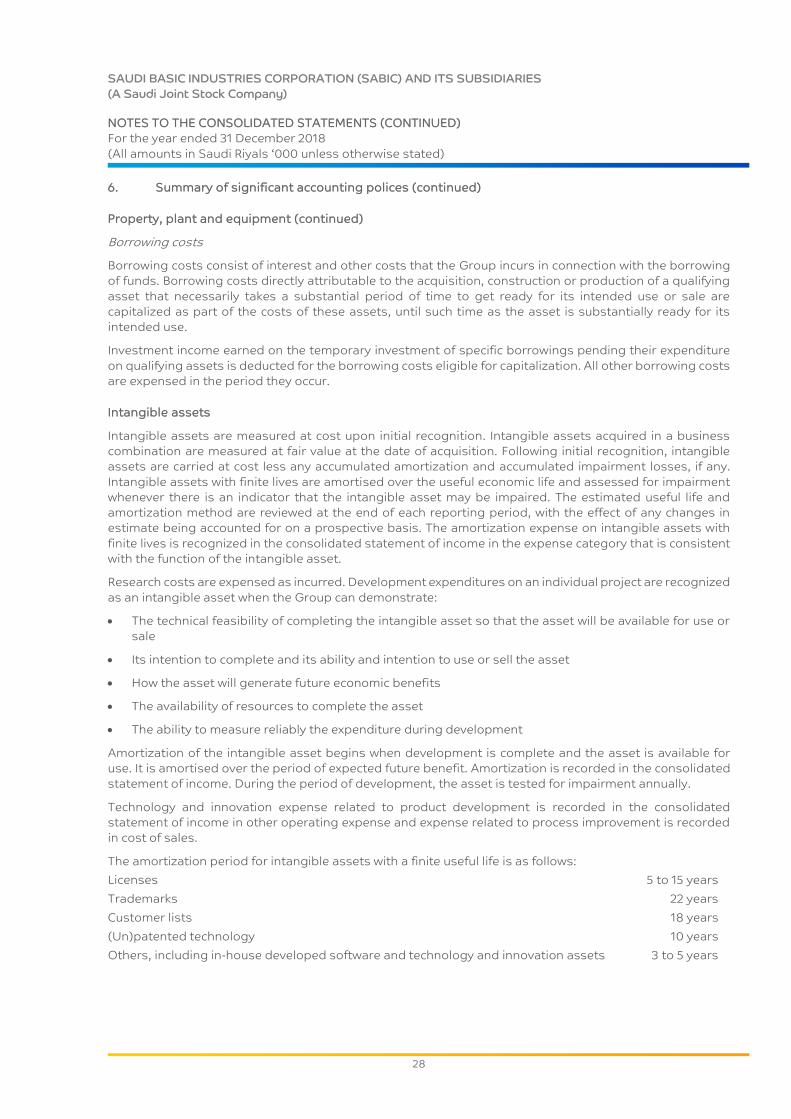
The amortization period for intangible assets with a finite useful life is as follows:
Licenses 5 to 15 years
Trademarks 22 years
Customer lists 18 years
(Un)patented technology 10 years
Others, including in-house developed software and technology and innovation assets 3 to 5 years

SAUDI BASIC INDUSTRIES CORPORATION (SABIC) AND ITS SUBSIDIARIES
(A Saudi Joint Stock Company)
NOTES TO THE CONSOLIDATED STATEMENTS (CONTINUED)
For the year ended 31 December 2018
(All amounts in Saudi Riyals ‘000 unless otherwise stated)
29
6. Summary of significant accounting polices (continued)
Impairment of non-current assets
The Group assesses at each reporting date, whether there is an indication that an asset may be impaired. If
any indication exists, or when annual impairment testing is required, the Group estimates the assets'
recoverable amount. An asset’s recoverable amount is the higher of an asset’s or CGU fair value less costs
of disposal and its value in use. The recoverable amount is determined for an individual asset, unless the
asset does not generate cash inflows that are largely independent of those from other assets or groups of
assets. When the carrying amount of an asset or CGU exceeds its recoverable amount, the asset or CGU is
considered impaired and is written down to its recoverable amount.
In assessing the value in use, the estimated future cash flows are discounted to their present value using a
post-tax discount rate that reflects current market assessment of the time value of money and the risks
specific to the asset.
The Group’s impairment calculation is based on detailed budgets and forecast calculations which are
prepared separately for each of the Group’s CGU’s to which the individual assets are allocated. These
budgets and forecast calculations are generally covering a five-year period. A long-term growth rate is
calculated and applied to project future cash flows after the budget period.
Impairment losses of continuing operations, including impairment on working capital, if applicable, are
recognized in the consolidated statement of income in those expense categories consistent with the
function of the impaired asset.
For assets other than goodwill, an assessment is made at each reporting date to determine whether there
is an indication that previously recognized impairment losses may no longer exist or may have decreased. If
such indication exists, the Group’s estimates the asset’s or CGU’s recoverable amount. A previously
recognized impairment loss is reversed only if there has been a change in the assumptions used to
determine the asset’s recoverable amount since the last impairment loss was recognized. Such reversal is
recognized in the consolidated statement of income.
Goodwill is tested for impairment annually or when circumstances indicate that the carrying value may be
impaired. Impairment is determined for goodwill by assessing the recoverable amount of each CGU (or
group of CGU’s) to which the goodwill relates. Where the recoverable amount of the CGU is less than the
carrying amount, an impairment loss is recognized. Impairment losses relating to goodwill cannot be
reversed in future years.
Financial assets
Classification of financial assets depends on the Group’s business model for managing its financial assets
and the contractual terms of the cash flows. The Group classifies its financial assets as:
financial assets measured at amortised cost; or
financial assets measured at fair value
Gains or losses of assets measured at fair value will be recognised either through the consolidated
statement of income or through the consolidated statement of OCI.
SAUDI BASIC INDUSTRIES CORPORATION (SABIC) AND ITS SUBSIDIARIES
(A Saudi Joint Stock Company)
NOTES TO THE CONSOLIDATED STATEMENTS (CONTINUED)
For the year ended 31 December 2018
(All amounts in Saudi Riyals ‘000 unless otherwise stated)
30
6. Summary of significant accounting polices (continued)
Financial assets (continued)
Initial measurement
Financial assets are initially measured at their fair value plus transaction costs. Transaction costs of financial
assets carried at fair value through income statement are recognised in the consolidated statement of
income, when incurred.
Financial assets with embedded derivatives are considered in their entirety when determining whether their
cash flows meet the requirements as solely payment of principal and interest.
Subsequent measurement
Debt instruments
The Group recognises three classifications to subsequently measure its debt instruments:
Amortised cost
Financial assets held for collection of contractual cash flows, where those cash flows represent Solely
Payments of Principal and Interest (“SPPI”), are measured at amortised cost. A gain or loss on an
investment in debt instruments subsequently measured at amortised cost, and not part of a hedging
relationship, is recognised in the consolidated statement of income when the asset is de-recognised or
impaired. Interest income from these financial assets is included in finance income using the Effective
Interest Rate (“EIR”) method.
FVOCI
Financial assets held for collection of contractual cash flows and for selling the financial assets, where
the assets’ cash flows represent solely payments of principal and interest, are measured at FVOCI.
Movements in the carrying amount are taken through OCI, except for the recognition of impairment
gains or losses, interest revenue and foreign exchange gains and losses, which are recognised in the
consolidated statement of income. When the financial asset is de-recognised, the cumulative gain or
loss previously recognised in OCI, is reclassified from equity to the consolidated statement of income
and recognised in other gains/ (losses). Interest income from these financial assets is included in finance
income using the EIR method. Foreign exchange gains and losses are presented in other
income/expense.
FVIS
Financial assets at fair value through income statement include financial assets held for trading, financial
assets designated upon initial recognition at fair value through income statement, or financial assets
mandatorily required to be measured at fair value. Financial assets with cash flows that are not solely
payments of principal and interest are classified and measured at fair value through income statement,
irrespective of the business model.
Financial assets at fair value through income statement are carried in the consolidated statement of
financial position at fair value with net changes in fair value recognised in the consolidated statement of
income. This category includes derivative instruments.
Equity instruments
The Group measures all investments in equity instruments at fair value and presents changes in fair value
of investments in equity instruments in OCI. Dividends from such investments continue to be recognised in
the consolidated statement of income as other income when the Group’s right to receive payments is
established. There shall be no subsequent reclassification of changes in fair value through the consolidated
statement of income.
SAUDI BASIC INDUSTRIES CORPORATION (SABIC) AND ITS SUBSIDIARIES
(A Saudi Joint Stock Company)
NOTES TO THE CONSOLIDATED STATEMENTS (CONTINUED)
For the year ended 31 December 2018
(All amounts in Saudi Riyals ‘000 unless otherwise stated)
31
6. Summary of significant accounting polices (continued)
Financial assets (continued)
De-recognition
A financial asset or a part of a financial asset is de-recognised when:
The rights to receive cash flows from the asset have expired, or
The Group has transferred its rights to receive cash flows from the asset or has assumed an obligation
to pay the received cash flows in full without material delay to a third party under a ‘pass-through’
arrangement, and either:
a) The Group has transferred substantially all the risks and rewards of the asset; or
b) The Group has neither transferred nor retained substantially all the risks and rewards of the asset,
but has transferred control of the asset.
Impairment
The Group assesses on a forward-looking basis the ECL associated with its debt instruments as part of its
financial assets, which are carried at amortised cost and FVOCI.
The ECL is based on a 12-month ECL or a lifetime ECL. The 12-month ECL results from default events on a
financial instrument that are possible within 12 months after the reporting date. When there has been a
significant increase in credit risk since initial recognition, the allowance is required for credit losses expected
over the remaining life of the exposure, irrespective of the timing of the default (the lifetime ECL).
For accounts receivables, the Group applies the simplified approach in calculating ECL’s. Therefore, the
Group does not track changes in credit risk, but instead recognized a loss allowance base on lifetime ECL’s
at each reporting date. The Group has established a provision matrix that is based on its historical credit
loss experience, adjusted for forward-looking factors specific to the debtors and the economic environment.
Accounting policy until end 2017
Until the end of 2017, financial assets are classified as financial assets at fair value through the statement of
income, loans and receivables, held to maturity investments, available for sale financial assets, or as
derivatives designated as hedging instruments in an effective hedge, as appropriate. The Group determines
the classification of its financial assets at initial recognition.
Financial liabilities
Initial recognition and measurement
Financial liabilities are classified under either of the below two classes:
Financial liabilities at FVIS; and
Other financial liabilities measured at amortised cost using the EIR method.
The category of financial liability at FVIS has two sub-categories:
Designated: A financial liability that is designated by the entity as a liability at FVIS upon initial
recognition; and
Held for trading: A financial liability classified as held for trading, such as an obligation for securities
borrowed in a short sale, which have to be returned in the future. This category also includes derivative
financial instruments entered into by the Group that are not designated as hedging instruments in
hedge relationships. Separated embedded derivatives are also classified as held for trading unless they
are designated as effective hedging instruments.
SAUDI BASIC INDUSTRIES CORPORATION (SABIC) AND ITS SUBSIDIARIES
(A Saudi Joint Stock Company)
NOTES TO THE CONSOLIDATED STATEMENTS (CONTINUED)
For the year ended 31 December 2018
(All amounts in Saudi Riyals ‘000 unless otherwise stated)
32
6. Summary of significant accounting polices (continued)
Financial liabilities (continued)
Initial recognition and measurement (continued)
All financial liabilities are recognised initially when the Group becomes party to contractual provisions and
obligations under the financial instrument. The liabilities are recorded at fair value, and in the case of loans
and borrowings and payables, the proceeds received net of directly attributable transaction costs.
Subsequent measurement
Financial liabilities at FVIS continue to be recorded at fair value with changes being recorded in the
consolidated statement of income.
For other financial liabilities, including loans and borrowings, after initial recognition, these are subsequently
measured at amortised cost using the EIR method. Gains and losses are recognised in consolidated
statement of income when the liabilities are de-recognised as well as through the EIR amortisation process.
Amortised cost is calculated by taking into account any discount or premium on acquisition and fees or costs
that are an integral part of the EIR method. The EIR amortisation is included as finance costs in the
consolidated statement of income.
Trade and other payables
These amounts represent liabilities for goods and services provided to the Group prior to the end of
financial period which are unpaid. The amounts are unsecured and are usually paid within 30 to 60 days of
recognition. They are recognised initially at their fair value and subsequently measured at amortised cost
using the EIR method.
Financial guarantee contracts
Financial guarantee contracts are recognised as a financial liability at the time the guarantee is issued. The
liability is initially measured at fair value adjusted for transaction costs that are directly attributable to the
issuance of the guarantee. The fair value of financial guarantee is determined as the present value of the
difference in net cash flows between the contractual payments under the debt instrument and the payments
that would be required without the guarantee, or the estimated amount that would be payable to a third
party for assuming the obligation.
Where guarantees in relation to loans or other payables of associates are provided for no compensation,
the fair values are accounted for as contributions and recognised as part of the cost of the investment.
De-recognition
A financial liability is de-recognised when the obligation under the liability is settled or discharged. When an
existing financial liability is replaced by another from the same lender on substantially different terms, or the
terms of an existing liability are substantially modified, such an exchange or modification is treated as the
de-recognition of the original liability and the recognition of a new liability. The difference in the respective
carrying amounts is recognised in the consolidated statement of income.
Offsetting of financial instruments
Financial assets and financial liabilities are offset and the net amount is disclosed in the consolidated
statement of financial position if there is a currently enforceable legal right to offset recognised amounts
and there is an intention to settle on a net basis or to realise the assets and settle the liabilities
simultaneously.

SAUDI BASIC INDUSTRIES CORPORATION (SABIC) AND ITS SUBSIDIARIES
(A Saudi Joint Stock Company)
NOTES TO THE CONSOLIDATED STATEMENTS (CONTINUED)
For the year ended 31 December 2018
(All amounts in Saudi Riyals ‘000 unless otherwise stated)
33
6. Summary of significant accounting polices (continued)
Derivative financial instruments and hedge accounting
Derivative financial instruments are initially recognised at fair value on the date on which a derivative contract
is entered into and are subsequently re-measured at fair value. Derivatives are carried as financial assets
when the fair value is positive and as financial liabilities when the fair value is negative. Any gains or losses
arising from changes in fair value on derivatives during the period that do not qualify for hedge accounting
and the ineffective portion of an effective hedge, are taken directly to the consolidated statement of income.
The fair value of forward currency contracts is the difference between the forward exchange rate and the
contract rate. The forward exchange rate is referenced to current forward exchange rates for contracts with
similar maturity profiles. The fair value of interest rate swap contracts is determined by reference to yield
curves for similar instruments.
Inventories
Inventories, including raw materials, work in progress, finished goods, and consumables and spare parts
are measured at the lower of cost i.e. historical purchase prices based on the weighted average principle
plus directly attributable costs or the net realisable value. Inventories of work in progress and finished goods
include cost of materials, labour and an appropriate proportion of direct overheads.
Cash dividend paid to equity holders of the Parent
The Group recognises a liability to make cash distribution to equity holders of the Parent when the
distribution is authorised and the distribution is no longer at the discretion of the Group. In accordance with
the Companies Law in KSA, a distribution is authorised when it is approved by the shareholders. Interim
dividends, if any, are recorded when approved by the Board of Directors. A corresponding amount is
recognised directly in the consolidated statement of changes in equity.
Provisions
General
Provisions are recognised when the Group has a present obligation (legal or constructive) as a result of a
past event, it is probable that an outflow of resources embodying economic benefits will be required to
settle the obligation and a reliable estimate can be made of the obligation amount. If the effect of the time
value of money is material, provisions are discounted using a current pre-tax rate that reflects, where
appropriate, the risks specific to the liability. Where discounting is used, the increase in the provision due
to the passage of time is recognised as finance cost.
Environmental obligations
In accordance with the Group’s environmental policy and applicable legal requirements, the Group
recognises a provision for environmental clean-up cost when it is probable that a legal or constructive
liability has materialised and the amount of cash outflow can be reasonably estimated.
Onerous contracts
A provision for onerous contracts is recognised when the expected benefits to be derived by the Group from
a contract are lower than the unavoidable cost meeting its obligation under the contract.
De-commissioning liability
The Group records a provision for de-commissioning costs of manufacturing facilities when an obligation
exists. De-commissioning costs are provided at the present value of expected costs to settle the obligation
using estimated cash flows and are recognised as part of the cost of the particular asset. The cash flows are
discounted at a current pre-tax rate that reflects the risks specific to the de-commissioning liability. The
unwinding of the discount is expensed as incurred and recognised in the consolidated statement of income
as a finance cost. The estimated future cost of de-commissioning is reviewed annually and adjusted as
appropriate. Changes in the estimated future costs or in the discount rate applied are added to or deducted
from the cost of the asset.
SAUDI BASIC INDUSTRIES CORPORATION (SABIC) AND ITS SUBSIDIARIES
(A Saudi Joint Stock Company)
NOTES TO THE CONSOLIDATED STATEMENTS (CONTINUED)
For the year ended 31 December 2018
(All amounts in Saudi Riyals ‘000 unless otherwise stated)
34
6. Summary of significant accounting polices (continued)
Employee benefits
Long-term employee benefit obligations
Long-term employee benefit obligations are measured at the present value of expected future payments to
be made in respect of services provided by employees up to the end of the reporting period using the
projected unit credit method and recorded as non-current liabilities. Consideration is given to expected
future salary increase and historic attrition rates. Expected future payments are discounted using market
yields at the end of the reporting period of high-quality corporate or government bonds with terms and
currencies that match, as closely as possible, the estimated future cash outflows. Re-measurements as a
result of changes in actuarial assumptions are recognised in the consolidated statement of comprehensive
income. The Group offers various post-employment schemes, including both defined contribution and
defined benefit plans, and post-employment medical and life insurance plans for eligible employees and
their dependents.
Defined contribution plans
A defined contribution plan is a post-employment benefit plan under which the Group pays fixed
contributions into a separate entity and has no legal or constructive obligation. The contributions are
recognised as employee benefit expense in the consolidated statement of income when they are due.
Within KSA, the Group offers a saving plan to encourage its Saudi employees to make savings in a manner
that will warrant an increase in their income and contribute to securing their future according to the
established plan. The saving contributions from the participants are deposited in a separate bank account
other than the Group’s normal operating bank accounts (but not in any separate legal entity). This cash is a
restricted balance, and for the purpose of presentation in the financial statements, it is offset with the related
liability under the savings plan and the net liability to employees is reported under the employee benefits
liability.
Defined benefit plans
A defined benefit plan is a post-employment benefit plan other than a defined contribution plan. The Group
primarily has end of service benefits, defined benefit pension plans and post-retirement medical and life
insurance plans, which qualify as defined benefit plans.
End of service benefits and pension plans
In KSA, for the liability for employees’ end of service benefits, the actuarial valuation process takes into
consideration the provisions of the Saudi Arabian Labour and Workmen Law as well as the Group’s policy.
In other countries, the respective labour laws are taken into consideration.
The net pension asset or liability recognised in the consolidated statement of financial position in respect of
defined benefit post-employment plans is the present value of the projected Defined Benefits Obligation
(“DBO”) less the fair value of plan assets, if any, at the reporting date.
DBO is re-measured on a periodic basis by independent actuaries using the projected unit credit method.
The present value of the DBO is determined by discounting the estimated future cash outflows using interest
rates of high-quality corporate bonds that are denominated in the currency in which the benefits will be paid,
and that have terms approximating to the terms of the related obligation. In countries where there is no
deep market in such bonds, the market rates on government bonds are used. The net interest cost is
calculated by applying the discount rate to the net balance of the DBO and the fair value of plan assets.
DBO costs are calculated, using the actuarially determined pension cost rate at the end of the prior year,
adjusted for significant market fluctuations and for any significant one-off events, such as plan
amendments, curtailments and settlements. In the absence of such significant market fluctuations and one-
off events, the actuarial liabilities are rolled forward based on the assumptions as at the beginning of the
year. If there are significant changes to the assumptions or arrangements during the interim period,
consideration is given to re-measure such liabilities and the related costs.

SAUDI BASIC INDUSTRIES CORPORATION (SABIC) AND ITS SUBSIDIARIES
(A Saudi Joint Stock Company)
NOTES TO THE CONSOLIDATED STATEMENTS (CONTINUED)
For the year ended 31 December 2018
(All amounts in Saudi Riyals ‘000 unless otherwise stated)
35
6. Summary of significant accounting polices (continued)
Employee benefits
Long-term employee benefit obligations (continued)
End of service benefits and pension plans (continued)
Re-measurement gains and losses arising from changes in actuarial assumptions are recognised in the
period in which they occur in OCI. Changes in the present value of the DBO resulting from plan amendments
or curtailments are recognised immediately in the consolidated statement of income as past service costs.
When the benefits plan are amended, the portion of the change in benefit relating to the past service by
employees is recognised as an expense or income; if applicable, on a straight-line basis over the average
period until the benefits become vested in the consolidated statement of income. To the extent that benefits
vest immediately, the expense or income, if applicable is recognised immediately in the consolidated
statement of income.
Current and past service costs related to post-employment benefits are recognised immediately in the
consolidated statement of income while unwinding of the liability at discount rates used are recorded as
financial cost. Any changes in net liability due to actuarial valuations and changes in assumptions are taken
as re-measurement in OCI.
Employee Home Ownership Program (“HOP”)
Certain companies within the Group have established employee’s HOP that offer eligible employees the
opportunity to buy residential units constructed by these subsidiaries through a series of payments over a
particular number of years. Ownership of the houses is transferred upon completion of full payment.
Under the HOP, the amounts paid by the employee towards the house are repayable back to the employee
in case the employee discontinues employment and the house is returned back to the Group. HOP is
recognised as a non-current prepayment asset at time the residential units are allocated to the employees
and are amortised over the repayment period of the facility due from employees.
Employee Home Loan Program (“HLP”)
The Group provides interest free home loan to its eligible employees for purposes related to purchase or
building of a house or apartment. The loan is repaid in monthly instalment by deduction of employee’s pay.
HLP is recognised as a non-current financial asset at fair value and measured at amortised cost using the
EIR method. The difference between the fair value and the actual amount of cash given to the employee is
recognised as a “non-current prepaid employee benefit” and is amortised as an expense equally over the
period of service. The same amount is also amortised as finance income against the receivable from
employees.
Revenue recognition
Sales revenue
The Group recognises revenue when control of the products sold, transfers to the customer, which shall be
considered in the context of a five-step approach and applying the applicable shipping terms.
Revenue is measured at the fair value of the consideration received or receivable, taking into account
contractually defined terms of payment and excluding taxes or duty. Revenue arrangements are assessed
against specific criteria to determine whether the Group is acting as a principal or agent.
Rights of return
When a contract with a customer provides a right of return of the good within a specified period, the Group
accounts for the right of return when requested by the customer and contractual conditions are met.
SAUDI BASIC INDUSTRIES CORPORATION (SABIC) AND ITS SUBSIDIARIES
(A Saudi Joint Stock Company)
NOTES TO THE CONSOLIDATED STATEMENTS (CONTINUED)
For the year ended 31 December 2018
(All amounts in Saudi Riyals ‘000 unless otherwise stated)
36
6. Summary of significant accounting polices (continued)
Revenue recognition (continued)
Allocation of performance obligations
In certain instances, the Group determines delivery services as separately identifiable and distinct from the
sale of goods. These are when the Group transfers control of goods at the Group’s loading site and provides
delivery services to the buyer’s site. The Group allocates a portion of the total transaction price to delivery
services based on a best estimate of a similar stand-alone service.
Variable pricing – preliminary pricing
Certain products in certain markets may be sold with variable pricing arrangements. Such arrangements
determine that a preliminary price is charged to the customer at the time of transfer of control of the
products while the final price for the products can only be determined by reference to a time period ending
after that time. In such cases, and irrespective of the formula used for determining preliminary and final
prices, revenue is recorded at the time of transfer of control of the products at an amount representing the
expected final amount of consideration that the Group receives.
Where the Group records an ‘accounts receivable’ for the preliminary price, subsequent changes in the
estimated final price shall not be recorded as revenue until such point in time at which the actual final price
is determined (as long as these changes result from changes in the market price/market price index of the
products). They may however be considered in subsequent re-measurement as a financial asset at fair value.
Such re-measurement may be recorded as a separate revenue.
All other updates to the preliminary price is recorded against revenue with the additional receivable amount
recorded under a contract asset or contract liability. Such contract asset or liability is de-recognised against
an accounts receivable at the point in time at which the actual final price is determined.
Variable pricing – volume rebates
The Group provides retrospective volume rebates to its customers on products purchased by the customer
once the quantity of products purchased during the period exceeds a threshold specified in the contract.
The Group estimates the expected volume rebates using a prudent assessment of the expected amount of
rebates, reviewed and updated on a regular basis. These amounts will subsequently be repaid in cash to
the customer or are offset against amounts payable by the customer, if allowed by the contract.
Volume rebates give rise to variable consideration. The Group considers the “most likely amount” method
to be the best estimate of this variable consideration.
Rendering of services
In certain instances, the Group provides logistic services for goods sold. This service is satisfied over the
period of delivery. Consequently, the Group defers revenue allocated to the logistic services and recognise
it over that period.
Accounting policy until end 2017
Until the end of 2017, the Group recognized revenue in accordance with IAS 18 ‘Revenue’. The prevailing
principle of recognizing revenue was upon the sale of goods when significant risks and rewards of ownership
of the goods have been passed to the buyer, usually on delivery of the goods. Revenue from the sale of
goods was measured at the fair value of the consideration received or receivable, net of returns and
allowances, trade discounts and volume rebates.
Finance income
For all financial instruments measured at amortised cost and interest-bearing financial assets classified as
investments in equity instruments at FVOCI, finance income is recorded using the EIR. EIR is the rate that
discounts the estimated future cash payments or receipts over the expected life of the financial instrument
or a shorter period, where appropriate, to the net carrying amount of the financial asset or liability.
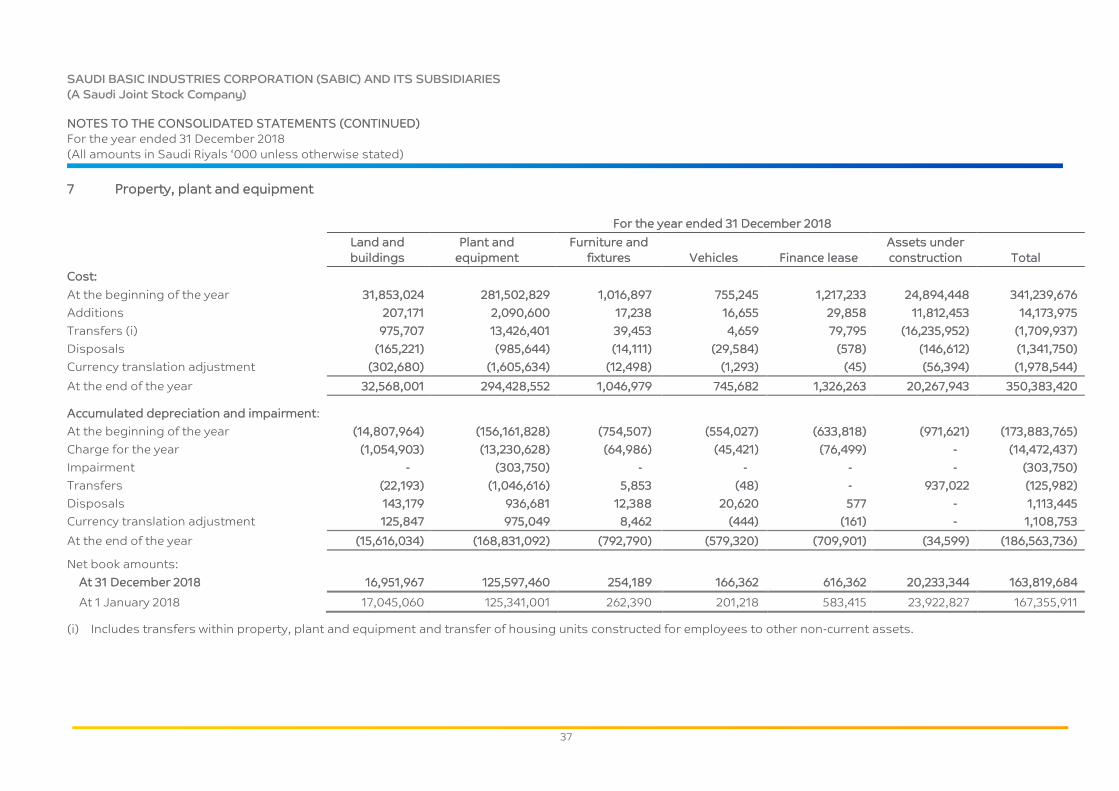
SAUDI BASIC INDUSTRIES CORPORATION (SABIC) AND ITS SUBSIDIARIES
(A Saudi Joint Stock Company)
NOTES TO THE CONSOLIDATED STATEMENTS (CONTINUED)
For the year ended 31 December 2018
(All amounts in Saudi Riyals ‘000 unless otherwise stated)
37
7 Property, plant and equipment
For the year ended 31 December 2018
Land and
buildings
Plant and
equipment
Furniture and
fixtures Vehicles Finance lease
Assets under
construction Total
Cost:
At the beginning of the year 31,853,024 281,502,829 1,016,897 755,245 1,217,233 24,894,448 341,239,676
Additions 207,171 2,090,600 17,238 16,655 29,858 11,812,453 14,173,975
Transfers (i) 975,707 13,426,401 39,453 4,659 79,795 (16,235,952) (1,709,937)
Disposals (165,221) (985,644) (14,111) (29,584) (578) (146,612) (1,341,750)
Currency translation adjustment (302,680) (1,605,634) (12,498) (1,293) (45) (56,394) (1,978,544)
At the end of the year 32,568,001 294,428,552 1,046,979 745,682 1,326,263 20,267,943 350,383,420
Accumulated depreciation and impairment:
At the beginning of the year (14,807,964) (156,161,828) (754,507) (554,027) (633,818) (971,621) (173,883,765)
Charge for the year (1,054,903) (13,230,628) (64,986) (45,421) (76,499) - (14,472,437)
Impairment - (303,750) - - - - (303,750)
Transfers (22,193) (1,046,616) 5,853 (48) - 937,022 (125,982)
Disposals 143,179 936,681 12,388 20,620 577 - 1,113,445
Currency translation adjustment 125,847 975,049 8,462 (444) (161) - 1,108,753
At the end of the year (15,616,034) (168,831,092) (792,790) (579,320) (709,901) (34,599) (186,563,736) Net book amounts:
At 31 December 2018 16,951,967 125,597,460 254,189 166,362 616,362 20,233,344 163,819,684
At 1 January 2018 17,045,060 125,341,001 262,390 201,218 583,415 23,922,827 167,355,911
(i) Includes transfers within property, plant and equipment and transfer of housing units constructed for employees to other non-current assets.
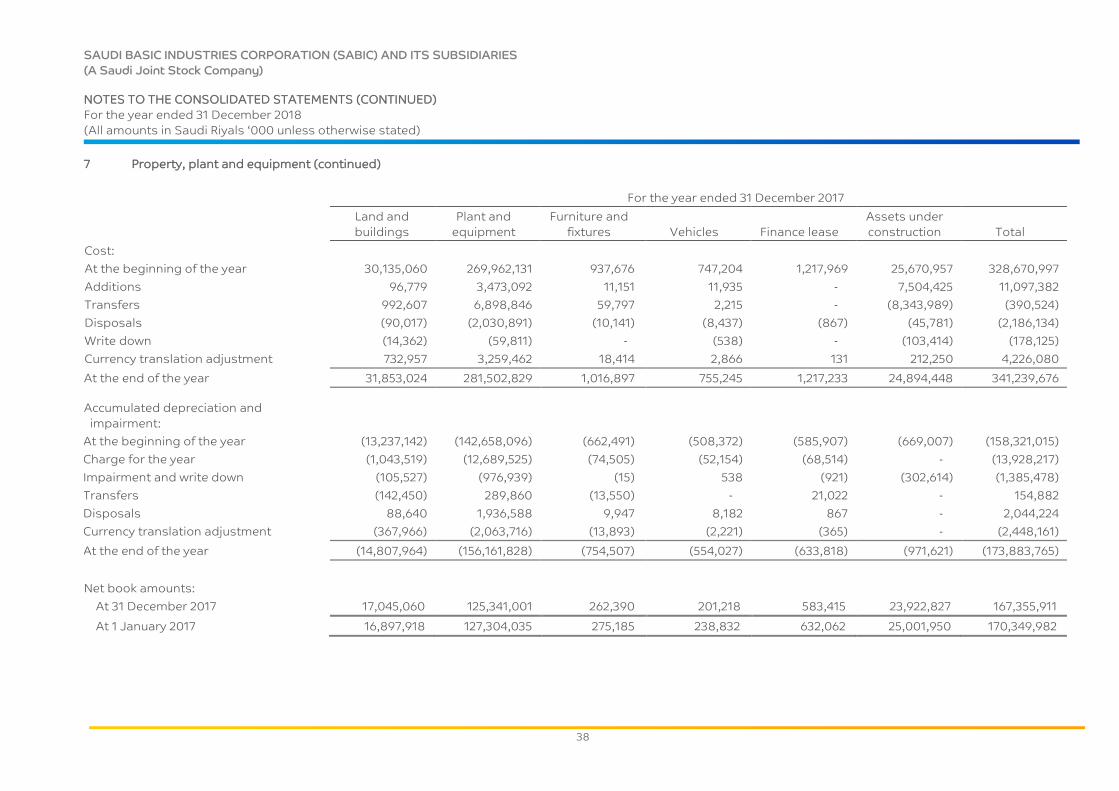
SAUDI BASIC INDUSTRIES CORPORATION (SABIC) AND ITS SUBSIDIARIES
(A Saudi Joint Stock Company)
NOTES TO THE CONSOLIDATED STATEMENTS (CONTINUED)
For the year ended 31 December 2018
(All amounts in Saudi Riyals ‘000 unless otherwise stated)
38
7 Property, plant and equipment (continued)
For the year ended 31 December 2017
Land and
buildings
Plant and
equipment
Furniture and
fixtures Vehicles Finance lease
Assets under
construction Total
Cost:
At the beginning of the year 30,135,060 269,962,131 937,676 747,204 1,217,969 25,670,957 328,670,997
Additions 96,779 3,473,092 11,151 11,935 - 7,504,425 11,097,382
Transfers 992,607 6,898,846 59,797 2,215 - (8,343,989) (390,524)
Disposals (90,017) (2,030,891) (10,141) (8,437) (867) (45,781) (2,186,134)
Write down (14,362) (59,811) - (538) - (103,414) (178,125)
Currency translation adjustment 732,957 3,259,462 18,414 2,866 131 212,250 4,226,080
At the end of the year 31,853,024 281,502,829 1,016,897 755,245 1,217,233 24,894,448 341,239,676
Accumulated depreciation and
impairment:
At the beginning of the year (13,237,142) (142,658,096) (662,491) (508,372) (585,907) (669,007) (158,321,015)
Charge for the year (1,043,519) (12,689,525) (74,505) (52,154) (68,514) - (13,928,217)
Impairment and write down (105,527) (976,939) (15) 538 (921) (302,614) (1,385,478)
Transfers (142,450) 289,860 (13,550) - 21,022 - 154,882
Disposals 88,640 1,936,588 9,947 8,182 867 - 2,044,224
Currency translation adjustment (367,966) (2,063,716) (13,893) (2,221) (365) - (2,448,161)
At the end of the year (14,807,964) (156,161,828) (754,507) (554,027) (633,818) (971,621) (173,883,765)
Net book amounts:
At 31 December 2017 17,045,060 125,341,001 262,390 201,218 583,415 23,922,827 167,355,911
At 1 January 2017 16,897,918 127,304,035 275,185 238,832 632,062 25,001,950 170,349,982

SAUDI BASIC INDUSTRIES CORPORATION (SABIC) AND ITS SUBSIDIARIES
(A Saudi Joint Stock Company)
NOTES TO THE CONSOLIDATED STATEMENTS (CONTINUED)
For the year end 31 December 2018
(All amounts in Saudi Riyals ‘000 unless otherwise stated)
39
7 Property, plant and equipment (continued)
Allocation of depreciation charge for the year
For the year ended
31 December 2018
For the year ended
31 December 2017
Cost of sales 13,903,349 13,268,321
Selling and distribution expenses 59,737 74,328
General and administrative expenses 509,351 585,568
Total 14,472,437 13,928,217
Land and building
The land on which plant and related facilities of certain subsidiaries in KSA are constructed are leased from
the Royal Commission for Jubail and Yanbu under renewable lease agreements for a period up to 30 years.
Land and buildings include an amount of SR 2.04 billion as of 31 December 2018 (2017: SR 2.04 billion)
representing the cost of freehold land.
Assets under construction
Assets under construction mainly represents the expansion of existing plants and new projects being
executed by certain subsidiaries. The related capital commitments are reported in Note 37.
Capitalised borrowing costs
The borrowing cost capitalised during the year ended 31 December 2018 amounted to SR 0.04 billion (2017:
SR 0.18 billion), out of which SR 0.02 billion (2017: SR 0.10 billion) relate to non-conventional facilities. The
Group uses the capitalisation rate of 4% (2017: 4%) to determine the amount of borrowing costs eligible for
capitalisation.
Finance lease
Leased assets are pledged as security for the related finance lease and hire purchase liabilities.
Pledged property, plant and equipment
Property, plant and equipment of certain subsidiaries in the KSA pledged to Saudi Industrial Development
Fund (“SIDF”) as security for its term loans amounting to SR 34.62 billion (2017: SR 36.86 billion).
Impairment and write down of plant and equipment
During the year ended 31 December 2018, total impairment and write down, amounting to SR 0.30 billion
(2017: SR 1.56 billion), was recorded against the plant and equipment mainly are as follows:
During 2018, impairment was determined based on the fair value less cost of disposal of the related
CGU. (Note 8).
During 2017, an impairment loss amounting to SR 0.48 billion, recorded against certain plant and
equipment of subsidiaries to bring these to their recoverable amount due to lower profitability and
demand. The recoverable amount of the plant and equipment were computed as SR 1.37 billion as at 31
December 2017 based on “value-in-use” method and determined at the level of CGU as identified by
respective subsidiaries’ management. In determining value in use for the CGU, the cash flows –
determined using approved 5-year business plan and budget – were discounted at a rate of 7.48%-
9.49% on a pre-zakat basis and were projected up to the year 2047 in line with the estimated useful life
of the concerned plant and equipment.
During 2017, a write down amounting SR 1.08 billion recorded against certain plant and equipment that
have been decided to be idle as a result of their economic conditions and were not expected to bring
these plant and equipment to become operative in the near future and hence the amount above is
recognised in the consolidated statement of income under cost of sales. These write-downs were to
reduce the total carrying value of certain plant and equipment to nil.

SAUDI BASIC INDUSTRIES CORPORATION (SABIC) AND ITS SUBSIDIARIES
(A Saudi Joint Stock Company)
NOTES TO THE CONSOLIDATED STATEMENTS (CONTINUED)
For the year end 31 December 2018
(All amounts in Saudi Riyals ‘000 unless otherwise stated)
40
8 Intangible assets
For the year ended 31 December 2018
Goodwill
Software and IT
development Licenses Others (i)
Intangibles under
development Total
Cost:
At the beginning of the year 9,089,745 2,328,153 9,906,856 105,741 32,950 21,463,445
Additions - 1,310 65,611 1,092 3,045 71,058
Additions – through business combination
(Note 9) - - 201,668 - - 201,668
Transfers - 44,376 65,514 (49,145) (28,903) 31,842
Impairment and write down (97,500) (202,867) (649) (836) (4,047) (305,899)
Currency translation adjustment (248,350) (17,524) (57,231) (2,598) - (325,703)
At the end of the year 8,743,895 2,153,448 10,181,769 54,254 3,045 21,136,411
Accumulated amortisation:
At the beginning of the year - (1,651,660) (6,215,522) (53,866) - (7,921,048)
Charge for the year - (192,560) (471,084) - - (663,644)
Transfers - - 101,862 - - 101,862
Write down - 202,867 649 40,649 - 244,165
Currency translation adjustment - 10,343 38,644 478 - 49,465
At the end of the year - (1,631,010) (6,545,451) (12,739) - (8,189,200)
Net book amounts:
At 31 December 2018 8,743,895 522,438 3,636,318 41,515 3,045 12,947,211
At 1 January 2018 9,089,745 676,493 3,691,334 51,875 32,950 13,542,397
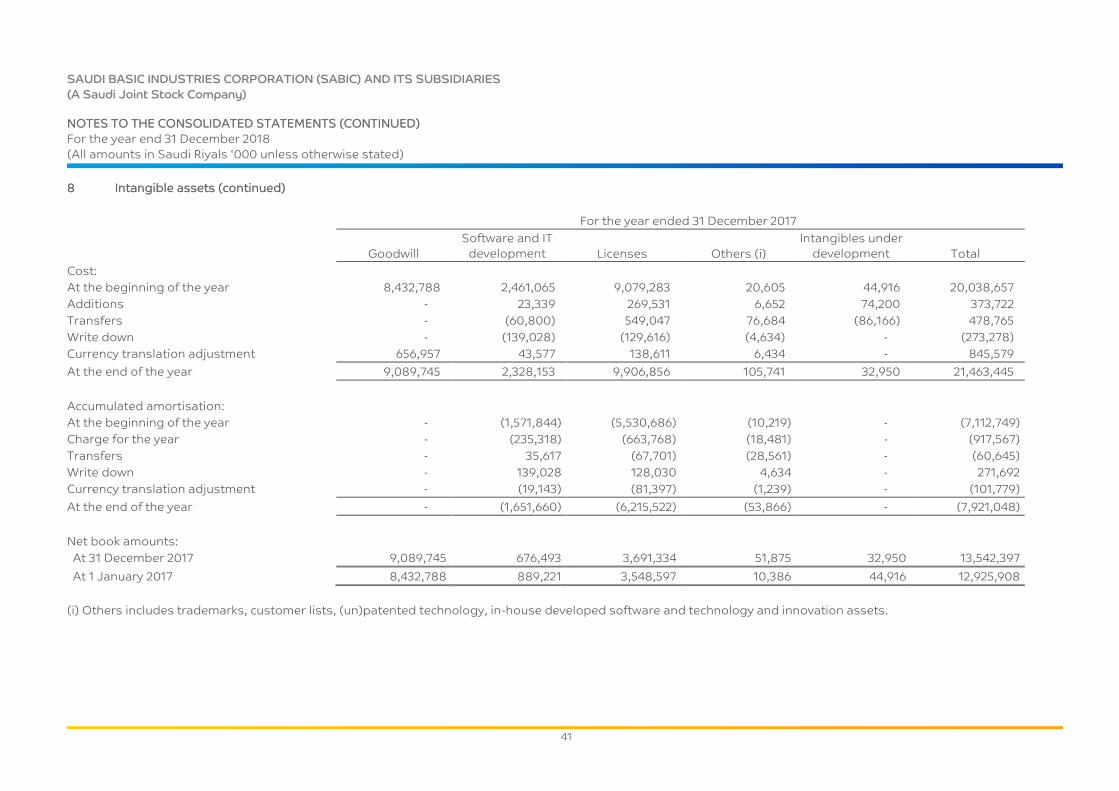
SAUDI BASIC INDUSTRIES CORPORATION (SABIC) AND ITS SUBSIDIARIES
(A Saudi Joint Stock Company)
NOTES TO THE CONSOLIDATED STATEMENTS (CONTINUED)
For the year end 31 December 2018
(All amounts in Saudi Riyals ‘000 unless otherwise stated)
41
8 Intangible assets (continued)
For the year ended 31 December 2017
Goodwill
Software and IT
development Licenses Others (i)
Intangibles under
development Total
Cost:
At the beginning of the year 8,432,788 2,461,065 9,079,283 20,605 44,916 20,038,657
Additions - 23,339 269,531 6,652 74,200 373,722
Transfers - (60,800) 549,047 76,684 (86,166) 478,765
Write down - (139,028) (129,616) (4,634) - (273,278)
Currency translation adjustment 656,957 43,577 138,611 6,434 - 845,579
At the end of the year 9,089,745 2,328,153 9,906,856 105,741 32,950 21,463,445
Accumulated amortisation:
At the beginning of the year - (1,571,844) (5,530,686) (10,219) - (7,112,749)
Charge for the year - (235,318) (663,768) (18,481) - (917,567)
Transfers - 35,617 (67,701) (28,561) - (60,645)
Write down - 139,028 128,030 4,634 - 271,692
Currency translation adjustment - (19,143) (81,397) (1,239) - (101,779)
At the end of the year - (1,651,660) (6,215,522) (53,866) - (7,921,048)
Net book amounts:
At 31 December 2017 9,089,745 676,493 3,691,334 51,875 32,950 13,542,397
At 1 January 2017 8,432,788 889,221 3,548,597 10,386 44,916 12,925,908
(i) Others includes trademarks, customer lists, (un)patented technology, in-house developed software and technology and innovation assets.
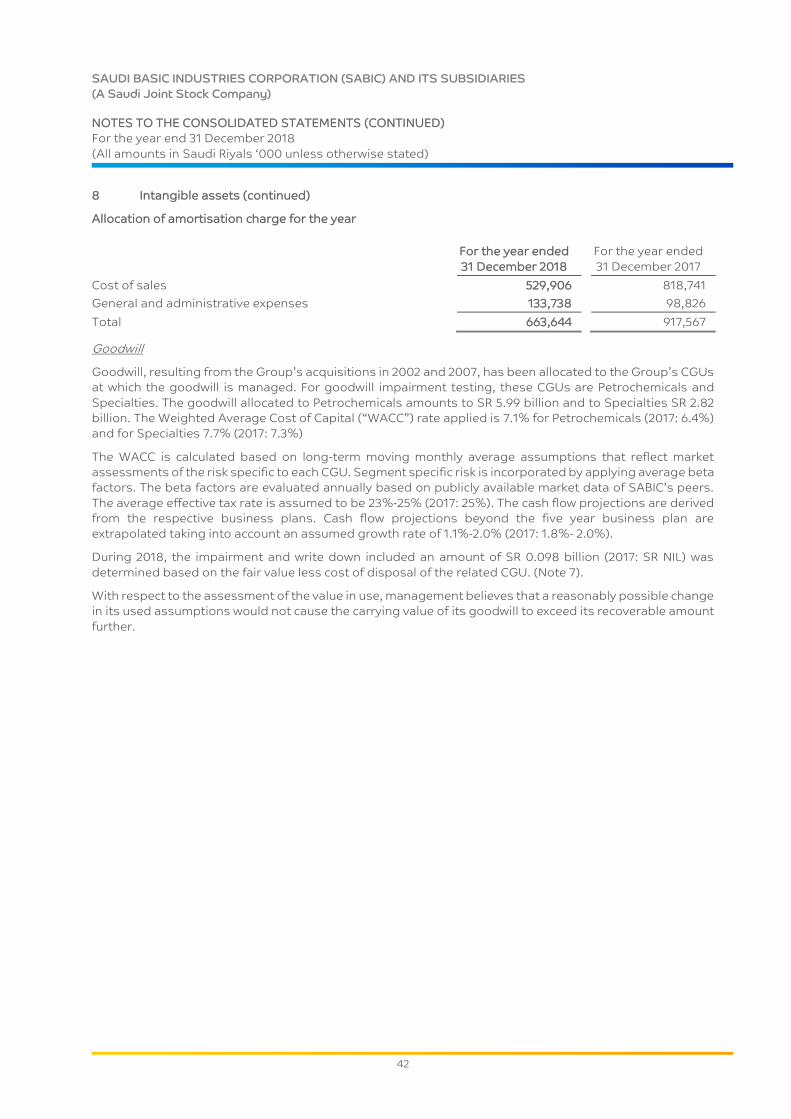
SAUDI BASIC INDUSTRIES CORPORATION (SABIC) AND ITS SUBSIDIARIES
(A Saudi Joint Stock Company)
NOTES TO THE CONSOLIDATED STATEMENTS (CONTINUED)
For the year end 31 December 2018
(All amounts in Saudi Riyals ‘000 unless otherwise stated)
42
8 Intangible assets (continued)
Allocation of amortisation charge for the year
For the year ended
31 December 2018
For the year ended
31 December 2017
Cost of sales 529,906 818,741
General and administrative expenses 133,738 98,826
Total 663,644 917,567
Goodwill
Goodwill, resulting from the Group’s acquisitions in 2002 and 2007, has been allocated to the Group’s CGUs
at which the goodwill is managed. For goodwill impairment testing, these CGUs are Petrochemicals and
Specialties. The goodwill allocated to Petrochemicals amounts to SR 5.99 billion and to Specialties SR 2.82
billion. The Weighted Average Cost of Capital (“WACC”) rate applied is 7.1% for Petrochemicals (2017: 6.4%)
and for Specialties 7.7% (2017: 7.3%)
The WACC is calculated based on long-term moving monthly average assumptions that reflect market
assessments of the risk specific to each CGU. Segment specific risk is incorporated by applying average beta
factors. The beta factors are evaluated annually based on publicly available market data of SABIC’s peers.
The average effective tax rate is assumed to be 23%-25% (2017: 25%). The cash flow projections are derived
from the respective business plans. Cash flow projections beyond the five year business plan are
extrapolated taking into account an assumed growth rate of 1.1%-2.0% (2017: 1.8%- 2.0%).
During 2018, the impairment and write down included an amount of SR 0.098 billion (2017: SR NIL) was
determined based on the fair value less cost of disposal of the related CGU. (Note 7).
With respect to the assessment of the value in use, management believes that a reasonably possible change
in its used assumptions would not cause the carrying value of its goodwill to exceed its recoverable amount
further.
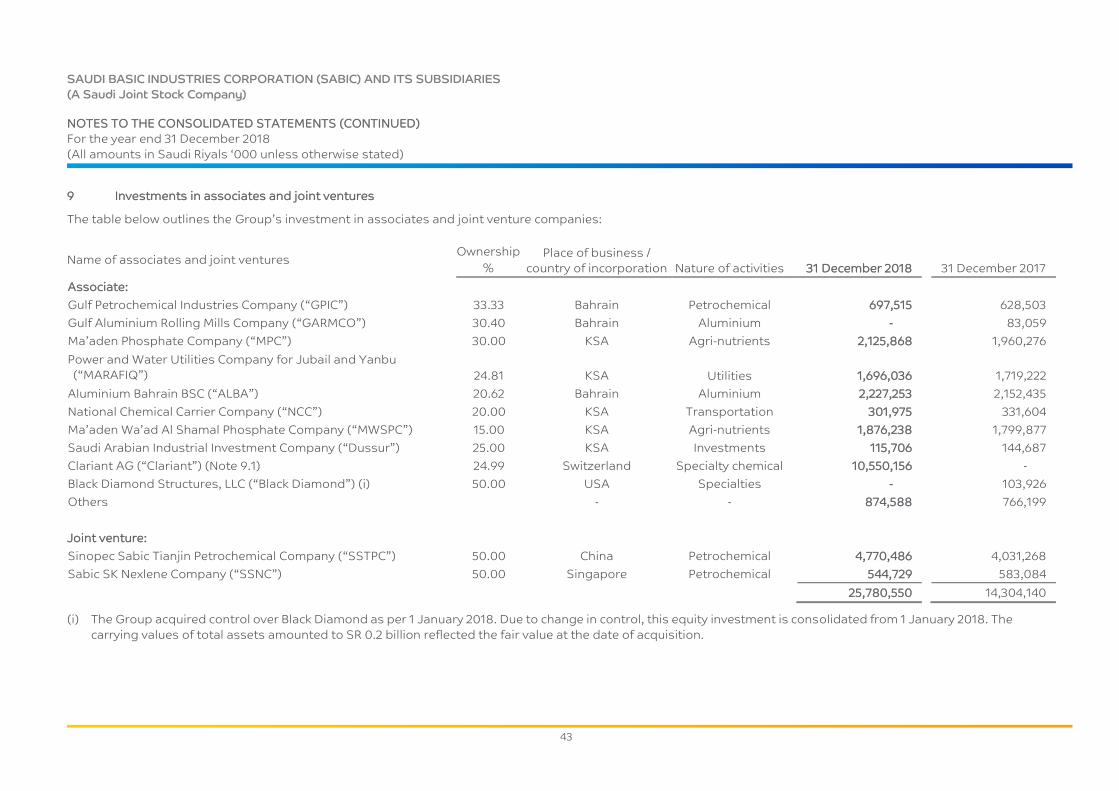
SAUDI BASIC INDUSTRIES CORPORATION (SABIC) AND ITS SUBSIDIARIES
(A Saudi Joint Stock Company)
NOTES TO THE CONSOLIDATED STATEMENTS (CONTINUED)
For the year end 31 December 2018
(All amounts in Saudi Riyals ‘000 unless otherwise stated)
43
9 Investments in associates and joint ventures
The table below outlines the Group’s investment in associates and joint venture companies:
Name of associates and joint ventures Ownership
%
Place of business /
country of incorporation Nature of activities 31 December 2018
31 December 2017
Associate:
Gulf Petrochemical Industries Company (“GPIC”) 33.33 Bahrain Petrochemical 697,515 628,503
Gulf Aluminium Rolling Mills Company (“GARMCO”) 30.40 Bahrain Aluminium - 83,059
Ma’aden Phosphate Company (“MPC”) 30.00 KSA Agri-nutrients 2,125,868 1,960,276
Power and Water Utilities Company for Jubail and Yanbu
(“MARAFIQ”) 24.81 KSA
Utilities 1,696,036 1,719,222
Aluminium Bahrain BSC (“ALBA”) 20.62 Bahrain Aluminium 2,227,253 2,152,435
National Chemical Carrier Company (“NCC”) 20.00 KSA Transportation 301,975 331,604
Ma’aden Wa’ad Al Shamal Phosphate Company (“MWSPC”) 15.00 KSA Agri-nutrients 1,876,238 1,799,877
Saudi Arabian Industrial Investment Company (“Dussur”) 25.00 KSA Investments 115,706 144,687
Clariant AG (“Clariant”) (Note 9.1) 24.99 Switzerland Specialty chemical 10,550,156 -
Black Diamond Structures, LLC (“Black Diamond”) (i) 50.00 USA Specialties - 103,926
Others - - 874,588 766,199
Joint venture:
Sinopec Sabic Tianjin Petrochemical Company (“SSTPC”) 50.00 China Petrochemical 4,770,486 4,031,268
Sabic SK Nexlene Company (“SSNC”) 50.00 Singapore Petrochemical 544,729 583,084
25,780,550 14,304,140
(i) The Group acquired control over Black Diamond as per 1 January 2018. Due to change in control, this equity investment is consolidated from 1 January 2018. The
carrying values of total assets amounted to SR 0.2 billion reflected the fair value at the date of acquisition.
SAUDI BASIC INDUSTRIES CORPORATION (SABIC) AND ITS SUBSIDIARIES
(A Saudi Joint Stock Company)
NOTES TO THE CONSOLIDATED FINANCIAL STATEMENTS (CONTINUED)
For the year ended 31 December 2018
(All amounts in Saudi Riyals ‘000 unless otherwise stated)
44
9 Investments in associates and joint ventures (continued)
9.1 Acquisition of Clariant
At 10 September 2018, SABIC acquired approximately 83 million shares equivalent to 24.99% ownership in
Clariant, a global specialty chemical company listed at the Swiss Stock Exchange (“SIX”). As major
stakeholder, management considers having significant influence, without having control over Clariant.
Therefore, this investment is accounted for as an associate using the equity method.
Due to prevailing Swiss law and regulations, the preliminary Purchase Price Allocation (“PPA”) is based on
public available information only. Through an independent appraiser, management applied a benchmark
analysis approach, where it reviewed recent PPA’s of transactions in the chemicals industry and applied the
outcome of this analysis on the applied enterprise value of Clariant. This is subject to further assessment of
the fair value of the (net) assets of Clariant during next 12 months.
The Group paid a consideration of SR 10.82 billion which includes an initial goodwill amounting to SR 5.38
billion. The market price of a Clariant share was Swiss Francs (CHF) 18.09 [approximately SR 68] each as at
28 December 2018, the last trading day at SIX, amounting to a total quoted fair value of approximately SR
5.72 billion. Management believes that the fair value per share as unit of account is not representative of the
value of this investment. A premium on this investment is considered appropriate, given the fact that SABIC
has significant influence through its 24.99% share in Clariant and the fact that on 18 September 2018, SABIC
and Clariant announced their long-term strategic relationship, whereby both parties are currently in
discussion about strategic initiatives. At year-end, management assessed the carrying value of its
investment using the higher of fair value less cost of disposal and value in use approach using publicly
available information taking an average analyst consensus and reasonable assumptions. Based on its
assessment, management concluded that the carrying value of this investment at 31 December 2018 is
supportable under both valuation methodologies.

SAUDI BASIC INDUSTRIES CORPORATION (SABIC) AND ITS SUBSIDIARIES
(A Saudi Joint Stock Company)
NOTES TO THE CONSOLIDATED FINANCIAL STATEMENTS (CONTINUED)
For the year ended 31 December 2018
(All amounts in Saudi Riyals ‘000 unless otherwise stated)
45
9 Investments in associates and joint ventures (continued)
The movement of investments in associate and joint venture is as follows:
For the year ended 31 December 2018
Associates Joint ventures
Total GPIC GARMCO MPC MARAFIQ ALBA NCC MWSPC Dussur Clariant Others SSTPC SSNC
Balance at the
beginning of the
year 628,503 83,059 1,960,276 1,719,222 2,152,435 331,604 1,799,877 144,687 - 870,125 4,031,268 583,084 14,304,140
Capital contribution
during the year - - - - - - - - 10,822,077 132,683 190,475 - 11,145,235
Share of results 106,803 (83,026) 163,160 (7,977) 150,543 (29,677) 77,169 (28,905) (106,973) (24,292) 831,728 1,297 1,049,850
Movements in OCI (291) (33) 2,432 20,185 - 48 (808) (76) (164,948) - 236,920 (39,652) 53,777
Dividends received (37,500) - - (35,394) (75,725) - - - - - (504,217) - (652,836)
Others (i) - - - - - - - - - (103,928) (15,688) - (119,616)
Balance at the end
of the year 697,515 - 2,125,868 1,696,036 2,227,253 301,975 1,876,238 115,706 10,550,156 874,588 4,770,486 544,729 25,780,550
(i) Others include obtaining control of Black Diamond Structures, LLC as well as other movements in joint ventures.
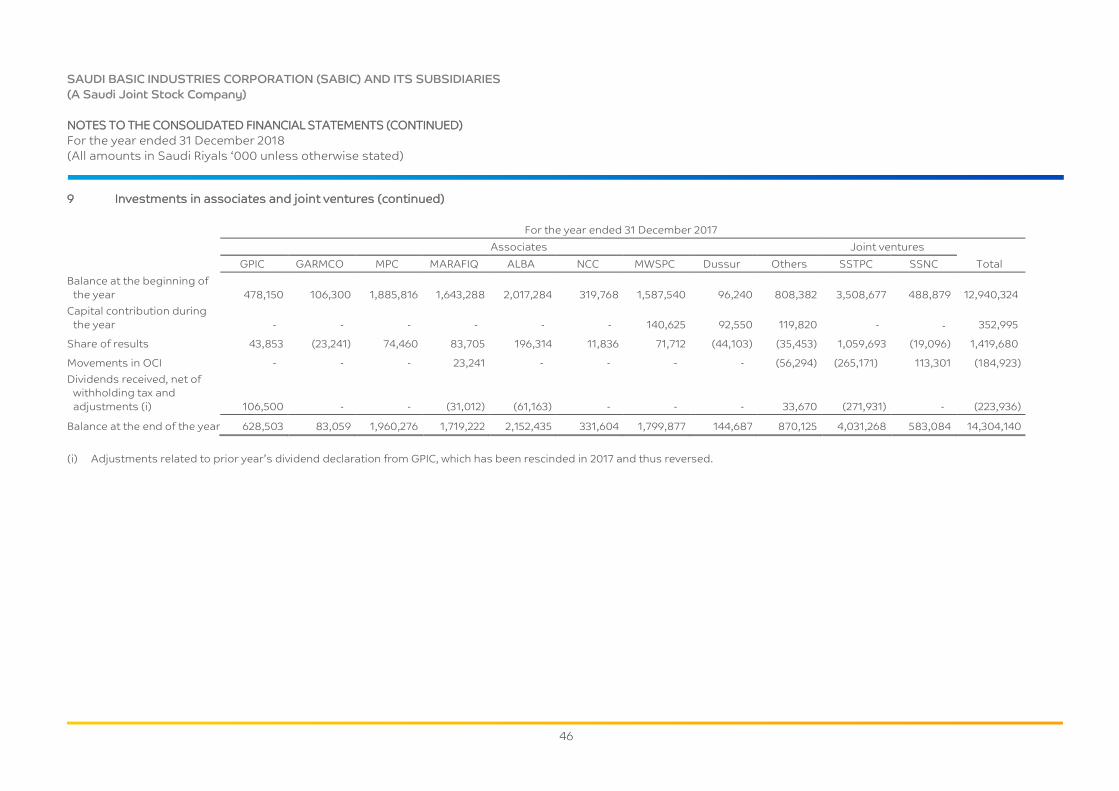
SAUDI BASIC INDUSTRIES CORPORATION (SABIC) AND ITS SUBSIDIARIES
(A Saudi Joint Stock Company)
NOTES TO THE CONSOLIDATED FINANCIAL STATEMENTS (CONTINUED)
For the year ended 31 December 2018
(All amounts in Saudi Riyals ‘000 unless otherwise stated)
46
9 Investments in associates and joint ventures (continued)
For the year ended 31 December 2017
Associates Joint ventures
Total GPIC GARMCO MPC MARAFIQ ALBA NCC MWSPC Dussur Others SSTPC SSNC
Balance at the beginning of
the year 478,150 106,300 1,885,816 1,643,288 2,017,284 319,768 1,587,540 96,240 808,382 3,508,677 488,879 12,940,324
Capital contribution during
the year - - - - - - 140,625 92,550 119,820 - - 352,995
Share of results 43,853 (23,241) 74,460 83,705 196,314 11,836 71,712 (44,103) (35,453) 1,059,693 (19,096) 1,419,680
Movements in OCI - - - 23,241 - - - - (56,294) (265,171) 113,301 (184,923)
Dividends received, net of
withholding tax and
adjustments (i) 106,500 - - (31,012) (61,163) - - - 33,670 (271,931) - (223,936)
Balance at the end of the year 628,503 83,059 1,960,276 1,719,222 2,152,435 331,604 1,799,877 144,687 870,125 4,031,268 583,084 14,304,140
(i) Adjustments related to prior year’s dividend declaration from GPIC, which has been rescinded in 2017 and thus reversed.

SAUDI BASIC INDUSTRIES CORPORATION (SABIC) AND ITS SUBSIDIARIES
(A Saudi Joint Stock Company)
NOTES TO THE CONSOLIDATED FINANCIAL STATEMENTS (CONTINUED)
For the year ended 31 December 2018
(All amounts in Saudi Riyals ‘000 unless otherwise stated)
47
9 Investments in associates and joint ventures (continued)
Summarised financial information of associates
The tables below provide summarised financial information of the material associates of the Group. The
information disclosed reflects the amounts presented in the available financial statements of the relevant
investee and not SABIC’s share of those amounts.
MPC MARAFIQ ALBA MWSPC (i) Clariant (ii)
As at 31 December 2018
Current assets 2,837,269 3,349,284 4,507,876 3,763,582 12,727,365
Non-current assets 14,624,827 19,186,046 17,034,081 27,180,114 31,803,920
Current liabilities 1,547,546 2,959,695 4,204,279 2,330,057 8,770,556
Non-current liabilities 8,828,324 12,739,537 6,536,255 19,705,388 14,746,700
Net assets 7,086,226 6,836,098 10,801,423 8,908,251 21,014,029
Reconciliation:
Group’s share in % 30.00% 24.81% 20.62% 15.00% 24.99%
Group’s share in associate 2,125,868 1,696,036 2,227,253 1,336,238 5,251,406
Intangible / goodwill - - - 540,000 5,298,750
Carrying amount 2,125,868 1,696,036 2,227,253 1,876,238 10,550,156
For the year ended 31 December 2018
Revenue 5,215,648 4,053,837 9,075,806 1,163,825 25,393,900
Net income for the year - all from
continuing operations 705,082 228,214 594,270 415,816 1,364,975
Reconciliation:
Group’s share in % 30.00% 24.81% 20.62% 15.00% 24.99%
Group’s share in associate 211,525 56,620 122,538 62,372 341,107
Share in earnings (losses) (iii) 163,160 (7,977) 150,543 77,169 (106,973)
Notes:
(i) The Group’s investment in MWSPC includes additional contribution made to one of the shareholders in
relation to mineral rights.
(ii) The Group’s share in losses of Clariant’s net income over the period from 10 September 2018 until year-
end are recorded after fair value adjustments.
(iii) The Group’s share of earnings (losses) include certain adjustments made in Group’s share of
investments and earnings (losses).

SAUDI BASIC INDUSTRIES CORPORATION (SABIC) AND ITS SUBSIDIARIES
(A Saudi Joint Stock Company)
NOTES TO THE CONSOLIDATED FINANCIAL STATEMENTS (CONTINUED)
For the year ended 31 December 2018
(All amounts in Saudi Riyals ‘000 unless otherwise stated)
48
9 Investments in associates and joint ventures (continued)
Summarised financial information of associates (continued)
MPC MARAFIQ ALBA MWSPC
As at 31 December 2017
Current assets 2,388,835 3,967,877 4,356,845 2,175,416
Non-current assets 15,219,205 21,443,315 12,337,072 26,328,595
Current liabilities 1,824,375 2,772,990 1,764,673 2,111,058
Non-current liabilities 9,249,412 15,708,648 4,490,666 17,993,770
Net assets 6,534,253 6,929,554 10,438,578 8,399,183
Reconciliation:
Group’s share in % 30.00% 24.81% 20.62% 15.00%
Group’s share in associate 1,960,276 1,719,222 2,152,435 1,259,877
Intangible - - - 540,000
Carrying amount 1,960,276 1,719,222 2,152,435 1,799,877
For the year ended 31 December 2017
Revenue 4,253,916 3,983,429 8,494,263 1,096,917
Net income for the year - all from continuing
operations 248,200 337,384 952,056 478,080
Reconciliation:
Group’s share in % 30.00% 24.81% 20.62% 15.00%
Group’s share in associate 74,460 83,705 196,314 71,712
Share in earnings 74,460 83,705 196,314 71,712
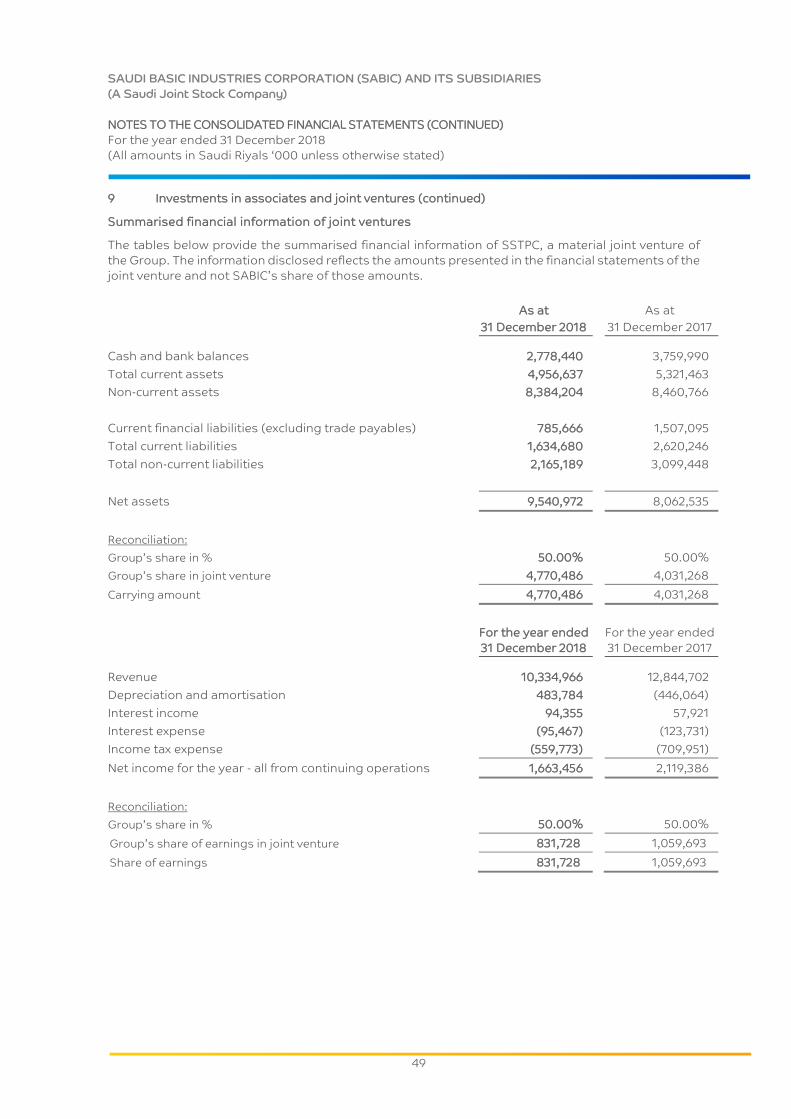
SAUDI BASIC INDUSTRIES CORPORATION (SABIC) AND ITS SUBSIDIARIES
(A Saudi Joint Stock Company)
NOTES TO THE CONSOLIDATED FINANCIAL STATEMENTS (CONTINUED)
For the year ended 31 December 2018
(All amounts in Saudi Riyals ‘000 unless otherwise stated)
49
9 Investments in associates and joint ventures (continued)
Summarised financial information of joint ventures
The tables below provide the summarised financial information of SSTPC, a material joint venture of
the Group. The information disclosed reflects the amounts presented in the financial statements of the
joint venture and not SABIC’s share of those amounts.
As at
31 December 2018
As at
31 December 2017
Cash and bank balances 2,778,440 3,759,990
Total current assets 4,956,637 5,321,463
Non-current assets 8,384,204 8,460,766
Current financial liabilities (excluding trade payables) 785,666 1,507,095
Total current liabilities 1,634,680 2,620,246
Total non-current liabilities 2,165,189 3,099,448
Net assets 9,540,972 8,062,535
Reconciliation:
Group’s share in % 50.00% 50.00%
Group’s share in joint venture 4,770,486 4,031,268
Carrying amount 4,770,486 4,031,268
For the year ended
31 December 2018
For the year ended
31 December 2017
Revenue 10,334,966 12,844,702
Depreciation and amortisation 483,784 (446,064)
Interest income 94,355 57,921
Interest expense (95,467) (123,731)
Income tax expense (559,773) (709,951)
Net income for the year - all from continuing operations 1,663,456 2,119,386
Reconciliation:
Group’s share in % 50.00% 50.00%
Group’s share of earnings in joint venture 831,728 1,059,693
Share of earnings 831,728 1,059,693

SAUDI BASIC INDUSTRIES CORPORATION (SABIC) AND ITS SUBSIDIARIES
(A Saudi Joint Stock Company)
NOTES TO THE CONSOLIDATED FINANCIAL STATEMENTS (CONTINUED)
For the year ended 31 December 2018
(All amounts in Saudi Riyals ‘000 unless otherwise stated)
50
9 Investments in associates and joint ventures (continued)
Summarised financial information of individually immaterial associates and joint venture
For the year ended 31 December 2018 For the year ended 31 December 2017
Individually
immaterial
associates
Individually
immaterial joint
ventures
Individually
immaterial
associates
Individually
immaterial joint
ventures
Net income (loss) for
the year - all from
continuing operations 556,571
20,013
72,364
(43,995)
Fair value of listed associates
The fair value of the Group’s investment in ALBA and Clariant is SR 1.75 billion and SR 5.72 billion (Note 9.1)
respectively (2017: ALBA SR 1.79 billion).
10 Investments in debt instruments
31 December 2018 31 December 2017
Current (in short-term investments)
Fixed rate instruments 93,750 -
Floating rate instrument 481,460 390,320
575,210 390,320
Non-current
Fixed rate instruments 1,146,865 1,755,531
Floating rate instrument 1,347,015 1,299,630
2,493,880 3,055,161
3,069,090 3,445,481
As at 2017, the investments in debt instruments were classified as held-to-maturity investments (Note 4).
Currency exposure
31 December 2018 31 December 2017
SR 1,641,779 2,029,856
USD 1,427,311 1,415,625
3,069,090 3,445,481
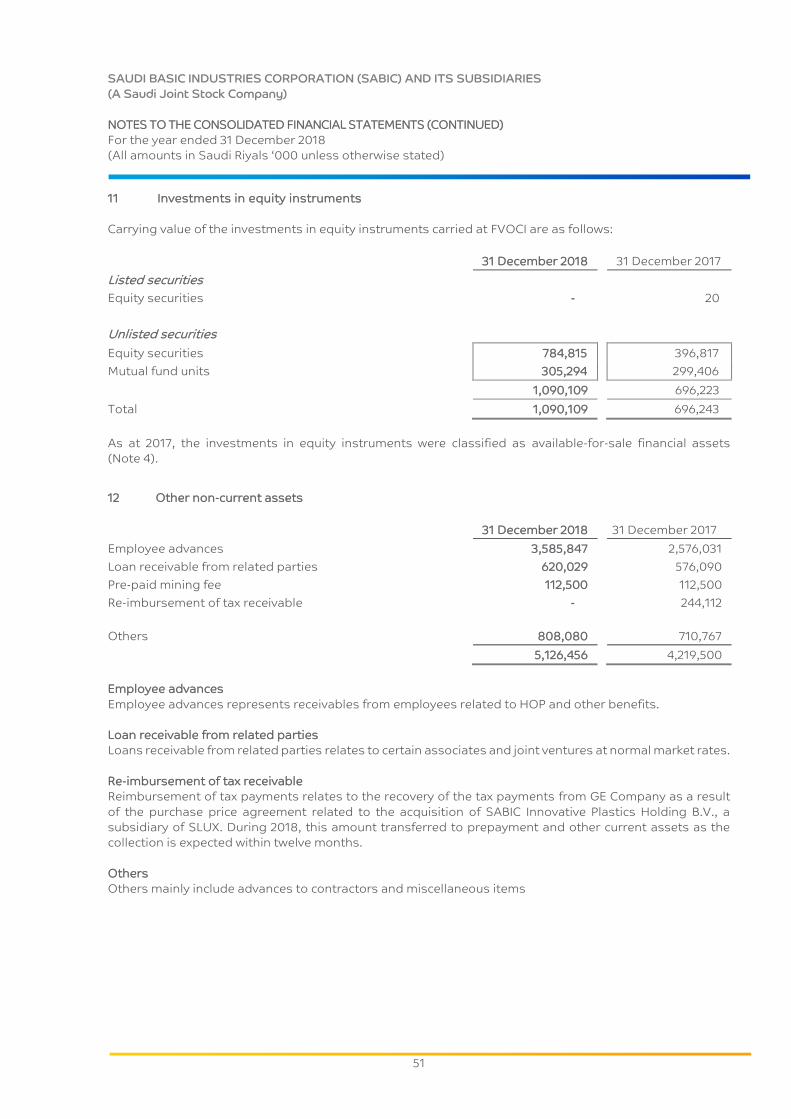
SAUDI BASIC INDUSTRIES CORPORATION (SABIC) AND ITS SUBSIDIARIES
(A Saudi Joint Stock Company)
NOTES TO THE CONSOLIDATED FINANCIAL STATEMENTS (CONTINUED)
For the year ended 31 December 2018
(All amounts in Saudi Riyals ‘000 unless otherwise stated)
51
11 Investments in equity instruments
Carrying value of the investments in equity instruments carried at FVOCI are as follows:
31 December 2018 31 December 2017
Listed securities
Equity securities - 20
Unlisted securities
Equity securities 784,815 396,817
Mutual fund units 305,294 299,406
1,090,109 696,223
Total 1,090,109 696,243
As at 2017, the investments in equity instruments were classified as available-for-sale financial assets
(Note 4).
12 Other non-current assets
31 December 2018 31 December 2017
Employee advances 3,585,847 2,576,031
Loan receivable from related parties 620,029 576,090
Pre-paid mining fee 112,500 112,500
Re-imbursement of tax receivable - 244,112
Others 808,080 710,767
5,126,456 4,219,500
Employee advances
Employee advances represents receivables from employees related to HOP and other benefits.
Loan receivable from related parties
Loans receivable from related parties relates to certain associates and joint ventures at normal market rates.
Re-imbursement of tax receivable
Reimbursement of tax payments relates to the recovery of the tax payments from GE Company as a result
of the purchase price agreement related to the acquisition of SABIC Innovative Plastics Holding B.V., a
subsidiary of SLUX. During 2018, this amount transferred to prepayment and other current assets as the
collection is expected within twelve months.
Others
Others mainly include advances to contractors and miscellaneous items

SAUDI BASIC INDUSTRIES CORPORATION (SABIC) AND ITS SUBSIDIARIES
(A Saudi Joint Stock Company)
NOTES TO THE CONSOLIDATED FINANCIAL STATEMENTS (CONTINUED)
For the year ended 31 December 2018
(All amounts in Saudi Riyals ‘000 unless otherwise stated)
52
13 Financial assets and financial liabilities
31 December 2018
Total
Financial assets
/ liabilities at
amortised cost
Financial assets
/ liabilities at
FVIS
Financial assets
at FVOCI Fair value (iii) Level I Level II Level III
Financial assets
Investments in debt instruments
- Fixed 1,240,615 1,240,615 - - 1,720,920 - 1,720,920 -
- Floating 1,828,475 1,441,498 386,977 - 1,692,752 - 1,692,752 -
Investments in equity instruments
- Unquoted 1,090,109 - - 1,090,109 1,090,109 - 305,294 784,815
Derivative financial assets 29,651 - 29,651 - 29,651 - 29,651 -
Trade receivables 21,821,849 21,821,849 - - N/A - -
Short-term investments
- Time deposits 9,240,289 9,240,289 - - N/A - -
Cash and bank balances - -
- Bank balances 13,152,820 13,152,820 - - N/A
- Time deposits 29,437,610 29,437,610 - - N/A - -
Other financial assets (ii) 1,780,085 1,780,085 - - N/A - -
Total 79,621,503 78,114,766 416,628 1,090,109 4,533,432 - 3,748,617 784,815
Financial liabilities
Debt 47,263,241 47,263,241 - - 45,715,403 - 45,715,403 -
Derivative financial liabilities 381 - 381 - 381 - 381 -
Trade payables 14,969,357 14,969,357 - - N/A - - -
Other financial liabilities (ii) 3,357,882 3,357,882 - - N/A - - -
Total 65,590,861 65,590,480 381 - 45,715,784 - 45,715,784 -

SAUDI BASIC INDUSTRIES CORPORATION (SABIC) AND ITS SUBSIDIARIES
(A Saudi Joint Stock Company)
NOTES TO THE CONSOLIDATED FINANCIAL STATEMENTS (CONTINUED)
For the year ended 31 December 2018
(All amounts in Saudi Riyals ‘000 unless otherwise stated)
53
13 Financial assets and financial liabilities (continued)
31 December 2017
Total
Loans and
advances/
liabilities at
amortised cost
Financial assets
/ liabilities at
FVIS
Available for
sale through
OCI Fair value (iii) Level I Level II Level III
Financial assets
Held-to-maturity investments 3,445,481 3,445,481 - - 3,856,110 - 3,856,110 -
Available for sale financial assets
- Quoted 20 - - 20 20 20 - -
- Unquoted (i) 696,223 - - 696,223 299,406 - 299,406 -
Derivative financial assets 26,806 - 26,806 - 26,806 - 26,806 -
Trade receivables 22,609,432 22,609,432 - - N/A - - -
Short-term investments 3,960,752 3,960,752 - - N/A - - -
Cash and bank balances 59,038,656 59,038,656 - - N/A - - -
Other financial assets (ii) 2,001,134 2,001,134 - - N/A - - -
Total 91,778,504 91,055,455 26,806 696,243 4,182,342 20 4,182,322 -
Financial liabilities
Debt 58,063,188 58,063,188 - - 56,939,299 - 56,939,299 -
Derivative financial liabilities 16,236 - 16,236 - 16,236 - 16,236 -
Trade payables 18,061,464 18,061,464 - - N/A - - -
Other financial liabilities (ii) 2,347,871 2,347,871 - - N/A - - -
Total 78,488,759 78,472,523 16,236 - 56,955,535 - 56,955,535 -
(i) Includes SR 396,817 thousand of investments in unquoted equity shares of companies operating within and outside KSA. The fair value of these equity shares cannot be measured
reliably since there is no active market available for these shares. SABIC intends to hold these investments for strategic purposes.
(ii) Other financial assets include lease receivables, loans to related parties and interest receivables, and other financial liabilities include dividend payable, payables to related parties
and interest payables.
(iii) The Group assessed that trade receivables, short-term investments, cash and bank balances, trade payables and other financial assets and liabilities approximate their carrying
amounts largely due to the short-term maturities of these instruments.

SAUDI BASIC INDUSTRIES CORPORATION (SABIC) AND ITS SUBSIDIARIES
(A Saudi Joint Stock Company)
NOTES TO THE CONSOLIDATED FINANCIAL STATEMENTS (CONTINUED)
For the year ended 31 December 2018
(All amounts in Saudi Riyals ‘000 unless otherwise stated)
54
13 Financial assets and financial liabilities (continued)
The Group's exposure to various risks associated with the financial instruments is discussed in Note 36. The
maximum exposure to credit risk at the end of the reporting year is the carrying amount of each class of
financial assets mentioned above.
There were no transfers between Level 1 and Level 2 during the year ended 31 December 2018 and the year
ended 31 December 2017.
The Group assessed that cash and short-term deposits, trade receivables, trade payables and other current
liabilities approximate their carrying amounts largely due to the short-term maturities of these instruments.
The following methods and assumptions were used to estimate the fair values:
Long-term fixed-rate and variable-rate receivables and borrowings are evaluated by the Group based
on parameters such as interest rates, specific country risk factors, and individual creditworthiness of the
customer and the risk characteristics of the financed project. Based on this evaluation, allowances are
taken into account for the expected losses of these receivables and borrowings. As at 31 December 2018
and 31 December 2017, the carrying amounts of such net receivables and borrowings, were not
materially different from their calculated fair values.
Fair value of the quoted bonds is based on price quotations at the reporting date. The fair value of
unquoted instruments, loans from banks and other financial liabilities, obligations under finance leases,
as well as other non-current financial liabilities is estimated by discounting future cash flows using rates
currently available for debt on similar terms, credit risk and remaining maturities.
The Group enters into derivative financial instruments with various counterparties, principally financial
institutions with investment grade credit ratings. Derivatives valued using valuation techniques with
market observable inputs are mainly interest rate swaps, foreign exchange forward contracts and
commodity forward contracts. The most frequently applied valuation techniques include forward pricing
and swap models, using present value calculations. The models incorporate various inputs including the
credit quality of counterparties, foreign exchange spot and forward rates, interest rate curves and
forward rate curves of the underlying commodity.
The valuation requires the Group to make certain assumptions about the model inputs, including
forecast cash flows, the discount rate, credit risk and volatility. The probabilities of the various estimates
within the range can be reasonably assessed and are used in the Group’s estimate of fair value for these
unquoted investments in equity instruments. Fair value of quoted investments in equity instruments at
FVOCI is derived from quoted prices in active markets.
Due to the adoption of IFRS 9, the measurement of the available-for-sale financial assets under IAS 39,
changed from cost to FVOCI (Note 4). Since the valuation performed using a significant non-observable
input, the fair value is classified as a level 3 measurement.
Description of valuation techniques used and key inputs to valuation investments in equity instruments
is as follows:
Valuation technique Significant unobservable input Range
Market approach Equity value to EBITDA multiple
Midpoint of Net Asset Value and Price to Book multiple
7.9 to 13.1
0.76
Net Asset Value
approach
Point estimate of distributable cash and bank balances SR 46.1 to
SR 49.9
Expected Returns
approach
Equity value to Revenue multiple 0.73

SAUDI BASIC INDUSTRIES CORPORATION (SABIC) AND ITS SUBSIDIARIES
(A Saudi Joint Stock Company)
NOTES TO THE CONSOLIDATED FINANCIAL STATEMENTS (CONTINUED)
For the year ended 31 December 2018
(All amounts in Saudi Riyals ‘000 unless otherwise stated)
55
14 Inventories
31 December 2018 31 December 2017
Finished goods 17,561,580 15,547,664
Raw materials 4,202,729 4,445,988
Spare parts 5,890,142 5,560,723
Goods in transit 2,260,171 2,163,711
Work in process 46,227 121,183
29,960,849 27,839,269
Less: Provision for slow moving and obsolete items (1,716,046) (1,776,274)
28,244,803 26,062,995
Movements in the provision for obsolete inventories were as follows:
For the year ended
31 December 2018
For the year ended
31 December 2017
Balance at 1 January 1,776,274 1,500,026
(Reversal) charge for the year (60,228) 276,248
Balance at 31 December 1,716,046 1,776,274
The Group’s exposure to commodity price risks is disclosed in Note 36.
15 Trade receivables
31 December 2018 31 December 2017
Trade receivables 19,111,571 19,838,279
Due from related parties 3,116,951 3,134,896
22,228,522 22,973,175
Less: allowance for expected credit losses (406,673) (363,743)
21,821,849 22,609,432
Accounts receivable are non-interest bearing and are generally on 30 – 120 days terms.
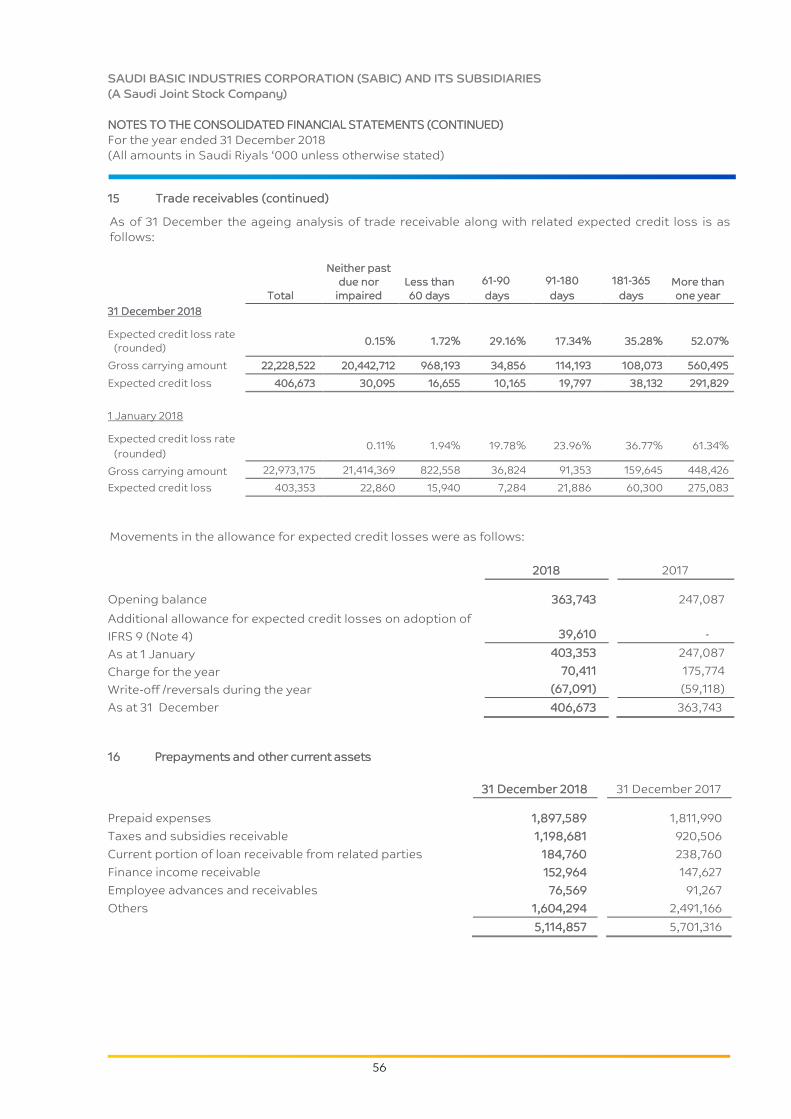
SAUDI BASIC INDUSTRIES CORPORATION (SABIC) AND ITS SUBSIDIARIES
(A Saudi Joint Stock Company)
NOTES TO THE CONSOLIDATED FINANCIAL STATEMENTS (CONTINUED)
For the year ended 31 December 2018
(All amounts in Saudi Riyals ‘000 unless otherwise stated)
56
15 Trade receivables (continued)
As of 31 December the ageing analysis of trade receivable along with related expected credit loss is as
follows:
Total
Neither past
due nor
impaired
Less than
60 days
61-90
days
91-180
days
181-365
days
More than
one year
31 December 2018
Expected credit loss rate
(rounded) 0.15% 1.72% 29.16% 17.34% 35.28% 52.07%
Gross carrying amount 22,228,522 20,442,712 968,193 34,856 114,193 108,073 560,495
Expected credit loss 406,673 30,095 16,655 10,165 19,797 38,132 291,829
1 January 2018
Expected credit loss rate
(rounded) 0.11% 1.94% 19.78% 23.96% 36.77% 61.34%
Gross carrying amount 22,973,175 21,414,369 822,558 36,824 91,353 159,645 448,426
Expected credit loss 403,353 22,860 15,940 7,284 21,886 60,300 275,083
Movements in the allowance for expected credit losses were as follows:
2018 2017
363,743 247,087
39,610 -
403,353 247,087
70,411 175,774
(67,091) (59,118)
406,673 363,743
31 December 2018 31 December 2017
1,897,589 1,811,990
1,198,681 920,506
184,760 238,760
152,964 147,627
76,569 91,267
Opening balance
Additional allowance for expected credit losses on adoption of IFRS 9 (Note 4)
As at 1 January
Charge for the year
Write-off /reversals during the year
As at 31 December
16 Prepayments and other current assets
Prepaid expenses
Taxes and subsidies receivable
Current portion of loan receivable from related parties
Finance income receivable
Employee advances and receivables
Others 1,604,294 2,491,166
5,114,857 5,701,316

SAUDI BASIC INDUSTRIES CORPORATION (SABIC) AND ITS SUBSIDIARIES
(A Saudi Joint Stock Company)
NOTES TO THE CONSOLIDATED FINANCIAL STATEMENTS (CONTINUED)
For the year ended 31 December 2018
(All amounts in Saudi Riyals ‘000 unless otherwise stated)
57
17 Short-term investments
31 December 2018 31 December 2017
Time deposits 9,240,289 3,960,752
Investments in debt instruments / held-to-maturity
investments (Note 10) 575,210
390,320
9,815,499 4,351,072
The time deposits with banks are of original maturities of more than three months and less than twelve
months and carry commission rates in line with the prevailing market rates.
18 Cash and bank balances
31 December 2018 31 December 2017
Cash in hand 390 413
Bank balances 13,152,820 14,566,314
Time deposits 29,437,610 44,471,929
42,590,820 59,038,656
The time deposits represent deposits with banks of original maturities of less than three months.
18.1 Cash flows related disclosures
Cash and cash equivalents:
31 December 2018 31 December 2017
Cash and bank balances 42,590,820 59,038,656
Less: bank overdrafts (1,167,589) (1,065,000)
Cash and cash equivalents at the end of the year 41,423,231 57,973,656
Reconciliation of liabilities arising financing activities
As at
1 January 2018
Charged during
the year Cash flows
Foreign currency
exchange and
other non-cash
As at
31 December
2018
Debt 57,198,175 - (10,693,815) 19,956 46,524,316
Finance lease payments 865,013 61,025 (187,113) - 738,925
Dividends payable to
shareholders 1,633,220 13,200,000 (12,059,538) - 2,773,682
Dividends paid to non-
controlling interests - 8,629,709 (8,736,246) 106,537 -
Total financing activities 59,696,408 21,890,734 (31,676,712) 126,493 50,036,923

SAUDI BASIC INDUSTRIES CORPORATION (SABIC) AND ITS SUBSIDIARIES
(A Saudi Joint Stock Company)
NOTES TO THE CONSOLIDATED FINANCIAL STATEMENTS (CONTINUED)
For the year ended 31 December 2018
(All amounts in Saudi Riyals ‘000 unless otherwise stated)
58
18 Cash and bank balances (continued)
18.1 Cash flows related disclosures (continued)
Reconciliation of liabilities arising financing activities (continued)
Bank balances earn interest at fixed and floating rates based on daily bank deposit rates. Short-term
deposits are made for varying periods of between one day and three months, depending on the immediate
cash requirements of the Group, and earn interest or profit at the respective short-term deposit rates.
At 31 December 2018, the Group had available SR 10.06 billion (31 December 2017: SR 7.1 billion) of undrawn
committed borrowing facilities.
The table below provides details of amounts placed in various currencies:
31 December 2018 31 December 2017
SR 15,700,877 30,398,916
USD 25,304,981 25,342,450
Others 1,584,962 3,297,290
42,590,820 59,038,656
19 Share capital
31 December 2018 31 December 2017
Authorised shares
Ordinary shares of SR 10 each 3,000,000 3,000,000
Ordinary shares issued and fully paid of SR 10 each 3,000,000 3,000,000
Issued and paid capital (SR ‘000) 30,000,000 30,000,000
As at
1 January 2017
Charged during
the year Cash flows
Foreign currency
exchange and
other non-cash
As at
31 December
2017
Debt 62,254,380 - (5,612,441) 556,236 57,198,175
Finance lease payments 855,369 63,320 (53,676) - 865,013
Dividends payable to
shareholders 1,225,636 12,000,000 (11,592,416) - 1,633,220
Dividends paid to non-
controlling interests - 5,390,185 (5,390,185) - -
Acquisition of non-
controlling interests - 3,075,000 (3,075,000) - -
Total financing activities 64,335,385 20,528,505 (25,723,718) 556,236 59,696,408

SAUDI BASIC INDUSTRIES CORPORATION (SABIC) AND ITS SUBSIDIARIES
(A Saudi Joint Stock Company)
NOTES TO THE CONSOLIDATED FINANCIAL STATEMENTS (CONTINUED)
For the year ended 31 December 2018
(All amounts in Saudi Riyals ‘000 unless otherwise stated)
59
20 Reserves
Statutory reserve
In accordance with Saudi Arabian Regulations for Companies, SABIC must set aside 10% of net income in
each year until it has built up a reserve equal to 30% of the share capital. As the reserve has reached the
minimum amount, SABIC has resolved to discontinue such transfers. The reserve is not available for
distribution.
General reserve
In accordance with SABIC’s By-Laws, the General Assembly can establish general reserve as an
appropriation of retained earnings. The general reserve can be increased or decreased by a resolution of
the shareholders and is available for distribution.
Other reserves
The following table shows a breakdown of ‘other reserves’ and the movements during the year:
31 December 2018
Equity
instruments
and others
at FVOCI
Foreign
currency
translation
Actuarial
gain/loss
Cash
flow
hedge Total
At the beginning of the year 28,956 (1,430,422) (792,486) (55,711) (2,249,663)
Adoption of IFRS 9 (Note 4) 389,300 (275) - - 389,025
At 1 January 2018 418,256 (1,430,697) (792,486) (55,711) (1,860,638)
Net change on currency translation of
foreign operations - (1,301,215) - - (1,301,215)
Re-measurement impact of employee
benefit obligations - - 1,744,012 - 1,744,012
Re-measurement impact of
investments in equity instrument at
FVOCI 4,880 - - - 4,880
Share of other comprehensive income
for associates and joint ventures - 31,996 1,596 20,185 53,777
Other comprehensive income for the
year 4,880 (1,269,219) 1,745,608 20,185 501,454
At the end of the year 423,136 (2,699,916) 953,122 (35,526) (1,359,184)

SAUDI BASIC INDUSTRIES CORPORATION (SABIC) AND ITS SUBSIDIARIES
(A Saudi Joint Stock Company)
NOTES TO THE CONSOLIDATED FINANCIAL STATEMENTS (CONTINUED)
For the year ended 31 December 2018
(All amounts in Saudi Riyals ‘000 unless otherwise stated)
60
20 Reserves (continued)
31 December 2017
Available-
for-sale
financial
assets
Foreign
currency
translation
Actuarial
gain/loss
Cash flow
hedge Total
At the beginning of the year 38,979 (4,213,936) (1,024,146) (108,880) (5,307,983)
Net change on currency translation of
foreign operations - 3,021,606 - - 3,021,606
Re-measurement impact of employee
benefit obligations - - 231,660 - 231,660
Re-measurement impact of
investments in equity instrument at
FVOCI (10,023) - - - (10,023)
Share of other comprehensive income
for associates and joint ventures - (238,092) - 53,169 (184,923)
Other comprehensive income for the
year (10,023) 2,783,514 231,660 53,169 3,058,320
At the end of the year 28,956 (1,430,422) (792,486) (55,711) (2,249,663)
Re-measurement impact of employee benefit obligations include a net (tax) benefit amounting to SR 0.01
billion (2017 SR: 0.06 billion).
21 Non-controlling interests
Non-controlling interests in the group companies are included in the consolidated statement of financial
position as part of equity. Non-controlling interests in the net results of subsidiaries are disclosed separately
in the consolidated statement of income.
21.1 Acquisition of non-controlling interests
On 22 January 2017 (the “Value Date”), SABIC and Shell Chemicals Arabia LLC (“Shell”), SABIC’s partner in
Saudi Petrochemical Company (“Sadaf”), entered into an agreement pursuant to which SABIC agreed to
purchase Shell’s entire stake in Sadaf for SR 3.075 billion (the “Transaction”), thereby increasing SABIC’s
ownership interest in Sadaf from 50% to 100%. SABIC and Shell completed the Transaction on 16 August
2017.
Due to no change in control, the acquisition of Shell’s ownership interest in Sadaf is accounted for as an
equity transaction. Consequently, the excess consideration paid over the carrying value of Shell’s ownership
interest in Sadaf is recognised in retained earnings.
As agreed between SABIC and Shell, Shell’s share of Sadaf’s operating results related to the financial year
ended 31 December 2017 has been reallocated to SABIC.
The carrying value of the net assets of Sadaf as of the Value Date was SR 2.34 billion. The details of additional
interest acquired in Sadaf are:
For the year ended
31 December 2017
Cash consideration paid to non-controlling interest partner (USD 0.82 billion) (3,075,000)
Carrying value of the additional interest in Sadaf 2,335,205
Difference recognised in retained earnings (739,795)

SAUDI BASIC INDUSTRIES CORPORATION (SABIC) AND ITS SUBSIDIARIES
(A Saudi Joint Stock Company)
NOTES TO THE CONSOLIDATED FINANCIAL STATEMENTS (CONTINUED)
For the year ended 31 December 2018
(All amounts in Saudi Riyals ‘000 unless otherwise stated)
61
21 Non-controlling interests (continued)
21.2 Absorption of loss on behalf of non-controlling interests
During the year ended 31 December 2017, the Board of Directors of SABIC, in order to support and continue
the operation of Arabian Industrial Fibers Company (“Ibn Rushd”), a subsidiary, on a going concern basis,
and to ensure compliance with the regulatory obligations under the Companies Regulations, resolved and
recommended the following:
• Convert SR 4.58 billion representing the value of dues owed by the subsidiary to SABIC at 1 April 2017,
as an “additional non-cash investment” to reduce the subsidiary’s accumulated losses without affecting
the subsidiary’s existing number of shares and shareholding rights
• Reduce the subsidiary’s share capital by SR 6.51 billion, to absorb further accumulated losses of the
subsidiary, without affecting the subsidiary’s shareholding proportion
• Convert the subsidiary’s legal entity structure from closed Joint Stock Company (“JSC”) to Limited
Liability Company (“LLC”)
In accordance with the outcome of Ibn Rushd’s Extra Ordinary General Assembly, held on 31 December 2017,
with respect to the capital restructuring and the conversion of the legal entity structure, these
recommendations/resolutions were put into effect on 31 December 2017. As no change of control has
occurred, the above have been accounted for as an equity transaction, in accordance with IFRS 10 –
‘Consolidated Financial Statement’ provisions. This resulted in a SR 2.36 billion reduction of retained
earnings attributable to the equity holders of the Parent, with an offset to non-controlling interests.

SAUDI BASIC INDUSTRIES CORPORATION (SABIC) AND ITS SUBSIDIARIES
(A Saudi Joint Stock Company)
NOTES TO THE CONSOLIDATED FINANCIAL STATEMENTS (CONTINUED)
For the year ended 31 December 2018
(All amounts in Saudi Riyals ‘000 unless otherwise stated)
62
21 Non-controlling interests (continued)
Summarised statement of financial position
Set out below is summarised financial information for each subsidiary that has non-controlling interest that are material to the Group. The amounts disclosed for each
subsidiary are before inter-company eliminations:
As at 31 December 2018
YANSAB AR RAZI YANPET SHARQ KEMYA IBN RUSHD SAFCO KAYAN
Current assets 6,227,525 3,428,862 5,941,261 8,044,262 3,690,629 2,165,665 2,249,981 9,173,922
Current liabilities 1,343,865 2,938,323 2,494,188 1,560,340 2,138,286 984,443 855,264 3,295,944
Current net assets 4,883,660 490,539 3,447,073 6,483,922 1,552,343 1,181,222 1,394,717 5,877,978
Non-current assets 12,844,534 2,818,632 4,415,143 13,867,515 13,129,797 4,074,091 7,254,486 31,521,004
Non-current liabilities 472,499 775,785 847,336 2,439,668 4,701,917 3,752,541 743,154 21,700,622
Non-current net assets 12,372,035 2,042,847 3,567,807 11,427,847 8,427,880 321,550 6,511,332 9,820,382
Net assets 17,255,695 2,533,386 7,014,880 17,911,769 9,980,223 1,502,772 7,906,049 15,698,360
Accumulated non-controlling interests (i) 8,143,373 1,109,028 3,392,926 8,596,724 4,852,558 712,967 4,183,245 9,620,400
(i) Accumulated non-controlling interests includes adjustments such as inter-group profit elimination, absorption of income tax in non-controlling interests and
others.

SAUDI BASIC INDUSTRIES CORPORATION (SABIC) AND ITS SUBSIDIARIES
(A Saudi Joint Stock Company)
NOTES TO THE CONSOLIDATED FINANCIAL STATEMENTS (CONTINUED)
For the year ended 31 December 2018
(All amounts in Saudi Riyals ‘000 unless otherwise stated)
63
21 Non-controlling interests (continued)
Summarised statement of financial position (continued)
As at 31 December 2017
YANSAB AR RAZI YANPET SHARQ KEMYA IBN RUSHD SAFCO KAYAN
Current assets 6,582,991 1,668,841 4,795,571 8,867,168 4,439,751 2,050,745 1,192,281 6,811,410
Current liabilities 2,323,147 583,217 1,899,696 1,647,884 2,969,987 1,046,139 785,304 3,350,402
Current net assets 4,259,844 1,085,624 2,895,875 7,219,284 1,469,764 1,004,606 406,977 3,461,008
Non-current assets 13,181,539 2,832,730 4,418,245 14,656,409 13,611,878 4,356,819 7,154,587 33,499,880
Non-current liabilities 703,953 854,018 983,466 2,716,243 5,798,158 4,016,225 700,939 23,052,842
Non-current net assets 12,477,586 1,978,712 3,434,779 11,940,166 7,813,720 340,594 6,453,648 10,447,038
Net assets 16,737,430 3,064,336 6,330,654 19,159,450 9,283,484 1,345,200 6,860,625 13,908,046
Accumulated non-controlling interests (i) 7,898,003 1,393,102 3,027,742 9,003,506 4,419,052 631,311 3,645,208 8,555,340
(i) Accumulated non-controlling interests includes adjustments such as inter-group profit elimination, absorption of income tax in non-controlling interests and others.

SAUDI BASIC INDUSTRIES CORPORATION (SABIC) AND ITS SUBSIDIARIES
(A Saudi Joint Stock Company)
NOTES TO THE CONSOLIDATED FINANCIAL STATEMENTS (CONTINUED)
For the year ended 31 December 2018
(All amounts in Saudi Riyals ‘000 unless otherwise stated)
64
21 Non-controlling interests (continued)
Summarised statement of comprehensive income
For the year ended 31 December 2018
YANSAB AR RAZI YANPET SHARQ KEMYA IBN RUSHD SAFCO KAYAN
Revenue 7,628,470 5,249,864 7,859,468 11,383,526 8,766,320 6,302,650 3,859,836 12,263,159
Net income for the year 2,413,978 3,045,453 2,944,221 2,859,182 1,965,479 130,862 1,738,438 1,702,248
Other comprehensive
income 73,037 55,640 124,006 93,484 67,696 53,508 140,320 88,645
Total comprehensive income 2,487,015 3,101,093 3,068,227 2,952,666 2,033,175 184,370 1,878,758 1,790,893 Net income attributable to
non-controlling interests 1,156,336 1,360,836 1,304,256 1,406,008 946,798 67,784 874,950 1,007,816 Dividends to non-controlling
interests 946,063 1,938,503 1,424,437 2,131,029 696,144 - 475,083 -
For the year ended 31 December 2017
Revenue 7,220,906 3,631,472 7,510,101 10,066,000 7,910,236 5,704,262 2,759,455 9,983,926
Net income for the year 2,376,365 1,778,390 2,993,537 2,735,429 1,604,213 (608,807) 878,628 668,174
Other comprehensive
income (6,978) (1,699) 7,378 (5,814) (2,219) 1,088 44,113 (11,473)
Total comprehensive income 2,369,387 1,776,691 3,000,915 2,729,615 1,601,994 (607,719) 922,741 656,701
Net income attributable to
non-controlling interests 996,942 787,865 1,496,174 1,150,915 856,623 (316,182) 429,438 352,992
Dividends to non-controlling
interests 793,083 1,080,100 1,996,505 814,688 540,229 - 415,698 -
Net income (loss) attributable to non-controlling interests includes adjustments such as inter-group profit elimination, absorption of income tax in non-controlling
interests and others.

SAUDI BASIC INDUSTRIES CORPORATION (SABIC) AND ITS SUBSIDIARIES
(A Saudi Joint Stock Company)
NOTES TO THE CONSOLIDATED FINANCIAL STATEMENTS (CONTINUED)
For the year ended 31 December 2018
(All amounts in Saudi Riyals ‘000 unless otherwise stated)
65
21 Non-controlling interests (continued)
Summarised statement of cash flows
Year ended 31 December 2018
YANSAB AR RAZI YANPET SHARQ KEMYA IBN RUSHD SAFCO KAYAN
Cash flow from operating
activities 3,928,161 3,202,785 2,881,894 3,966,259 2,553,916 526,637 2,083,578 3,432,919
Cash flow from investing
activities (1,857,714) (294,522) (547,071) (408,623) (310,722) (86) (802,588) (2,115,782)
Cash flow from financing
activities (3,096,501) (1,558,860) (1,711,058) (4,341,786) (2,935,188) (210,573) (833,080) (1,454,539)
Net increase / (decrease) in
cash and cash equivalents (1,026,054) 1,349,403 623,765 (784,150) (691,994) 315,978 447,910 (137,402)
Year ended 31 December 2017
Cash flow from operating
activities 3,235,901 2,110,365 3,900,893 3,325,029 2,051,289 432,166 1,395,787 3,592,324
Cash flow from investing
activities (716,755) (303,434) (314,653) (425,839) (863,816) (291,734) (703,277) (905,316)
Cash flow from financing
activities (3,143,125) (1,873,585) (3,777,386) (1,779,483) (1,604,184) (160,972) (732,898) (1,560,010)
Net increase / (decrease) in
cash and cash equivalents (623,979) (66,654) (191,146) 1,119,707 (416,711) (20,540) (40,388) 1,126,998
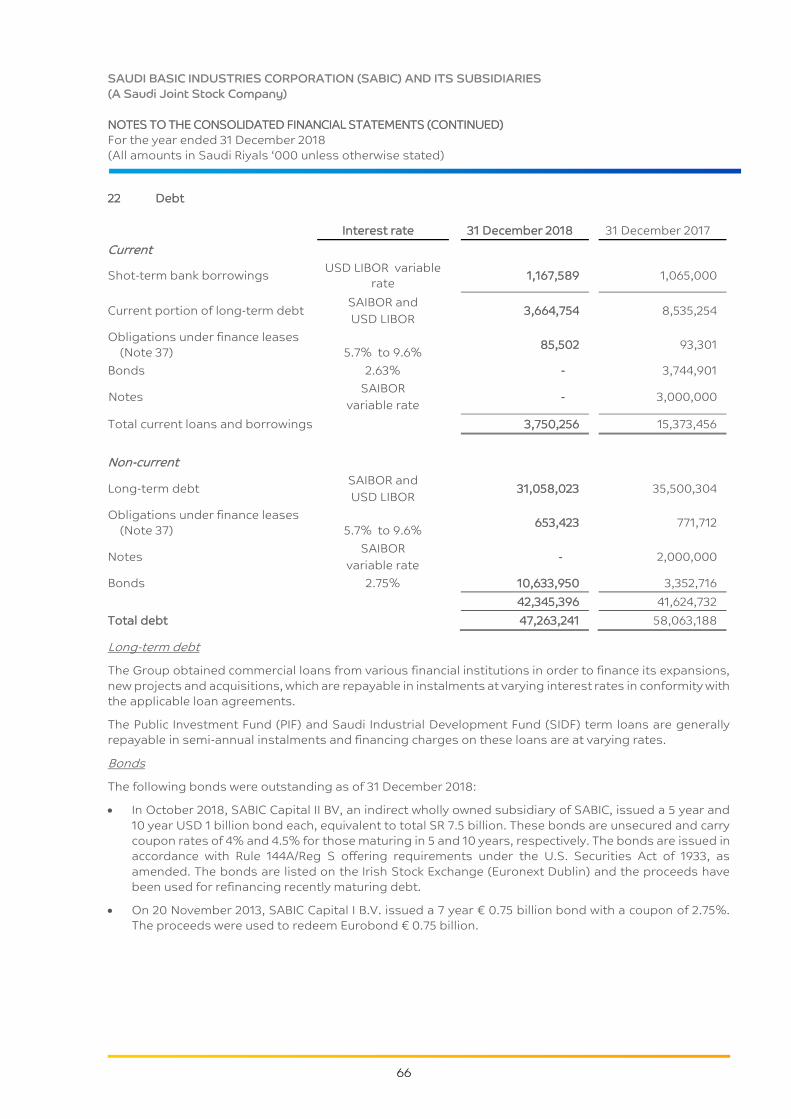
SAUDI BASIC INDUSTRIES CORPORATION (SABIC) AND ITS SUBSIDIARIES
(A Saudi Joint Stock Company)
NOTES TO THE CONSOLIDATED FINANCIAL STATEMENTS (CONTINUED)
For the year ended 31 December 2018
(All amounts in Saudi Riyals ‘000 unless otherwise stated)
66
22 Debt
Interest rate 31 December 2018 31 December 2017
Current
Shot-term bank borrowings USD LIBOR variable
rate 1,167,589 1,065,000
Current portion of long-term debt SAIBOR and
USD LIBOR 3,664,754 8,535,254
Obligations under finance leases
(Note 37) 5.7% to 9.6% 85,502 93,301
Bonds 2.63% - 3,744,901
Notes SAIBOR
variable rate - 3,000,000
Total current loans and borrowings 3,750,256 15,373,456
Non-current
Long-term debt SAIBOR and
USD LIBOR 31,058,023 35,500,304
Obligations under finance leases
(Note 37) 5.7% to 9.6% 653,423 771,712
Notes SAIBOR
variable rate - 2,000,000
Bonds 2.75% 10,633,950 3,352,716
42,345,396 41,624,732
Total debt 47,263,241 58,063,188
Long-term debt
The Group obtained commercial loans from various financial institutions in order to finance its expansions,
new projects and acquisitions, which are repayable in instalments at varying interest rates in conformity with
the applicable loan agreements.
The Public Investment Fund (PIF) and Saudi Industrial Development Fund (SIDF) term loans are generally
repayable in semi-annual instalments and financing charges on these loans are at varying rates.
Bonds
The following bonds were outstanding as of 31 December 2018:
In October 2018, SABIC Capital II BV, an indirect wholly owned subsidiary of SABIC, issued a 5 year and
10 year USD 1 billion bond each, equivalent to total SR 7.5 billion. These bonds are unsecured and carry
coupon rates of 4% and 4.5% for those maturing in 5 and 10 years, respectively. The bonds are issued in
accordance with Rule 144A/Reg S offering requirements under the U.S. Securities Act of 1933, as
amended. The bonds are listed on the Irish Stock Exchange (Euronext Dublin) and the proceeds have
been used for refinancing recently maturing debt.
On 20 November 2013, SABIC Capital I B.V. issued a 7 year € 0.75 billion bond with a coupon of 2.75%.
The proceeds were used to redeem Eurobond € 0.75 billion.
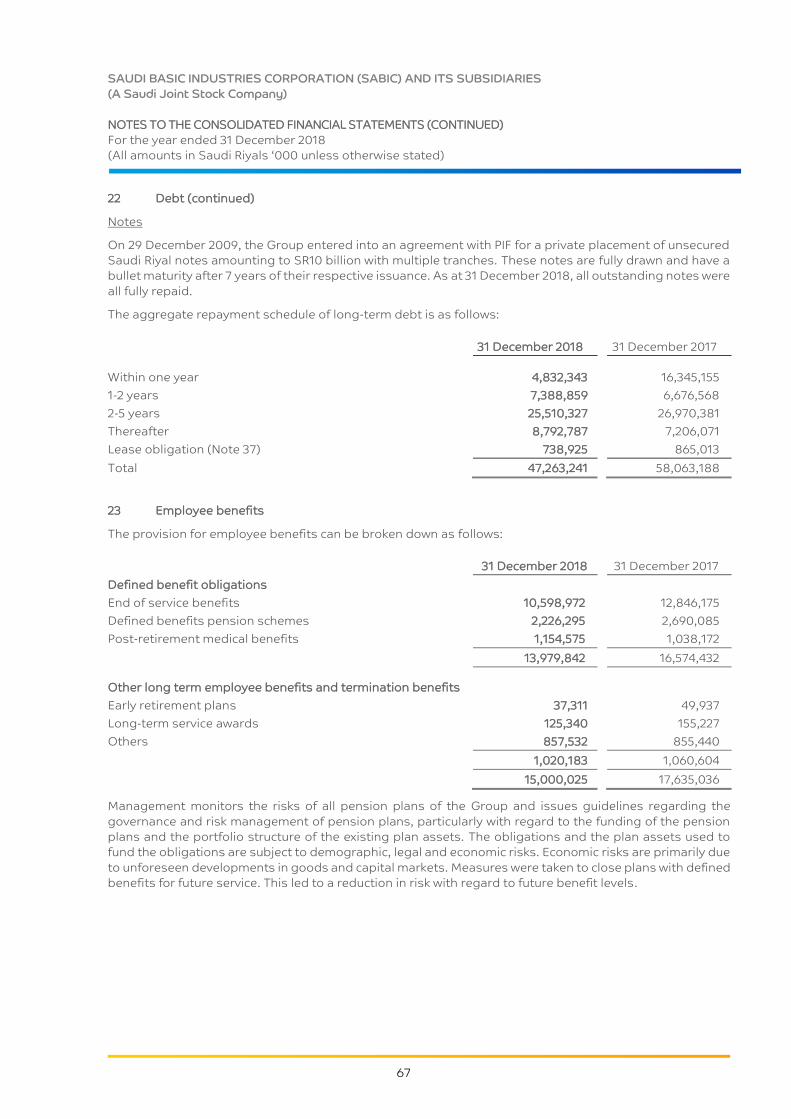
SAUDI BASIC INDUSTRIES CORPORATION (SABIC) AND ITS SUBSIDIARIES
(A Saudi Joint Stock Company)
NOTES TO THE CONSOLIDATED FINANCIAL STATEMENTS (CONTINUED)
For the year ended 31 December 2018
(All amounts in Saudi Riyals ‘000 unless otherwise stated)
67
22 Debt (continued)
Notes
On 29 December 2009, the Group entered into an agreement with PIF for a private placement of unsecured
Saudi Riyal notes amounting to SR10 billion with multiple tranches. These notes are fully drawn and have a
bullet maturity after 7 years of their respective issuance. As at 31 December 2018, all outstanding notes were
all fully repaid.
The aggregate repayment schedule of long-term debt is as follows:
31 December 2018 31 December 2017 Within one year 4,832,343 16,345,155
1-2 years 7,388,859 6,676,568 2-5 years 25,510,327 26,970,381 Thereafter 8,792,787 7,206,071 Lease obligation (Note 37) 738,925 865,013
Total 47,263,241 58,063,188
23 Employee benefits
The provision for employee benefits can be broken down as follows:
31 December 2018 31 December 2017
Defined benefit obligations
End of service benefits 10,598,972 12,846,175
Defined benefits pension schemes 2,226,295 2,690,085
Post-retirement medical benefits 1,154,575 1,038,172
13,979,842 16,574,432
Other long term employee benefits and termination benefits
Early retirement plans 37,311 49,937
Long-term service awards 125,340 155,227
Others 857,532 855,440
1,020,183 1,060,604
15,000,025 17,635,036
Management monitors the risks of all pension plans of the Group and issues guidelines regarding the
governance and risk management of pension plans, particularly with regard to the funding of the pension
plans and the portfolio structure of the existing plan assets. The obligations and the plan assets used to
fund the obligations are subject to demographic, legal and economic risks. Economic risks are primarily due
to unforeseen developments in goods and capital markets. Measures were taken to close plans with defined
benefits for future service. This led to a reduction in risk with regard to future benefit levels.

SAUDI BASIC INDUSTRIES CORPORATION (SABIC) AND ITS SUBSIDIARIES
(A Saudi Joint Stock Company)
NOTES TO THE CONSOLIDATED FINANCIAL STATEMENTS (CONTINUED)
For the year ended 31 December 2018
(All amounts in Saudi Riyals ‘000 unless otherwise stated)
68
23 Employee benefits (continued)
Defined benefits obligation
The Group provides end of service and pension benefits to its employees taking into consideration the local
labour laws, employment market and tax laws of the countries where the companies are located. Outside
KSA, the Group limits the risks of changing financial market conditions and demographic developments by
offering defined contribution pensions to new-hires in most countries. As in recent years, when many of the
defined benefit plans have been closed to future benefit accrual, the US and Canadian plan will be closed for
future pension accrual from 31 December 2019.
End of service benefits
End of service benefits are mandatory for all KSA based employees under the Saudi Arabian labour law and
the Group’s employment policies. End of service benefit is based on employees’ compensation and
accumulated period of service and is payable upon termination, resignation or retirement. The Defined
Benefit Obligation (“DBO”) in respect of employees’ end of service benefits is calculated by estimating the
future benefit payment that employees have earned in return for their service. This amount using an
appropriate discount rate to determine the present value of the Group’s obligation. This is an unfunded plan.
Re-measurements are recognised immediately in the consolidated statement of financial position with a
corresponding debit or credit to retained earnings through OCI in the period in which they occur. Re-
measurements are not reclassified to consolidated statement of income in subsequent periods.
Defined benefit pension plans
The Group has a number of defined benefit pension plans outside KSA. The most significant plans are
located in the United States of America (“USA”) and in the United Kingdom (“UK”). These plans are funded
pension plans. Other pension plans include plans in Germany, Austria, Japan, Taiwan, Canada, France and
Belgium, most of which are funded. The benefits provided by these pension plans are based primarily on
years of service and employees’ compensation.
The funding of the plans is consistent with local requirements in the countries of establishment. Generally,
pension obligations are subject to a government regulation, including minimum funding requirements in
many countries. Furthermore, there are restrictions in qualitative and quantitative terms for the investment
in different asset categories. This could result in fluctuating employer contributions, financing requirements
and the assumption of obligations in favour of the pension fund to comply with the regulatory requirements.
Below is a brief description of the Group’s main defined benefit pension plans:
United States of America
In the USA, the Group offers a defined benefit pension plan. This plan is subject to the applicable provisions
of the Employee Retirement Income Security Act of 1974, as amended (“ERISA”). The funding policy for the
US Plans is to make regular contributions each year in such amounts that are necessary to meet or exceed
the minimum funding standard as set forth in employee benefit and tax laws in USA. As of 1 January 2014,
the US Plan was closed for new participants. Employees who were already participants in the US plan as of
31 December 2013 continue to accrue benefits until 31 December 2019. As per 1 January 2020, the plan will
be frozen and employee will participate in alternative defined contribution arrangements. The primary
contributors to the total change in liabilities was a one-off adjustment linked to the decision to freeze future
accruals. The gain is recognized as part service cost.

SAUDI BASIC INDUSTRIES CORPORATION (SABIC) AND ITS SUBSIDIARIES
(A Saudi Joint Stock Company)
NOTES TO THE CONSOLIDATED FINANCIAL STATEMENTS (CONTINUED)
For the year ended 31 December 2018
(All amounts in Saudi Riyals ‘000 unless otherwise stated)
69
23 Employee benefits (continued)
Defined benefits obligation (continued)
Defined benefit pension plans (continued)
These defined benefit pension plans are administered by fiduciaries, who represents the interests of the
beneficiaries and ensure that the benefits can be paid in the future.
United Kingdom
Group companies maintain final salary pension plans in UK which have been closed to further increases in
benefits for future years of service. A part of the workforce still receives benefit increases linked to salary
increases. Since the closure of service accrual, all employees have had the opportunity to participate in a
defined contribution plan.
The defined benefit pension plans are administered by trusts, whose Boards of Trustees, according to the
trustees’ agreement and law, represents the interests of the beneficiaries and ensures that the benefits can
be paid in the future. The required funding is determined using technical valuations according to local
regulations every three years. Pensions are adjusted each year to compensate for increases in the cost of
living.
Other long-term employee benefits
Early retirement plans
Employee early retirement plan costs are provided for in accordance with the Group’s policies. If an
instalment based compensation is agreed on, the obligation is initially discounted to its present value and
then unwound through the period of compensation which can be up to the regular retirement age of the
employee.
Long-term service awards
The Group offers a long-term service award depending on years of service. This is measured similarly to a
DBO, however, any re-measurement is recognised in the current year consolidated statement of income.
The following table represents the movement of the net pension position:
For the year
ended 31
December 2018
For the year
ended 31
December 2017
At the beginning of the year 16,551,957 15,596,799
Current service cost 1,489,315 1,290,975
Past service cost (283,821) 44,175
Finance cost, net of finance income 557,467 581,024
Actuarial changes arising due to:
- financial assumptions (1,863,573) (21,966)
- demographic changes (101,639) (37,125)
- experience adjustments (404,933) 95,005
- actual return on plan assets 222,252 (249,147)
(2,147,893) (213,233)
Payments during the year (1,980,715) (627,038)
Contributions into pension plans (308,526) (313,995)
Foreign currency translation adjustment and others 72,551 193,250
13,950,335 16,551,957
Reclassification as net pension asset 29,507 22,475
At the end of the year 13,979,842 16,574,432
For net pension, assets are presented under non-current assets.
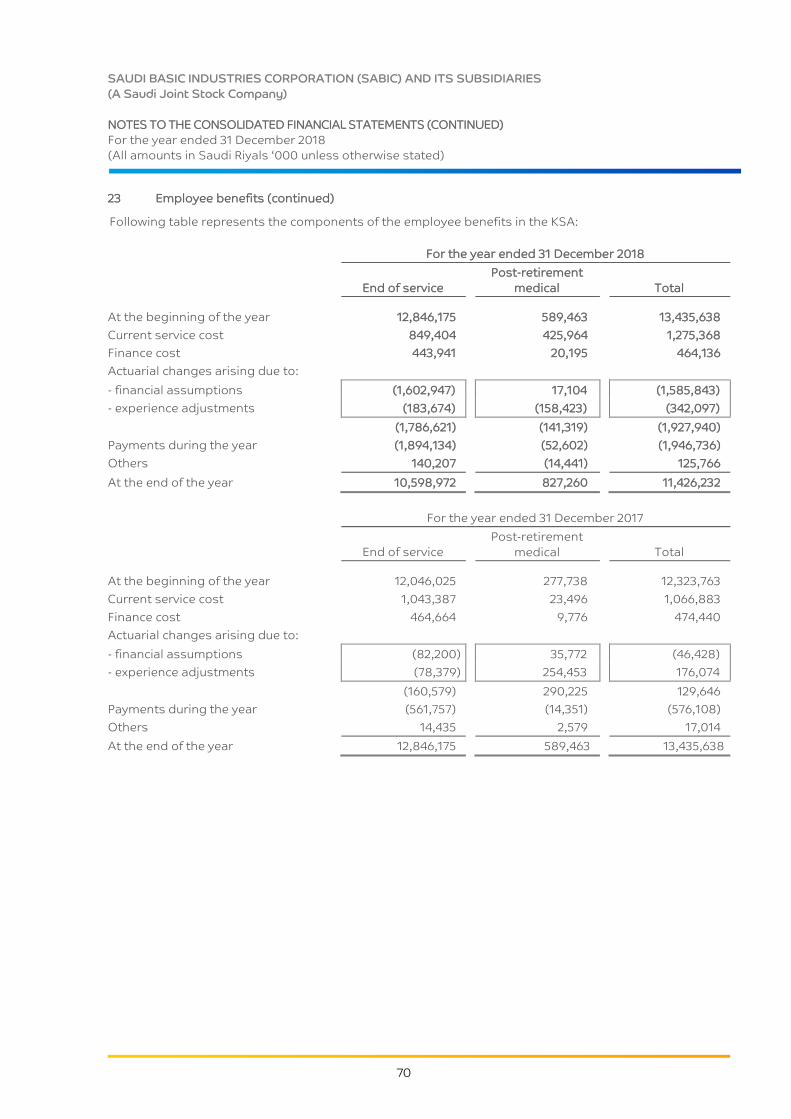
SAUDI BASIC INDUSTRIES CORPORATION (SABIC) AND ITS SUBSIDIARIES
(A Saudi Joint Stock Company)
NOTES TO THE CONSOLIDATED FINANCIAL STATEMENTS (CONTINUED)
For the year ended 31 December 2018
(All amounts in Saudi Riyals ‘000 unless otherwise stated)
70
23 Employee benefits (continued)
Following table represents the components of the employee benefits in the KSA:
For the year ended 31 December 2018
End of service
Post-retirement
medical Total
At the beginning of the year 12,846,175 589,463 13,435,638
Current service cost 849,404 425,964 1,275,368
Finance cost 443,941 20,195 464,136
Actuarial changes arising due to:
- financial assumptions (1,602,947) 17,104 (1,585,843)
- experience adjustments (183,674) (158,423) (342,097)
(1,786,621) (141,319) (1,927,940)
Payments during the year (1,894,134) (52,602) (1,946,736)
Others 140,207 (14,441) 125,766
At the end of the year 10,598,972 827,260 11,426,232
For the year ended 31 December 2017
End of service
Post-retirement
medical Total
At the beginning of the year 12,046,025 277,738 12,323,763
Current service cost 1,043,387 23,496 1,066,883
Finance cost 464,664 9,776 474,440
Actuarial changes arising due to:
- financial assumptions (82,200) 35,772 (46,428)
- experience adjustments (78,379) 254,453 176,074
(160,579) 290,225 129,646
Payments during the year (561,757) (14,351) (576,108)
Others 14,435 2,579 17,014
At the end of the year 12,846,175 589,463 13,435,638

SAUDI BASIC INDUSTRIES CORPORATION (SABIC) AND ITS SUBSIDIARIES
(A Saudi Joint Stock Company)
NOTES TO THE CONSOLIDATED FINANCIAL STATEMENTS (CONTINUED)
For the year ended 31 December 2018
(All amounts in Saudi Riyals ‘000 unless otherwise stated)
71
23 Employee benefits (continued)
Following table represents the components of the DBO outside KSA at 31 December 2018:
For the year ended 31 December 2018
USA UK Others Total
At the beginning of the year 3,227,844 2,850,210 946,352 7,024,406
Current service costs 191,740 - 22,207 213,947
Past service costs (275,757) 716 (8,780) (283,821)
Finance costs 116,607 73,036 21,942 211,585
Benefits paid (168,006) (149,753) (30,092) (347,851)
Actuarial changes arising due to:
- financial assumptions (247,148) (14,921) (15,661) (277,730)
- demographic changes (10,559) (87,670) (3,410) (101,639)
- experience adjustments (67,629) 6,324 (1,531) (62,836)
(325,336) (96,267) (20,602) (442,205)
Foreign currency - (161,838) (49,087) (210,925)
2,767,092 2,516,104 881,940 6,165,136
Reclassification as net pension asset - - (198,271) (198,271)
At the end of the year 2,767,092 2,516,104 683,669 5,966,865
The development of plan assets for major plans in the different regions is elaborated in the next table:
For the year ended 31 December 2018
USA UK Others Total
Plan assets as at start of the year 1,463,419 2,165,539 279,129 3,908,087
Interest income 53,377 55,425 9,452 118,254
Employers’ contribution 262,013 39,069 7,444 308,526
Return on plan assets (excluding
interest income) (136,807) (75,375) (10,070) (222,252)
Benefits paid (149,621) (149,755) (14,496) (313,872)
Administrative expenses (13,516) - (510) (14,026)
Foreign currency - (123,030) (20,654) (143,684)
Plan assets as at end of the year 1,478,865 1,911,873 250,295 3,641,033
Reclassification as net pension assets - - (227,778) (227,778)
Plan assets at end of the year 1,478,865 1,911,873 22,517 3,413,255
Defined benefit obligation, net 1,288,227 604,231 661,152 2,553,610
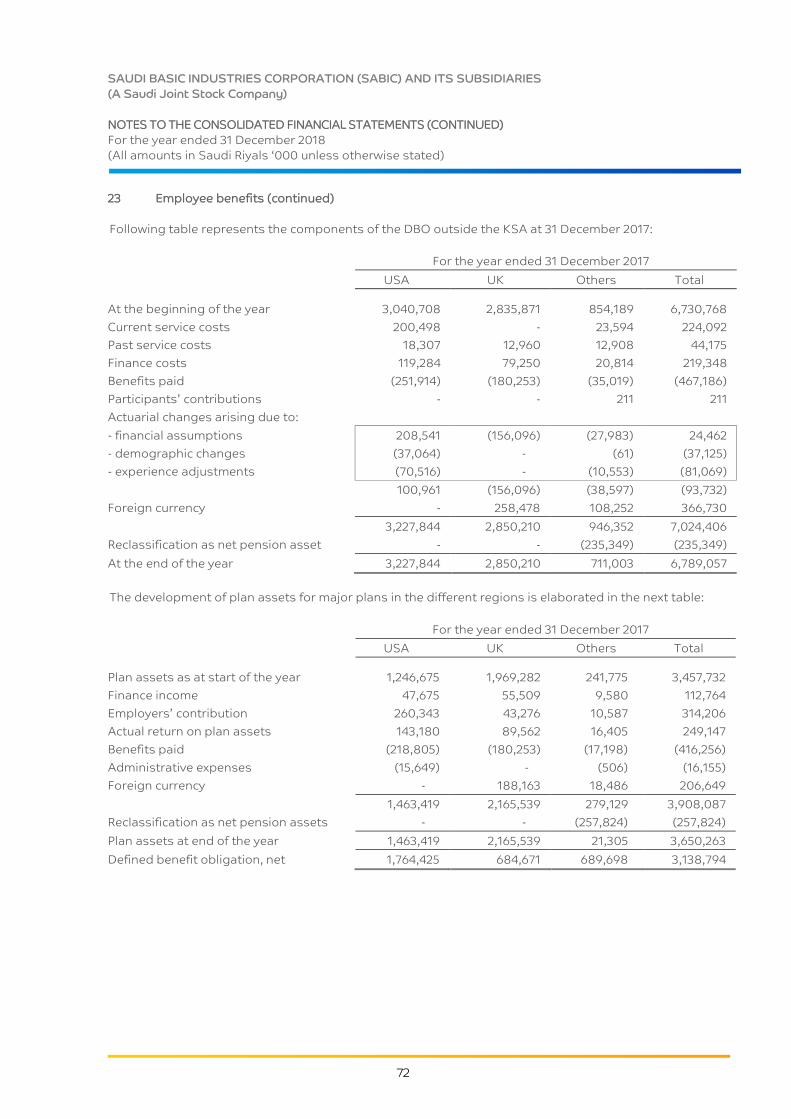
SAUDI BASIC INDUSTRIES CORPORATION (SABIC) AND ITS SUBSIDIARIES
(A Saudi Joint Stock Company)
NOTES TO THE CONSOLIDATED FINANCIAL STATEMENTS (CONTINUED)
For the year ended 31 December 2018
(All amounts in Saudi Riyals ‘000 unless otherwise stated)
72
23 Employee benefits (continued)
Following table represents the components of the DBO outside the KSA at 31 December 2017:
For the year ended 31 December 2017
USA UK Others Total
At the beginning of the year 3,040,708 2,835,871 854,189 6,730,768
Current service costs 200,498 - 23,594 224,092
Past service costs 18,307 12,960 12,908 44,175
Finance costs 119,284 79,250 20,814 219,348
Benefits paid (251,914) (180,253) (35,019) (467,186)
Participants’ contributions - - 211 211
Actuarial changes arising due to:
- financial assumptions 208,541 (156,096) (27,983) 24,462
- demographic changes (37,064) - (61) (37,125)
- experience adjustments (70,516) - (10,553) (81,069)
100,961 (156,096) (38,597) (93,732)
Foreign currency - 258,478 108,252 366,730
3,227,844 2,850,210 946,352 7,024,406
Reclassification as net pension asset - - (235,349) (235,349)
At the end of the year 3,227,844 2,850,210 711,003 6,789,057
The development of plan assets for major plans in the different regions is elaborated in the next table:
For the year ended 31 December 2017
USA UK Others Total
Plan assets as at start of the year 1,246,675 1,969,282 241,775 3,457,732
Finance income 47,675 55,509 9,580 112,764
Employers’ contribution 260,343 43,276 10,587 314,206
Actual return on plan assets 143,180 89,562 16,405 249,147
Benefits paid (218,805) (180,253) (17,198) (416,256)
Administrative expenses (15,649) - (506) (16,155)
Foreign currency - 188,163 18,486 206,649
1,463,419 2,165,539 279,129 3,908,087
Reclassification as net pension assets - - (257,824) (257,824)
Plan assets at end of the year 1,463,419 2,165,539 21,305 3,650,263
Defined benefit obligation, net 1,764,425 684,671 689,698 3,138,794
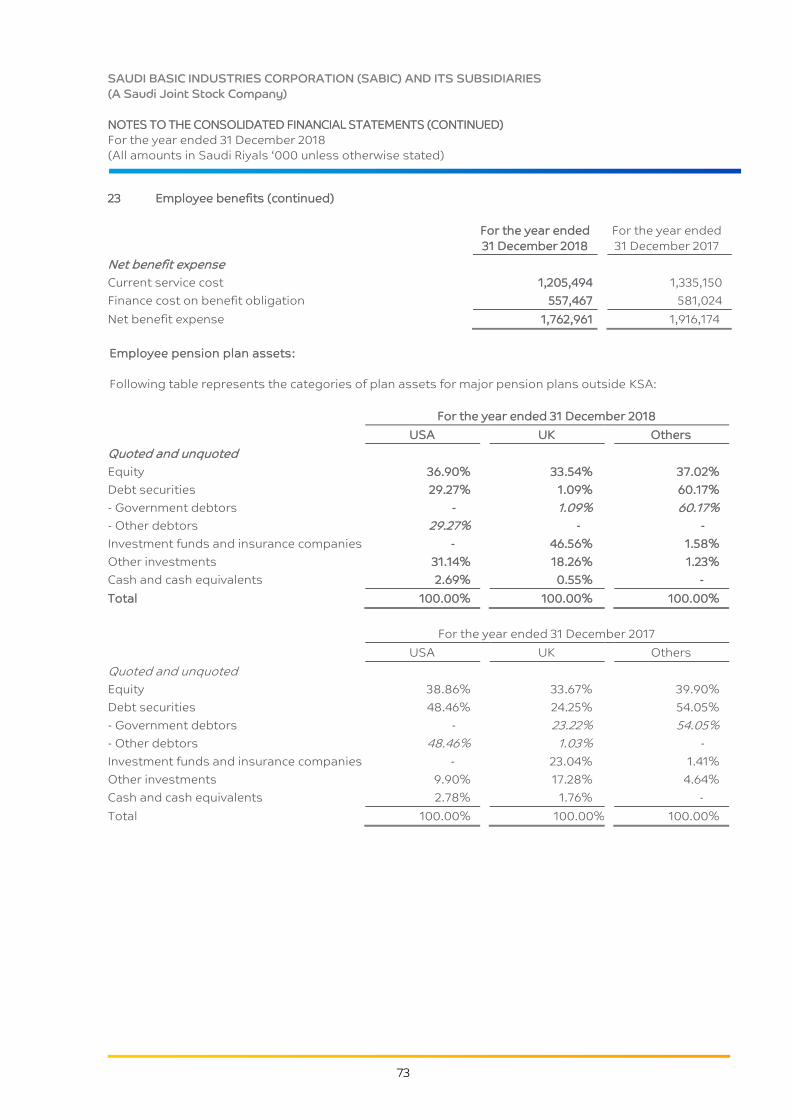
SAUDI BASIC INDUSTRIES CORPORATION (SABIC) AND ITS SUBSIDIARIES
(A Saudi Joint Stock Company)
NOTES TO THE CONSOLIDATED FINANCIAL STATEMENTS (CONTINUED)
For the year ended 31 December 2018
(All amounts in Saudi Riyals ‘000 unless otherwise stated)
73
23 Employee benefits (continued)
For the year ended
31 December 2018
For the year ended
31 December 2017
Net benefit expense
Current service cost 1,205,494 1,335,150
Finance cost on benefit obligation 557,467 581,024
Net benefit expense 1,762,961 1,916,174
Employee pension plan assets:
Following table represents the categories of plan assets for major pension plans outside KSA:
For the year ended 31 December 2018
USA UK Others
Quoted and unquoted
Equity 36.90% 33.54% 37.02%
Debt securities 29.27% 1.09% 60.17%
- Government debtors - 1.09% 60.17%
- Other debtors 29.27% - -
Investment funds and insurance companies - 46.56% 1.58%
Other investments 31.14% 18.26% 1.23%
Cash and cash equivalents 2.69% 0.55% -
Total 100.00% 100.00% 100.00%
For the year ended 31 December 2017
USA UK Others
Quoted and unquoted
Equity 38.86% 33.67% 39.90%
Debt securities 48.46% 24.25% 54.05%
- Government debtors - 23.22% 54.05%
- Other debtors 48.46% 1.03% -
Investment funds and insurance companies - 23.04% 1.41%
Other investments 9.90% 17.28% 4.64%
Cash and cash equivalents 2.78% 1.76% -
Total 100.00% 100.00% 100.00%
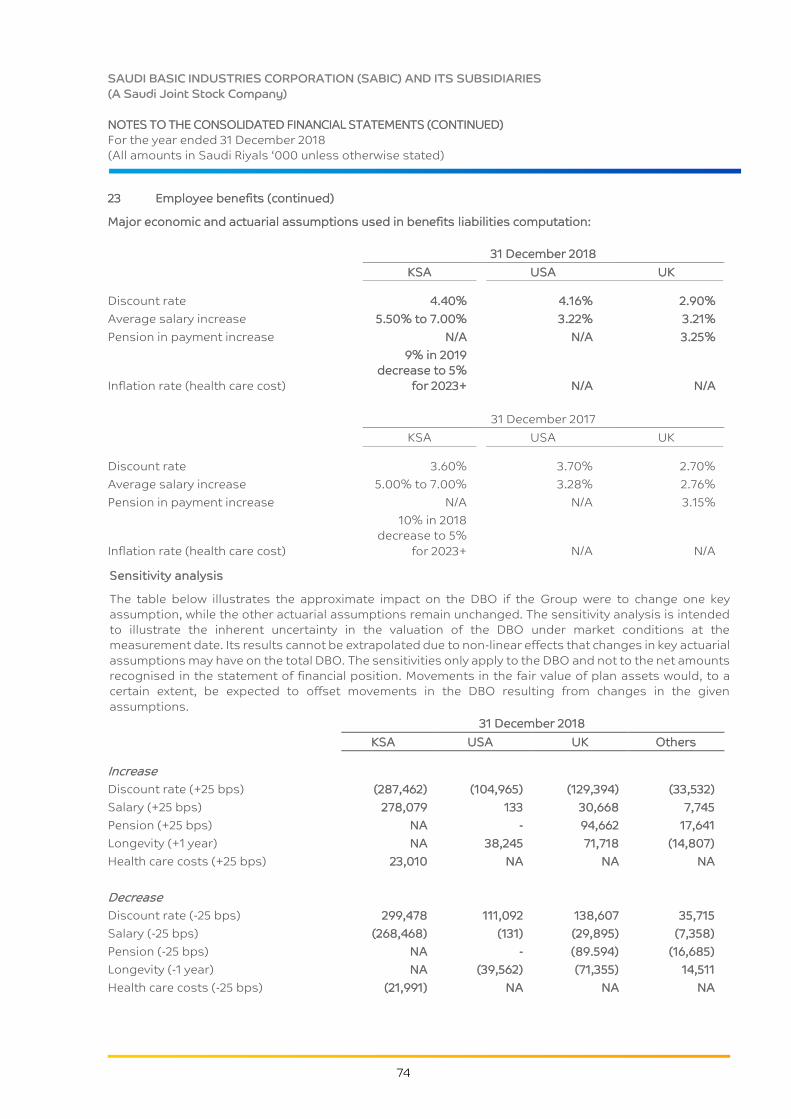
SAUDI BASIC INDUSTRIES CORPORATION (SABIC) AND ITS SUBSIDIARIES
(A Saudi Joint Stock Company)
NOTES TO THE CONSOLIDATED FINANCIAL STATEMENTS (CONTINUED)
For the year ended 31 December 2018
(All amounts in Saudi Riyals ‘000 unless otherwise stated)
74
23 Employee benefits (continued)
Major economic and actuarial assumptions used in benefits liabilities computation:
31 December 2018
KSA USA UK
Discount rate 4.40% 4.16% 2.90%
Average salary increase 5.50% to 7.00% 3.22% 3.21%
Pension in payment increase N/A N/A 3.25%
Inflation rate (health care cost)
9% in 2019
decrease to 5%
for 2023+ N/A N/A
31 December 2017
KSA USA UK
Discount rate 3.60% 3.70% 2.70%
Average salary increase 5.00% to 7.00% 3.28% 2.76%
Pension in payment increase N/A N/A 3.15%
Inflation rate (health care cost)
10% in 2018
decrease to 5%
for 2023+ N/A N/A
Sensitivity analysis
The table below illustrates the approximate impact on the DBO if the Group were to change one key
assumption, while the other actuarial assumptions remain unchanged. The sensitivity analysis is intended
to illustrate the inherent uncertainty in the valuation of the DBO under market conditions at the
measurement date. Its results cannot be extrapolated due to non-linear effects that changes in key actuarial
assumptions may have on the total DBO. The sensitivities only apply to the DBO and not to the net amounts
recognised in the statement of financial position. Movements in the fair value of plan assets would, to a
certain extent, be expected to offset movements in the DBO resulting from changes in the given
assumptions.
31 December 2018
KSA USA UK Others
Increase
Discount rate (+25 bps) (287,462) (104,965) (129,394) (33,532)
Salary (+25 bps) 278,079 133 30,668 7,745
Pension (+25 bps) NA - 94,662 17,641
Longevity (+1 year) NA 38,245 71,718 (14,807)
Health care costs (+25 bps) 23,010 NA NA NA
Decrease
Discount rate (-25 bps) 299,478 111,092 138,607 35,715
Salary (-25 bps) (268,468) (131) (29,895) (7,358)
Pension (-25 bps) NA - (89.594) (16,685)
Longevity (-1 year) NA (39,562) (71,355) 14,511
Health care costs (-25 bps) (21,991) NA NA NA

SAUDI BASIC INDUSTRIES CORPORATION (SABIC) AND ITS SUBSIDIARIES
(A Saudi Joint Stock Company)
NOTES TO THE CONSOLIDATED FINANCIAL STATEMENTS (CONTINUED)
For the year ended 31 December 2018
(All amounts in Saudi Riyals ‘000 unless otherwise stated)
75
23 Employee benefits (continued)
Sensitivity analysis (continued)
31 December 2017
KSA USA UK Others
Increase
Discount rate (+25 bps) (362,579) (138,858) (150,558) (36,689)
Salary (+25 bps) 313,884 16,841 34,170 9,370
Pension (+25 bps) NA - 112,018 NA
Longevity (+1 year) NA 42,608 80,372 NA
Health care costs (+25 bps) 21,255 NA NA NA
Decrease
Discount rate (-25 bps) 338,388 147,656 162,140 39,109
Salary (-25 bps) (341,056) (16,546) (33,309) (15,291)
Pension (-25 bps) NA - (105,766) NA
Longevity (-1 year) NA (44,040) (79,939) NA
Health care costs (-25 bps) (20,268) NA NA NA
Expected total benefit payments
31 December 2018
KSA Outside KSA
Within one year 591,513 317,973
1 – 2 years 585,755 339,374
2 – 3 years 644,072 352,686
3 – 4 years 737,023 370,104
4 – 5 years 810,999 387,863
Next 5 years 5,229,918 2,067,327
Total 8,599,280 3,835,327
31 December 2017
KSA Outside KSA
Within one year 720,507 371,901
1 – 2 years 665,140 397,270
2 – 3 years 741,461 419,623
3 – 4 years 839,591 444,219
4 – 5 years 901,619 472,071
Next 5 years 5,920,141 2,724,245
Total 9,788,459 4,829,329
Annual premiums paid to defined contribution schemes amount to SR 0.39 billion (2017: SR 0.33 billion) and
relate primarily to defined contribution pension schemes in the Netherlands.
The expected employer contributions related to the defined benefit pension plans for next year amount to
SR 0.15 billion (2017: SR 0.14 billion).
The weighted average duration of the defined benefit obligation is 10 years for KSA plans, 20 years for plans
outside KSA (31 December 2017: 12 years for KSA plans, 20 years for plans outside KSA).

SAUDI BASIC INDUSTRIES CORPORATION (SABIC) AND ITS SUBSIDIARIES
(A Saudi Joint Stock Company)
NOTES TO THE CONSOLIDATED FINANCIAL STATEMENTS (CONTINUED)
For the year ended 31 December 2018
(All amounts in Saudi Riyals ‘000 unless otherwise stated)
76
24 Trade payables
31 December 2018 31 December 2017
Trade accounts payable 14,938,392 17,886,738
Amounts due to related parties 30,965 174,726
14,969,357 18,061,464
The Group’s exposure to currency and liquidity risk related to accounts payables is disclosed in Note 36.
25 Accruals and other current liabilities
31 December 2018 31 December 2017
Accrued liabilities 6,250,270 5,087,426
Employees related liabilities 2,461,530 1,904,510
Dividend payable 2,773,681 1,633,220
Sales and other tax payables 401,584 303,879
Contract retentions 112,201 227,109
Others 1,017,618 968,102
13,016,884 10,124,246
26 Derivatives
31 December 2018 31 December 2017
Derivative asset:
Not designated in hedging relationship
- Foreign exchange forward contracts 29,651 2,828
- Interest rate collar derivatives – current (i) - 3,472
- Interest rate collar derivatives – non-current (i) - 20,506
Total financial derivatives 29,651 26,806
Notional amount 615,342 1,070,622
31 December 2018 31 December 2017
Derivative liability:
Not designated in hedging relationship
- Foreign exchange forward contracts 381 -
- Interest rate swap agreements – current - 14,258
- Interest rate swap agreements – non-current - 1,978
Total financial derivatives 381 16,236
Notional amount 291,967 716,645
(i) On adoption of IFRS 9, these derivatives have been combined with host contracts.
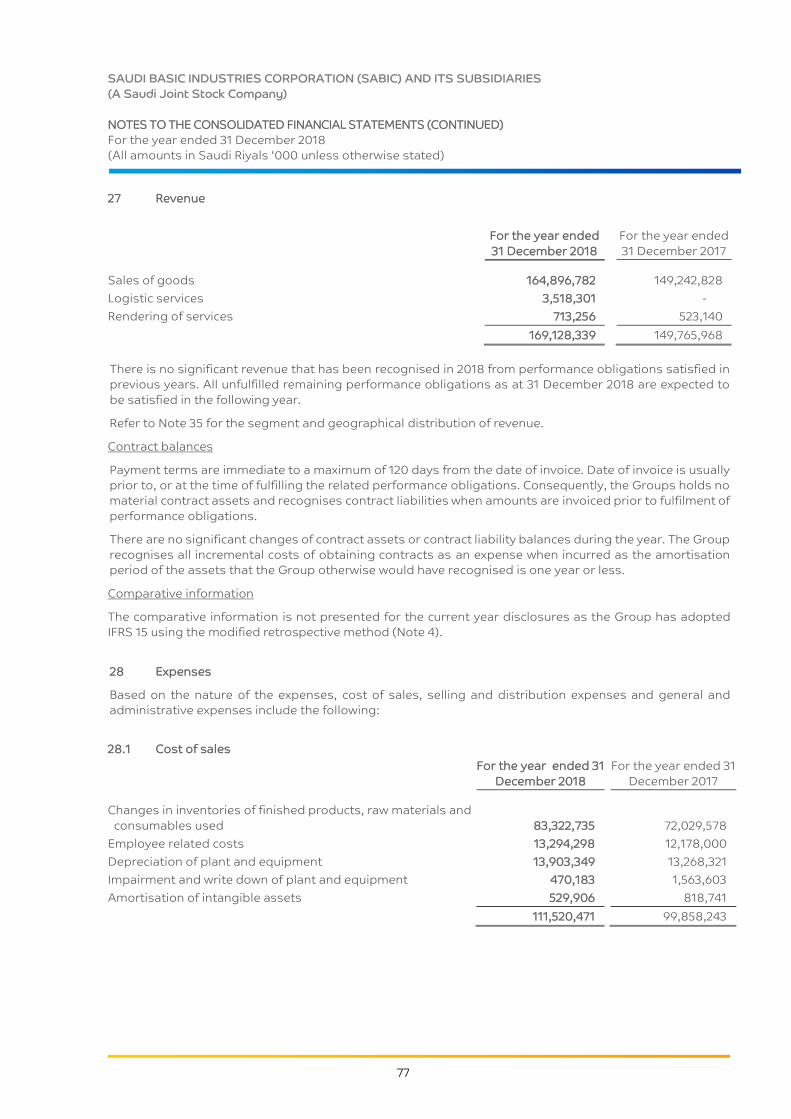
SAUDI BASIC INDUSTRIES CORPORATION (SABIC) AND ITS SUBSIDIARIES
(A Saudi Joint Stock Company)
NOTES TO THE CONSOLIDATED FINANCIAL STATEMENTS (CONTINUED)
For the year ended 31 December 2018
(All amounts in Saudi Riyals ‘000 unless otherwise stated)
77
27 Revenue
For the year ended
31 December 2018
For the year ended
31 December 2017
Sales of goods 164,896,782 149,242,828
Logistic services 3,518,301 -
Rendering of services 713,256 523,140
169,128,339 149,765,968
There is no significant revenue that has been recognised in 2018 from performance obligations satisfied in
previous years. All unfulfilled remaining performance obligations as at 31 December 2018 are expected to
be satisfied in the following year.
Refer to Note 35 for the segment and geographical distribution of revenue.
Contract balances
Payment terms are immediate to a maximum of 120 days from the date of invoice. Date of invoice is usually
prior to, or at the time of fulfilling the related performance obligations. Consequently, the Groups holds no
material contract assets and recognises contract liabilities when amounts are invoiced prior to fulfilment of
performance obligations.
There are no significant changes of contract assets or contract liability balances during the year. The Group
recognises all incremental costs of obtaining contracts as an expense when incurred as the amortisation
period of the assets that the Group otherwise would have recognised is one year or less.
Comparative information
The comparative information is not presented for the current year disclosures as the Group has adopted
IFRS 15 using the modified retrospective method (Note 4).
28 Expenses
Based on the nature of the expenses, cost of sales, selling and distribution expenses and general and
administrative expenses include the following:
28.1 Cost of sales
For the year ended 31
December 2018
For the year ended 31
December 2017
Changes in inventories of finished products, raw materials and
consumables used 83,322,735
72,029,578
Employee related costs 13,294,298 12,178,000
Depreciation of plant and equipment 13,903,349 13,268,321
Impairment and write down of plant and equipment 470,183 1,563,603
Amortisation of intangible assets 529,906 818,741
111,520,471 99,858,243
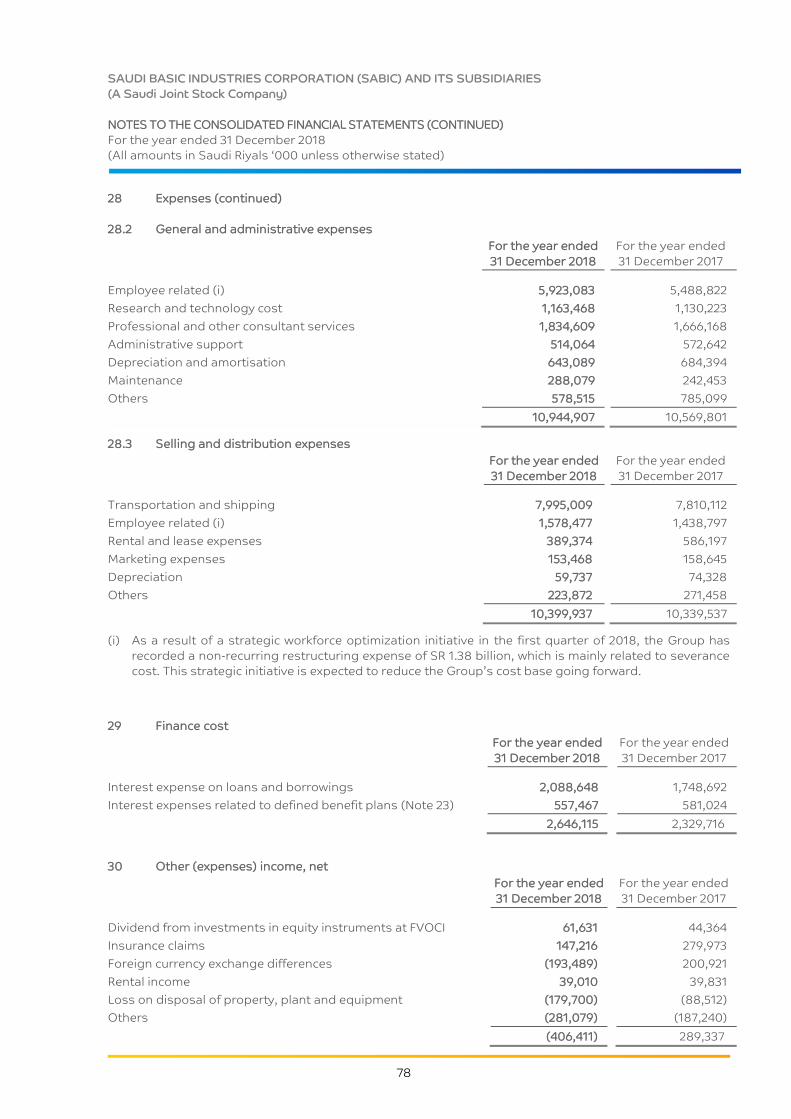
SAUDI BASIC INDUSTRIES CORPORATION (SABIC) AND ITS SUBSIDIARIES
(A Saudi Joint Stock Company)
NOTES TO THE CONSOLIDATED FINANCIAL STATEMENTS (CONTINUED)
For the year ended 31 December 2018
(All amounts in Saudi Riyals ‘000 unless otherwise stated)
78
28 Expenses (continued)
28.2 General and administrative expenses
For the year ended
31 December 2018
For the year ended
31 December 2017
Employee related (i) 5,923,083 5,488,822
Research and technology cost 1,163,468 1,130,223
Professional and other consultant services 1,834,609 1,666,168
Administrative support 514,064 572,642
Depreciation and amortisation 643,089 684,394
Maintenance 288,079 242,453
Others 578,515 785,099
10,944,907 10,569,801
28.3 Selling and distribution expenses
For the year ended
31 December 2018
For the year ended
31 December 2017
Transportation and shipping 7,995,009 7,810,112
Employee related (i) 1,578,477 1,438,797
Rental and lease expenses 389,374 586,197
Marketing expenses 153,468 158,645
Depreciation 59,737 74,328
Others 223,872 271,458
10,399,937 10,339,537
(i) As a result of a strategic workforce optimization initiative in the first quarter of 2018, the Group has
recorded a non-recurring restructuring expense of SR 1.38 billion, which is mainly related to severance
cost. This strategic initiative is expected to reduce the Group’s cost base going forward.
29 Finance cost
For the year ended
31 December 2018
For the year ended
31 December 2017
Interest expense on loans and borrowings 2,088,648 1,748,692
Interest expenses related to defined benefit plans (Note 23) 557,467 581,024
2,646,115 2,329,716
30 Other (expenses) income, net
For the year ended
31 December 2018
For the year ended
31 December 2017
Dividend from investments in equity instruments at FVOCI 61,631 44,364
Insurance claims 147,216 279,973
Foreign currency exchange differences (193,489) 200,921
Rental income 39,010 39,831
Loss on disposal of property, plant and equipment (179,700) (88,512)
Others (281,079) (187,240)
(406,411) 289,337

SAUDI BASIC INDUSTRIES CORPORATION (SABIC) AND ITS SUBSIDIARIES
(A Saudi Joint Stock Company)
NOTES TO THE CONSOLIDATED FINANCIAL STATEMENTS (CONTINUED)
For the year ended 31 December 2018
(All amounts in Saudi Riyals ‘000 unless otherwise stated)
79
31 Zakat and income tax
The movement in Group’s zakat and income tax payable is as follows:
For the year ended 31 December 2018
Zakat Income Tax Total
At the beginning of the year 2,619,140 1,056,100 3,675,240
Provided during the year 2,600,000 1,503,406 4,103,406
Paid during the year, net (2,375,997) (1,631,990) (4,007,987)
Other movements (foreign currency
translations and reclassification) -
433,658
433,658
At the end of the year 2,843,143 1,361,174 4,204,317
For the year ended 31 December 2017
Zakat Income Tax Total
At the beginning of the year 2,386,336 447,246 2,833,582
Provided during the year 2,600,000 1,466,329 4,066,329
Paid during the year, net (2,367,196) (855,710) (3,222,906)
Other movements - (1,765) (1,765)
At the end of the year 2,619,140 1,056,100 3,675,240
The movement in Group’s deferred tax is as follows:
For the year ended 31
December 2018
For the year ended 31
December 2017
Deferred tax
assets
Deferred tax
liabilities
Deferred tax
assets
Deferred tax
liabilities
At the beginning of the year 1,518,599 2,597,059 678,221 1,858,820
Changes during the year (i) (653,443) (932,921) (4,238) (106,377)
At the end of the year 865,156 1,664,138 673,983 1,752,443
(i) Includes impact of foreign exchanges translation and non-controlling interests
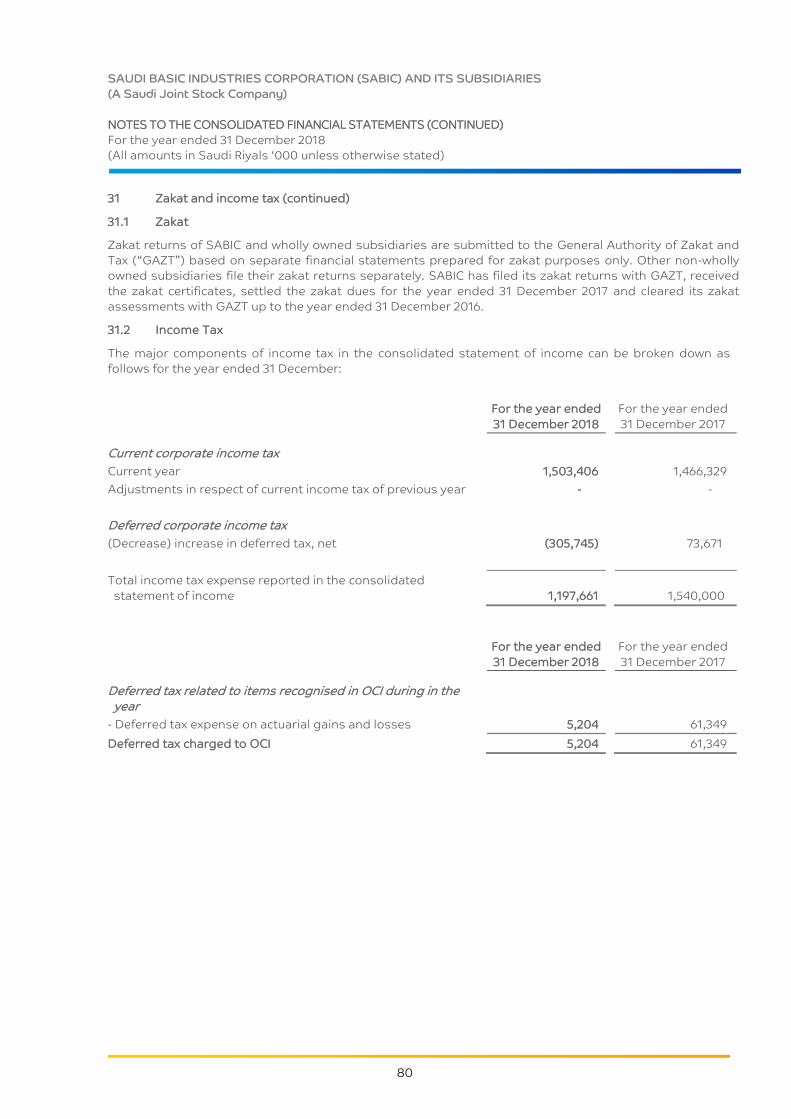
SAUDI BASIC INDUSTRIES CORPORATION (SABIC) AND ITS SUBSIDIARIES
(A Saudi Joint Stock Company)
NOTES TO THE CONSOLIDATED FINANCIAL STATEMENTS (CONTINUED)
For the year ended 31 December 2018
(All amounts in Saudi Riyals ‘000 unless otherwise stated)
80
31 Zakat and income tax (continued)
31.1 Zakat
Zakat returns of SABIC and wholly owned subsidiaries are submitted to the General Authority of Zakat and
Tax (“GAZT”) based on separate financial statements prepared for zakat purposes only. Other non-wholly
owned subsidiaries file their zakat returns separately. SABIC has filed its zakat returns with GAZT, received
the zakat certificates, settled the zakat dues for the year ended 31 December 2017 and cleared its zakat
assessments with GAZT up to the year ended 31 December 2016.
31.2 Income Tax
The major components of income tax in the consolidated statement of income can be broken down as
follows for the year ended 31 December:
For the year ended
31 December 2018
For the year ended
31 December 2017
Current corporate income tax
Current year 1,503,406 1,466,329
Adjustments in respect of current income tax of previous year - -
Deferred corporate income tax
(Decrease) increase in deferred tax, net (305,745) 73,671
Total income tax expense reported in the consolidated
statement of income 1,197,661
1,540,000
For the year ended
31 December 2018
For the year ended
31 December 2017
Deferred tax related to items recognised in OCI during in the year
- Deferred tax expense on actuarial gains and losses 5,204 61,349
Deferred tax charged to OCI 5,204 61,349

SAUDI BASIC INDUSTRIES CORPORATION (SABIC) AND ITS SUBSIDIARIES
(A Saudi Joint Stock Company)
NOTES TO THE CONSOLIDATED FINANCIAL STATEMENTS (CONTINUED)
For the year ended 31 December 2018
(All amounts in Saudi Riyals ‘000 unless otherwise stated)
81
31 Zakat and income tax (continued)
31.2 Income Tax (continued)
The numerical reconciliation of income tax expense derived from the accounting profit is presented in the
table below:
For the year ended
31 December 2018
For the year ended
31 December 2017
Income before zakat and income tax 35,683,068 29,624,745
Exclude: income subject to Zakat (27,830,507) (23,521,746)
Income subject to income tax 7,852,561 6,102,999
Domestic income tax rate (KSA) 20% 20%
Income tax at domestic tax rate 1,570,512 1,220,600
Tax effects of
- Current year tax benefits not recognised 342,686 498,436
- Foreign currency translation results (405,308) 433,424
- Deviating rates (26,800) 280,638
- Tax rate change (94,415) (118,201)
- Tax charge due to other liabilities 183,229 12,739
- Return-to-provision true-ups and exempt items (566,923) (74,551)
- Non-tax deductible expenses 198,135 62,667
- Recognition of previously unrecognised tax benefits (81,560) (818,022)
- Withholding tax 67,998 30,120
- State, local and other taxes 10,107 12,150
Income tax expense 1,197,661 1,540,000
Zakat expense 2,600,000 2,600,000
Total income tax and zakat expense 3,797,661 4,140,000

SAUDI BASIC INDUSTRIES CORPORATION (SABIC) AND ITS SUBSIDIARIES
(A Saudi Joint Stock Company)
NOTES TO THE CONSOLIDATED FINANCIAL STATEMENTS (CONTINUED)
For the year ended 31 December 2018
(All amounts in Saudi Riyals ‘000 unless otherwise stated)
82
31 Zakat and income tax (continued)
31.2 Income Tax (continued)
Components of deferred tax are as follows:
31 December 2018 31 December 2017
Difference in accounting and tax base related to:
- Tangible and intangible assets (3,466,676) (3,200,976)
- Inventories (29,120) (27,413)
- Reserves (204,670) (195,011)
- Others (23,997) (27,011)
Deferred tax liabilities (3,724,463) (3,450,411)
Set-off with deferred tax assets 2,060,325 1,697,968
Net deferred tax liabilities (1,664,138) (1,752,443)
Net operating losses 7,279,239 6,824,447
Difference in accounting and tax base related to:
- Tangible and intangible assets 445,332 320,871
- Employee benefits 583,956 967,003
- Deferred charges 10,912 164,163
- Provisions on receivables and inventories 355,480 286,524
- Tax credits 145,754 151,241
- Others 76,571 41,512
Deferred tax assets 8,897,244 8,755,761
Un-recognised deferred tax assets (5,971,763) (6,383,810)
Set-off with deferred tax liabilities (2,060,325) (1,697,968)
Net deferred tax assets 865,156 673,983
The Group offsets tax assets and liabilities if and only if it has a legally enforceable right to set off current
tax assets and current tax liabilities and the deferred tax assets and deferred to income taxes levied by the
same tax authority.
The Group has tax losses of SR 27.74 billion (2017: SR 25.25 billion) with carry-forward periods ranging from
2021 to indefinite, which are available for offsetting against future taxable profits of companies in which the
losses arose.
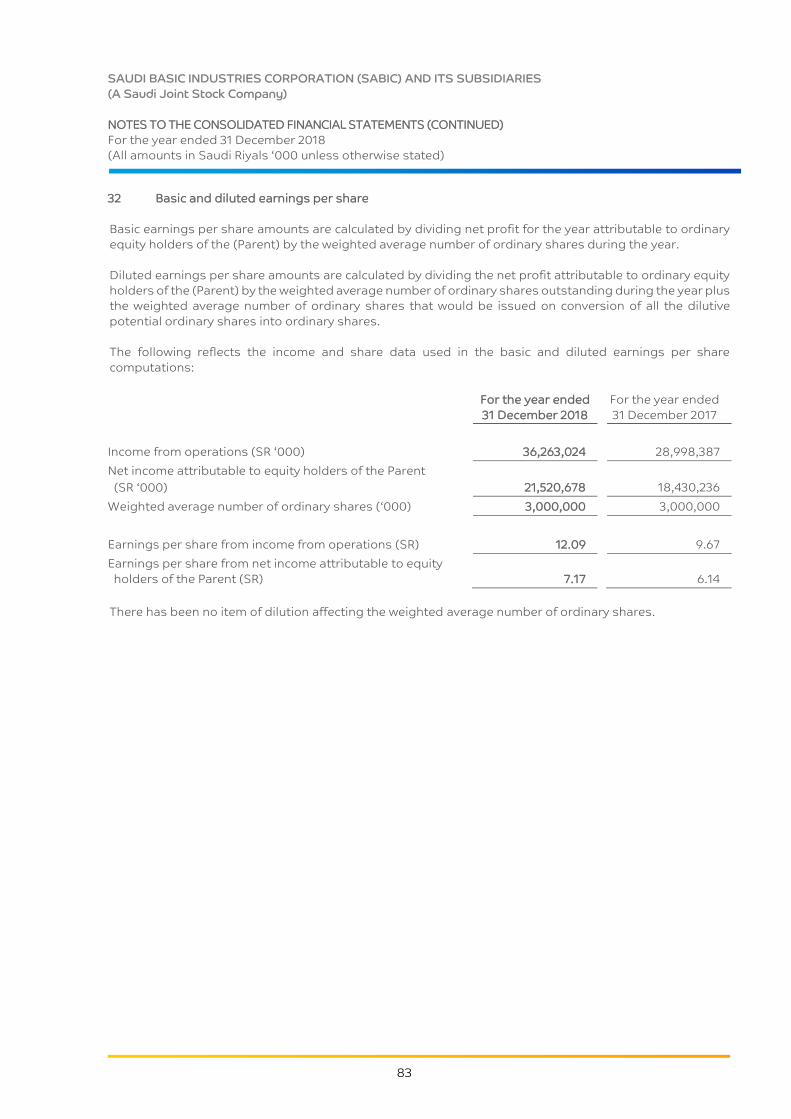
SAUDI BASIC INDUSTRIES CORPORATION (SABIC) AND ITS SUBSIDIARIES
(A Saudi Joint Stock Company)
NOTES TO THE CONSOLIDATED FINANCIAL STATEMENTS (CONTINUED)
For the year ended 31 December 2018
(All amounts in Saudi Riyals ‘000 unless otherwise stated)
83
32 Basic and diluted earnings per share
Basic earnings per share amounts are calculated by dividing net profit for the year attributable to ordinary
equity holders of the (Parent) by the weighted average number of ordinary shares during the year.
Diluted earnings per share amounts are calculated by dividing the net profit attributable to ordinary equity
holders of the (Parent) by the weighted average number of ordinary shares outstanding during the year plus
the weighted average number of ordinary shares that would be issued on conversion of all the dilutive
potential ordinary shares into ordinary shares.
The following reflects the income and share data used in the basic and diluted earnings per share
computations:
For the year ended
31 December 2018
For the year ended
31 December 2017
Income from operations (SR ‘000) 36,263,024 28,998,387
Net income attributable to equity holders of the Parent
(SR ‘000) 21,520,678
18,430,236
Weighted average number of ordinary shares (‘000) 3,000,000 3,000,000
Earnings per share from income from operations (SR) 12.09 9.67
Earnings per share from net income attributable to equity
holders of the Parent (SR) 7.17
6.14
There has been no item of dilution affecting the weighted average number of ordinary shares.

SAUDI BASIC INDUSTRIES CORPORATION (SABIC) AND ITS SUBSIDIARIES
(A Saudi Joint Stock Company)
NOTES TO THE CONSOLIDATED FINANCIAL STATEMENTS (CONTINUED)
For the year ended 31 December 2018
(All amounts in Saudi Riyals ‘000 unless otherwise stated)
84
33 Conventional and non-conventional financing and investments
The tables below outline the breakdown of Group’s financing and investments into conventional and non-
conventional:
31 December 2018 31 December 2017
Cash and bank balances
- Conventional call (excluding Fixed term deposits) 11,221,338 12,485,139
- Conventional time deposits 3,556,550 4,318,927
Conventional cash and bank balances 14,777,888 16,804,066
- Murabaha (including fixed term deposits) 25,881,062 40,153,002
- Current accounts (excluding fixed term deposits) 1,931,870 2,081,588
Non-conventional cash and bank balances 27,812,932 42,234,590
Total cash and bank balances 42,590,820 59,038,656
Short-term and investments in debt instruments
- Bonds and floating rate notes 556,151 543,750
- Conventional time deposits 478,075 123,963
Conventional short-term and investments in debt instruments 1,034,226 667,713
- Murabaha (including fixed time deposits) 8,762,214 3,836,790
- SUKUK 1,861,143 2,264,140
- Murabaha structured deposits 651,796 637,590
Non-Conventional short-term and investments in debt
instruments 11,275,153 6,738,520
Total short-term and investments in debt instruments 12,309,379 7,406,233
Investments in equity instruments at FVOCI
- Mutual funds 305,294 299,407
- Equity investments 784,815 396,836
Conventional investments in equity instruments at FVOCI 1,090,109 696,243
Total Investments in equity instruments at FVOCI 1,090,109 696,243

SAUDI BASIC INDUSTRIES CORPORATION (SABIC) AND ITS SUBSIDIARIES
(A Saudi Joint Stock Company)
NOTES TO THE CONSOLIDATED FINANCIAL STATEMENTS (CONTINUED)
For the year ended 31 December 2018
(All amounts in Saudi Riyals ‘000 unless otherwise stated)
85
33 Conventional and non-conventional financing and investments (continued)
31 December 2018 31 December 2017
Short-term borrowings
- Conventional short-term borrowings 1,167,589 1,065,000
Total short-term borrowings 1,167,589 1,065,000
Long and short-term debt
- Conventional loans 11,796,848 24,071,844
- Bonds/notes 10,633,950 12,097,616
- Finance leases 738,925 865,013
Conventional long-term debt 23,169,723 37,034,473
- Ijarah facilities 4,761,727 5,073,886
- SIDF 1,678,192 2,012,726
- Murabaha 16,486,010 12,877,103
Non-conventional long-term debt 22,925,929 19,963,715
Total long-term debt 46,095,652 56,998,188
Total debt 47,263,241 58,063,188
For the year ended
31 December 2018
For the year ended
31 December 2017
Borrowing cost capitalised during the year:
- Conventional loans 23,568 75,867
Borrowing costs capitalised from conventional loans 23,568 75,867
- Murabaha loans and SIDF 15,151 102,482
Borrowing costs capitalised from non-conventional loans 15,151 102,482
Total borrowing cost capitalised during the year 38,719 178,349

SAUDI BASIC INDUSTRIES CORPORATION (SABIC) AND ITS SUBSIDIARIES
(A Saudi Joint Stock Company)
NOTES TO THE CONSOLIDATED FINANCIAL STATEMENTS (CONTINUED)
For the year ended 31 December 2018
(All amounts in Saudi Riyals ‘000 unless otherwise stated)
86
33 Conventional and non-conventional financing and investments (continued)
For the year ended
31 December 2018
For the year ended
31 December 2017
Finance income
- Conventional call account 3,555 3,838
- Conventional time deposits 187,680 74,574
- Conventional structured deposits 28,513 31,244
- Derivatives (11,577) 54,064
- Others 76,484 24,665
Total conventional finance income 284,655 188,385
- Current Murabaha (including fixed term deposits) 1,035,951 949,056
- SUKUK 82,571 98,980
- Murabaha structured deposits 19,543 10,636
Total non-conventional finance income 1,138,065 1,058,672
Total finance income 1,422,720 1,247,057
Finance cost
- Conventional loans 695,355 669,872
- Conventional loans - (related party) 108,158 -
- Bonds/notes 359,675 383,987
- Finance leases 61,025 91,889
- Derivative liabilities - 10,797
- Net interest on employee benefits 557,467 581,024
- Others 146,795 124,759
Conventional finance cost 1,928,475 1,862,328
- SIDF 68,381 61,331
- Murabaha 575,235 117,286
- Ijarah facilities - 288,771
- Others 74,024 -
Non-conventional financial expenses 717,640 467,388
Total finance cost 2,646,115 2,329,716
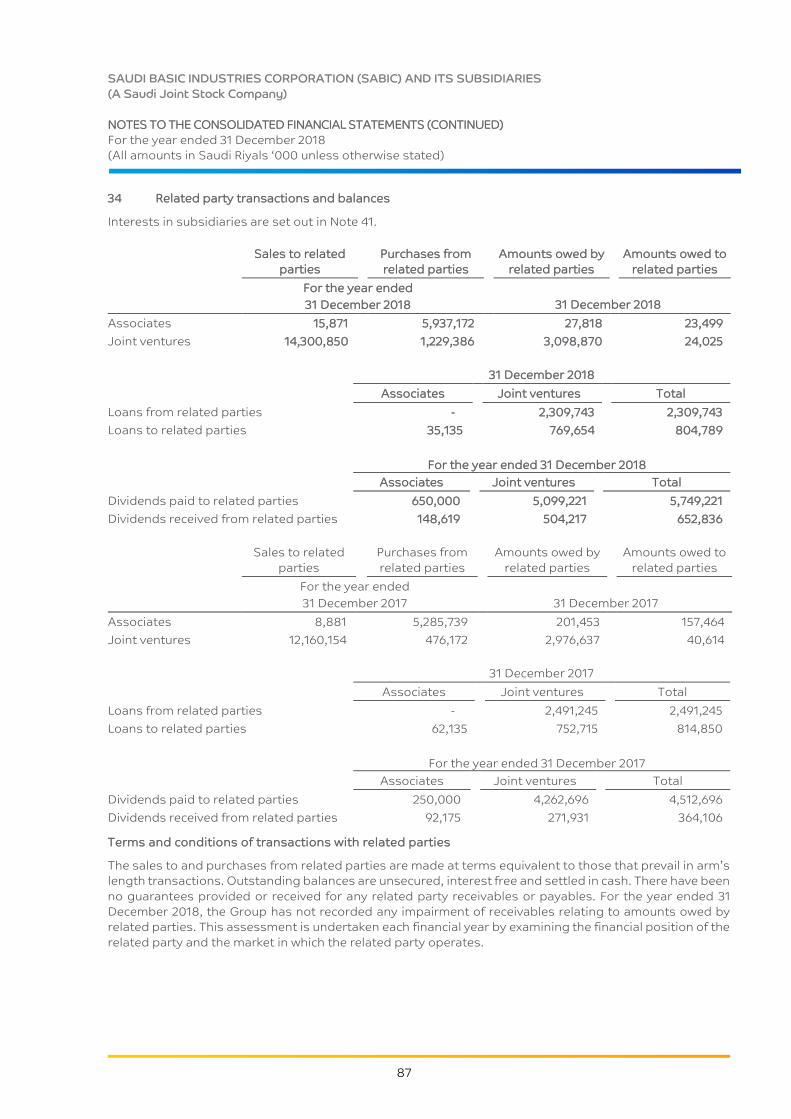
SAUDI BASIC INDUSTRIES CORPORATION (SABIC) AND ITS SUBSIDIARIES
(A Saudi Joint Stock Company)
NOTES TO THE CONSOLIDATED FINANCIAL STATEMENTS (CONTINUED)
For the year ended 31 December 2018
(All amounts in Saudi Riyals ‘000 unless otherwise stated)
87
34 Related party transactions and balances
Interests in subsidiaries are set out in Note 41.
Sales to related
parties
Purchases from
related parties
Amounts owed by
related parties
Amounts owed to
related parties
For the year ended
31 December 2018 31 December 2018
Associates 15,871 5,937,172 27,818 23,499
Joint ventures 14,300,850 1,229,386 3,098,870 24,025
31 December 2018
Associates Joint ventures Total
Loans from related parties - 2,309,743 2,309,743
Loans to related parties 35,135 769,654 804,789
For the year ended 31 December 2018
Associates Joint ventures Total
Dividends paid to related parties 650,000 5,099,221 5,749,221
Dividends received from related parties 148,619 504,217 652,836
Sales to related
parties
Purchases from
related parties
Amounts owed by
related parties
Amounts owed to
related parties
For the year ended
31 December 2017 31 December 2017
Associates 8,881 5,285,739 201,453 157,464
Joint ventures 12,160,154 476,172 2,976,637 40,614
31 December 2017
Associates Joint ventures Total
Loans from related parties - 2,491,245 2,491,245
Loans to related parties 62,135 752,715 814,850
For the year ended 31 December 2017
Associates Joint ventures Total
Dividends paid to related parties 250,000 4,262,696 4,512,696
Dividends received from related parties 92,175 271,931 364,106
Terms and conditions of transactions with related parties
The sales to and purchases from related parties are made at terms equivalent to those that prevail in arm’s
length transactions. Outstanding balances are unsecured, interest free and settled in cash. There have been
no guarantees provided or received for any related party receivables or payables. For the year ended 31
December 2018, the Group has not recorded any impairment of receivables relating to amounts owed by
related parties. This assessment is undertaken each financial year by examining the financial position of the
related party and the market in which the related party operates.
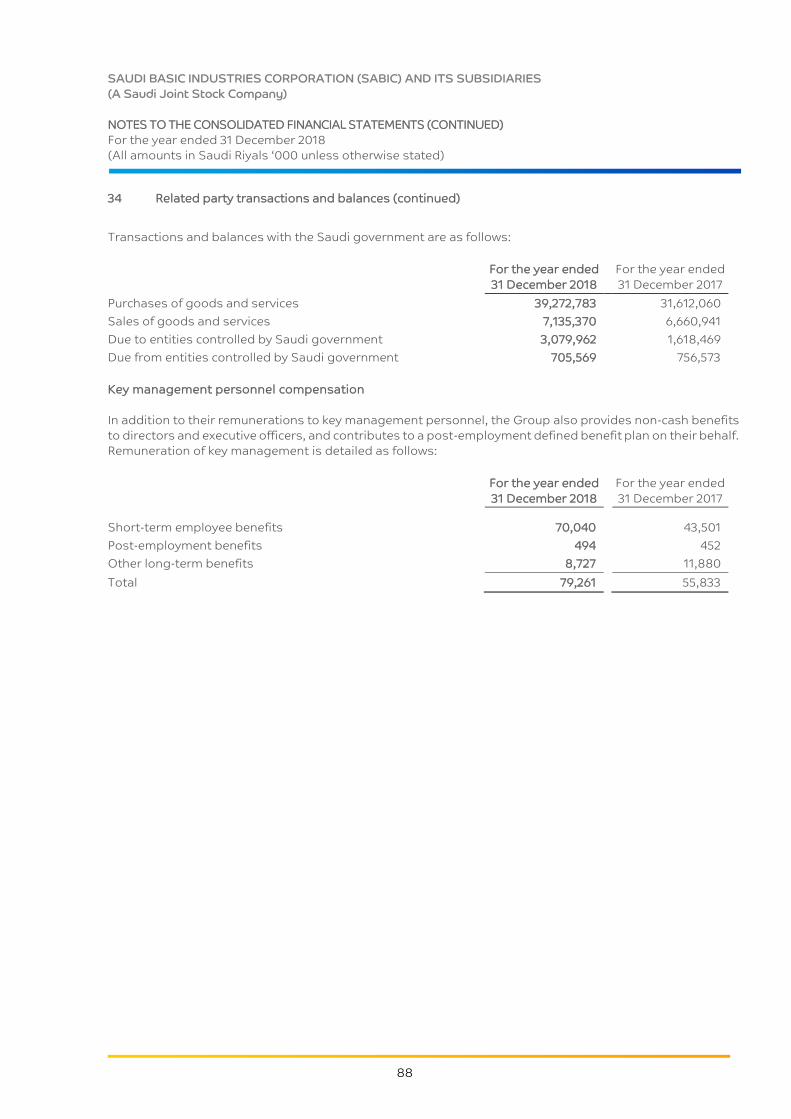
SAUDI BASIC INDUSTRIES CORPORATION (SABIC) AND ITS SUBSIDIARIES
(A Saudi Joint Stock Company)
NOTES TO THE CONSOLIDATED FINANCIAL STATEMENTS (CONTINUED)
For the year ended 31 December 2018
(All amounts in Saudi Riyals ‘000 unless otherwise stated)
88
34 Related party transactions and balances (continued)
Transactions and balances with the Saudi government are as follows:
For the year ended
31 December 2018
For the year ended
31 December 2017
Purchases of goods and services 39,272,783 31,612,060
Sales of goods and services 7,135,370 6,660,941
Due to entities controlled by Saudi government 3,079,962 1,618,469
Due from entities controlled by Saudi government 705,569 756,573
Key management personnel compensation
In addition to their remunerations to key management personnel, the Group also provides non-cash benefits
to directors and executive officers, and contributes to a post-employment defined benefit plan on their behalf.
Remuneration of key management is detailed as follows:
For the year ended
31 December 2018
For the year ended
31 December 2017
Short-term employee benefits 70,040 43,501
Post-employment benefits 494 452
Other long-term benefits 8,727 11,880
Total 79,261 55,833
SAUDI BASIC INDUSTRIES CORPORATION (SABIC) AND ITS SUBSIDIARIES
(A Saudi Joint Stock Company)
NOTES TO THE CONSOLIDATED FINANCIAL STATEMENTS (CONTINUED)
For the year ended 31 December 2018
(All amounts in Saudi Riyals ‘000 unless otherwise stated)
89
35 Segment information
For management purposes, the Group is organised into three Strategic Business Units (“SBU”) and Hadeed,
a wholly-owned manufacturing business, which based on its products are grouped in three reporting
segments.
The Petrochemicals SBU - products are produced from hydrocarbon feedstock including methane, ethane,
propane, butane, and light naphtha, with a wide range of products including carbon dioxide, ethylene,
methyl tert-butyl ether and other chemicals. During 2017, products related to polymers were merged into a
single segment with chemical products. These included Polyethylene (PE) and Polypropylene (PP). The PE
range includes all of the commodity thermo-polymers: Linear Low Density Polyethylene (LLDPE), Low Density
Polyethylene (LDPE), and High Density Polyethylene (HDPE). The PP product range includes Random,
Homopolymer, Copolymer and specialty automotive grades. Other key products include Polycarbonate (PC),
Polyester, Polyvinylchloride (PVC), Polystyrene, and PP compounding and Stamax.
The Specialties SBU – includes polymer technologies, application development on a global scale, innovative
process technologies, and environmentally responsible solutions in almost every area of modern life, from
automotive, aviation and electronics to construction, alternative energy, and health care. The extensive
product portfolio includes thermoplastic resins, specialty compounds, film and sheet products, and
coatings. As the Specialties SBU does not meet the individual reporting requirements of IAS 8 ‘Segment Reporting’ the SBU amounts are included as part of the Petrochemicals’ reporting segment.
The Agri-Nutrients SBU – includes production of a range of fertilisers; including urea, ammonia, phosphate,
as well as compound fertilisers.
Hadeed is concerned with production of steel products; long products (e.g. rebars) and flat products.
The Executive Management Committee, chaired by the Chief Executive Officer monitors the results of its
segments for the purpose of making decisions about resource allocation and performance assessment.
Segment performance is evaluated based on income statement and is measured consistently with profit or
loss in the consolidated financial statements.
Based on management decision and in line with changes in management reporting, the income, expenses,
assets and liabilities relating to 'Corporate' segment, in prior years, has been allocated over the Petro-
chemicals and Specialties, Agri-nutrients SBU’s and Hadeed according to an internally agreed consistent
basis. Accordingly, segment information for prior year are restated in line with current year presentation.
All intercompany transactions within the reporting segments have been appropriately eliminated. The
segments’ financial details are shown below:
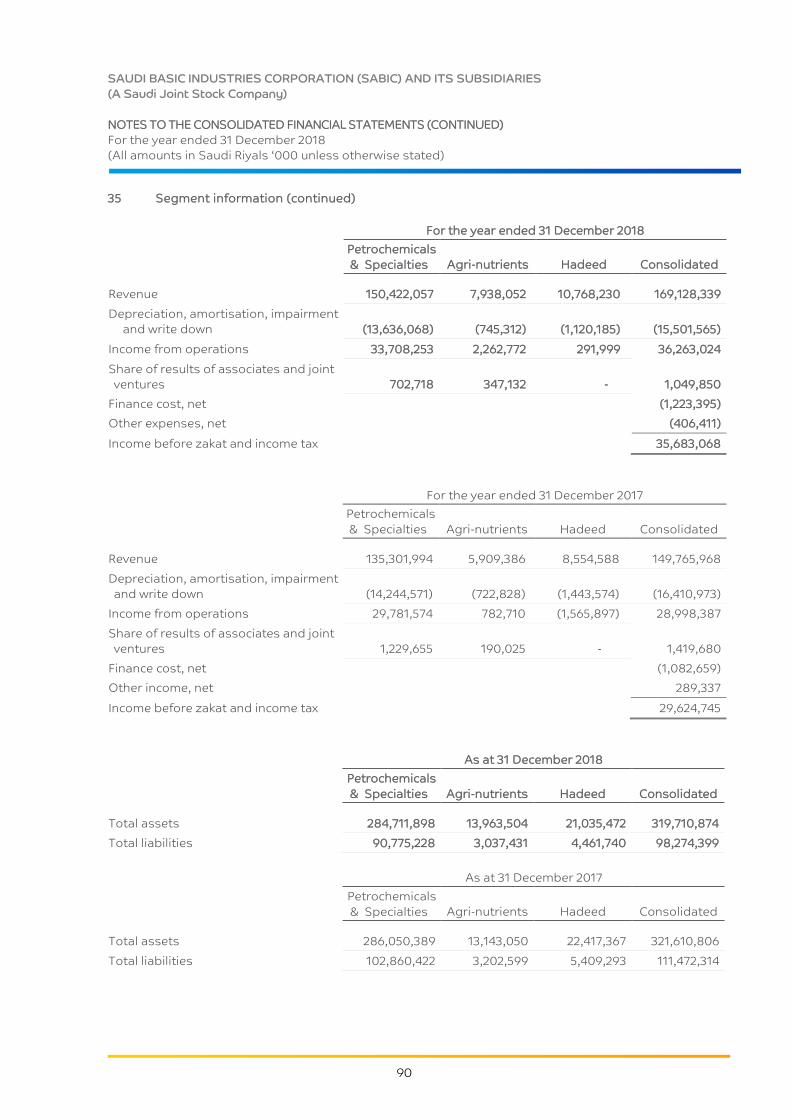
SAUDI BASIC INDUSTRIES CORPORATION (SABIC) AND ITS SUBSIDIARIES
(A Saudi Joint Stock Company)
NOTES TO THE CONSOLIDATED FINANCIAL STATEMENTS (CONTINUED)
For the year ended 31 December 2018
(All amounts in Saudi Riyals ‘000 unless otherwise stated)
90
35 Segment information (continued)
For the year ended 31 December 2018
Petrochemicals
& Specialties Agri-nutrients Hadeed Consolidated
Revenue 150,422,057 7,938,052 10,768,230 169,128,339
Depreciation, amortisation, impairment
and write down (13,636,068) (745,312) (1,120,185) (15,501,565)
Income from operations 33,708,253 2,262,772 291,999 36,263,024
Share of results of associates and joint
ventures 702,718 347,132 - 1,049,850
Finance cost, net (1,223,395)
Other expenses, net (406,411)
Income before zakat and income tax 35,683,068
For the year ended 31 December 2017
Petrochemicals
& Specialties Agri-nutrients Hadeed Consolidated
Revenue 135,301,994 5,909,386 8,554,588 149,765,968
Depreciation, amortisation, impairment
and write down (14,244,571) (722,828) (1,443,574) (16,410,973)
Income from operations 29,781,574 782,710 (1,565,897) 28,998,387
Share of results of associates and joint
ventures 1,229,655 190,025 - 1,419,680
Finance cost, net (1,082,659)
Other income, net 289,337
Income before zakat and income tax 29,624,745
As at 31 December 2018
Petrochemicals
& Specialties Agri-nutrients Hadeed Consolidated
Total assets 284,711,898 13,963,504 21,035,472 319,710,874
Total liabilities 90,775,228 3,037,431 4,461,740 98,274,399
As at 31 December 2017
Petrochemicals
& Specialties Agri-nutrients Hadeed Consolidated
Total assets 286,050,389 13,143,050 22,417,367 321,610,806
Total liabilities 102,860,422 3,202,599 5,409,293 111,472,314

SAUDI BASIC INDUSTRIES CORPORATION (SABIC) AND ITS SUBSIDIARIES
(A Saudi Joint Stock Company)
NOTES TO THE CONSOLIDATED FINANCIAL STATEMENTS (CONTINUED)
For the year ended 31 December 2018
(All amounts in Saudi Riyals ‘000 unless otherwise stated)
91
35 Segment information (continued)
Geographical distribution of revenue
31 December 2018 31 December 2017
% %
KSA 25,270,853 15% 22,751,799 15%
China 29,713,216 17% 25,404,525 17%
Rest of Asia 36,386,396 22% 32,595,863 22%
Europe 39,449,558 23% 35,913,940 24%
Americas 14,796,092 9% 12,744,946 8%
Others (i) 23,512,224 14% 20,354,895 14%
169,128,339 100% 149,765,968 100%
The revenue information above is based on the locations of the customers.
Geographical distribution of property, plant and equipment
31 December 2018 31 December 2017
% %
KSA 138,563,584 85% 143,163,921 86%
Europe (ii) 13,948,735 8% 15,086,965 9%
Americas (ii) 9,759,324 6% 7,383,489 4%
Asia (ii) 1,545,226 1% 1,718,893 1%
Others (ii) 2,815 - 2,643 -
163,819,684 100% 167,355,911 100%
(i) Others includes sales made by certain subsidiaries to their foreign shareholders amounting to SR 14.32
billion (2017 SR 13.31 billion) and for which detailed geographical breakdown for final end consumer sales
is not available with the Group.
(ii) Significant value of property, plant and equipment in Europe is concentrated in Netherlands, UK,
Germany and Spain; in Americas is concentrated in USA and in Asia is concentrated in China and India.
Others include countries in Africa and Oceania.
SAUDI BASIC INDUSTRIES CORPORATION (SABIC) AND ITS SUBSIDIARIES
(A Saudi Joint Stock Company)
NOTES TO THE CONSOLIDATED FINANCIAL STATEMENTS (CONTINUED)
For the year ended 31 December 2018
(All amounts in Saudi Riyals ‘000 unless otherwise stated)
92
36 Financial risk management
Overview
The Group has exposure to the following risks from its use of financial instruments:
Credit risk
Liquidity risk
Market risk
Operational risk.
This note presents information about the Group’s exposure to each of the above risks, the Group’s
objectives, policies and processes for measuring and managing risk, and the Group’s management of
capital. Further quantitative disclosures are included throughout these consolidated financial statements.
Risk management framework
The Board of Directors has overall responsibility for the establishment and oversight of the Group’s risk
management framework. The Board has established the Risk Management Committee, which is responsible
for developing and monitoring the Group’s risk management policies. The committee reports regularly to
the Board of Directors on its activities.
The Group’s risk management policies are established to identify and analyse the risks faced by the Group,
to set appropriate risk limits and controls, and to monitor risks and adherence to limits. Risk management
policies and systems are reviewed regularly to reflect changes in market conditions and the Group’s
activities. The Group, through its training and management standards and procedures, aims to develop a
disciplined and constructive control environment in which all employees understand their roles and
obligations.
The Group Audit Committee oversees how management monitors compliance with the Group’s risk
management policies and procedures, and reviews the adequacy of the risk management framework in
relation to the risks faced by the Group. The Group Audit Committee is assisted in its oversight role by
Internal Audit. Internal Audit undertakes both regular and ad-hoc reviews of risk management controls and
procedures, the results of which are reported to the Audit Committee. Financial instruments principally
include cash and bank balances, trade and other accounts receivable, derivative financial instruments,
investments in securities, loans and advances, short term bank borrowings, accounts payable, accrued
expenses, long term debt and other liabilities.
Credit risk
Credit risk is the risk of financial loss to the Group if a customer or counterparty to a financial instrument
fails to meet its contractual obligations, and arises principally from the Group’s receivables from customers
and investment securities.
Trade receivables
The Group’s exposure to credit risk is influenced mainly by the individual characteristics of each customer.
However, management also considers the demographics of the Group’s customer base, including the
default risk of the industry and country in which customers operate, as these factors may have an influence
on credit risk, particularly in the currently deteriorating economic circumstances. Also geographically there
is no concentration of credit risk.
The Group trades only with recognised, credit worthy third parties. It is the Group’s policy that all customers
who wish to trade on credit terms are subject to credit verification procedures. Credit quality of the customer
is assessed based on an extensive credit rating scorecard. In addition, receivable balances are monitored
on an ongoing basis with the result that the Group’s exposure to bad debts is not significant.

SAUDI BASIC INDUSTRIES CORPORATION (SABIC) AND ITS SUBSIDIARIES
(A Saudi Joint Stock Company)
NOTES TO THE CONSOLIDATED FINANCIAL STATEMENTS (CONTINUED)
For the year ended 31 December 2018
(All amounts in Saudi Riyals ‘000 unless otherwise stated)
93
36 Financial risk management (continued)
Trade receivables (continued)
Customer credit risk is managed by each business unit subject to the Group’s established policy, procedures
and control relating to customer credit risk management. Credit limits are established for all customers
using an internal and external rating criteria. Credit quality of the customer is assessed based on an
extensive credit rating scorecard. Outstanding customer receivables are regularly monitored.
The Risk Management Committee has established a credit policy under which each new customer is analysed
individually for creditworthiness before the Group’s standard payment and delivery terms and conditions
are offered. The Group’s review includes external ratings, when available, and in some cases, bank
references. Purchase limits are established for each customer, which represents the maximum open amount
without requiring approval from the Risk Management Committee; these limits are reviewed quarterly.
Customers that fail to meet the Group’s benchmark creditworthiness may transact with the Group only on a
prepayment basis.
Investments
Management actively monitors credit ratings and given that the Group only has invested in securities with
high credit ratings, management does not expect any counterparty to fail to meet its obligations.
Guarantees
The Group monitors its risk to a shortage of funds using forecasting models to model impacts of operational
activities on overall liquidity availability. The Group’s objective is to maintain a balance between continuity
of funding and flexibility through the use of bank overdrafts, the revolving credit facilities and other sources
of liquidity.
Credit risk quality
31 December 2018
External Rating AA+ AA AA- A+ A A- Others
Carrying
value in the
statement of
financial
position
Bank balances 208,350 426,408 1,578,047 18,769,664 9,792,158 7,905,030 3,910,773 42,590,430
Investments in equity
instruments at FVOCI
-
-
-
305,294
-
-
784,815 1,090,109
Investments in debt
instruments
-
-
-
2,668,285
388,404
- 12,401
3,069,090
Short-term
investments
(excluding
investments in debt
instruments)
375,000 - -
2,660,318 2,350,990
212,500
3,641,481 9,240,289
Financial derivatives - - 11,038 3,424 - - 15,189 29,651
Total 583,350 426,408 1,589,085 24,406,985 12,531,552 8,117,530 8,364,659 56,019,569

SAUDI BASIC INDUSTRIES CORPORATION (SABIC) AND ITS SUBSIDIARIES
(A Saudi Joint Stock Company)
NOTES TO THE CONSOLIDATED FINANCIAL STATEMENTS (CONTINUED)
For the year ended 31 December 2018
(All amounts in Saudi Riyals ‘000 unless otherwise stated)
94
36 Financial risk management (continued)
Credit risk quality (continued)
The credit ratings above are based on credit ratings issued by globally accepted credit rating agencies.
Liquidity risk
Liquidity risk is the risk that the Group will encounter difficulty in meeting the obligations associated with its
financial liabilities that are settled by delivering cash or another financial asset. The Group’s approach to
managing liquidity is to ensure, as far as possible, that it will always have sufficient liquidity to meet its
liabilities when due, under both normal and stressed conditions, without incurring unacceptable losses or
risking damage to the Group’s reputation.
The Group ensures that it has sufficient cash on demand to meet expected operational expenses, including
the servicing of financial obligations; this excludes the potential impact of extreme circumstances that
cannot reasonably be predicted, such as natural disasters. In addition, the Group maintains different lines
of credit.
Concentrations arise when a number of counterparties are engaged in similar business activities, or
activities in the same geographical region, or have economic features that would cause their ability to meet
contractual obligations to be similarly affected by changes in economic, political or other conditions.
Concentrations indicate the relative sensitivity of the Group’s performance to developments affecting a
particular industry.
31 December 2017
External Rating AA+ AA AA- A+ A A- Others
Carrying
value in the
statement of
financial
position
Bank balances 74,190 80,236 4,032,418 24,702,761 8,399,650 18,872,720 2,876,268 59,038,243
Available for sale
financial assets - - - 299,406 - - 396,837 696,243
Held-to-maturity
investments - - - 3,070,481 - 375,000 - 3,445,481
Short-term
investments
(excluding held-to-
maturity investments) - - - 489,655 1,624,252 1,157,672 689,173 3,960,752
Financial derivatives - 22,498 1,013 2,920 326 - 49 26,806
Total 74,190 102,734 4,033,431 28,565,223 10,024,228 20,405,392 3,962,327 67,167,525
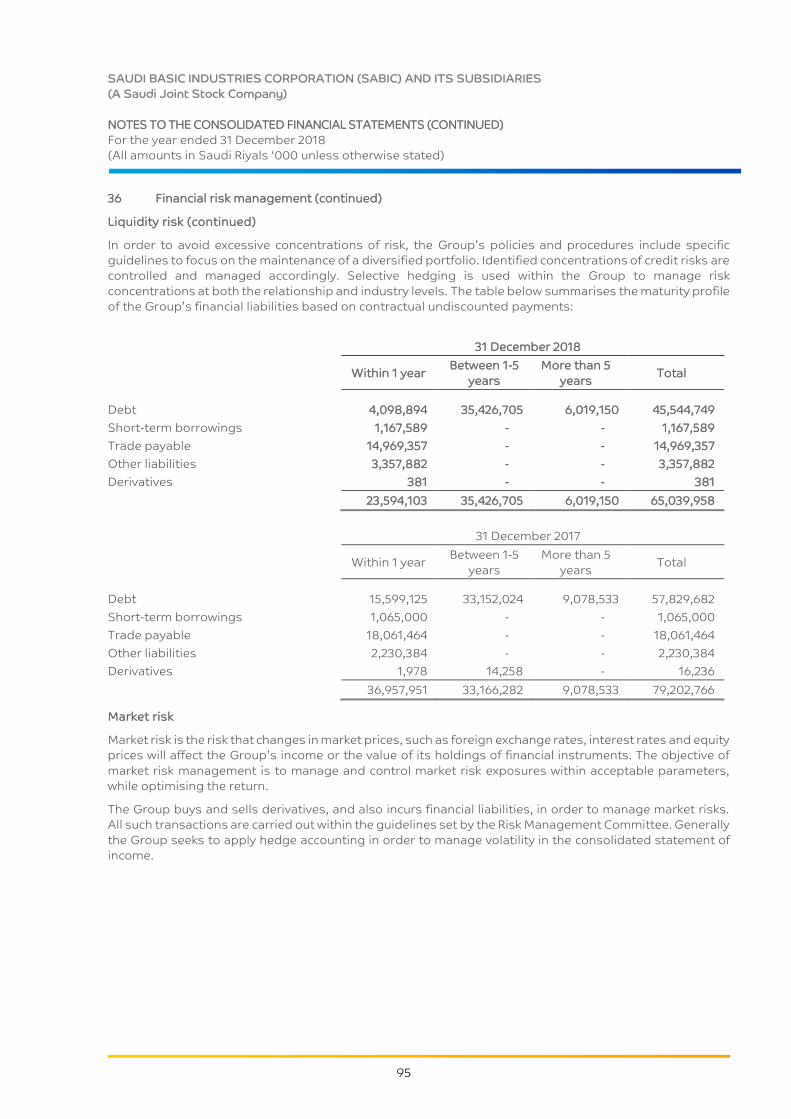
SAUDI BASIC INDUSTRIES CORPORATION (SABIC) AND ITS SUBSIDIARIES
(A Saudi Joint Stock Company)
NOTES TO THE CONSOLIDATED FINANCIAL STATEMENTS (CONTINUED)
For the year ended 31 December 2018
(All amounts in Saudi Riyals ‘000 unless otherwise stated)
95
36 Financial risk management (continued)
Liquidity risk (continued)
In order to avoid excessive concentrations of risk, the Group’s policies and procedures include specific
guidelines to focus on the maintenance of a diversified portfolio. Identified concentrations of credit risks are
controlled and managed accordingly. Selective hedging is used within the Group to manage risk
concentrations at both the relationship and industry levels. The table below summarises the maturity profile
of the Group’s financial liabilities based on contractual undiscounted payments:
31 December 2018
Within 1 year
Between 1-5
years
More than 5
years Total
Debt 4,098,894 35,426,705 6,019,150 45,544,749
Short-term borrowings 1,167,589 - - 1,167,589
Trade payable 14,969,357 - - 14,969,357
Other liabilities 3,357,882 - - 3,357,882
Derivatives 381 - - 381
23,594,103 35,426,705 6,019,150 65,039,958
31 December 2017
Within 1 year
Between 1-5
years
More than 5
years Total
Debt 15,599,125 33,152,024 9,078,533 57,829,682
Short-term borrowings 1,065,000 - - 1,065,000
Trade payable 18,061,464 - - 18,061,464
Other liabilities 2,230,384 - - 2,230,384
Derivatives 1,978 14,258 - 16,236
36,957,951 33,166,282 9,078,533 79,202,766
Market risk
Market risk is the risk that changes in market prices, such as foreign exchange rates, interest rates and equity
prices will affect the Group’s income or the value of its holdings of financial instruments. The objective of
market risk management is to manage and control market risk exposures within acceptable parameters,
while optimising the return.
The Group buys and sells derivatives, and also incurs financial liabilities, in order to manage market risks.
All such transactions are carried out within the guidelines set by the Risk Management Committee. Generally
the Group seeks to apply hedge accounting in order to manage volatility in the consolidated statement of
income.

SAUDI BASIC INDUSTRIES CORPORATION (SABIC) AND ITS SUBSIDIARIES
(A Saudi Joint Stock Company)
NOTES TO THE CONSOLIDATED FINANCIAL STATEMENTS (CONTINUED)
For the year ended 31 December 2018
(All amounts in Saudi Riyals ‘000 unless otherwise stated)
96
36 Financial risk management (continued)
Equity price risk
The Group’s exposure to equity securities price risk arises from investments held by the Group and classified
as Investments in equity instruments at FVOCI. To manage its price risk arising from investments in equity
securities, the Group diversifies its portfolio. Diversification of the portfolio is done in accordance with the
limits set by the Group.
Other components of equity would increase/decrease as a result of gains/losses on equity securities
classified as investments in equity instruments at FVOCI.
Currency risk
The Group operates internationally and is exposed to foreign exchange risk arising from various currency
exposures, primarily with respect to the fluctuations of the other currencies towards the SR. Foreign currency
risk mainly arises from commercial transactions, investing and financing activities.
The Group’s policy requires all subsidiaries to conduct a regular review of currency exposures, however the
hedge decisions is delegated to Global Treasury, who manages the execution of all derivatives trading
centrally. In respect of monetary assets and liabilities denominated in foreign currencies, the Group ensures
that its net exposure is kept to an acceptable level by buying or selling foreign currencies at spot rates when
necessary to address short-term imbalances.
The Group is currently exposed to currency risk on balances including receivable against sales, payable to
suppliers, placement with banks and borrowings that are denominated in a currency other than SR. The
currencies in which these transactions are primarily denominated includes US Dollar (USD), Euro (EUR),
British Pounds (GBP), Japanese Yen (JPY) and Chinese Yuan (CNY).
The currency risk on USD exposure is not considered significant by the Group as USD is pegged against SR.
The following table demonstrates the sensitivity of the Group to a reasonably possible change in the
exchange rate of SR to foreign currencies, with all other variables held constant, of the Group’s monetary
assets and liabilities net of hedges entered into for the year ended 31 December:
Gains (losses) through statement of
income for the year ended
31 December 2018 31 December 2017
Increase in EUR/SR (10%) (72,031) (277,522)
Increase in GBP/SR (10%) (70,056) (116,404)
Increase in CNY/SR (10%) 149,298 68,796
Increase in JPY/SR (10%) 11,172 151,093
18,383 (174,037)

SAUDI BASIC INDUSTRIES CORPORATION (SABIC) AND ITS SUBSIDIARIES
(A Saudi Joint Stock Company)
NOTES TO THE CONSOLIDATED FINANCIAL STATEMENTS (CONTINUED)
For the year ended 31 December 2018
(All amounts in Saudi Riyals ‘000 unless otherwise stated)
97
36 Financial risk management (continued)
Currency risk (continued)
Exposure to foreign currency risk at the end of the reporting year, was as follows (converted in SR ’000):
As at 31 December 2018
EUR GBP CNY JPY
Cash and bank (including fixed term deposits) 988,961 (892,503) 1,092,707 90,467
Trade receivables 3,577,112 284,624 477,540 137,828
Debt (3,216,375) - - -
Trade payables (1,054,166) (92,681) (54,718) (56,841)
Other monetary payables (1,015,837) - (22,547) (59,735)
Total net monetary exposure (720,305) (700,560) 1,492,982 111,719
As at 31 December 2017
EUR GBP CNY JPY
Cash and bank (including fixed term deposits) 1,015,186 (1,003,738) 562,710 904,078
Trade receivables 3,840,916 257,776 125,293 606,856
Debt (3,373,875) - - -
Trade payables (1,419,887) (75,902) (41) -
Other monetary payables (2,837,559) (342,174) - -
Total net monetary exposure (2,775,219) (1,164,038) 687,962 1,510,934
Interest rate risk
Interest rate risk is the risk that the fair value or future cash flows of a financial instrument will fluctuate
because of changes in market interest rates. The Group’s exposure to the risk of changes in market interest
rates relates primarily to the Group’s long-term debt obligations with floating interest rates. The Group
manages its interest rate risk by having a balanced portfolio of fixed and variable rate loans and borrowings.
To lower volatility and increase predictability of interest expenses, the Group may enter into simple financial
derivatives such as interest rate swaps.
The following table demonstrates the sensitivity of the Group to a reasonably possible change in interest
rates after taking into account the effect of the interest rate swap hedges, with all other variables held
constant, of the Groups profit before tax (through the impact on floating rate borrowings) for the year ended
31 December:
31 December 2018
Gains (losses) through the
consolidated statement of income
+100 bps -100 bps
3M SAIBOR 114 (114)
6M SAIBOR (2,129) 2,129
9M SAIBOR (778) 778
1M LIBOR (94) 94
6M LIBOR (6,394) 6,394
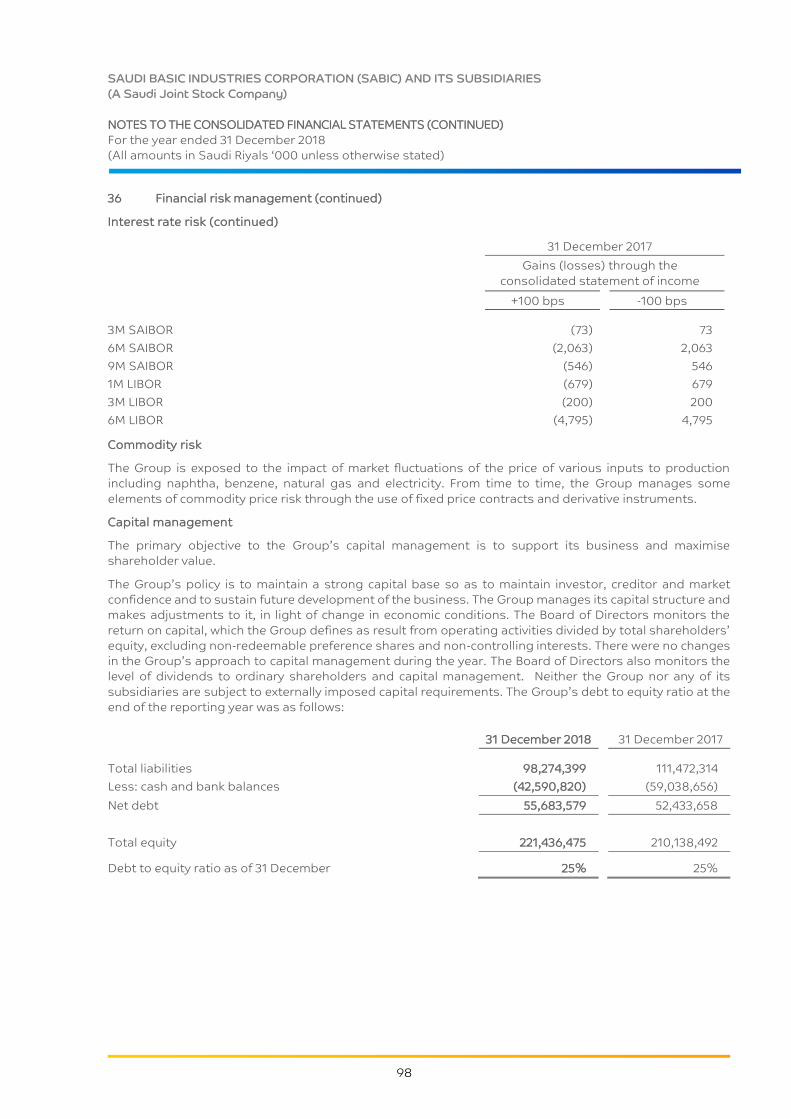
SAUDI BASIC INDUSTRIES CORPORATION (SABIC) AND ITS SUBSIDIARIES
(A Saudi Joint Stock Company)
NOTES TO THE CONSOLIDATED FINANCIAL STATEMENTS (CONTINUED)
For the year ended 31 December 2018
(All amounts in Saudi Riyals ‘000 unless otherwise stated)
98
36 Financial risk management (continued)
Interest rate risk (continued)
31 December 2017
Gains (losses) through the
consolidated statement of income
+100 bps -100 bps
3M SAIBOR (73) 73
6M SAIBOR (2,063) 2,063
9M SAIBOR (546) 546
1M LIBOR (679) 679
3M LIBOR (200) 200
6M LIBOR (4,795) 4,795
Commodity risk
The Group is exposed to the impact of market fluctuations of the price of various inputs to production
including naphtha, benzene, natural gas and electricity. From time to time, the Group manages some
elements of commodity price risk through the use of fixed price contracts and derivative instruments.
Capital management
The primary objective to the Group’s capital management is to support its business and maximise
shareholder value.
The Group’s policy is to maintain a strong capital base so as to maintain investor, creditor and market
confidence and to sustain future development of the business. The Group manages its capital structure and
makes adjustments to it, in light of change in economic conditions. The Board of Directors monitors the
return on capital, which the Group defines as result from operating activities divided by total shareholders’
equity, excluding non-redeemable preference shares and non-controlling interests. There were no changes
in the Group’s approach to capital management during the year. The Board of Directors also monitors the
level of dividends to ordinary shareholders and capital management. Neither the Group nor any of its
subsidiaries are subject to externally imposed capital requirements. The Group’s debt to equity ratio at the
end of the reporting year was as follows:
31 December 2018 31 December 2017
Total liabilities 98,274,399 111,472,314
Less: cash and bank balances (42,590,820) (59,038,656)
Net debt 55,683,579 52,433,658
Total equity 221,436,475 210,138,492
Debt to equity ratio as of 31 December 25% 25%

SAUDI BASIC INDUSTRIES CORPORATION (SABIC) AND ITS SUBSIDIARIES
(A Saudi Joint Stock Company)
NOTES TO THE CONSOLIDATED FINANCIAL STATEMENTS (CONTINUED)
For the year ended 31 December 2018
(All amounts in Saudi Riyals ‘000 unless otherwise stated)
99
37 Commitments and contingencies
Capital commitments
At 31 December 2018, the Group had commitments of SR 9.92 billion (31 December 2017: SR 9.11 billion)
relating to capital expenditures.
SABIC has an equity contribution commitment towards its 15% interest in MWSPC. As of 31 December 2018,
the outstanding commitment toward this investment amounts to SR 0.07 billion (31 December 2017: SR 0.07
billion). Pursuant to the terms of agreements with the other shareholders and external lenders, SABIC has
agreed to contribute additional funds to the project, under certain circumstances and to the extent required,
in the event of project cost over-runs.
SABIC also has an equity contribution commitment towards its 25% interest in Dussur. As at 31 December
2018, the outstanding commitment towards this investment amounts to SR 0.28 billion (as at 31 December
2017: SR 0.28 billion).
The Group has signed agreements with vendors maturing over various years through 2025 for capital
commitment for the ongoing operations of its business. Under the terms of these agreements, the Group
has committed to contractually specified minimums over the contract periods.
Guarantees
SABIC has provided guarantees for bonds and certain term loans for certain subsidiaries which amounted
to SR 29.4 billion as of 31 December 2018 (31 December 2017: SR 31.0 billion).
Contingent liabilities
The Group’s bankers have issued, on its behalf, bank guarantees amounting to SR 2.72 billion (31 December
2017: SR 2.86 billion) in the normal course of business.
Operating lease commitments
The Group has entered into operating leases on certain motor vehicles and items of machinery. Future
minimum rentals payable under non-cancellable operating leases as at 31 December are, as follows:
31 December 2018 31 December 2017
Within one year 1,520,312 1,012,977
After one year but not more than five years 3,929,788 2,886,844
More than five years 3,455,462 2,657,715
8,905,562 6,557,536
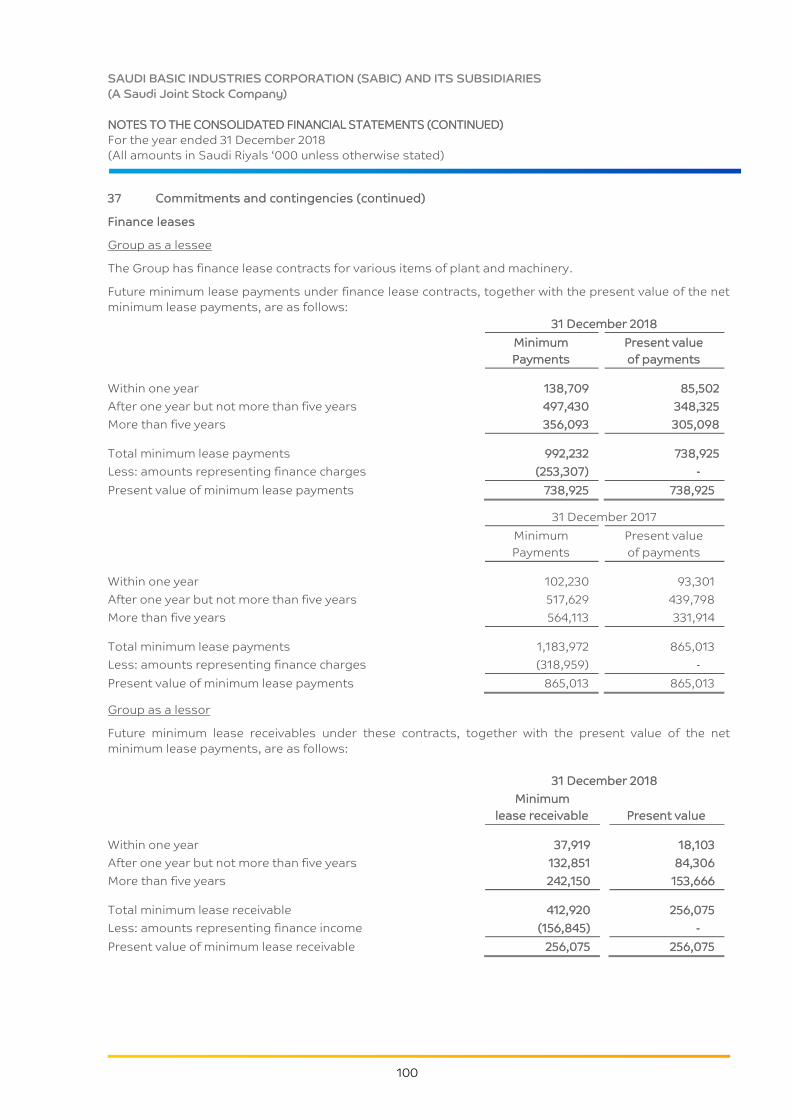
SAUDI BASIC INDUSTRIES CORPORATION (SABIC) AND ITS SUBSIDIARIES
(A Saudi Joint Stock Company)
NOTES TO THE CONSOLIDATED FINANCIAL STATEMENTS (CONTINUED)
For the year ended 31 December 2018
(All amounts in Saudi Riyals ‘000 unless otherwise stated)
100
37 Commitments and contingencies (continued)
Finance leases
Group as a lessee
The Group has finance lease contracts for various items of plant and machinery.
Future minimum lease payments under finance lease contracts, together with the present value of the net
minimum lease payments, are as follows:
31 December 2018
Minimum
Payments
Present value
of payments
Within one year 138,709 85,502
After one year but not more than five years 497,430 348,325
More than five years 356,093 305,098
Total minimum lease payments 992,232 738,925
Less: amounts representing finance charges (253,307) -
Present value of minimum lease payments 738,925 738,925
31 December 2017
Minimum
Payments
Present value
of payments
Within one year 102,230 93,301
After one year but not more than five years 517,629 439,798
More than five years 564,113 331,914
Total minimum lease payments 1,183,972 865,013
Less: amounts representing finance charges (318,959) -
Present value of minimum lease payments 865,013 865,013
Group as a lessor
Future minimum lease receivables under these contracts, together with the present value of the net
minimum lease payments, are as follows:
31 December 2018
Minimum
lease receivable
Present value
Within one year 37,919 18,103
After one year but not more than five years 132,851 84,306
More than five years 242,150 153,666
Total minimum lease receivable 412,920 256,075
Less: amounts representing finance income (156,845) -
Present value of minimum lease receivable 256,075 256,075
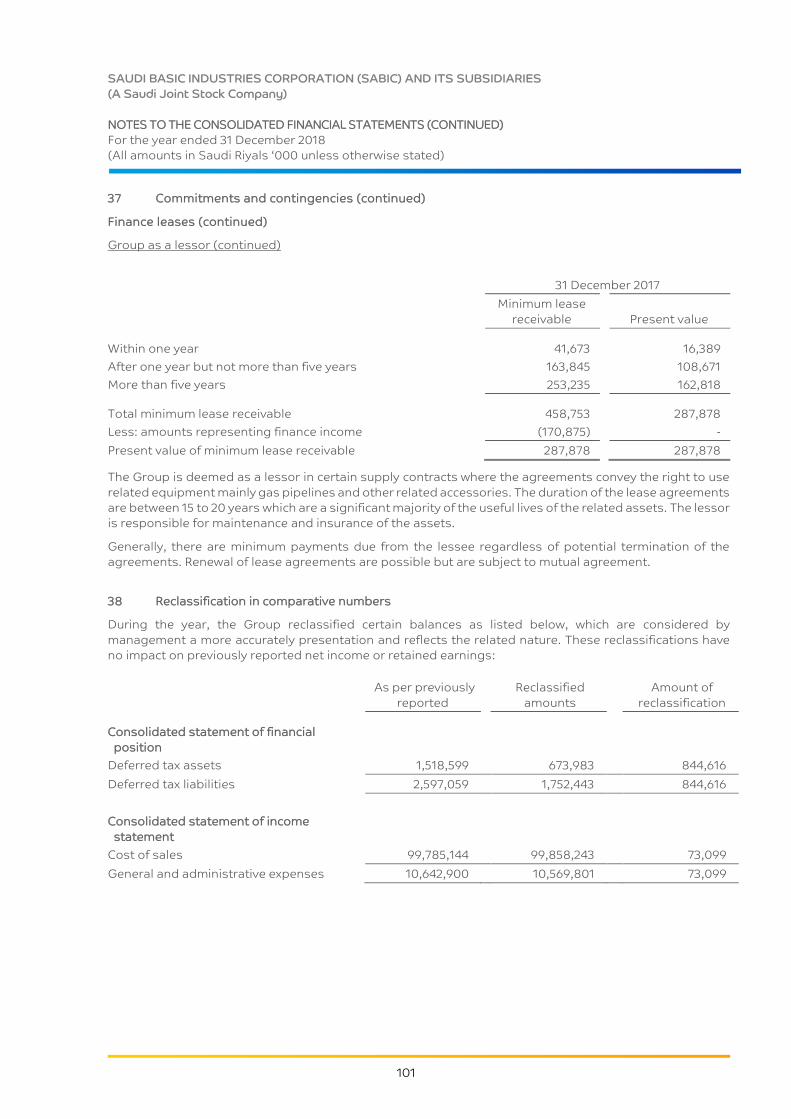
SAUDI BASIC INDUSTRIES CORPORATION (SABIC) AND ITS SUBSIDIARIES
(A Saudi Joint Stock Company)
NOTES TO THE CONSOLIDATED FINANCIAL STATEMENTS (CONTINUED)
For the year ended 31 December 2018
(All amounts in Saudi Riyals ‘000 unless otherwise stated)
101
37 Commitments and contingencies (continued)
Finance leases (continued)
Group as a lessor (continued)
31 December 2017
Minimum lease
receivable
Present value
Within one year 41,673 16,389
After one year but not more than five years 163,845 108,671
More than five years 253,235 162,818
Total minimum lease receivable 458,753 287,878
Less: amounts representing finance income (170,875) -
Present value of minimum lease receivable 287,878 287,878
The Group is deemed as a lessor in certain supply contracts where the agreements convey the right to use
related equipment mainly gas pipelines and other related accessories. The duration of the lease agreements
are between 15 to 20 years which are a significant majority of the useful lives of the related assets. The lessor
is responsible for maintenance and insurance of the assets.
Generally, there are minimum payments due from the lessee regardless of potential termination of the
agreements. Renewal of lease agreements are possible but are subject to mutual agreement.
38 Reclassification in comparative numbers
During the year, the Group reclassified certain balances as listed below, which are considered by
management a more accurately presentation and reflects the related nature. These reclassifications have
no impact on previously reported net income or retained earnings:
As per previously
reported
Reclassified
amounts
Amount of
reclassification
Consolidated statement of financial
position
Deferred tax assets 1,518,599 673,983 844,616
Deferred tax liabilities 2,597,059 1,752,443 844,616
Consolidated statement of income
statement
Cost of sales 99,785,144 99,858,243 73,099
General and administrative expenses 10,642,900 10,569,801 73,099
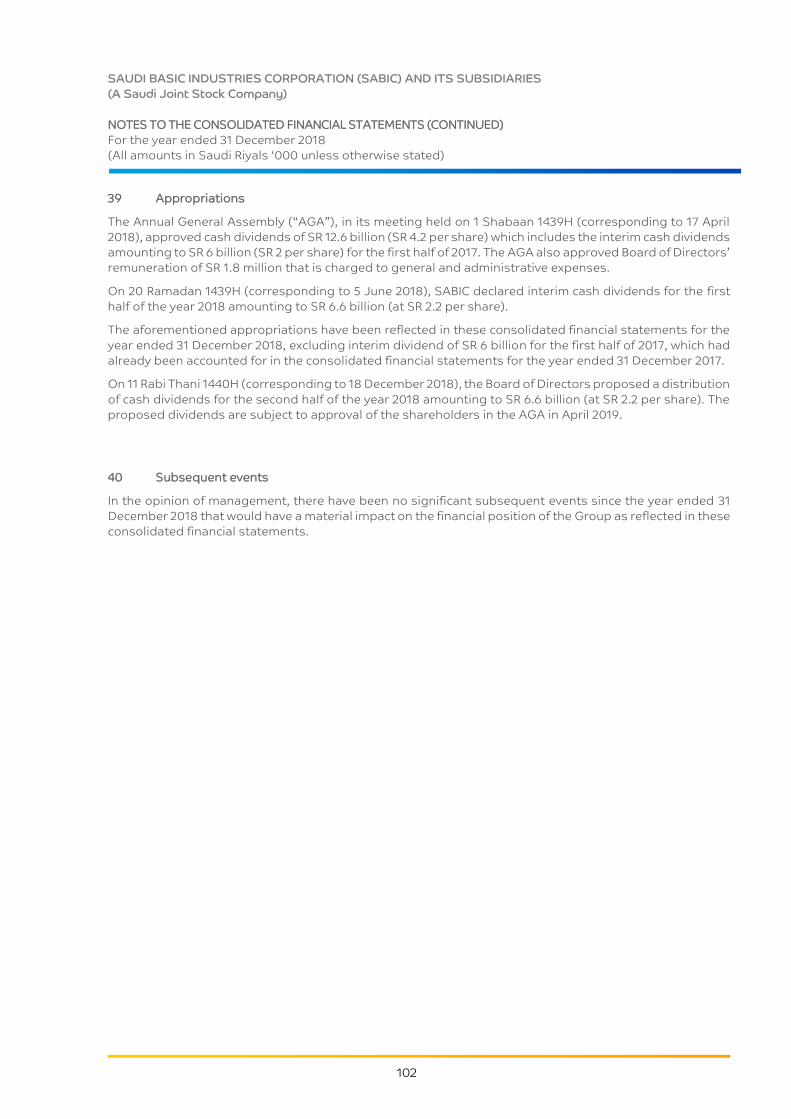
SAUDI BASIC INDUSTRIES CORPORATION (SABIC) AND ITS SUBSIDIARIES
(A Saudi Joint Stock Company)
NOTES TO THE CONSOLIDATED FINANCIAL STATEMENTS (CONTINUED)
For the year ended 31 December 2018
(All amounts in Saudi Riyals ‘000 unless otherwise stated)
102
39 Appropriations
The Annual General Assembly (“AGA”), in its meeting held on 1 Shabaan 1439H (corresponding to 17 April
2018), approved cash dividends of SR 12.6 billion (SR 4.2 per share) which includes the interim cash dividends
amounting to SR 6 billion (SR 2 per share) for the first half of 2017. The AGA also approved Board of Directors’
remuneration of SR 1.8 million that is charged to general and administrative expenses.
On 20 Ramadan 1439H (corresponding to 5 June 2018), SABIC declared interim cash dividends for the first
half of the year 2018 amounting to SR 6.6 billion (at SR 2.2 per share).
The aforementioned appropriations have been reflected in these consolidated financial statements for the
year ended 31 December 2018, excluding interim dividend of SR 6 billion for the first half of 2017, which had
already been accounted for in the consolidated financial statements for the year ended 31 December 2017.
On 11 Rabi Thani 1440H (corresponding to 18 December 2018), the Board of Directors proposed a distribution
of cash dividends for the second half of the year 2018 amounting to SR 6.6 billion (at SR 2.2 per share). The
proposed dividends are subject to approval of the shareholders in the AGA in April 2019.
40 Subsequent events
In the opinion of management, there have been no significant subsequent events since the year ended 31
December 2018 that would have a material impact on the financial position of the Group as reflected in these
consolidated financial statements.

SAUDI BASIC INDUSTRIES CORPORATION (SABIC) AND ITS SUBSIDIARIES
(A Saudi Joint Stock Company)
NOTES TO THE CONSOLIDATED FINANCIAL STATEMENTS (CONTINUED)
For the year ended 31 December 2018
(All amounts in Saudi Riyals ‘000 unless otherwise stated)
103
41 Subsidiaries
SABIC Group’s subsidiaries are set out below:
Notes:
The country of incorporation is also their principal place of business.
The principal activities of majority of the Group’s subsidiaries are manufacturing, marketing and distribution of
petrochemical, specialties and related products except for;
o SAFCO, AL BAYRONI and IBN AL-BAYTAR that are involved in agri-nutrients business; and
o HADEED is involved in metal business
YANSAB, SAFCO, and SAUDI KAYAN are public companies and listed on Saudi Stock Exchange (Tadawul)
SHROUQ; during 2018, the Group acquired 20% of the non-controlling interests in SHROUQ.
AR-RAZI; on 4 December 2018, the Group and Japan Saudi Arabia Methanol Company, Inc., the partner in AR-RAZI,
entered into an agreement for the Group to acquire 50% of JSMC’s share in AR-RAZI (equivalent to 25% in AR-RAZI)
for USD 0.15 billion. The transfer of share and payment are expected to be completed in 2019, subject to regulatory
approvals. As there is no change in control, the acquisition would be accounted for as an equity transaction.
SP. CHEM is 99% owned by Petrokemya and 1% owned by SIIC, and SOCC is 50% owned by SP. CHEM
SUKUK is currently in the process of liquidation
Country of
incorporation
%
Shareholding
(direct and indirect)
as at 31 December
2018
%
Shareholding
(direct and indirect)
as at 31 December
2017
SABIC Luxembourg S.à r.l. (“SLUX”) and its subsidiaries
(Note 41.1) Luxembourg 100.00 100.00
SABIC Industrial Investments Company (“SIIC”) and its
subsidiaries (Note 41.2) KSA 100.00 100.00
Arabian Petrochemical Company (“PETROKEMYA”) KSA 100.00 100.00
Saudi Iron and Steel Company (“HADEED”) KSA 100.00 100.00
SABIC Sukuk Company (“SUKUK”) KSA 100.00 100.00
SABIC Industrial Catalyst Company (“SABCAT”) KSA 100.00 100.00
Saudi Carbon Fibre Company (“SCFC”) KSA 100.00 100.00
SABIC Supply Chain Services Limited Company (“SSCS”) KSA 100.00 100.00
Saudi Petrochemical Company (“SADAF”) KSA 100.00 100.00
Saudi Japanese Acrylonitrile Company (“SHROUQ”) KSA 100.00 80.00
Saudi European Petrochemical Company (“IBN ZAHR”) KSA 80.00 80.00
Jubail United Petrochemical Company (“UNITED”) KSA 75.00 75.00
National Chemical Fertiliser Company (“IBN AL-BAYTAR”) KSA 71.50 71.50
National Industrial Gases Company (“GAS”) KSA 70.00 70.00
Yanbu National Petrochemical Company (“YANSAB”) KSA 51.95 51.95
Saudi Methanol Company (“AR-RAZI”) KSA 50.00 50.00
Al-Jubail Fertiliser Company (“AL BAYRONI”) KSA 50.00 50.00
Saudi Yanbu Petrochemical Company (“YANPET”) KSA 50.00 50.00
National Methanol Company (“IBN-SINA”) KSA 50.00 50.00
Eastern Petrochemical Company (“SHARQ”) KSA 50.00 50.00
Al-Jubail Petrochemical Company (“KEMYA”) KSA 50.00 50.00
Saudi Methacrylates Company (“SAMAC”) KSA 50.00 50.00
Arabian Industrial Fibers Company (“IBN RUSHD”) KSA 48.07 48.07
Saudi Arabian Fertiliser Company (“SAFCO”) KSA 42.99 42.99
Saudi Kayan Petrochemical Company (“SAUDI KAYAN”) KSA 35.00 35.00
Saudi Speciality Chemicals Company (“SP. CHEM”) KSA 100.00 100.00
Saudi Organometallic Chemicals Company (“SOCC”) KSA 50.00 50.00
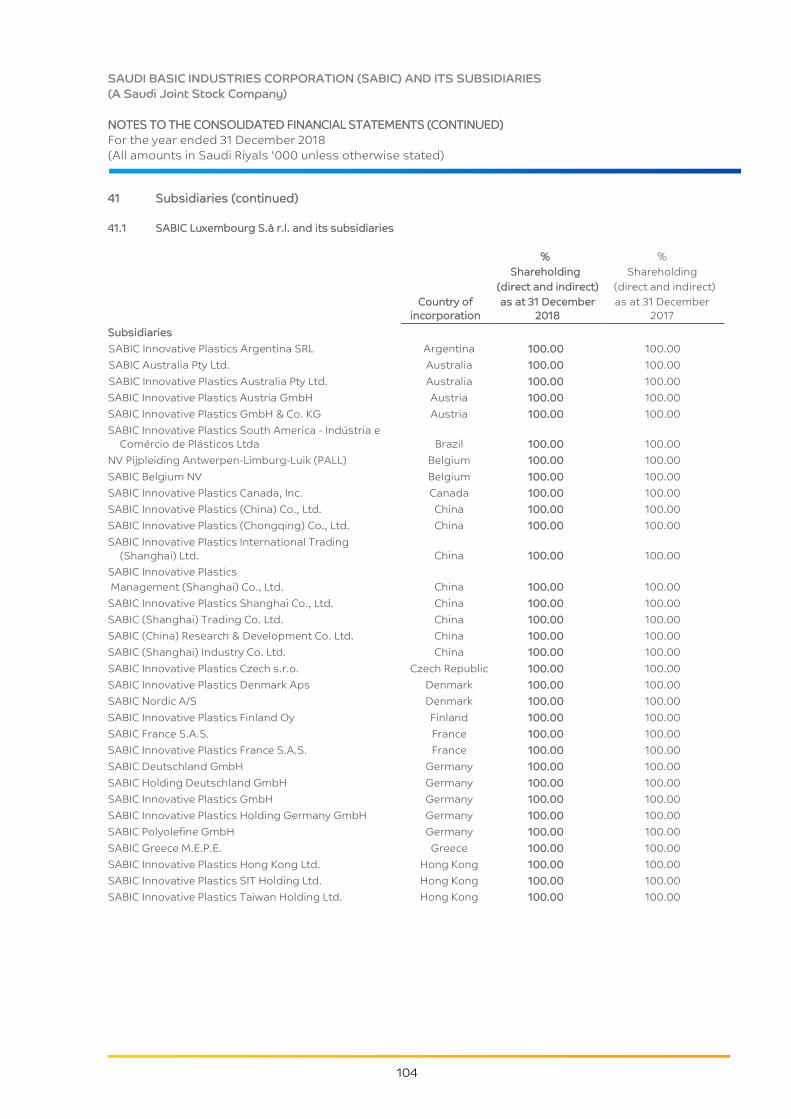
SAUDI BASIC INDUSTRIES CORPORATION (SABIC) AND ITS SUBSIDIARIES
(A Saudi Joint Stock Company)
NOTES TO THE CONSOLIDATED FINANCIAL STATEMENTS (CONTINUED)
For the year ended 31 December 2018
(All amounts in Saudi Riyals ‘000 unless otherwise stated)
104
41 Subsidiaries (continued)
41.1 SABIC Luxembourg S.à r.l. and its subsidiaries
Country of
incorporation
%
Shareholding
(direct and indirect)
as at 31 December
2018
%
Shareholding
(direct and indirect)
as at 31 December
2017
Subsidiaries
SABIC Innovative Plastics Argentina SRL Argentina 100.00 100.00
SABIC Australia Pty Ltd. Australia 100.00 100.00
SABIC Innovative Plastics Australia Pty Ltd. Australia 100.00 100.00
SABIC Innovative Plastics Austria GmbH Austria 100.00 100.00
SABIC Innovative Plastics GmbH & Co. KG Austria 100.00 100.00
SABIC Innovative Plastics South America - Indústria e
Comércio de Plásticos Ltda Brazil 100.00 100.00
NV Pijpleiding Antwerpen-Limburg-Luik (PALL) Belgium 100.00 100.00
SABIC Belgium NV Belgium 100.00 100.00
SABIC Innovative Plastics Canada, Inc. Canada 100.00 100.00
SABIC Innovative Plastics (China) Co., Ltd. China 100.00 100.00
SABIC Innovative Plastics (Chongqing) Co., Ltd. China 100.00 100.00
SABIC Innovative Plastics International Trading
(Shanghai) Ltd. China 100.00 100.00
SABIC Innovative Plastics
Management (Shanghai) Co., Ltd. China 100.00 100.00
SABIC Innovative Plastics Shanghai Co., Ltd. China 100.00 100.00
SABIC (Shanghai) Trading Co. Ltd. China 100.00 100.00
SABIC (China) Research & Development Co. Ltd. China 100.00 100.00
SABIC (Shanghai) Industry Co. Ltd. China 100.00 100.00
SABIC Innovative Plastics Czech s.r.o. Czech Republic 100.00 100.00
SABIC Innovative Plastics Denmark Aps Denmark 100.00 100.00
SABIC Nordic A/S Denmark 100.00 100.00
SABIC Innovative Plastics Finland Oy Finland 100.00 100.00
SABIC France S.A.S. France 100.00 100.00
SABIC Innovative Plastics France S.A.S. France 100.00 100.00
SABIC Deutschland GmbH Germany 100.00 100.00
SABIC Holding Deutschland GmbH Germany 100.00 100.00
SABIC Innovative Plastics GmbH Germany 100.00 100.00
SABIC Innovative Plastics Holding Germany GmbH Germany 100.00 100.00
SABIC Polyolefine GmbH Germany 100.00 100.00
SABIC Greece M.E.P.E. Greece 100.00 100.00
SABIC Innovative Plastics Hong Kong Ltd. Hong Kong 100.00 100.00
SABIC Innovative Plastics SIT Holding Ltd. Hong Kong 100.00 100.00
SABIC Innovative Plastics Taiwan Holding Ltd. Hong Kong 100.00 100.00
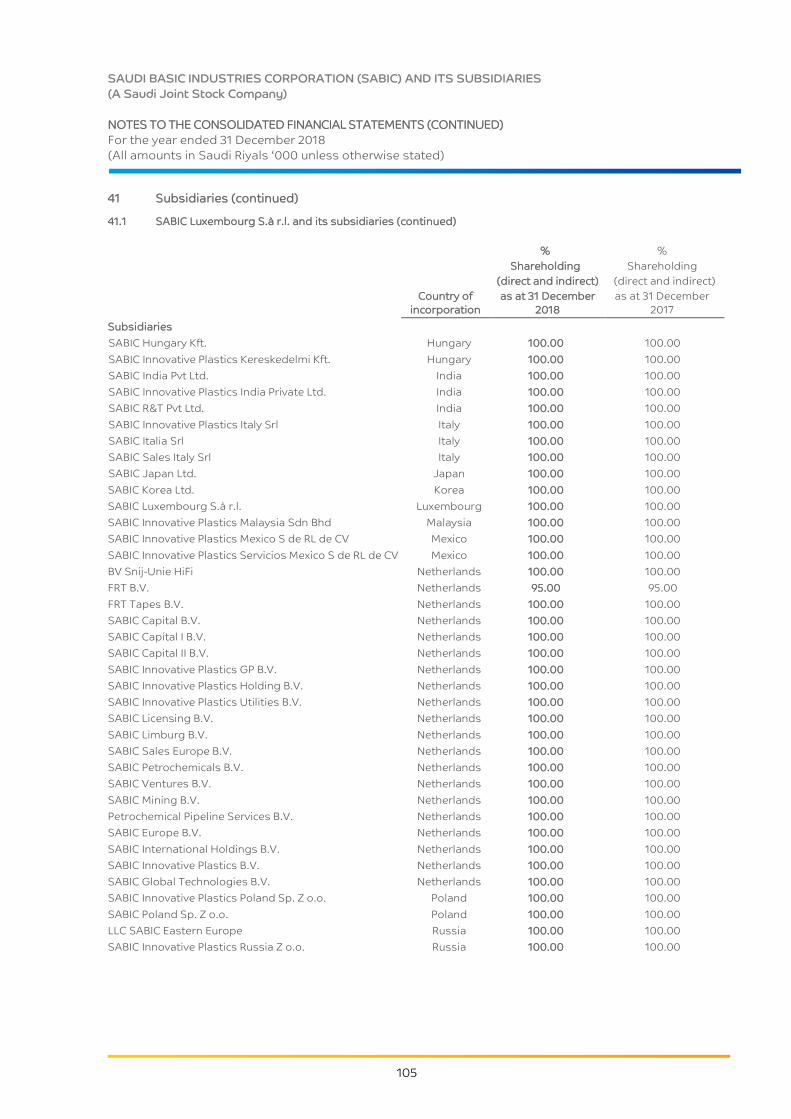
SAUDI BASIC INDUSTRIES CORPORATION (SABIC) AND ITS SUBSIDIARIES
(A Saudi Joint Stock Company)
NOTES TO THE CONSOLIDATED FINANCIAL STATEMENTS (CONTINUED)
For the year ended 31 December 2018
(All amounts in Saudi Riyals ‘000 unless otherwise stated)
105
41 Subsidiaries (continued)
41.1 SABIC Luxembourg S.à r.l. and its subsidiaries (continued)
Country of
incorporation
%
Shareholding
(direct and indirect)
as at 31 December
2018
%
Shareholding
(direct and indirect)
as at 31 December
2017
Subsidiaries
SABIC Hungary Kft. Hungary 100.00 100.00
SABIC Innovative Plastics Kereskedelmi Kft. Hungary 100.00 100.00
SABIC India Pvt Ltd. India 100.00 100.00
SABIC Innovative Plastics India Private Ltd. India 100.00 100.00
SABIC R&T Pvt Ltd. India 100.00 100.00
SABIC Innovative Plastics Italy Srl Italy 100.00 100.00
SABIC Italia Srl Italy 100.00 100.00
SABIC Sales Italy Srl Italy 100.00 100.00
SABIC Japan Ltd. Japan 100.00 100.00
SABIC Korea Ltd. Korea 100.00 100.00
SABIC Luxembourg S.à r.l. Luxembourg 100.00 100.00
SABIC Innovative Plastics Malaysia Sdn Bhd Malaysia 100.00 100.00
SABIC Innovative Plastics Mexico S de RL de CV Mexico 100.00 100.00
SABIC Innovative Plastics Servicios Mexico S de RL de CV Mexico 100.00 100.00
BV Snij-Unie HiFi Netherlands 100.00 100.00
FRT B.V. Netherlands 95.00 95.00
FRT Tapes B.V. Netherlands 100.00 100.00
SABIC Capital B.V. Netherlands 100.00 100.00
SABIC Capital I B.V. Netherlands 100.00 100.00
SABIC Capital II B.V. Netherlands 100.00 100.00
SABIC Innovative Plastics GP B.V. Netherlands 100.00 100.00
SABIC Innovative Plastics Holding B.V. Netherlands 100.00 100.00
SABIC Innovative Plastics Utilities B.V. Netherlands 100.00 100.00
SABIC Licensing B.V. Netherlands 100.00 100.00
SABIC Limburg B.V. Netherlands 100.00 100.00
SABIC Sales Europe B.V. Netherlands 100.00 100.00
SABIC Petrochemicals B.V. Netherlands 100.00 100.00
SABIC Ventures B.V. Netherlands 100.00 100.00
SABIC Mining B.V. Netherlands 100.00 100.00
Petrochemical Pipeline Services B.V. Netherlands 100.00 100.00
SABIC Europe B.V. Netherlands 100.00 100.00
SABIC International Holdings B.V. Netherlands 100.00 100.00
SABIC Innovative Plastics B.V. Netherlands 100.00 100.00
SABIC Global Technologies B.V. Netherlands 100.00 100.00
SABIC Innovative Plastics Poland Sp. Z o.o. Poland 100.00 100.00
SABIC Poland Sp. Z o.o. Poland 100.00 100.00
LLC SABIC Eastern Europe Russia 100.00 100.00
SABIC Innovative Plastics Russia Z o.o. Russia 100.00 100.00

SAUDI BASIC INDUSTRIES CORPORATION (SABIC) AND ITS SUBSIDIARIES
(A Saudi Joint Stock Company)
NOTES TO THE CONSOLIDATED FINANCIAL STATEMENTS (CONTINUED)
For the year ended 31 December 2018
(All amounts in Saudi Riyals ‘000 unless otherwise stated)
106
41 Subsidiaries (continued)
41.1 SABIC Luxembourg S.à r.l. and its subsidiaries (continued)
Note:
Black Diamonds; as the Group acquired control over Black Diamond as at 1 January 2018 and due to change in control,
this equity investment is now consolidated from 1 January 2018. (Note 9)
Country of
incorporation
%
Shareholding
(direct and indirect)
as at 31 December
2018
%
Shareholding
(direct and indirect)
as at 31 December
2017
Subsidiaries
SABIC Innovative Plastics (SEA) Pte. Ltd. Singapore 100.00 100.00
SABIC Innovative Plastics Holding Singapore Pte. Ltd. Singapore 100.00 100.00
SABIC Innovative Plastics Singapore Pte. Ltd. Singapore 100.00 100.00
SABIC Asia Pacific Pte Ltd Singapore 100.00 100.00
SABIC Innovative Plastics Espana ScpA Spain 100.00 100.00
SABIC Innovative Plastics GP BV, Sociedad en Comandita Spain 100.00 100.00
SABIC Sales Spain SL Spain 100.00 100.00
SABIC Marketing Ibérica S.A. Spain 100.00 100.00
Saudi Innovative Plastics Sweden AB Sweden 100.00 100.00
SABIC Innovative Plastics (Thailand) Co. Ltd. Thailand 100.00 100.00
SABIC Global Ltd. UK 100.00 100.00
SABIC Tees Holdings Ltd. UK 100.00 100.00
SABIC Innovative Plastics ABS UK Ltd. UK 100.00 100.00
SABIC Innovative Plastics Ltd. UK 100.00 100.00
SABIC UK Ltd. UK 100.00 100.00
SABIC UK Pension Trustee Ltd. UK 100.00 100.00
SABIC UK Petrochemicals Ltd. UK 100.00 100.00
Exatec, LLC US 100.00 100.00
Mt. Vernon Phenol Plant Partner US 51.00 51.00
SABIC Americas Inc. US 100.00 100.00
SABIC Innovative Plastics Holding US LP US 100.00 100.00
SABIC Innovative Plastics Mt. Vernon, LLC US 100.00 100.00
SABIC Innovative Plastics US LLC US 100.00 100.00
SABIC Petrochemicals Holding US, Inc. US 100.00 100.00
SABIC Ventures US Holdings LLC US 100.00 100.00
SABIC US Projects LLC US 100.00 100.00
SABIC Uruguay SA Uruguay 100.00 100.00
SABIC Vietnam Ltd. Vietnam 100.00 100.00
SABIC Americas Growth LLC US 100.00 -
SABIC US Methanol LLC US 100.00 -
Black Diamonds Structures, LL US 50.1 -

SAUDI BASIC INDUSTRIES CORPORATION (SABIC) AND ITS SUBSIDIARIES
(A Saudi Joint Stock Company)
NOTES TO THE CONSOLIDATED FINANCIAL STATEMENTS (CONTINUED)
For the year ended 31 December 2018
(All amounts in Saudi Riyals ‘000 unless otherwise stated)
107
41 Subsidiaries (continued)
41.2 SIIC Group Subsidiaries
Notes:
GMC LLC was established during 2018 and is engaged in providing administrative services to the Group’s global
assignees and GMC is currently under liquidation.
CHEMTANK; during 2018, management has decided to change the legal name of JCSCC as “CHEMTANK”.
Country of
incorporation
%
Shareholding
(direct and indirect)
as at 31 December
2018
%
Shareholding
(direct and indirect)
as at 31 December
2017
SABCAP Insurance Limited (“SABCAP”) Guernsey 100.00 100.00
SABIC Petrokemya Ticaret Limited (“SABIC TURKEY”) Turkey 100.00 100.00
SABIC Middle East Offshore Company (“SABIC MIDDLE
EAST”) Lebanon 100.00 100.00
SABIC South Africa South Africa 100.00 100.00
SABIC Africa for Trading & Marketing (“SABIC AFRICA”) Egypt 100.00 100.00
SABIC Morocco Morocco 100.00 100.00
SABIC Global Mobility Company (“GMC”) UAE 100.00 100.00
SABIC Mobility Company (“GMC LLC”) UAE 100.00 --
SABIC Tunisia Tunisia 100.00 100.00
SABIC Kenya Kenya 100.00 100.00
SABIC (Pvt.) Pakistan Pakistan 100.00 100.00
International Shipping and Transportation Co. (“ISTC”) KSA 99.00 99.00
SABIC Terminal Services Company (“SABTANK”) KSA 90.00 90.00
Jubail Chemical Storage and Services Company
(“CHEMTANK”) KSA 75.00 75.00

SAUDI BASIC INDUSTRIES CORPORATION (SABIC) AND ITS SUBSIDIARIES
(A Saudi Joint Stock Company)
NOTES TO THE CONSOLIDATED FINANCIAL STATEMENTS (CONTINUED)
For the year ended 31 December 2018
(All amounts in Saudi Riyals ‘000 unless otherwise stated)
108
42 Investment in associates and joint arrangements
Below is the listing of the Group’s investment in associates and joint arrangements. These are strategic investments for
the Group.
Notes:
The country of incorporation is also their principal place of business.
CLARIANT; during 2018, SABIC acquired 24.99% ownership in Clariant, a global specialty chemical company listed at
the Swiss Stock Exchange. (Note 9.1)
BLACK DIAMONDS; as the Group acquired control over Black Diamond as at 1 January 2018 and due to change in
control, this equity investment is now consolidated from 1 January 2018. (Note 9)
SLUX Group participates in following Joint Operations:
o USG (Geleen, the Netherlands), which is operated jointly with other stakeholders to produce utilities for a
production site
o GCGV (Houston, USA), a cooperation with ExxonMobil Chemical to investigate the feasibility of constructing an
ethane steam cracking facility and downstream plants.
The Group holds a 50% share in each of these joint operations and controls them jointly with the respective partners.
The partners ensure the ongoing financing of the companies, either by the utilities directly sold to the partners or
sharing the costs.
Country of
incorporation
Principal activities
%
Shareholding
(direct and
indirect)
as at 31
December 2018
%
Shareholding
(direct and
indirect)
as at 31
December 2017
Associates
Gulf Petrochemical Industries Company
(“GPIC”) Bahrain Petrochemical 33.33 33.33
Gulf Aluminium Rolling Mills Company
(“GARMCO”) Bahrain Aluminium 30.40 30.40
Ma’aden Phosphate Company (“MPC”) KSA Agri-Nutrients 30.00 30.00
Power and Water Utilities Company for Jubail
and Yanbu (“MARAFIQ”) KSA Utilities 24.81 24.81
Aluminium Bahrain BSC (“ALBA”) Bahrain Aluminium 20.62 20.62
National Chemical Carrier Company (“NCC”) KSA Transportation 20.00 20.00
Ma’aden Wa’ad Al Shamal Phosphate
Company (“MWSPC”) KSA Agri-Nutrients 15.00 15.00
Saudi Arabian Industrial Investment Company
(“DUSSUR”) KSA Investments 25.00 25.00
Clariant AG (“CLARIANT”) Switzerland Specialty chemical 24.99 -
Cosmar Inc. (“COSMAR”) USA Petrochemical 50.00 50.00
Black Diamonds Structures, LLC (“BLACK
DIAMONDS”) USA Specialities - 50.00
Joint Ventures
SINOPEC/SABIC Tianjin Petrochemical
Company Limited China Petrochemical
50.00
50.00
SABIC SK Nexelene Company Singapore Petrochemical 50.00 50.00
Joint Operations
Utility Support Group (“USG”) B.V. Netherlands Petrochemical 50.00 50.00
Gulf Coast Growth Venture LLC (“GCGV”) USA Petrochemical 50.00 50.00