Embed Size (px)
Citation preview
Saudi Basic Industries Corporation 1
Market Data Bloomberg Code: SABIC AB Reuters Code: 2010.SE CMP (09th May 2010): SR102 O/S (mn): 3,000 Mkt Cap (SRmn): 306,000 Mkt Cap (US$mn): 81,600 P/E 2010e (x): 11.6 P/Bv 2010e (x): 2.3
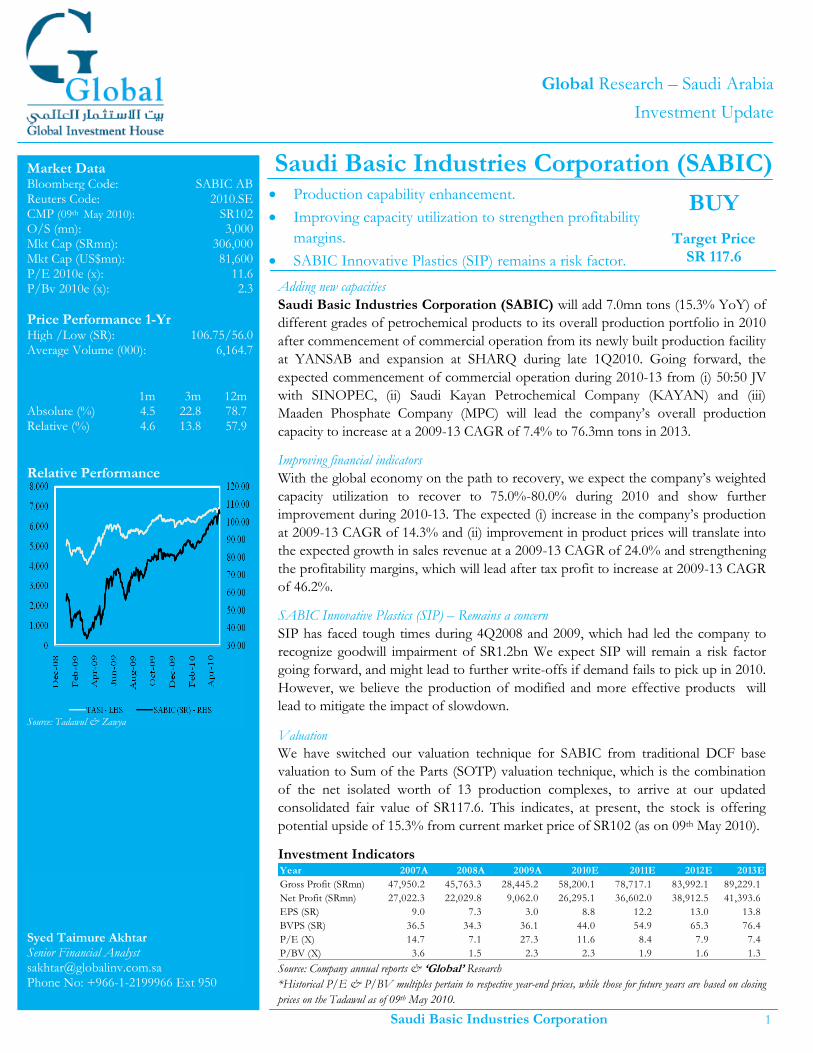
Price Performance 1-Yr High /Low (SR): 106.75/56.0 Average Volume (000): 6,164.7
1m 3m 12m Absolute (%) 4.5 22.8 78.7 Relative (%) 4.6 13.8 57.9
Relative Performance
Source: Tadawul & Zawya
Syed Taimure Akhtar Senior Financial Analyst [email protected] Phone No: +966-1-2199966 Ext 950
Saudi Basic Industries Corporation (SABIC) Production capability enhancement.
Improving capacity utilization to strengthen profitability
margins.
SABIC Innovative Plastics (SIP) remains a risk factor.
Global Research – Saudi Arabia
Investment Update
BUY
Target Price SR 117.6
Adding new capacities
Saudi Basic Industries Corporation (SABIC) will add 7.0mn tons (15.3% YoY) of
different grades of petrochemical products to its overall production portfolio in 2010
after commencement of commercial operation from its newly built production facility
at YANSAB and expansion at SHARQ during late 1Q2010. Going forward, the
expected commencement of commercial operation during 2010-13 from (i) 50:50 JV
with SINOPEC, (ii) Saudi Kayan Petrochemical Company (KAYAN) and (iii)
Maaden Phosphate Company (MPC) will lead the company’s overall production
capacity to increase at a 2009-13 CAGR of 7.4% to 76.3mn tons in 2013.
Improving financial indicators
With the global economy on the path to recovery, we expect the company’s weighted
capacity utilization to recover to 75.0%-80.0% during 2010 and show further
improvement during 2010-13. The expected (i) increase in the company’s production
at 2009-13 CAGR of 14.3% and (ii) improvement in product prices will translate into
the expected growth in sales revenue at a 2009-13 CAGR of 24.0% and strengthening
the profitability margins, which will lead after tax profit to increase at 2009-13 CAGR
of 46.2%.
SABIC Innovative Plastics (SIP) – Remains a concern
SIP has faced tough times during 4Q2008 and 2009, which had led the company to
recognize goodwill impairment of SR1.2bn We expect SIP will remain a risk factor
going forward, and might lead to further write-offs if demand fails to pick up in 2010.
However, we believe the production of modified and more effective products will
lead to mitigate the impact of slowdown.
Valuation
We have switched our valuation technique for SABIC from traditional DCF base
valuation to Sum of the Parts (SOTP) valuation technique, which is the combination
of the net isolated worth of 13 production complexes, to arrive at our updated
consolidated fair value of SR117.6. This indicates, at present, the stock is offering
potential upside of 15.3% from current market price of SR102 (as on 09th May 2010).
Investment Indicators Year 2007A 2008A 2009A 2010E 2011E 2012E 2013E
Gross Profit (SRmn) 47,950.2 45,763.3 28,445.2 58,200.1 78,717.1 83,992.1 89,229.1
Net Profit (SRmn) 27,022.3 22,029.8 9,062.0 26,295.1 36,602.0 38,912.5 41,393.6
EPS (SR) 9.0 7.3 3.0 8.8 12.2 13.0 13.8
BVPS (SR) 36.5 34.3 36.1 44.0 54.9 65.3 76.4
P/E (X) 14.7 7.1 27.3 11.6 8.4 7.9 7.4
P/BV (X) 3.6 1.5 2.3 2.3 1.9 1.6 1.3 Source: Company annual reports & ‘Global’ Research
*Historical P/E & P/BV multiples pertain to respective year-end prices, while those for future years are based on closing
prices on the Tadawul as of 09th May 2010.
Global Research – Saudi Arabia Global Investment House
2 Saudi Basic Industries Corporation May 2010
Valuation & Recommendation
SOTP DCF Method Our Sum-Of-The-Parts (SOTP) DCF based valuation for the company is mainly based on the
isolated net-worth of 13 production complexes, mainly located inside the Kingdom. We have relied
on the consolidated net-worth of the remaining complexes due to limited availability of information.
The main reason to switch our valuation on the company from conventional-DCF to SOTP-DCF
based valuation is to give more in-depth valuation to investors. We have used same the following
assumptions to value all the production complexes:
A risk-free rate of 5.6% has been assumed.
A market risk premium of 6.0% has been assumed.
The cost of equity for SAFCO, YANSAB and KAYAN are different and based on their respective
capital structure and the terminal growth is also based on the future prospects of respective
industries. In addition, for other complexes and units, we have used the capital structure of SABIC.
Based on our future earnings projections and valuation assumptions, we have arrived at SOTP-DCF
base value of SR117.6 for SABIC.
SOTP-DCF Base Valuation
2010(E) 2011(E) 2012(E) 2013(E)
YANSAB*
(75.1) 1,321.0 1,472.5 1,605.8
KAYAN**
(4,117.1) (980.1) 1,600.6 1,810.0
Ibn Zahr**
492.5 1,558.8 1,640.2 1,767.1
SHARQ**
633.0 2,003.5 2,108.1 2,271.2
Ar-Razi**
771.9 2,443.3 2,570.8 2,769.8
United**
363.6 1,150.8 1,210.9 1,304.6
SADAF**
712.5 2,255.1 2,372.9 2,556.5
Ibn Sina**
324.2 1,026.2 1,079.7 1,163.3
KEMYA**
303.8 961.7 1,011.9 1,090.2
Petrokemya**
820.7 2,597.7 2,733.3 2,944.9
Other Complexes**
7,884.0 13,001.2 10,897.9 11,620.8
Free Cash Flows-Petrochemical
8,114.0 27,339.1 28,698.7 30,904.4
SAFCO*
2,087.3 2,399.6 2,528.8 2,541.5
Other Fertilizer**
(4,882.6) 625.1 2,088.2 1,883.5
Free Cash Flows-Fertilizer
(2,795.3) 3,024.7 4,617.0 4,424.9
Free Cash Flows-Steel**
(1,004.3) (181.7) (5.3) 97.4
Free Cash Flows-Corporate**
198.8 827.9 922.9 935.5
Free Cash Flow-Consolidated
4,513.3 31,009.9 34,233.3 36,362.1
Primary Value-Consolidated
3,035.7 24,811.1 24,833.4 23,860.8
Terminal Value – Consolidated 461,686.9 Discounted Terminal Value-Consolidated 316,112.3 Overall Company’s NPV 392,653.3 Long-Term Debt (107,575.4) Cash 59,422.1 Investments 8,423.9 Net Worth 352,923.8
Outstanding Shares (000) 3,000,000 Fair Value 117.6 Source: Global Research *SABIC has 550.% & 43.0% stakes in YANSAB & SAFCO , respectively **Adjusted with minority interest
Valuation Based on our valuations, at present, the stock is trading at a prospective 2010 and 2011 P/E of 11.6x
and 8.4x, respectively, and offering a potential upside of 15.3% from the current market price of
SR102 as on 09th May 2010. We, therefore, recommend BUY for the stock.
Global Research – Saudi Arabia Global Investment House
3 Saudi Basic Industries Corporation May 2010
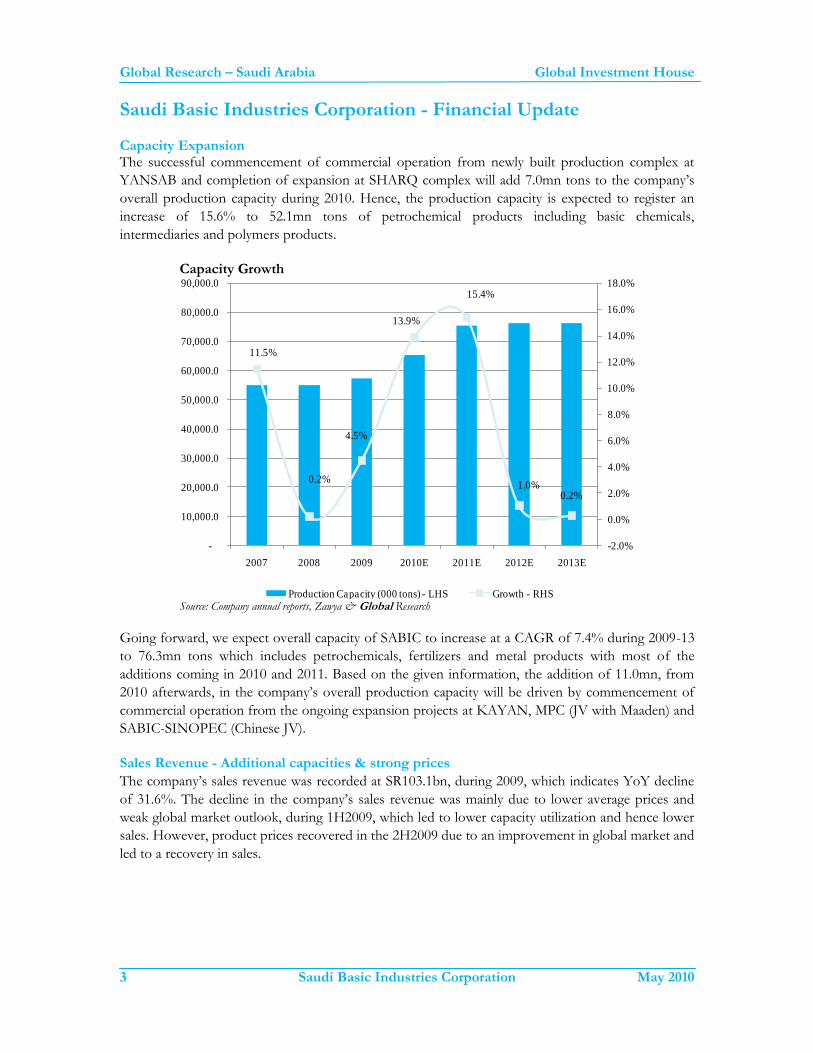
Saudi Basic Industries Corporation - Financial Update Capacity Expansion The successful commencement of commercial operation from newly built production complex at
YANSAB and completion of expansion at SHARQ complex will add 7.0mn tons to the company’s
overall production capacity during 2010. Hence, the production capacity is expected to register an
increase of 15.6% to 52.1mn tons of petrochemical products including basic chemicals,
intermediaries and polymers products.
Capacity Growth
11.5%
0.2%
4.5%
13.9%
15.4%
1.0%0.2%
-2.0%
0.0%
2.0%
4.0%
6.0%
8.0%
10.0%
12.0%
14.0%
16.0%
18.0%
-
10,000.0
20,000.0
30,000.0
40,000.0
50,000.0
60,000.0
70,000.0
80,000.0
90,000.0
2007 2008 2009 2010E 2011E 2012E 2013E
Production Capacity (000 tons) - LHS Growth - RHS Source: Company annual reports, Zawya & Global Research
Going forward, we expect overall capacity of SABIC to increase at a CAGR of 7.4% during 2009-13
to 76.3mn tons which includes petrochemicals, fertilizers and metal products with most of the
additions coming in 2010 and 2011. Based on the given information, the addition of 11.0mn, from
2010 afterwards, in the company’s overall production capacity will be driven by commencement of
commercial operation from the ongoing expansion projects at KAYAN, MPC (JV with Maaden) and
SABIC-SINOPEC (Chinese JV).
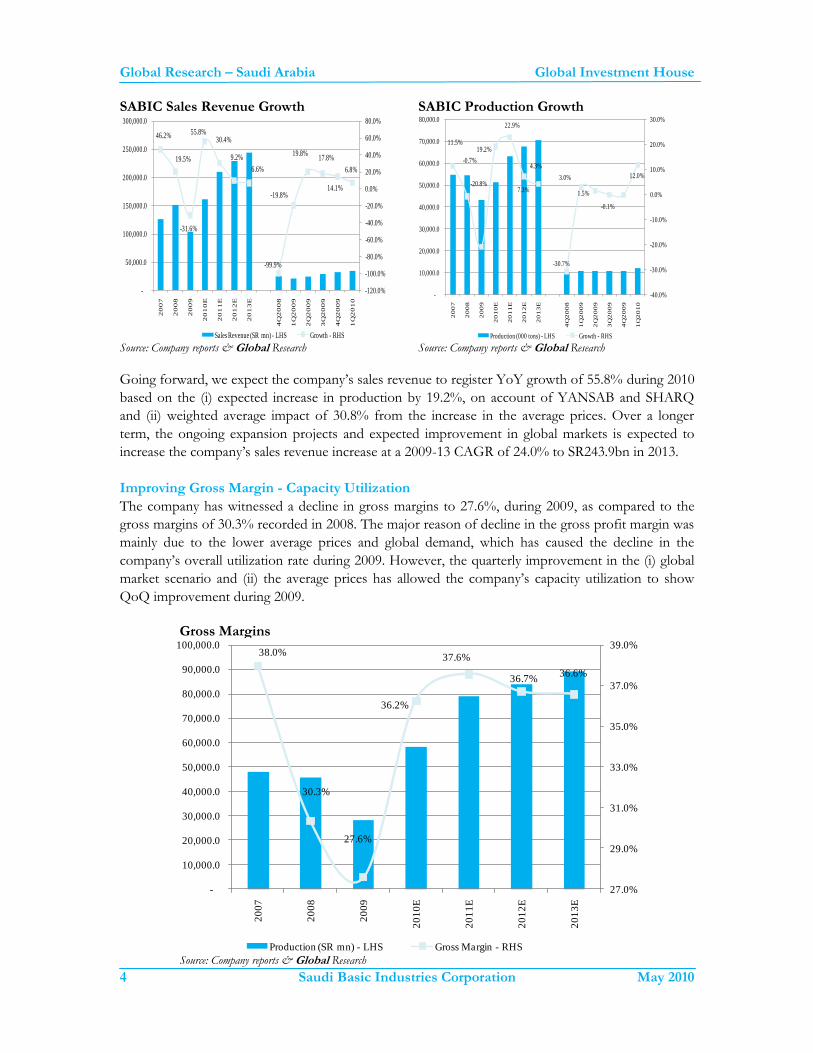
Sales Revenue - Additional capacities & strong prices
The company’s sales revenue was recorded at SR103.1bn, during 2009, which indicates YoY decline
of 31.6%. The decline in the company’s sales revenue was mainly due to lower average prices and
weak global market outlook, during 1H2009, which led to lower capacity utilization and hence lower
sales. However, product prices recovered in the 2H2009 due to an improvement in global market and
led to a recovery in sales.
Global Research – Saudi Arabia Global Investment House
4 Saudi Basic Industries Corporation May 2010
SABIC Sales Revenue Growth SABIC Production Growth
46.2%
19.5%
-31.6%
55.8%30.4%
9.2%
6.6%
-99.9%
-19.8%
19.8%17.8%
14.1%
6.8%
-120.0%
-100.0%
-80.0%
-60.0%
-40.0%
-20.0%
0.0%
20.0%
40.0%
60.0%
80.0%
-
50,000.0
100,000.0
150,000.0
200,000.0
250,000.0
300,000.0
20
07
20
08
20
09
20
10
E
20
11
E
20
12
E
20
13
E
4Q
20
08
1Q
20
09
2Q
20
09
3Q
20
09
4Q
20
09
1Q
20
10
Sales Revenue (SR mn) - LHS Growth - RHS
11.5%
-0.7%
-20.8%
19.2%
22.9%
7.3%
4.3%
-30.7%
3.0%
1.5%
-0.1%
12.0%
-40.0%
-30.0%
-20.0%
-10.0%
0.0%
10.0%
20.0%
30.0%
-
10,000.0
20,000.0
30,000.0
40,000.0
50,000.0
60,000.0
70,000.0
80,000.0
20
07
20
08
20
09
20
10
E
20
11
E
20
12
E
20
13
E
4Q
20
08
1Q
20
09
2Q
20
09
3Q
20
09
4Q
20
09
1Q
20
10
Production (000 tons) - LHS Growth - RHS Source: Company reports & Global Research Source: Company reports & Global Research
Going forward, we expect the company’s sales revenue to register YoY growth of 55.8% during 2010
based on the (i) expected increase in production by 19.2%, on account of YANSAB and SHARQ
and (ii) weighted average impact of 30.8% from the increase in the average prices. Over a longer
term, the ongoing expansion projects and expected improvement in global markets is expected to
increase the company’s sales revenue increase at a 2009-13 CAGR of 24.0% to SR243.9bn in 2013.
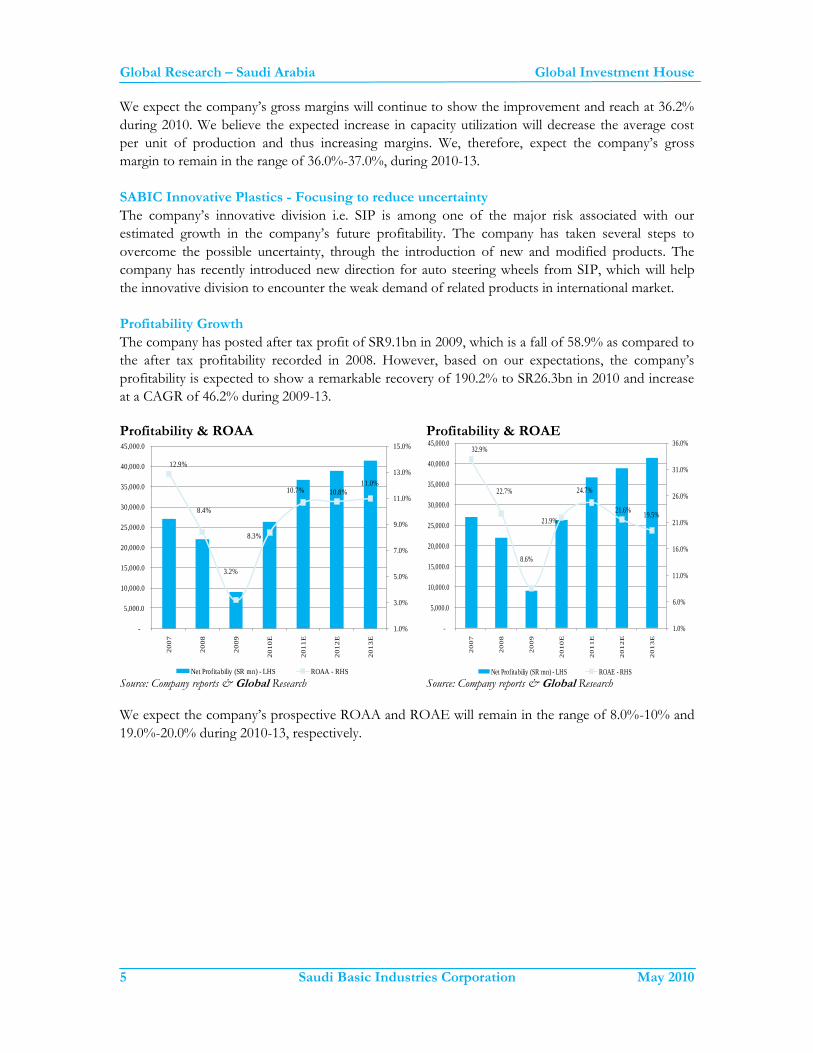
Improving Gross Margin - Capacity Utilization
The company has witnessed a decline in gross margins to 27.6%, during 2009, as compared to the
gross margins of 30.3% recorded in 2008. The major reason of decline in the gross profit margin was
mainly due to the lower average prices and global demand, which has caused the decline in the
company’s overall utilization rate during 2009. However, the quarterly improvement in the (i) global
market scenario and (ii) the average prices has allowed the company’s capacity utilization to show
QoQ improvement during 2009.
Gross Margins
38.0%
30.3%
27.6%
36.2%
37.6%
36.7%36.6%
27.0%
29.0%
31.0%
33.0%
35.0%
37.0%
39.0%
-
10,000.0
20,000.0
30,000.0
40,000.0
50,000.0
60,000.0
70,000.0
80,000.0
90,000.0
100,000.0
20
07
20
08
20
09
20
10
E
20
11
E
20
12
E
20
13
E
Production (SR mn) - LHS Gross Margin - RHS Source: Company reports & Global Research
Global Research – Saudi Arabia Global Investment House
5 Saudi Basic Industries Corporation May 2010
We expect the company’s gross margins will continue to show the improvement and reach at 36.2%
during 2010. We believe the expected increase in capacity utilization will decrease the average cost
per unit of production and thus increasing margins. We, therefore, expect the company’s gross
margin to remain in the range of 36.0%-37.0%, during 2010-13.
SABIC Innovative Plastics - Focusing to reduce uncertainty
The company’s innovative division i.e. SIP is among one of the major risk associated with our
estimated growth in the company’s future profitability. The company has taken several steps to
overcome the possible uncertainty, through the introduction of new and modified products. The
company has recently introduced new direction for auto steering wheels from SIP, which will help
the innovative division to encounter the weak demand of related products in international market.
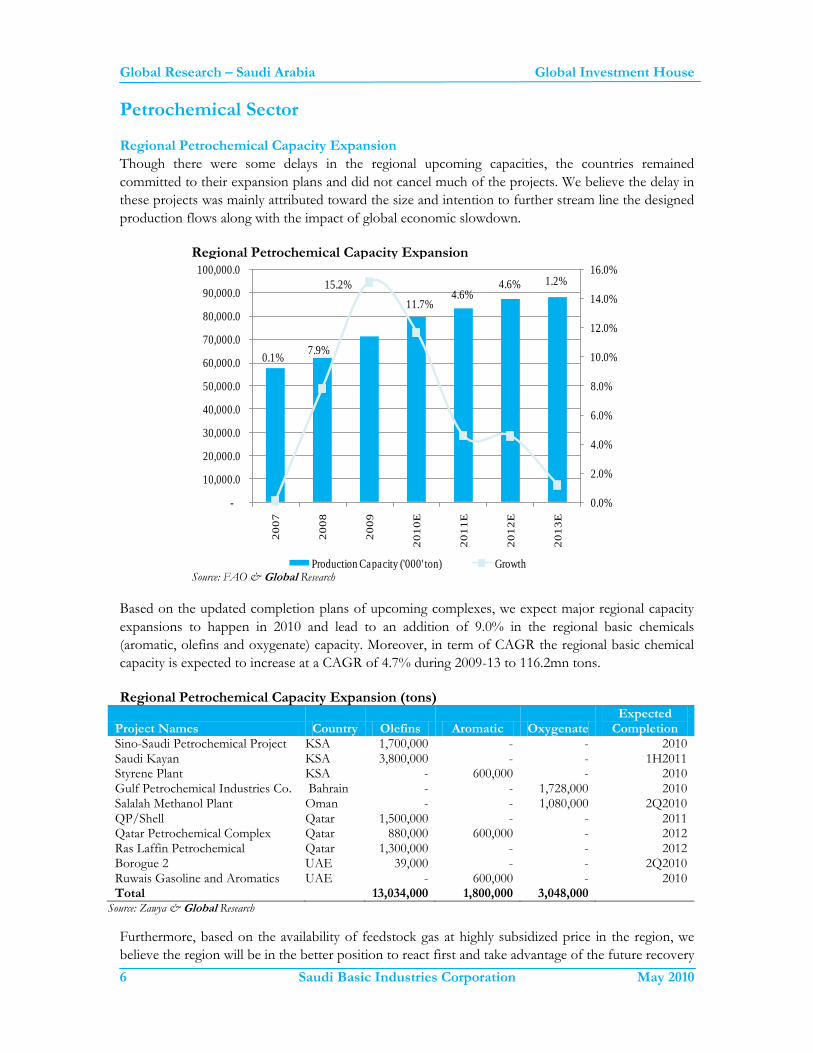
Profitability Growth
The company has posted after tax profit of SR9.1bn in 2009, which is a fall of 58.9% as compared to
the after tax profitability recorded in 2008. However, based on our expectations, the company’s
profitability is expected to show a remarkable recovery of 190.2% to SR26.3bn in 2010 and increase
at a CAGR of 46.2% during 2009-13.
Profitability & ROAA Profitability & ROAE
12.9%
8.4%
3.2%
8.3%
10.7% 10.8%
11.0%
1.0%
3.0%
5.0%
7.0%
9.0%
11.0%
13.0%
15.0%
-
5,000.0
10,000.0
15,000.0
20,000.0
25,000.0
30,000.0
35,000.0
40,000.0
45,000.0
20
07
20
08
20
09
20
10
E
20
11
E
20
12
E
20
13
E
Net Profitabiliy (SR mn) - LHS ROAA - RHS
32.9%
22.7%
8.6%
21.9%
24.7%
21.6%19.5%
1.0%
6.0%
11.0%
16.0%
21.0%
26.0%
31.0%
36.0%
-
5,000.0
10,000.0
15,000.0
20,000.0
25,000.0
30,000.0
35,000.0
40,000.0
45,000.0
20
07
20
08
20
09
20
10
E
20
11
E
20
12
E
20
13
E
Net Profitabiliy (SR mn) - LHS ROAE - RHS Source: Company reports & Global Research Source: Company reports & Global Research
We expect the company’s prospective ROAA and ROAE will remain in the range of 8.0%-10% and
19.0%-20.0% during 2010-13, respectively.
Global Research – Saudi Arabia Global Investment House
6 Saudi Basic Industries Corporation May 2010
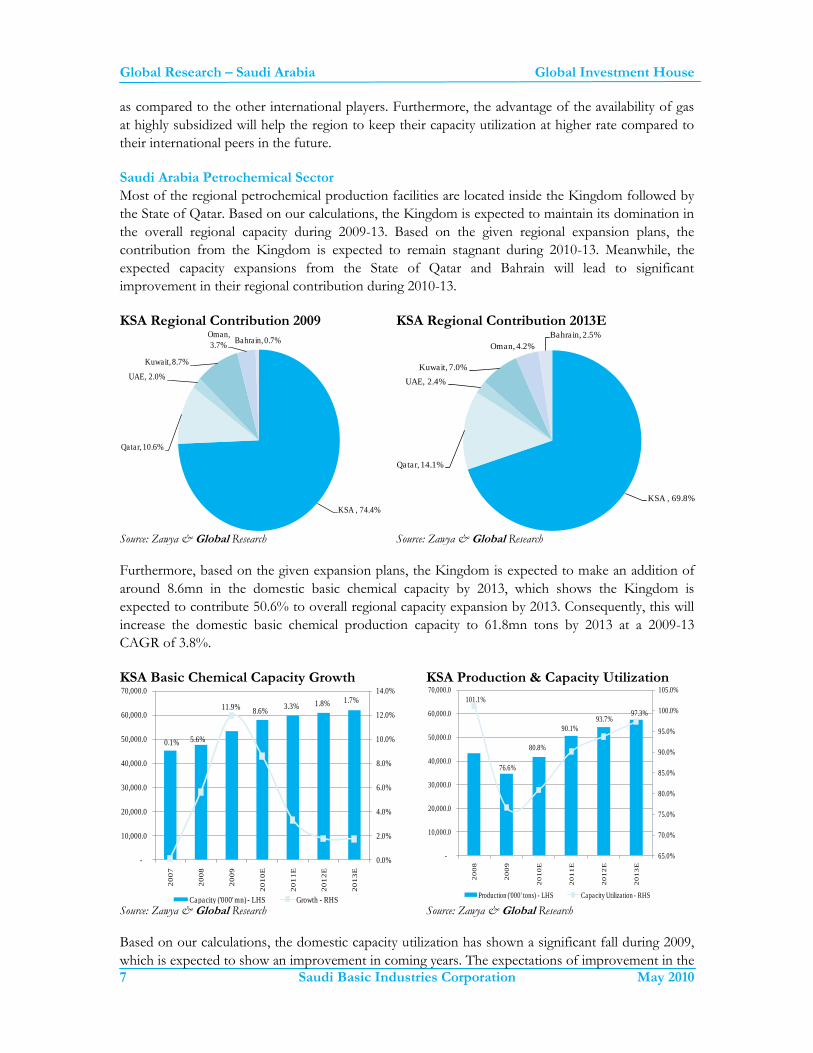
Petrochemical Sector Regional Petrochemical Capacity Expansion
Though there were some delays in the regional upcoming capacities, the countries remained
committed to their expansion plans and did not cancel much of the projects. We believe the delay in
these projects was mainly attributed toward the size and intention to further stream line the designed
production flows along with the impact of global economic slowdown.
Regional Petrochemical Capacity Expansion
0.1%7.9%
15.2%
11.7%4.6%
4.6% 1.2%
0.0%
2.0%
4.0%
6.0%
8.0%
10.0%
12.0%
14.0%
16.0%
-
10,000.0
20,000.0
30,000.0
40,000.0
50,000.0
60,000.0
70,000.0
80,000.0
90,000.0
100,000.0 2
00
7
20
08
20
09
20
10
E
20
11
E
20
12
E
20
13
EProduction Capacity ('000' ton) Growth
Source: FAO & Global Research Based on the updated completion plans of upcoming complexes, we expect major regional capacity
expansions to happen in 2010 and lead to an addition of 9.0% in the regional basic chemicals
(aromatic, olefins and oxygenate) capacity. Moreover, in term of CAGR the regional basic chemical
capacity is expected to increase at a CAGR of 4.7% during 2009-13 to 116.2mn tons.
Regional Petrochemical Capacity Expansion (tons)
Project Names Country Olefins Aromatic Oxygenate Expected
Completion Sino-Saudi Petrochemical Project KSA 1,700,000 - - 2010 Saudi Kayan KSA 3,800,000 - - 1H2011 Styrene Plant KSA - 600,000 - 2010 Gulf Petrochemical Industries Co. Bahrain - - 1,728,000 2010 Salalah Methanol Plant Oman - - 1,080,000 2Q2010 QP/Shell Qatar 1,500,000 - - 2011 Qatar Petrochemical Complex Qatar 880,000 600,000 - 2012 Ras Laffin Petrochemical Qatar 1,300,000 - - 2012 Borogue 2 UAE 39,000 - - 2Q2010 Ruwais Gasoline and Aromatics UAE - 600,000 - 2010 Total 13,034,000 1,800,000 3,048,000
Source: Zawya & Global Research
Furthermore, based on the availability of feedstock gas at highly subsidized price in the region, we
believe the region will be in the better position to react first and take advantage of the future recovery
Global Research – Saudi Arabia Global Investment House
7 Saudi Basic Industries Corporation May 2010
as compared to the other international players. Furthermore, the advantage of the availability of gas
at highly subsidized will help the region to keep their capacity utilization at higher rate compared to
their international peers in the future.
Saudi Arabia Petrochemical Sector
Most of the regional petrochemical production facilities are located inside the Kingdom followed by
the State of Qatar. Based on our calculations, the Kingdom is expected to maintain its domination in
the overall regional capacity during 2009-13. Based on the given regional expansion plans, the
contribution from the Kingdom is expected to remain stagnant during 2010-13. Meanwhile, the
expected capacity expansions from the State of Qatar and Bahrain will lead to significant
improvement in their regional contribution during 2010-13.
KSA Regional Contribution 2009 KSA Regional Contribution 2013E
KSA , 74.4%
Qatar, 10.6%
UAE, 2.0%
Kuwait, 8.7%
Oman,
3.7%Bahrain, 0.7%
KSA , 69.8%
Qatar, 14.1%
UAE, 2.4%
Kuwait, 7.0%
Oman, 4.2%
Bahrain, 2.5%
Source: Zawya & Global Research Source: Zawya & Global Research
Furthermore, based on the given expansion plans, the Kingdom is expected to make an addition of
around 8.6mn in the domestic basic chemical capacity by 2013, which shows the Kingdom is
expected to contribute 50.6% to overall regional capacity expansion by 2013. Consequently, this will
increase the domestic basic chemical production capacity to 61.8mn tons by 2013 at a 2009-13
CAGR of 3.8%.
KSA Basic Chemical Capacity Growth KSA Production & Capacity Utilization
0.1% 5.6%
11.9%8.6%
3.3% 1.8% 1.7%
0.0%
2.0%
4.0%
6.0%
8.0%
10.0%
12.0%
14.0%
-
10,000.0
20,000.0
30,000.0
40,000.0
50,000.0
60,000.0
70,000.0
20
07
20
08
20
09
20
10
E
20
11
E
20
12
E
20
13
E
Capacity ('000' mn) - LHS Growth - RHS
101.1%
76.6%
80.8%
90.1%
93.7%97.3%
65.0%
70.0%
75.0%
80.0%
85.0%
90.0%
95.0%
100.0%
105.0%
-
10,000.0
20,000.0
30,000.0
40,000.0
50,000.0
60,000.0
70,000.0
20
08
20
09
20
10
E
20
11
E
20
12
E
20
13
E
Production ('000' tons) - LHS Capacity Utilization - RHS Source: Zawya & Global Research Source: Zawya & Global Research
Based on our calculations, the domestic capacity utilization has shown a significant fall during 2009,
which is expected to show an improvement in coming years. The expectations of improvement in the
Global Research – Saudi Arabia Global Investment House
8 Saudi Basic Industries Corporation May 2010
domestic capacity utilization is mainly based on the (i) upcoming well integrated capacities, (ii)
forecasted improvement in the global economies from 2H2010 onwards and (iii) revival in the
domestic demand of petrochemical products. Consequently, this will lead to an increase in
Kingdom’s overall petrochemical production at a 2009-13 CAGR of 16.7% to 56.1mn tons.
Moreover, the ongoing weak demand in the core-petrochemical products (i.e. basic, intermediaries
and polymers) in Western and US markets is still a big challenge for the Kingdom’s leading
producers to maintain their exports.
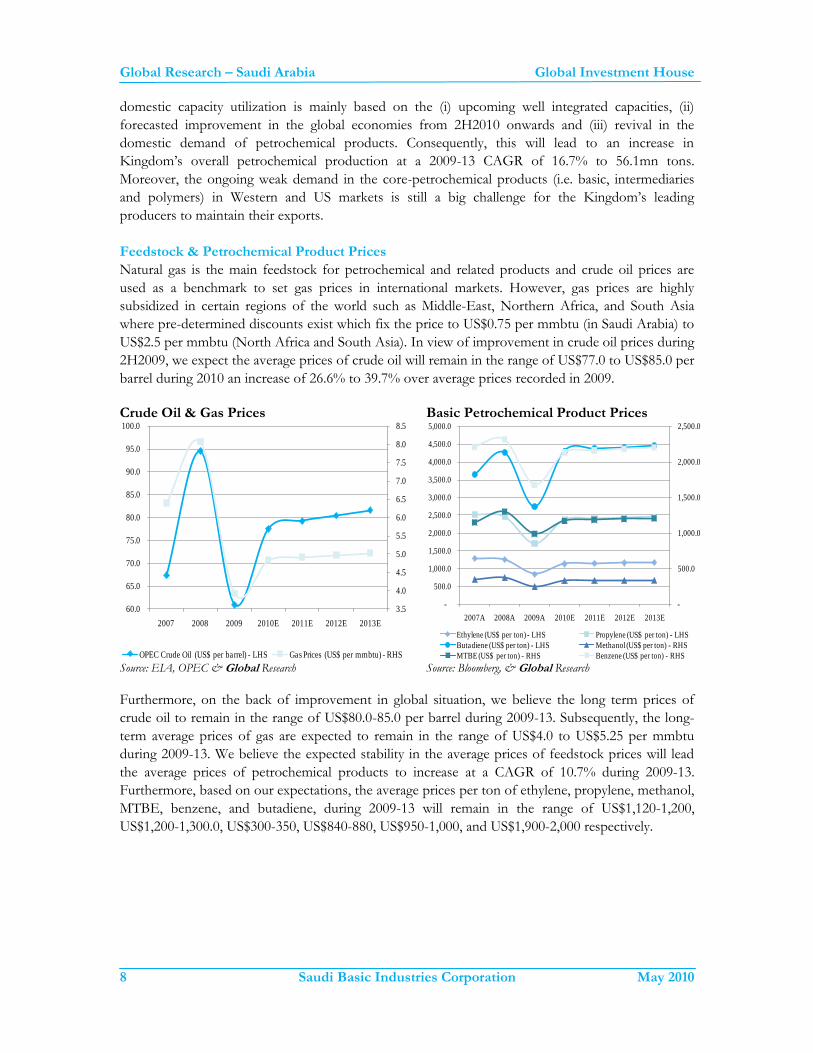
Feedstock & Petrochemical Product Prices
Natural gas is the main feedstock for petrochemical and related products and crude oil prices are
used as a benchmark to set gas prices in international markets. However, gas prices are highly
subsidized in certain regions of the world such as Middle-East, Northern Africa, and South Asia
where pre-determined discounts exist which fix the price to US$0.75 per mmbtu (in Saudi Arabia) to
US$2.5 per mmbtu (North Africa and South Asia). In view of improvement in crude oil prices during
2H2009, we expect the average prices of crude oil will remain in the range of US$77.0 to US$85.0 per
barrel during 2010 an increase of 26.6% to 39.7% over average prices recorded in 2009.
Crude Oil & Gas Prices Basic Petrochemical Product Prices
3.5
4.0
4.5
5.0
5.5
6.0
6.5
7.0
7.5
8.0
8.5
60.0
65.0
70.0
75.0
80.0
85.0
90.0
95.0
100.0
2007 2008 2009 2010E 2011E 2012E 2013E
OPEC Crude Oil (US$ per barrel) - LHS Gas Prices (US$ per mmbtu) - RHS
-
500.0
1,000.0
1,500.0
2,000.0
2,500.0
-
500.0
1,000.0
1,500.0
2,000.0
2,500.0
3,000.0
3,500.0
4,000.0
4,500.0
5,000.0
2007A 2008A 2009A 2010E 2011E 2012E 2013E
Ethylene (US$ per ton) - LHS Propylene (US$ per ton) - LHS
Butadiene (US$ per ton) - LHS Methanol (US$ per ton) - RHS
MTBE (US$ per ton) - RHS Benzene (US$ per ton) - RHS Source: EIA, OPEC & Global Research Source: Bloomberg, & Global Research
Furthermore, on the back of improvement in global situation, we believe the long term prices of
crude oil to remain in the range of US$80.0-85.0 per barrel during 2009-13. Subsequently, the long-
term average prices of gas are expected to remain in the range of US$4.0 to US$5.25 per mmbtu
during 2009-13. We believe the expected stability in the average prices of feedstock prices will lead
the average prices of petrochemical products to increase at a CAGR of 10.7% during 2009-13.
Furthermore, based on our expectations, the average prices per ton of ethylene, propylene, methanol,
MTBE, benzene, and butadiene, during 2009-13 will remain in the range of US$1,120-1,200,
US$1,200-1,300.0, US$300-350, US$840-880, US$950-1,000, and US$1,900-2,000 respectively.
Global Research – Saudi Arabia Global Investment House
9 Saudi Basic Industries Corporation May 2010
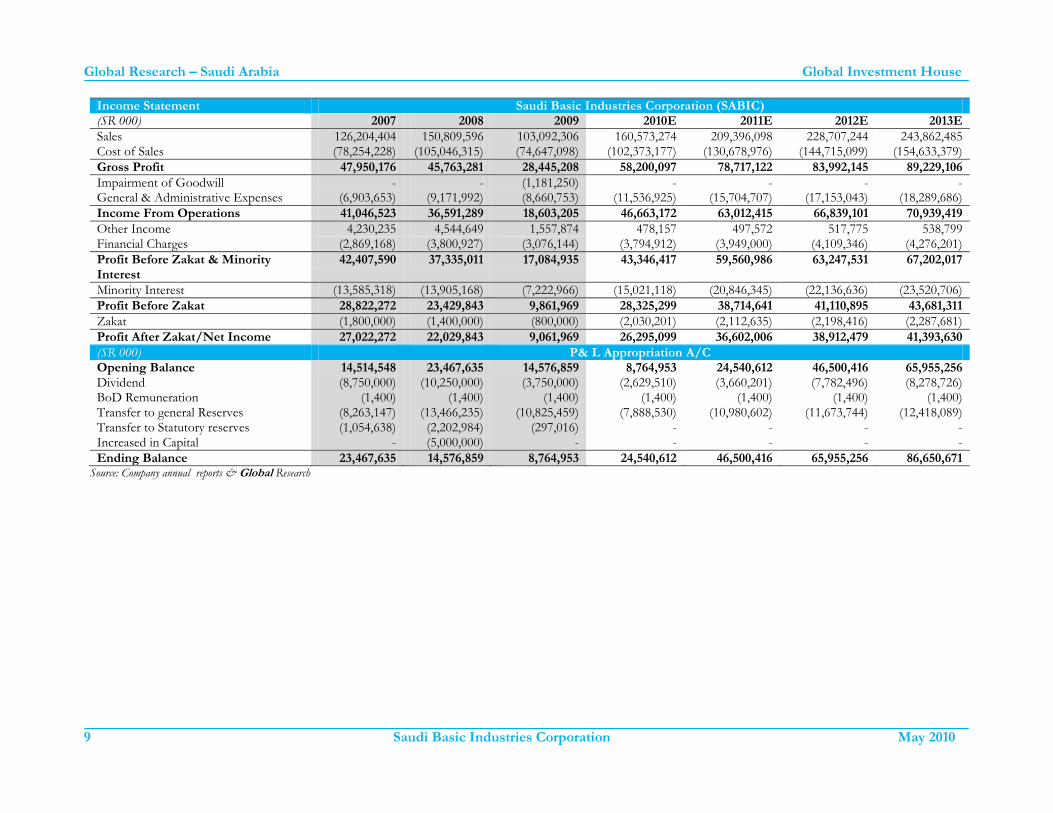
Income Statement Saudi Basic Industries Corporation (SABIC) (SR 000) 2007 2008 2009 2010E 2011E 2012E 2013E
Sales 126,204,404 150,809,596 103,092,306 160,573,274 209,396,098 228,707,244 243,862,485 Cost of Sales (78,254,228) (105,046,315) (74,647,098) (102,373,177) (130,678,976) (144,715,099) (154,633,379)
Gross Profit 47,950,176 45,763,281 28,445,208 58,200,097 78,717,122 83,992,145 89,229,106
Impairment of Goodwill - - (1,181,250) - - - - General & Administrative Expenses (6,903,653) (9,171,992) (8,660,753) (11,536,925) (15,704,707) (17,153,043) (18,289,686)
Income From Operations 41,046,523 36,591,289 18,603,205 46,663,172 63,012,415 66,839,101 70,939,419
Other Income 4,230,235 4,544,649 1,557,874 478,157 497,572 517,775 538,799 Financial Charges (2,869,168) (3,800,927) (3,076,144) (3,794,912) (3,949,000) (4,109,346) (4,276,201)
Profit Before Zakat & Minority Interest
42,407,590 37,335,011 17,084,935 43,346,417 59,560,986 63,247,531 67,202,017
Minority Interest (13,585,318) (13,905,168) (7,222,966) (15,021,118) (20,846,345) (22,136,636) (23,520,706)
Profit Before Zakat 28,822,272 23,429,843 9,861,969 28,325,299 38,714,641 41,110,895 43,681,311
Zakat (1,800,000) (1,400,000) (800,000) (2,030,201) (2,112,635) (2,198,416) (2,287,681)
Profit After Zakat/Net Income 27,022,272 22,029,843 9,061,969 26,295,099 36,602,006 38,912,479 41,393,630
(SR 000) P& L Appropriation A/C Opening Balance 14,514,548 23,467,635 14,576,859 8,764,953 24,540,612 46,500,416 65,955,256 Dividend (8,750,000) (10,250,000) (3,750,000) (2,629,510) (3,660,201) (7,782,496) (8,278,726) BoD Remuneration (1,400) (1,400) (1,400) (1,400) (1,400) (1,400) (1,400) Transfer to general Reserves (8,263,147) (13,466,235) (10,825,459) (7,888,530) (10,980,602) (11,673,744) (12,418,089) Transfer to Statutory reserves (1,054,638) (2,202,984) (297,016) - - - - Increased in Capital - (5,000,000) - - - - -
Ending Balance 23,467,635 14,576,859 8,764,953 24,540,612 46,500,416 65,955,256 86,650,671 Source: Company annual reports & Global Research
Global Research – Saudi Arabia Global Investment House
10 Saudi Basic Industries Corporation May 2010
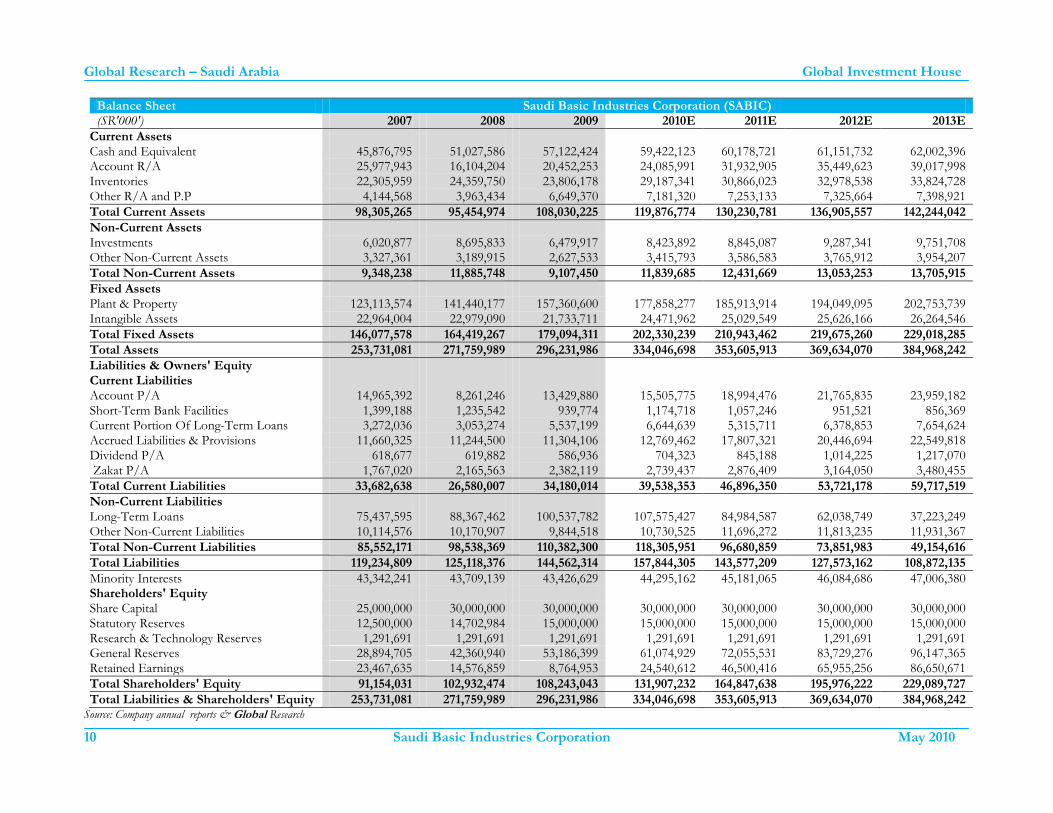
Balance Sheet Saudi Basic Industries Corporation (SABIC) (SR'000') 2007 2008 2009 2010E 2011E 2012E 2013E
Current Assets Cash and Equivalent 45,876,795 51,027,586 57,122,424 59,422,123 60,178,721 61,151,732 62,002,396 Account R/A 25,977,943 16,104,204 20,452,253 24,085,991 31,932,905 35,449,623 39,017,998 Inventories 22,305,959 24,359,750 23,806,178 29,187,341 30,866,023 32,978,538 33,824,728 Other R/A and P.P 4,144,568 3,963,434 6,649,370 7,181,320 7,253,133 7,325,664 7,398,921
Total Current Assets 98,305,265 95,454,974 108,030,225 119,876,774 130,230,781 136,905,557 142,244,042
Non-Current Assets Investments 6,020,877 8,695,833 6,479,917 8,423,892 8,845,087 9,287,341 9,751,708 Other Non-Current Assets 3,327,361 3,189,915 2,627,533 3,415,793 3,586,583 3,765,912 3,954,207
Total Non-Current Assets 9,348,238 11,885,748 9,107,450 11,839,685 12,431,669 13,053,253 13,705,915
Fixed Assets Plant & Property 123,113,574 141,440,177 157,360,600 177,858,277 185,913,914 194,049,095 202,753,739 Intangible Assets 22,964,004 22,979,090 21,733,711 24,471,962 25,029,549 25,626,166 26,264,546
Total Fixed Assets 146,077,578 164,419,267 179,094,311 202,330,239 210,943,462 219,675,260 229,018,285
Total Assets 253,731,081 271,759,989 296,231,986 334,046,698 353,605,913 369,634,070 384,968,242
Liabilities & Owners' Equity Current Liabilities Account P/A 14,965,392 8,261,246 13,429,880 15,505,775 18,994,476 21,765,835 23,959,182 Short-Term Bank Facilities 1,399,188 1,235,542 939,774 1,174,718 1,057,246 951,521 856,369 Current Portion Of Long-Term Loans 3,272,036 3,053,274 5,537,199 6,644,639 5,315,711 6,378,853 7,654,624 Accrued Liabilities & Provisions 11,660,325 11,244,500 11,304,106 12,769,462 17,807,321 20,446,694 22,549,818 Dividend P/A 618,677 619,882 586,936 704,323 845,188 1,014,225 1,217,070 Zakat P/A 1,767,020 2,165,563 2,382,119 2,739,437 2,876,409 3,164,050 3,480,455
Total Current Liabilities 33,682,638 26,580,007 34,180,014 39,538,353 46,896,350 53,721,178 59,717,519
Non-Current Liabilities Long-Term Loans 75,437,595 88,367,462 100,537,782 107,575,427 84,984,587 62,038,749 37,223,249 Other Non-Current Liabilities 10,114,576 10,170,907 9,844,518 10,730,525 11,696,272 11,813,235 11,931,367
Total Non-Current Liabilities 85,552,171 98,538,369 110,382,300 118,305,951 96,680,859 73,851,983 49,154,616
Total Liabilities 119,234,809 125,118,376 144,562,314 157,844,305 143,577,209 127,573,162 108,872,135
Minority Interests 43,342,241 43,709,139 43,426,629 44,295,162 45,181,065 46,084,686 47,006,380 Shareholders' Equity Share Capital 25,000,000 30,000,000 30,000,000 30,000,000 30,000,000 30,000,000 30,000,000 Statutory Reserves 12,500,000 14,702,984 15,000,000 15,000,000 15,000,000 15,000,000 15,000,000 Research & Technology Reserves 1,291,691 1,291,691 1,291,691 1,291,691 1,291,691 1,291,691 1,291,691 General Reserves 28,894,705 42,360,940 53,186,399 61,074,929 72,055,531 83,729,276 96,147,365 Retained Earnings 23,467,635 14,576,859 8,764,953 24,540,612 46,500,416 65,955,256 86,650,671
Total Shareholders' Equity 91,154,031 102,932,474 108,243,043 131,907,232 164,847,638 195,976,222 229,089,727
Total Liabilities & Shareholders' Equity 253,731,081 271,759,989 296,231,986 334,046,698 353,605,913 369,634,070 384,968,242 Source: Company annual reports & Global Research
Global Research – Saudi Arabia Global Investment House
11 Saudi Basic Industries Corporation May 2010
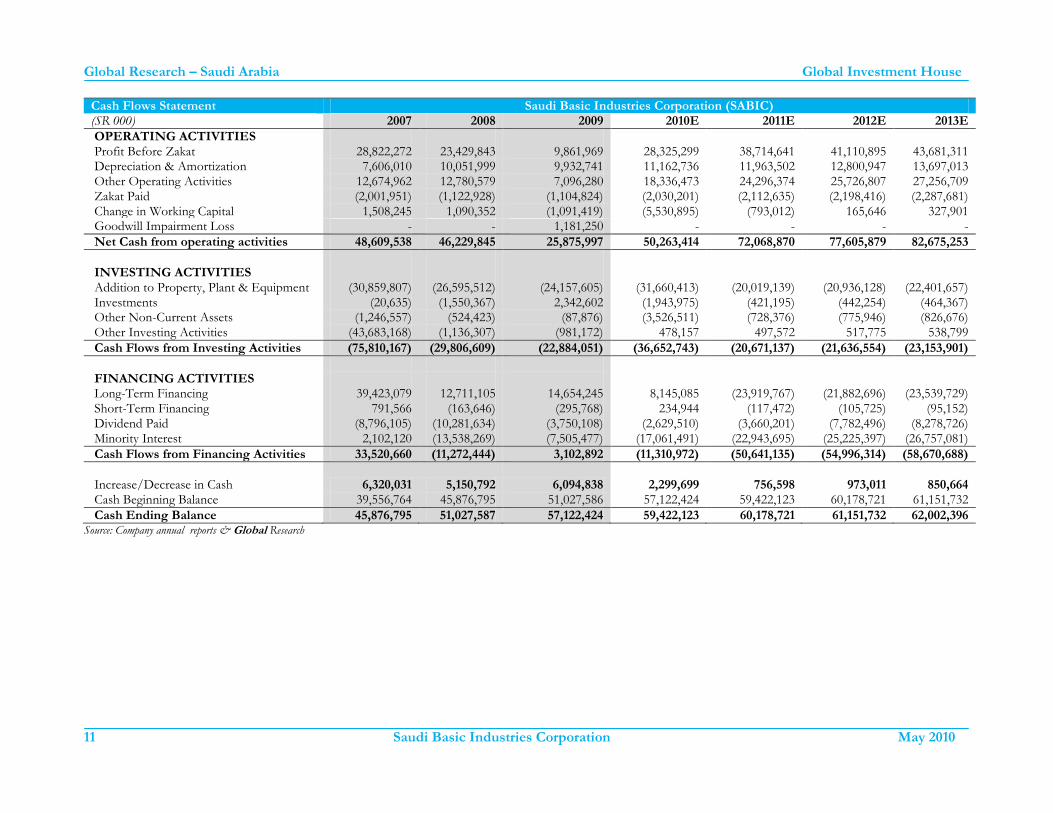
Cash Flows Statement Saudi Basic Industries Corporation (SABIC) (SR 000) 2007 2008 2009 2010E 2011E 2012E 2013E
OPERATING ACTIVITIES Profit Before Zakat 28,822,272 23,429,843 9,861,969 28,325,299 38,714,641 41,110,895 43,681,311 Depreciation & Amortization 7,606,010 10,051,999 9,932,741 11,162,736 11,963,502 12,800,947 13,697,013 Other Operating Activities 12,674,962 12,780,579 7,096,280 18,336,473 24,296,374 25,726,807 27,256,709 Zakat Paid (2,001,951) (1,122,928) (1,104,824) (2,030,201) (2,112,635) (2,198,416) (2,287,681) Change in Working Capital 1,508,245 1,090,352 (1,091,419) (5,530,895) (793,012) 165,646 327,901 Goodwill Impairment Loss - - 1,181,250 - - - -
Net Cash from operating activities 48,609,538 46,229,845 25,875,997 50,263,414 72,068,870 77,605,879 82,675,253
INVESTING ACTIVITIES Addition to Property, Plant & Equipment (30,859,807) (26,595,512) (24,157,605) (31,660,413) (20,019,139) (20,936,128) (22,401,657) Investments (20,635) (1,550,367) 2,342,602 (1,943,975) (421,195) (442,254) (464,367) Other Non-Current Assets (1,246,557) (524,423) (87,876) (3,526,511) (728,376) (775,946) (826,676) Other Investing Activities (43,683,168) (1,136,307) (981,172) 478,157 497,572 517,775 538,799
Cash Flows from Investing Activities (75,810,167) (29,806,609) (22,884,051) (36,652,743) (20,671,137) (21,636,554) (23,153,901)
FINANCING ACTIVITIES Long-Term Financing 39,423,079 12,711,105 14,654,245 8,145,085 (23,919,767) (21,882,696) (23,539,729) Short-Term Financing 791,566 (163,646) (295,768) 234,944 (117,472) (105,725) (95,152) Dividend Paid (8,796,105) (10,281,634) (3,750,108) (2,629,510) (3,660,201) (7,782,496) (8,278,726) Minority Interest 2,102,120 (13,538,269) (7,505,477) (17,061,491) (22,943,695) (25,225,397) (26,757,081)
Cash Flows from Financing Activities 33,520,660 (11,272,444) 3,102,892 (11,310,972) (50,641,135) (54,996,314) (58,670,688)
Increase/Decrease in Cash 6,320,031 5,150,792 6,094,838 2,299,699 756,598
973,011 850,664 Cash Beginning Balance 39,556,764 45,876,795 51,027,586 57,122,424 59,422,123 60,178,721 61,151,732
Cash Ending Balance 45,876,795 51,027,587 57,122,424 59,422,123 60,178,721 61,151,732 62,002,396 Source: Company annual reports & Global Research
Global Research – Saudi Arabia Global Investment House
12 Saudi Basic Industries Corporation May 2010
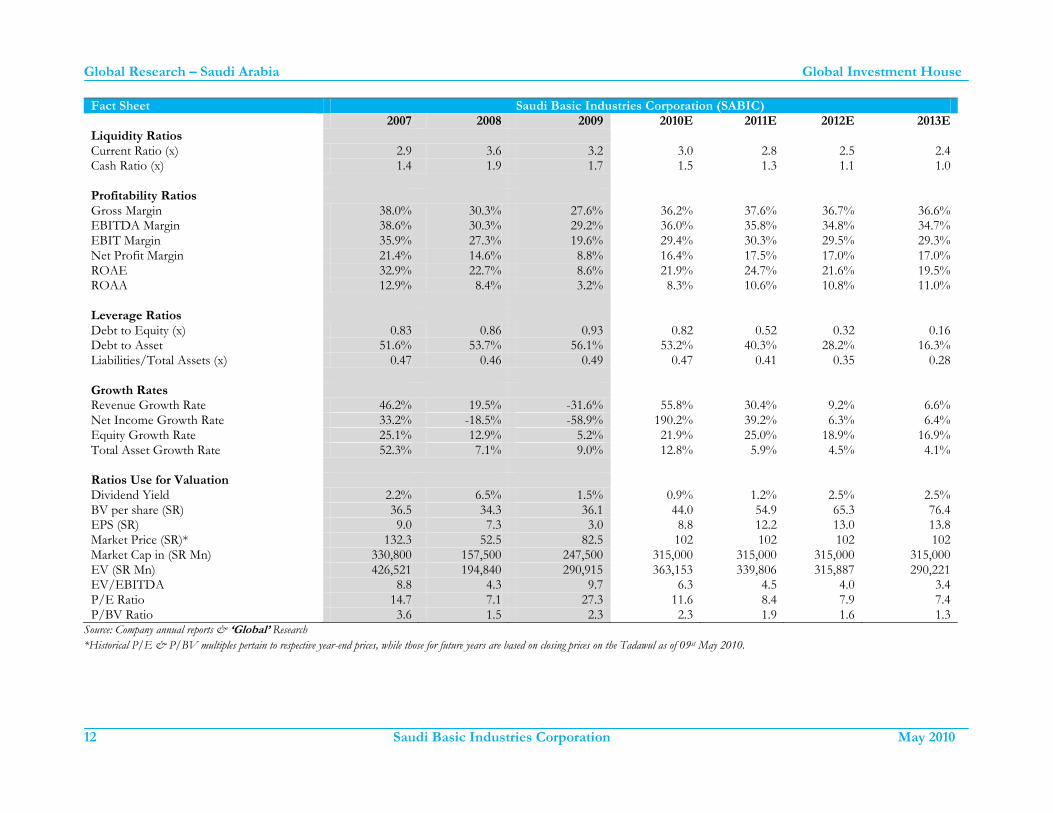
Fact Sheet Saudi Basic Industries Corporation (SABIC) 2007 2008 2009 2010E 2011E 2012E 2013E Liquidity Ratios Current Ratio (x) 2.9 3.6 3.2 3.0 2.8 2.5 2.4 Cash Ratio (x) 1.4 1.9 1.7 1.5 1.3 1.1 1.0 Profitability Ratios Gross Margin 38.0% 30.3% 27.6% 36.2% 37.6% 36.7% 36.6% EBITDA Margin 38.6% 30.3% 29.2% 36.0% 35.8% 34.8% 34.7% EBIT Margin 35.9% 27.3% 19.6% 29.4% 30.3% 29.5% 29.3% Net Profit Margin 21.4% 14.6% 8.8% 16.4% 17.5% 17.0% 17.0% ROAE 32.9% 22.7% 8.6% 21.9% 24.7% 21.6% 19.5% ROAA 12.9% 8.4% 3.2% 8.3% 10.6% 10.8% 11.0% Leverage Ratios Debt to Equity (x) 0.83 0.86 0.93 0.82 0.52 0.32 0.16 Debt to Asset 51.6% 53.7% 56.1% 53.2% 40.3% 28.2% 16.3% Liabilities/Total Assets (x) 0.47 0.46 0.49 0.47 0.41 0.35 0.28 Growth Rates Revenue Growth Rate 46.2% 19.5% -31.6% 55.8% 30.4% 9.2% 6.6% Net Income Growth Rate 33.2% -18.5% -58.9% 190.2% 39.2% 6.3% 6.4% Equity Growth Rate 25.1% 12.9% 5.2% 21.9% 25.0% 18.9% 16.9% Total Asset Growth Rate 52.3% 7.1% 9.0% 12.8% 5.9% 4.5% 4.1% Ratios Use for Valuation Dividend Yield 2.2% 6.5% 1.5% 0.9% 1.2% 2.5% 2.5% BV per share (SR) 36.5 34.3 36.1 44.0 54.9 65.3 76.4 EPS (SR) 9.0 7.3 3.0 8.8 12.2 13.0 13.8 Market Price (SR)* 132.3 52.5 82.5 102 102 102 102 Market Cap in (SR Mn) 330,800 157,500 247,500 315,000 315,000 315,000 315,000 EV (SR Mn) 426,521 194,840 290,915 363,153 339,806 315,887 290,221 EV/EBITDA 8.8 4.3 9.7 6.3 4.5 4.0 3.4 P/E Ratio 14.7 7.1 27.3 11.6 8.4 7.9 7.4 P/BV Ratio 3.6 1.5 2.3 2.3 1.9 1.6 1.3
Source: Company annual reports & ‘Global’ Research
*Historical P/E & P/BV multiples pertain to respective year-end prices, while those for future years are based on closing prices on the Tadawul as of 09st May 2010.
Global Research – Saudi Arabia Global Investment House
13 Saudi Basic Industries Corporation May 2010
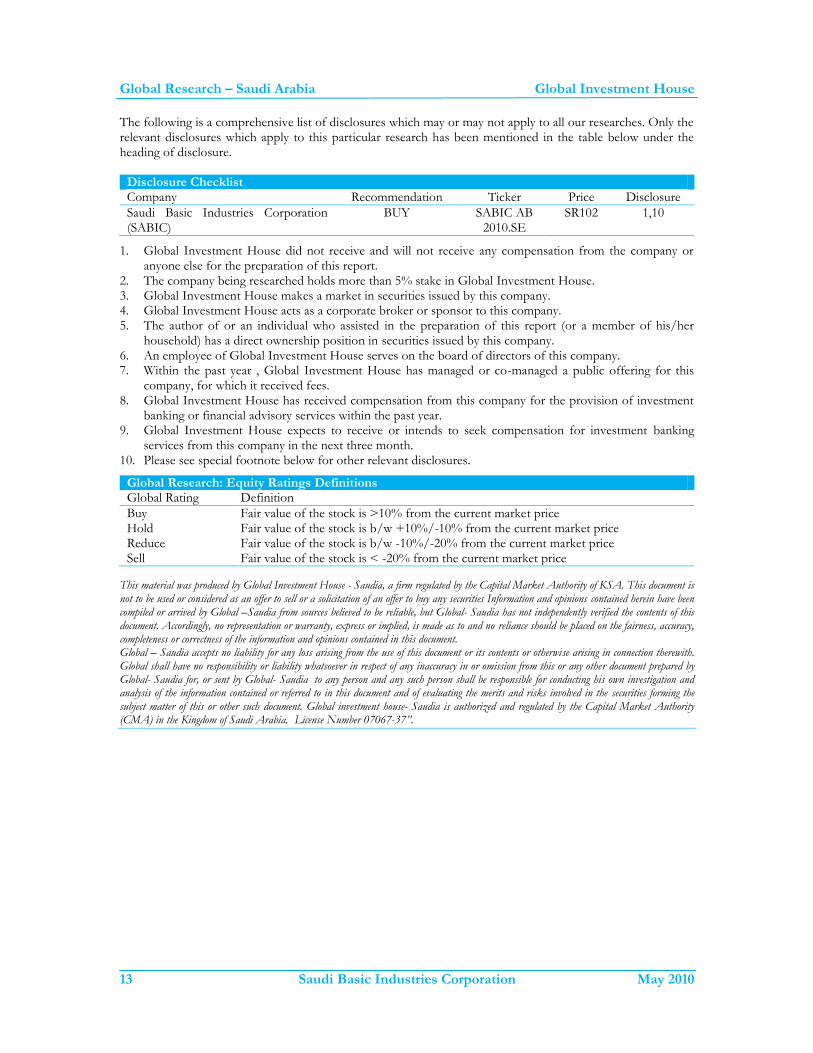
The following is a comprehensive list of disclosures which may or may not apply to all our researches. Only the relevant disclosures which apply to this particular research has been mentioned in the table below under the heading of disclosure.
Disclosure Checklist Company Recommendation Ticker Price Disclosure
Saudi Basic Industries Corporation (SABIC)
BUY SABIC AB 2010.SE
SR102 1,10
1. Global Investment House did not receive and will not receive any compensation from the company or anyone else for the preparation of this report.
2. The company being researched holds more than 5% stake in Global Investment House. 3. Global Investment House makes a market in securities issued by this company. 4. Global Investment House acts as a corporate broker or sponsor to this company. 5. The author of or an individual who assisted in the preparation of this report (or a member of his/her
household) has a direct ownership position in securities issued by this company. 6. An employee of Global Investment House serves on the board of directors of this company. 7. Within the past year , Global Investment House has managed or co-managed a public offering for this
company, for which it received fees. 8. Global Investment House has received compensation from this company for the provision of investment
banking or financial advisory services within the past year. 9. Global Investment House expects to receive or intends to seek compensation for investment banking
services from this company in the next three month. 10. Please see special footnote below for other relevant disclosures.
Global Research: Equity Ratings Definitions Global Rating Definition
Buy Fair value of the stock is >10% from the current market price Hold Fair value of the stock is b/w +10%/-10% from the current market price Reduce Fair value of the stock is b/w -10%/-20% from the current market price Sell Fair value of the stock is < -20% from the current market price
This material was produced by Global Investment House - Saudia, a firm regulated by the Capital Market Authority of KSA. This document is not to be used or considered as an offer to sell or a solicitation of an offer to buy any securities Information and opinions contained herein have been compiled or arrived by Global –Saudia from sources believed to be reliable, but Global- Saudia has not independently verified the contents of this document. Accordingly, no representation or warranty, express or implied, is made as to and no reliance should be placed on the fairness, accuracy, completeness or correctness of the information and opinions contained in this document. Global – Saudia accepts no liability for any loss arising from the use of this document or its contents or otherwise arising in connection therewith. Global shall have no responsibility or liability whatsoever in respect of any inaccuracy in or omission from this or any other document prepared by Global- Saudia for, or sent by Global- Saudia to any person and any such person shall be responsible for conducting his own investigation and analysis of the information contained or referred to in this document and of evaluating the merits and risks involved in the securities forming the subject matter of this or other such document. Global investment house- Saudia is authorized and regulated by the Capital Market Authority (CMA) in the Kingdom of Saudi Arabia. License Number 07067-37”.
Global Investment House Website: www.globalinv.net
Global Tower Sharq, Al-Shuhada Str.
Tel. + (965) 2 295 1000 Fax. + (965) 2 295 1005
P.O. Box: 28807 Safat, 13149 Kuwait
Research Faisal Hasan, CFA (965) 2295-1270 [email protected]
Index Rasha Al-Huneidi (965) 2295-1285 [email protected]
Brokerage Yousef S. Fahed Alebrahim (965) 2295-1702 [email protected]
Wealth Management - Kuwait Rasha Al-Qenaei (965) 2295-1380 [email protected]
Wealth Management-MENA & Far East Fahad Al-Ibrahim (965) 2295-1400 [email protected]
Global Kuwait Tel: (965) 2 295 1000 Fax: (965) 2 295 1005 P.O.Box 28807 Safat, 13149 Kuwait
Global Bahrain Tel: (973) 17 210011 Fax: (973) 17 210222 P.O.Box 855 Manama, Bahrain
Global Dubai Tel: (971) 4 4477066 Fax: (971) 4 4477067 P.O.Box 121227 Dubai, UAE
Global Abu Dhabi Tel: (971) 2 6744446 Fax: (971) 2 6725263/4 P.O.Box 127373 Abu Dhabi, UAE
Global Saudi Arabia Tel: (966) 1 2199966 Fax: (966) 1 2178481 P.O. Box 66930 Riyadh 11586, Kingdom of Saudi Arabia
Global Qatar Tel: (974) 4967305 Fax: (974) 4967307 P.O.Box 18126 Doha, Qatar
Global Egypt Tel: 20 (2) 24189705/06 Fax: 20 (2) 22905972 24 Cleopatra St. Heliopolis, Cario
Global Jordan Tel: (962) 6 5005060 Fax: (962) 6 5005066 P.O.Box 3268 Amman 11180, Jordan
Global Wealth Manager E-mail: [email protected] Tel: (965) 1-804-242
Disclaimer This document and its contents are prepared for your personal use for information purposes only and is not an offer, or the solicitation of an offer, to buy or sell a security or enter into any other agreement. Projections of potential risk or return are illustrative, and should not be taken as limitations of the maximum possible loss or gain. The information and any views expressed are given as at the date of writing and subject to change. While the information has been obtained from sources believed to be reliable we do not represent that it is accurate or complete and it should not be relied on as such. Global Investment House, its affiliates and subsidiaries can accept no liability for any direct or consequential loss arising from use of this document or its contents. At any time, Global Investment House or its employees may have a position, subject to change, in any securities or instruments referred to, or provide services to the issuer of those securities or instruments.