Embed Size (px)
Citation preview
EPRASHEEDsignature series
www.saudiarabiaoilandgas.com
2012 – Issue 24
Saudi Arabia Oil & Gas (Online) ISSN 2045-6689
Saudi Arabia Oil & Gas (Print) ISSN 2045-6670
USC Alumni Clubof Arabia
Horizontal Drillingin Saudi Arabia
Reliability Key toLong Term Injectivity Test
2011 Saudi Young Professionals Awards
Brazil Oil & Gas, tt_nrg and Norway Oil & Gas
High Science Simplified®
Want sealed frameworks from geological and geophysical data in minutes, not weeks? Speed Up
DecisionSpace® Desktop software automatically generates accurate sealed frameworks in about a minute.
As geoscientists interpret data, Landmark’s new unified DecisionSpace® Desktop software automatically constructs
fault networks, seals horizons against the fault network and generates a sealed framework. When geologists make
picks or geophysicists interpret sections, watch live updates ripple through the framework and then create
accurate, report-quality maps instantly. What once took hours, or even days, now takes just a minute.
So speed up your cycle time. Get better answers faster. Visit halliburton.com/decisionspacedesktop.
© 2012 Halliburton. All rights reserved.
Who is going to help discover the energy for a global population expected to grow 20% by 2025?
Join us, and you will.
At Chevron, we’re dedicated to providing the energy the world needs to keep moving forward. Here you can be part of a diverse team of professionals from different disciplines and skill sets working together. A team that welcomes tomorrow’s challenges and believes the best way to solve them is through collaboration. So no matter what your expertise, you’ll have the tools and support to make a difference every day. Find out how far your skills and talents can take you. For local and global opportunities, visit us online today.
CHEVRON, the CHEVRON Hallmark and HUMAN ENERGY are registered trademarks of Chevron Intellectual Property LLC. ©2011 Chevron U.S.A. Inc. All rights reserved.
An equal opportunity employer that values diversity and fosters a culture of inclusion.
www.saudiarabiaoilandgas.comEPRASHEEDsignature series
2012 – Issue 24
www.saudiarabiaoilandgas.com
Dr Abdulaziz Al Majed Chairman, Petroleum Engineering Department KFUPM; Tariq AlKhalifah, KAUST; Sami AlNuaim;Mohammed Badri, Schlumberger; Dr Abdulaziz Ibn Laboun, Geology Department, College of Science, King Saud University; Dr Abdulrahman Al Quraishi, Petroleum Engineering KACST; Professor Musaed N. J. Al-Awad, Head of Department Drilling, Econom-ics and Geomechanics, KSU; Professor Bernt Aadnoy, Stavanger University; Karam Yateem, Saudi Aramco; Ghaithan Muntashehri, Saudi Aramco; Michael Bittar, Halliburton; Wajid Rasheed, EPRasheed.
Editorial Advisory Committee
DesignSue [email protected]
Braziln Ana Felix [email protected]: (55) 21 9714 8690
n Fabio Jones [email protected]: (55) 21 9392 7821
n Roberto S. [email protected]: (55) 22 8818 8507
ADVERTISERS: HALLIBURTON - page 2, SAUDI ARABIAN CHEVRON -page 3, KACST - pages 4-5, SPE ATS&E - page 7,NPS - page 8, COREX - page 9, MASTERGEAR - page 17, SCHLUMBERGER - OBC
Contents
n Head OfficeTel: (44) 207 193 1602
n Adam [email protected]: (44) 1753 708872Fax: (44) 1753 725460Mobile: (44) 777 2096692
United Kingdom
Editors
CEO and Founder EPRasheedWajid Rasheed [email protected]
Majid RasheedMauro Martins
28
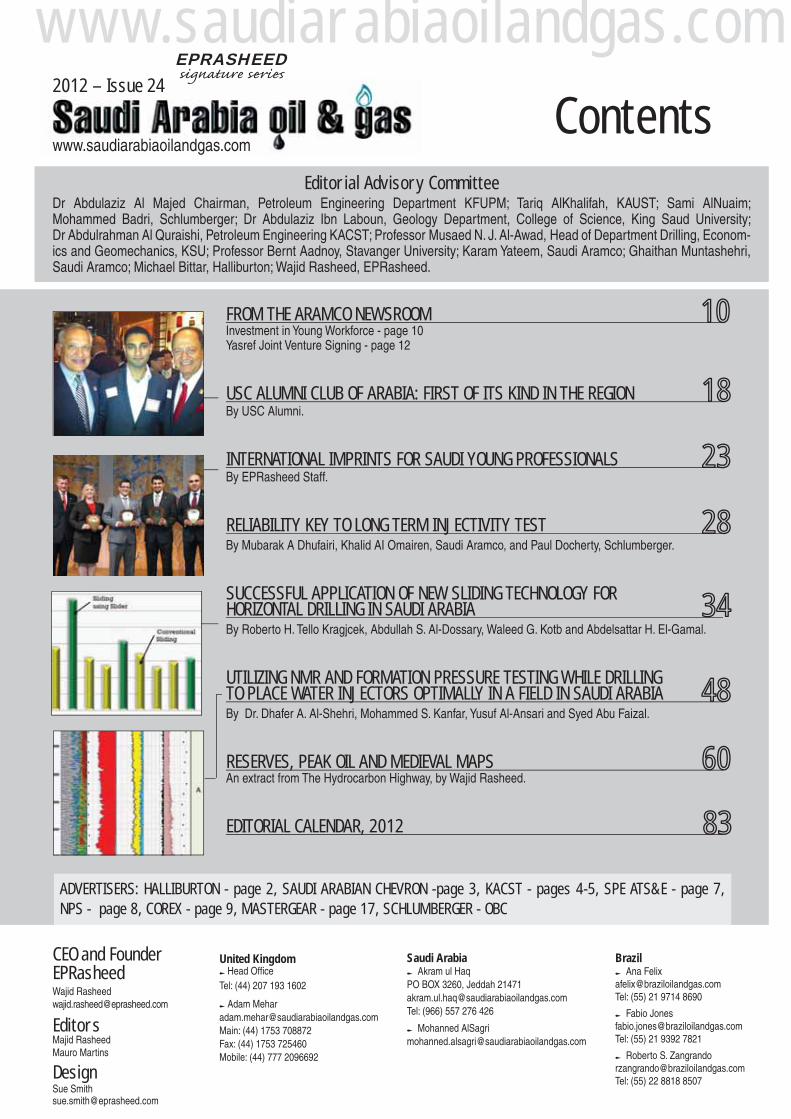
FROM THE ARAMCO NEWSROOMInvestment in Young Workforce - page 10Yasref Joint Venture Signing - page 12
USC ALUMNI CLUB OF ARABIA: FIRST OF ITS KIND IN THE REGIONBy USC Alumni.
INTERNATIONAL IMPRINTS FOR SAUDI YOUNG PROFESSIONALSBy EPRasheed Staff.
RELIABILITY KEY TO LONG TERM INJECTIVITY TESTBy Mubarak A Dhufairi, Khalid AI Omairen, Saudi Aramco, and Paul Docherty, Schlumberger.
SUCCESSFUL APPLICATION OF NEW SLIDING TECHNOLOGY FORHORIZONTAL DRILLING IN SAUDI ARABIABy Roberto H. Tello Kragjcek, Abdullah S. Al-Dossary, Waleed G. Kotb and Abdelsattar H. El-Gamal.
UTILIZING NMR AND FORMATION PRESSURE TESTING WHILE DRILLINGTO PLACE WATER INJECTORS OPTIMALLY IN A FIELD IN SAUDI ARABIABy Dr. Dhafer A. Al-Shehri, Mohammed S. Kanfar, Yusuf Al-Ansari and Syed Abu Faizal.
RESERVES, PEAK OIL AND MEDIEVAL MAPSAn extract from The Hydrocarbon Highway, by Wajid Rasheed.
EDITORIAL CALENDAR, 2012
10
23
83
60
Saudi Arabian Akram ul HaqPO BOX 3260, Jeddah [email protected]: (966) 557 276 426
n Mohanned [email protected]
34
18
48
Official Publication 5th Year
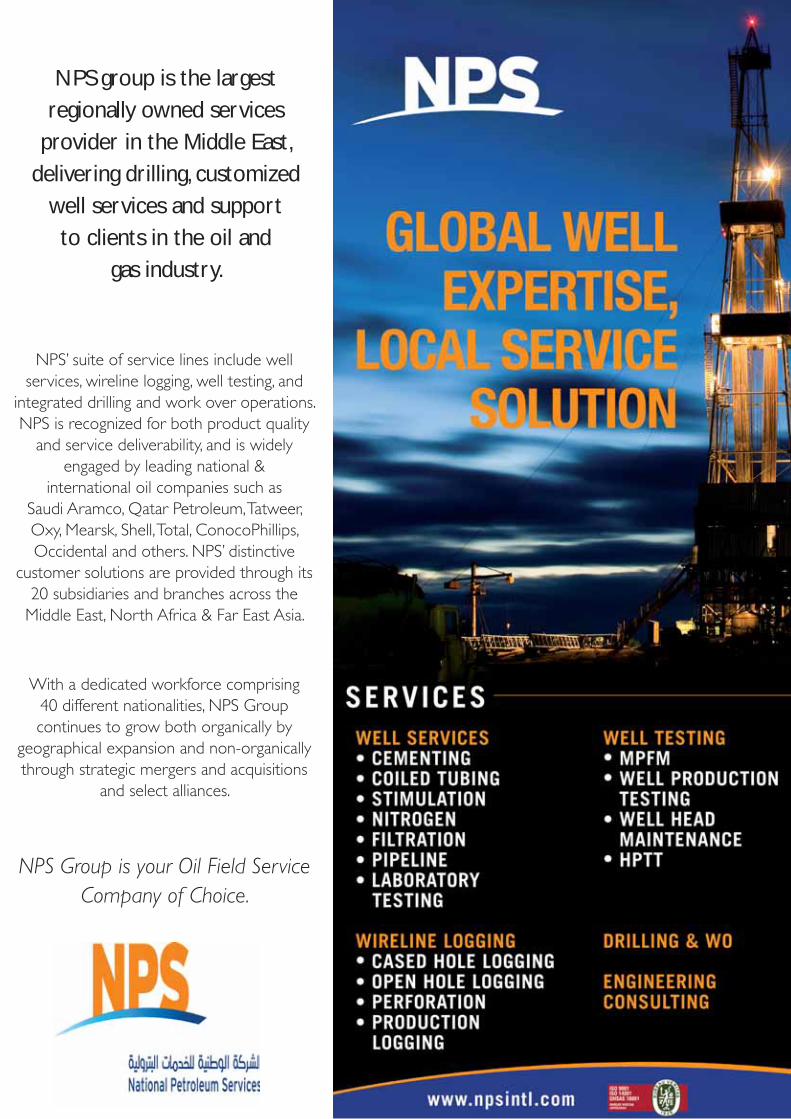
NPS’ suite of service lines include well services, wireline logging, well testing, and
integrated drilling and work over operations. NPS is recognized for both product quality
and service deliverability, and is widely engaged by leading national &
international oil companies such as Saudi Aramco, Qatar Petroleum, Tatweer, Oxy, Mearsk, Shell, Total, ConocoPhillips, Occidental and others. NPS’ distinctive
customer solutions are provided through its 20 subsidiaries and branches across the
Middle East, North Africa & Far East Asia.
With a dedicated workforce comprising 40 different nationalities, NPS Group continues to grow both organically by
geographical expansion and non-organically through strategic mergers and acquisitions
and select alliances.
NPS Group is your Oil Field Service Company of Choice.
NPS group is the largest regionally owned services
provider in the Middle East, delivering drilling, customized
well services and support to clients in the oil and
gas industry.

10
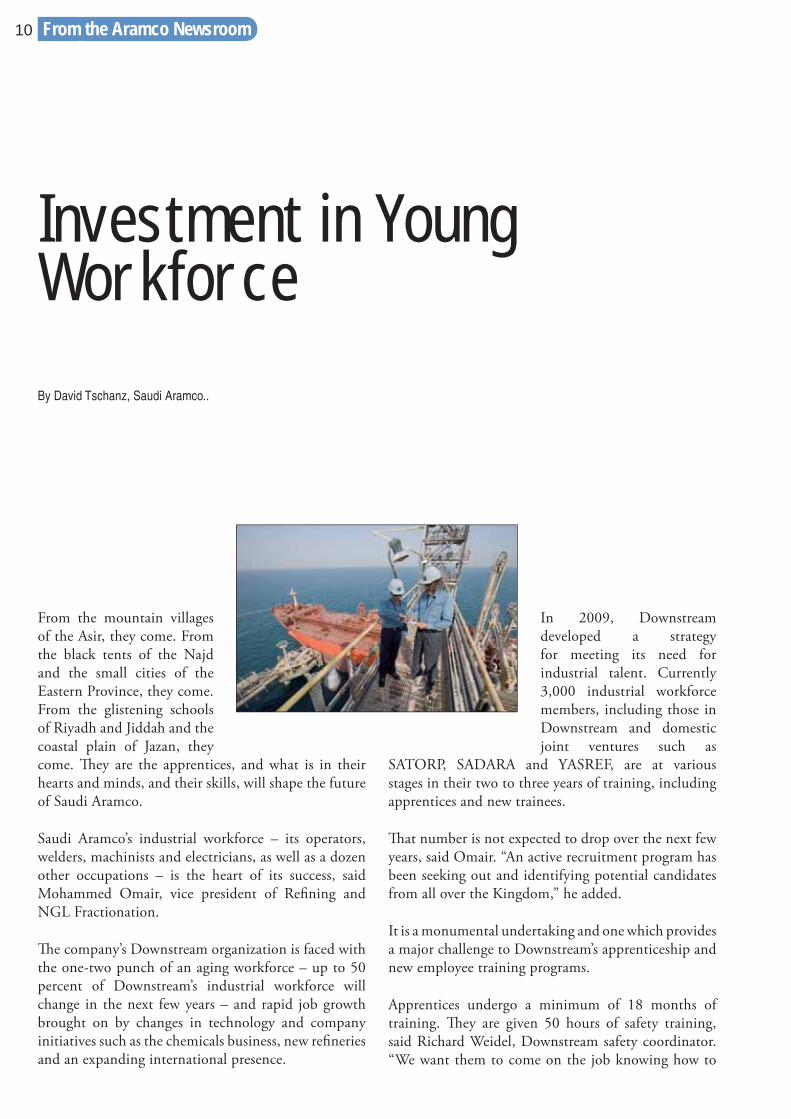
From the mountain villages of the Asir, they come. From the black tents of the Najd and the small cities of the Eastern Province, they come. From the glistening schools of Riyadh and Jiddah and the coastal plain of Jazan, they come. Th ey are the apprentices, and what is in their hearts and minds, and their skills, will shape the future of Saudi Aramco.
Saudi Aramco’s industrial workforce – its operators, welders, machinists and electricians, as well as a dozen other occupations – is the heart of its success, said Mohammed Omair, vice president of Refi ning and NGL Fractionation.
Th e company’s Downstream organization is faced with the one-two punch of an aging workforce – up to 50 percent of Downstream’s industrial workforce will change in the next few years – and rapid job growth brought on by changes in technology and company initiatives such as the chemicals business, new refi neries and an expanding international presence.
Investment in Young Workforce
In 2009, Downstream developed a strategy for meeting its need for industrial talent. Currently 3,000 industrial workforce members, including those in Downstream and domestic joint ventures such as
SATORP, SADARA and YASREF, are at various stages in their two to three years of training, including apprentices and new trainees.
Th at number is not expected to drop over the next few years, said Omair. “An active recruitment program has been seeking out and identifying potential candidates from all over the Kingdom,” he added.
It is a monumental undertaking and one which provides a major challenge to Downstream’s apprenticeship and new employee training programs.
Apprentices undergo a minimum of 18 months of training. Th ey are given 50 hours of safety training, said Richard Weidel, Downstream safety coordinator. “We want them to come on the job knowing how to
From the Aramco Newsroom
By David Tschanz, Saudi Aramco..
www.saudiarabiaoilandgas.com | SA O&G Issue 24
11
be safe and treat the equipment safely.” If successful in completing training, apprentices are hired into the industrial workforce.
All apprentices go through a detailed on-the-job-training (OJT) program that is based on specifi c training for a specifi c plant and piece of equipment, and supported with documented procedures extracted from operating instruction manual. Th is OJT program is critical to providing young workers with real operation practices to conduct safe operation.
Other training plans include providing Refi ning and NGLF plant specifi c simulators for each organization,
customized to operate based on specifi c process fl ow diagrams. Th e simulators give users as close to a real experience as can be achieved, and in an area where experience is a signifi cant productivity multiplier. Training simulators allow for hands-on scenario based training that teaches operators how to deal with normal and emergency situations without compromising the actual plant, worker safety or the environment.
“Th e sheer number of people we’ll be training in a relatively short period of time is staggering,” said Omair. “Getting it right is going to be one of the great challenges facing the company and our new industrial workforce.”
Saudi Aramco’s industrial workforce – its operators, welders, machinists
and electricians, as well as adozen other occupations – is the heart of its success.
From the Aramco Newsroom
12
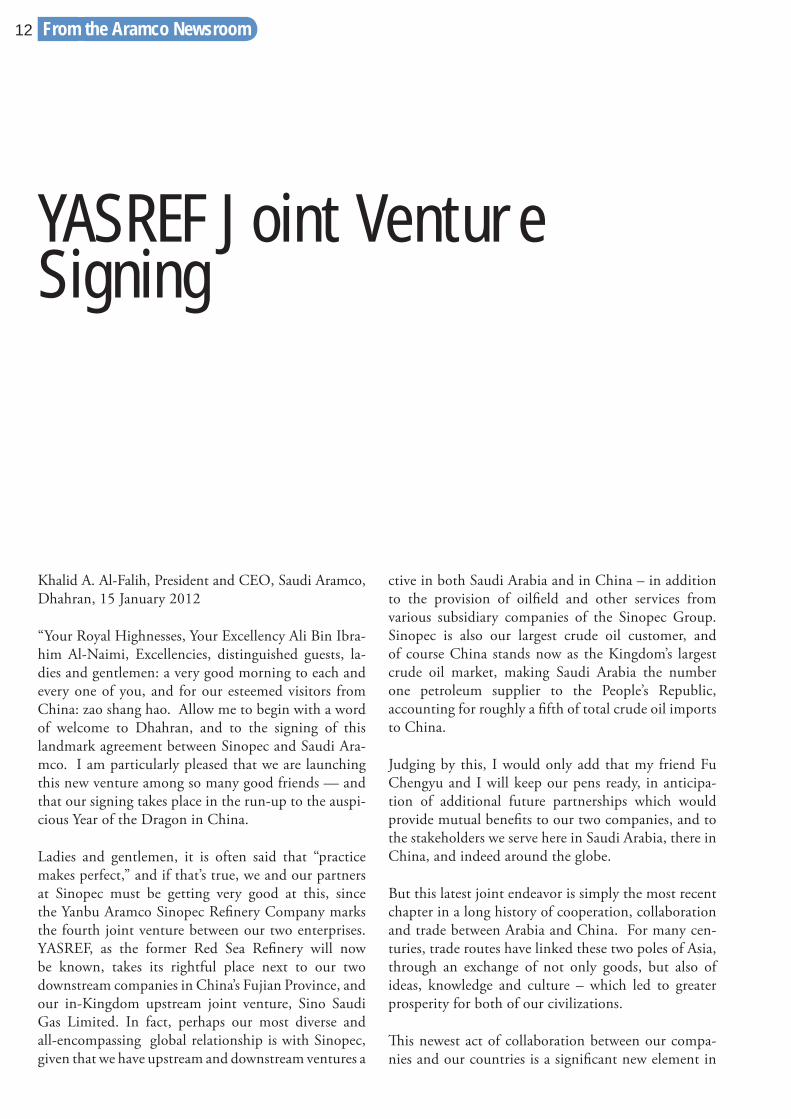
Khalid A. Al-Falih, President and CEO, Saudi Aramco, Dhahran, 15 January 2012
“Your Royal Highnesses, Your Excellency Ali Bin Ibra-him Al-Naimi, Excellencies, distinguished guests, la-dies and gentlemen: a very good morning to each and every one of you, and for our esteemed visitors from China: zao shang hao. Allow me to begin with a word of welcome to Dhahran, and to the signing of this landmark agreement between Sinopec and Saudi Ara-mco. I am particularly pleased that we are launching this new venture among so many good friends — and that our signing takes place in the run-up to the auspi-cious Year of the Dragon in China.
Ladies and gentlemen, it is often said that “practice makes perfect,” and if that’s true, we and our partners at Sinopec must be getting very good at this, since the Yanbu Aramco Sinopec Refi nery Company marks the fourth joint venture between our two enterprises. YASREF, as the former Red Sea Refi nery will now be known, takes its rightful place next to our two downstream companies in China’s Fujian Province, and our in-Kingdom upstream joint venture, Sino Saudi Gas Limited. In fact, perhaps our most diverse and all-encompassing global relationship is with Sinopec, given that we have upstream and downstream ventures a
ctive in both Saudi Arabia and in China – in addition to the provision of oilfi eld and other services from various subsidiary companies of the Sinopec Group. Sinopec is also our largest crude oil customer, and of course China stands now as the Kingdom’s largest crude oil market, making Saudi Arabia the number one petroleum supplier to the People’s Republic, accounting for roughly a fi fth of total crude oil imports to China.
Judging by this, I would only add that my friend Fu Chengyu and I will keep our pens ready, in anticipa-tion of additional future partnerships which would provide mutual benefi ts to our two companies, and to the stakeholders we serve here in Saudi Arabia, there in China, and indeed around the globe.
But this latest joint endeavor is simply the most recent chapter in a long history of cooperation, collaboration and trade between Arabia and China. For many cen-turies, trade routes have linked these two poles of Asia, through an exchange of not only goods, but also of ideas, knowledge and culture – which led to greater prosperity for both of our civilizations.
Th is newest act of collaboration between our compa-nies and our countries is a signifi cant new element in
YASREF Joint VentureSigning
From the Aramco Newsroom
www.saudiarabiaoilandgas.com | SA O&G Issue 24
13
the relationship, for YASREF holds enormous poten-tial and promise. It will help to grow the domestic Saudi economy, and create new opportunities for local enterprises and entrepreneurs, including in the initial engineering, procurement and construction phases of the project. Th is ultra-modern, highly sophisticated grassroots refi nery will process 400-thousand barrels per day of heavy crude oil, and convert every single crude oil molecule into high quality, clean transporta-tion fuels which are in high demand and which meet the most stringent global standards. Th e facility’s loca-tion in Yanbu’, next to two of our other refi neries, is ideal for supplying both overseas markets and the fast-growing western region of the Kingdom.
Ladies and gentlemen, let me stress that the various world-class local and international refi ning and petro-chemical investments Saudi Aramco is making is a tes-
tament to our fi rm belief that the downstream remains an attractive and profi table business. In fact, over the next decade our total global refi ning capacity is expect-ed to approach eight million barrels a day, as a result of the largest expansion today by any oil company in the world.
Th at’s because large petroleum enterprises like us are especially well positioned to maximize long-term value creation from integrated activities encompassing our total value chains, from the wellhead to the gas pump, and to the manufacturing of value-adding fi bers, poly-mers, rubbers and plastics. We are also able to achieve economies of scale, thus furthering competitiveness, as is exhibited by massive projects such as YASREF.
Combine these factors with the additional value which downstream conversion can add to national economies
Th is ultra-modern, highlysophisticated grassroots refi nery will
process 400-thousand barrels per day of heavy crude oil, and convert every single crude oil molecule into high quality, clean transportation
fuels which are in high demand and which meet the most stringent
global standards.
From the Aramco Newsroom
14
– including job creation – and one can vividly see the logic of our downstream strategy.
Ladies and gentlemen, Saudi Aramco is in the down-stream for the long haul, and Sinopec is one company that shares our bullish outlook. I therefore believe Saudi Aramco and Sinopec should continue to col-laborate in this mutually benefi cial arena, both in the Kingdom and in the People’s Republic.
At the same time, we should recognize that YASREF also stands as testament to the sound climate for for-eign direct investment in Saudi Arabia, and as yet an-other indicator of the attractive business opportunities this nation has to off er strategic investors, such as Si-nopec. Saudi Aramco is engaged in a sustained capi-tal program of infrastructure and industrial projects, and in fact the Kingdom as a whole is also pursuing a
diverse range of world-scale undertakings in the trans-portation, utilities, urban construction and industrial sectors. As I have previously shared with our friends in China, I believe Chinese fi rms have a historic op-portunity to invest in the Kingdom and play an impor-tant role in implementing those ambitious plans here in Saudi Arabia.
Of course, a project of this magnitude and scope can-not be launched without visionary leadership, and I would like to take this opportunity to thank His Ex-cellency Ali I. Al-Naimi, our Chairman of the Board and the Kingdom’s Minister for Petroleum & Mineral Resources who recognized long ago back when he was the CEO of Saudi Aramco, the immense potential of partnering with Sinopec and His Royal Highness Prince Saoud ibn Abdallah, the Chairman of the Royal Commission for Jubail and Yanbu’ who facilitated ac-
Sinopec also brings to the table not only technical and market
know-how and a proud history of achievement, but also a soundunderstanding of its role as aleader in the global energy
landscape.
From the Aramco Newsroom
www.saudiarabiaoilandgas.com | SA O&G Issue 24
15
cess to the great infrastructure of the industrial city in Yanbu’; and their respective institutions for their con-tinued encouragement and guidance. I would also like to express my appreciation to all those in the Kingdom and in the People’s Republic who worked in support of the creation of this venture.
Finally, let me return to our partner in this venture, Sinopec. In recent years, this world-class fi rm has gone from strength to strength, strategically expanding its business portfolio and entering new markets around the globe. It has nearly half of China’s total refi ning capacity, and accounts for three-fourths of that nation’s
crude oil trade. Sinopec also brings to the table not only technical and market know-how and a proud his-tory of achievement, but also a sound understanding of its role as a leader in the global energy landscape. Furthermore, it’s commitment to both technological innovation and the communities and economies wher-ever it operates is evident in Sinopec’s establishment of a joint research and development center in the Dhah-ran Techno Valley.
I am particularly pleased to sign this agreement with Mr. Fu Chengyu, the Chairman of the Sinopec Group, and one of the outstanding leaders in the global pe-
Saudi Aramco is engaged in asustained capital program ofinfrastructure and industrial
projects, and in fact the Kingdom as a whole is also pursuing a
diverse range of world-scaleundertakings in the transportation,
utilities, urban construction and industrial sectors.
From the Aramco Newsroom
16
troleum industry today. Th roughout his career, Mr. Fu has exhibited tremendous market savvy, a spirit of entrepreneurship and dynamism, and a deep and abid-ing commitment to global partnerships as the most ef-fective means of achieving strategic objectives in the energy sphere. Now, at the helm of Sinopec, he brings these traits to our many partnerships, and it is indeed a pleasure and an honor to share the podium and the signing table with him today.
Distinguished guests, ladies and gentlemen: there is a great deal of work ahead of us before we can cap the YASREF initiative with success. Engineering, build-ing and commissioning a refi nery of this scale, scope
and sophistication isn’t easy. But we will have skilled teams at work on this project representing the best and brightest talents from both of our companies, a clearly defi ned set of objectives in our sights, the fi rm com-mitment of the world’s best engineering and construc-tion companies, and the continued support of a wide range of Saudi and Chinese institutions. With their collective eff orts, I am confi dent we will implement our plans on schedule, within budget, and to the high-est standards of professionalism and excellence. Th ere-fore, I look forward to the day when we meet again in 2014 to formally inaugurate this landmark project, as well as to continued success in our work alongside Sinopec in every area of the business.”
... we will have skilled teams at work on this project representing the best and brightest talents from both of
our companies, a clearly defi ned set of objectives in our sights, the fi rm
commitment of the world’s bestengineering and constructioncompanies, and the continued
support of a wide range of Saudi and Chinese institutions.
From the Aramco Newsroom

The Stainless Steel Gearbox Range.
Built to withstand the World’smost extreme environments.www.mastergearworldwide.com
18
By USC Alumni.
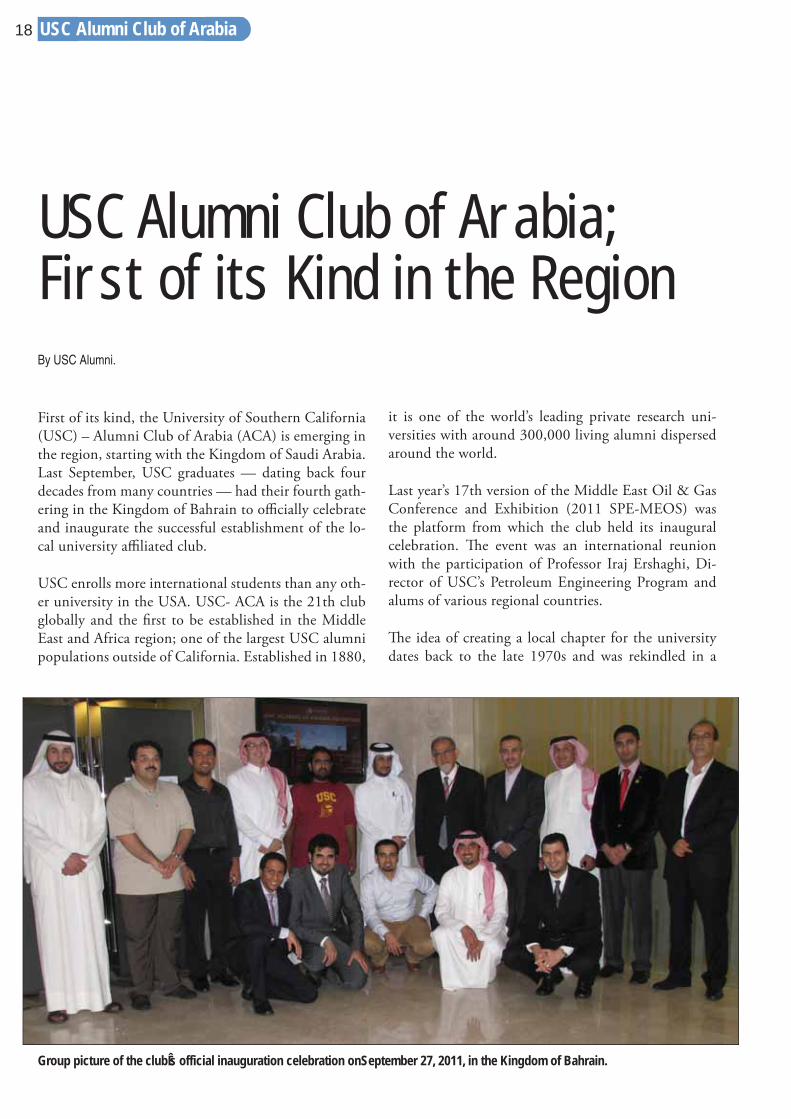
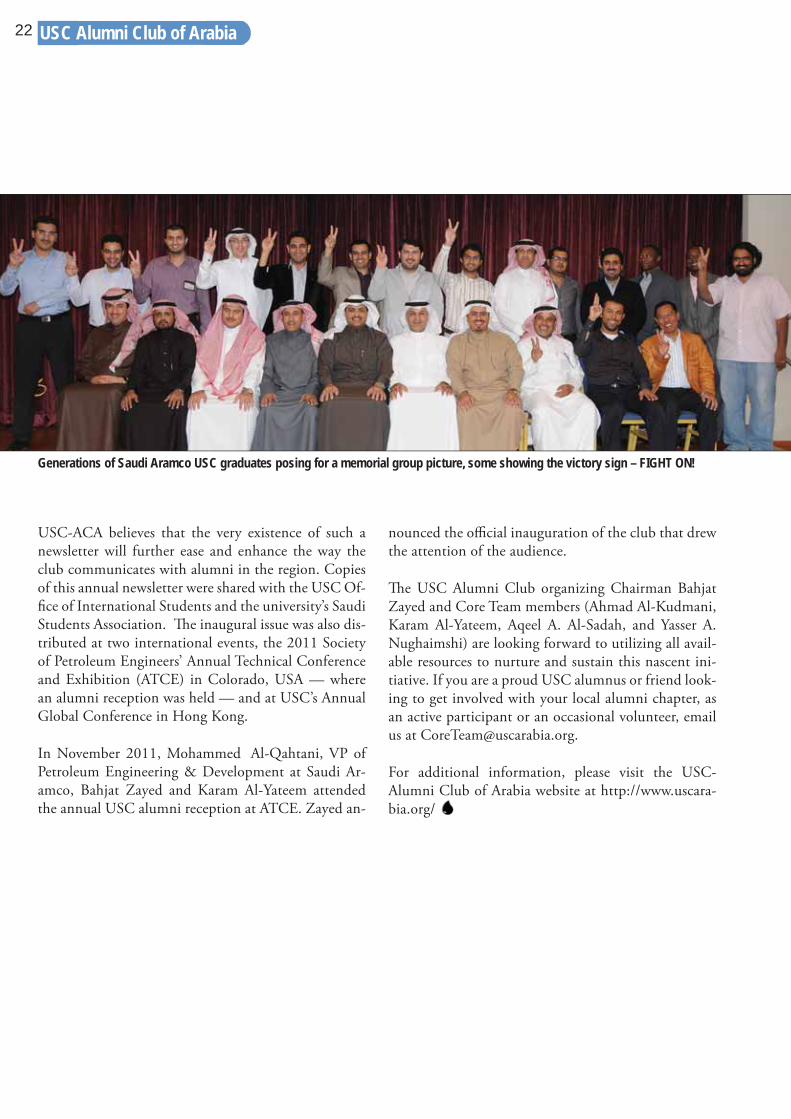
First of its kind, the University of Southern California (USC) – Alumni Club of Arabia (ACA) is emerging in the region, starting with the Kingdom of Saudi Arabia. Last September, USC graduates — dating back four decades from many countries — had their fourth gath-ering in the Kingdom of Bahrain to offi cially celebrate and inaugurate the successful establishment of the lo-cal university affi liated club.
USC enrolls more international students than any oth-er university in the USA. USC- ACA is the 21th club globally and the fi rst to be established in the Middle East and Africa region; one of the largest USC alumni populations outside of California. Established in 1880,
USC Alumni Club of Arabia; First of its Kind in the Region
it is one of the world’s leading private research uni-versities with around 300,000 living alumni dispersed around the world.
Last year’s 17th version of the Middle East Oil & Gas Conference and Exhibition (2011 SPE-MEOS) was the platform from which the club held its inaugural celebration. Th e event was an international reunion with the participation of Professor Iraj Ershaghi, Di-rector of USC’s Petroleum Engineering Program and alums of various regional countries.
Th e idea of creating a local chapter for the university dates back to the late 1970s and was rekindled in a
Group picture of the clubÊs official inauguration celebration onSeptember 27, 2011, in the Kingdom of Bahrain.
USC Alumni Club of Arabia
www.saudiarabiaoilandgas.com | SA O&G Issue 24
19
reunion function for USC alums hosted by the Dean of USC’s Viterbi Engineering School, Professor Yannis C. Yortsos, during the 2009 SPE–MEOS event. Th e need for such an initiative in the region was keenly felt among those wishing to support and connect with fel-low alumni and USC. Hence, a core group decided to start in Saudi Arabia and expand thereafter.
Th e initial gathering, which took place in July 2010, laid the groundwork in assembling the club with the theme “Opportunities for Continued Professional De-velopment and Personal Growth.” Th is reception was organized by Bahjat Zayed, Manager, Southern Area Production Engineering-Saudi Aramco, and sponsored by Mohammad Al-Shammary, at the time President & CEO, Aramco Gulf Operations Company (AGOC) and currently General Manager of Industrial Securi-ty Operations at Saudi Aramco. During the meeting, Bahjat Zayed was elected as the fi rst organizing Chair-man along with volunteers comprising a core team. A subsequent meeting was held in December 2010 where Al-Shammary presented alumni with an overview of
AGOC history and eff orts to meet the increased chal-lenges in the upstream energy business.
Th e culmination of a two year endeavor occurred last September when alumni from across the region attend-ed the inaugural celebration. Th e event started with Ahmad Al-Kudmani and Karam Al-Yateem delivering welcoming remarks with a historical evolution of the USC-ACA. Zayed proceeded with an opening speech noting that “members are from many disciplines, or-ganizations and countries.” He mentioned that with an alumni pool of such a size in the region, the club will proceed to develop programs that meet and ad-dress topics of interest to members, provide support to current and prospective students and provide guidance to others interested in establishing similar alumni clubs in the region.
Th e key note presentation came from Professor Er-shaghi, representing the university at the event. He highlighted the recent ranking of the university, its achievements and accomplishments overall and specifi -
USC- ACA aims to continueproviding stimulating, enriching,
and exciting alumni activities to keep members connected to USC, lifelong
and worldwide.
USC Alumni Club of Arabia
20
cally those of the Viterbi School of Engineering. Many alumni were interested when he shared the school’s vi-sion and aspirations under the recently appointed pres-ident C.L. Max Nikias.
Zayed presented a token of appreciation to the profes-sor on behalf of USC-ACA. All attendees joined in a cake cutting ceremony, which displayed the USC logo in celebrating the inauguration of the club.
USC- ACA aims to continue providing stimulating, enriching, and exciting alumni activities to keep mem-bers connected to USC, lifelong and worldwide. Th e programs include faculty and alumni presentations, cultural events and career networking forums. For USC alumnus Mazen Dalati Ph.D 1995, “Th e network should grow as there are hundreds of USC alumni here in the Arab world and in the Middle East.”
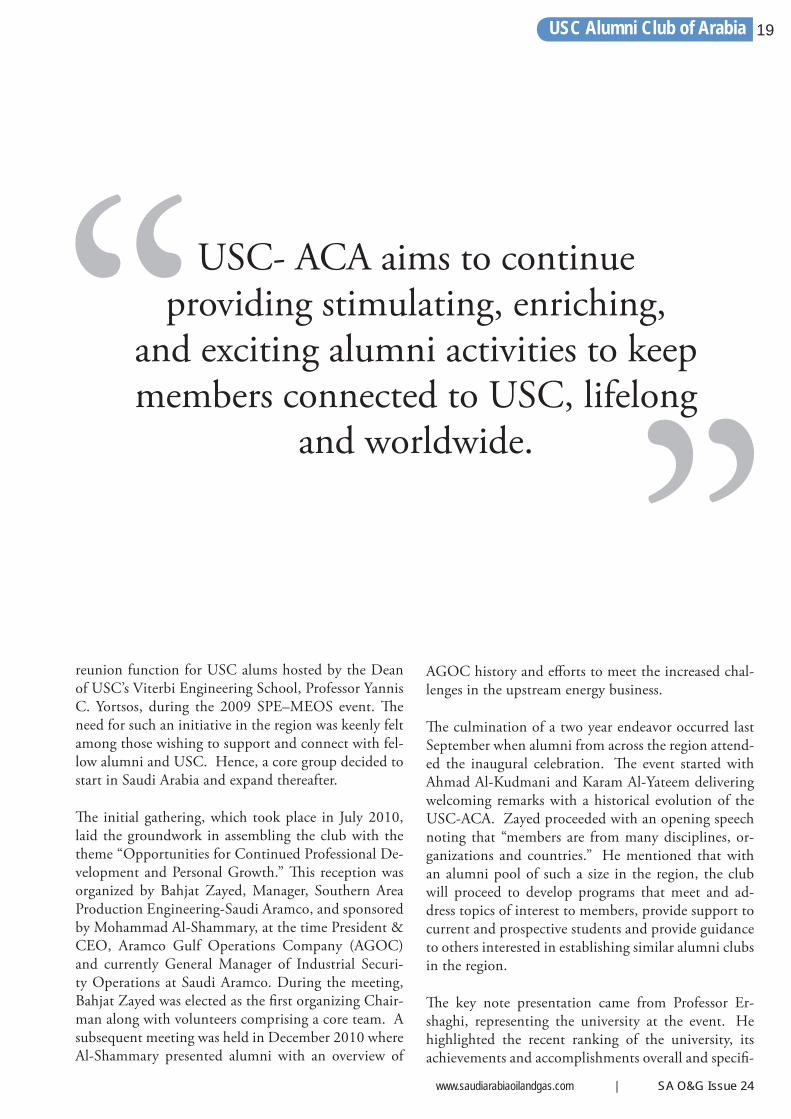
More recently Karam Al-Yateem represented USC-ACA at USC’s International Alumni Leaders Sym-posium in Hong Kong in October 2011. In this private event for current global alumni club leaders USC-ACA and USC Alumni Club of London were the only two clubs not stationed in Far East Asia. Th e symposium provides clubs the opportunity to network with, engage and learn from other international clubs. Al-Yateem thanked USC for the invite while highlight-ing to the audience some of USC-ACA’s accomplish-ments.
On the communication front, From Coast to Coast — the fi rst issue of the club’s offi cial newsletter — was dis-tributed during the inauguration event with thoughts written by key individuals from the university — in-cluding y Scott Mory, CEO of USC Alumni Associa-tion — in addition to various articles.
Karam Al-Yateem posing with USC President C. L. Max Nikias and USC Dean of Viterbi School of Engineering Professor Yannis Yortsos, during the USC International Leaders symposium in Hong Kong.
USC Alumni Club of Arabia
www.saudiarabiaoilandgas.com | SA O&G Issue 24
21
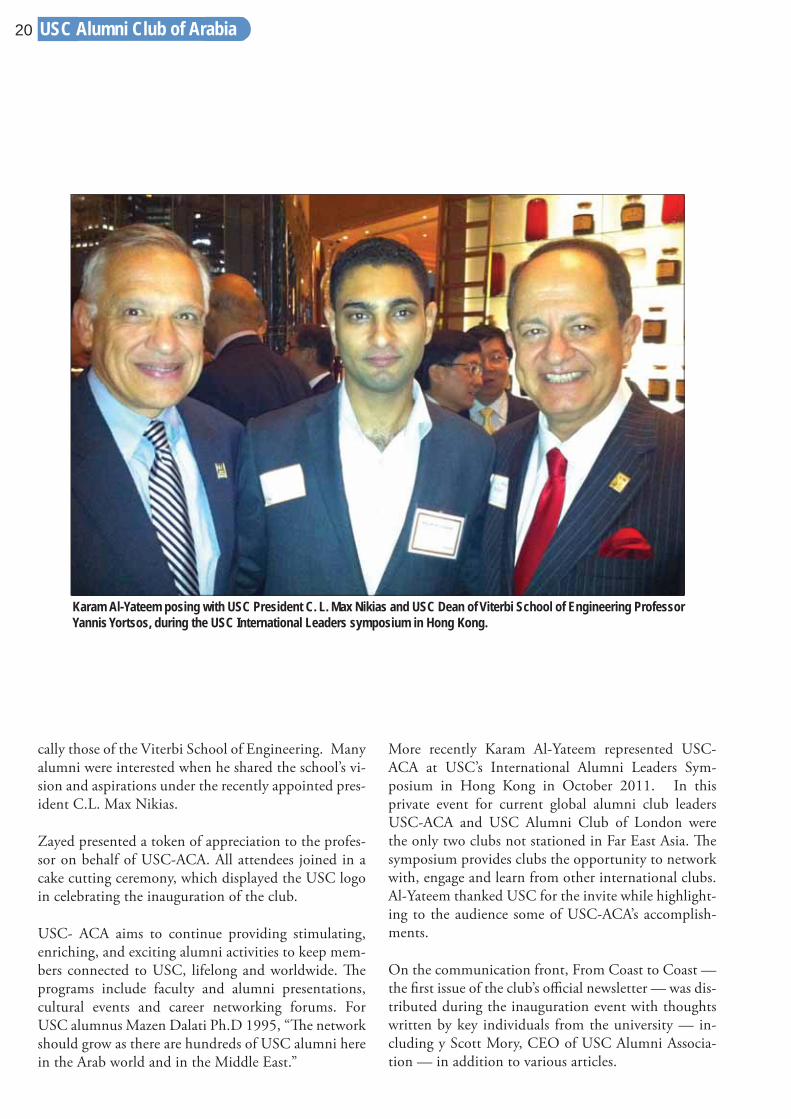
Group pose in an alumni reception in Denver, from right to left, Bahjat Zayed, Yannis Yortsos, Mohammed Y. Al-Qahtani, Donald Paul, Iraj Ershaghi & Mrs. Ershaghi and Karam Al-Yateem.
Group pose with International Alumni Leaders, in the picture appears, Scott M. Mory, Esq. Associate Senior Vice President and CEO (3rd in the back row from left), USC Alumni Association and Jaimey Wiener Senior Associate Director (3rd in the back row from right), Alumni Clubs and Communities.
USC Alumni Club of Arabia
22
USC-ACA believes that the very existence of such a newsletter will further ease and enhance the way the club communicates with alumni in the region. Copies of this annual newsletter were shared with the USC Of-fi ce of International Students and the university’s Saudi Students Association. Th e inaugural issue was also dis-tributed at two international events, the 2011 Society of Petroleum Engineers’ Annual Technical Conference and Exhibition (ATCE) in Colorado, USA — where an alumni reception was held — and at USC’s Annual Global Conference in Hong Kong.
In November 2011, Mohammed Al-Qahtani, VP of Petroleum Engineering & Development at Saudi Ar-amco, Bahjat Zayed and Karam Al-Yateem attended the annual USC alumni reception at ATCE. Zayed an-
nounced the offi cial inauguration of the club that drew the attention of the audience.
Th e USC Alumni Club organizing Chairman Bahjat Zayed and Core Team members (Ahmad Al-Kudmani, Karam Al-Yateem, Aqeel A. Al-Sadah, and Yasser A. Nughaimshi) are looking forward to utilizing all avail-able resources to nurture and sustain this nascent ini-tiative. If you are a proud USC alumnus or friend look-ing to get involved with your local alumni chapter, as an active participant or an occasional volunteer, email us at [email protected].
For additional information, please visit the USC-Alumni Club of Arabia website at http://www.uscara-bia.org/
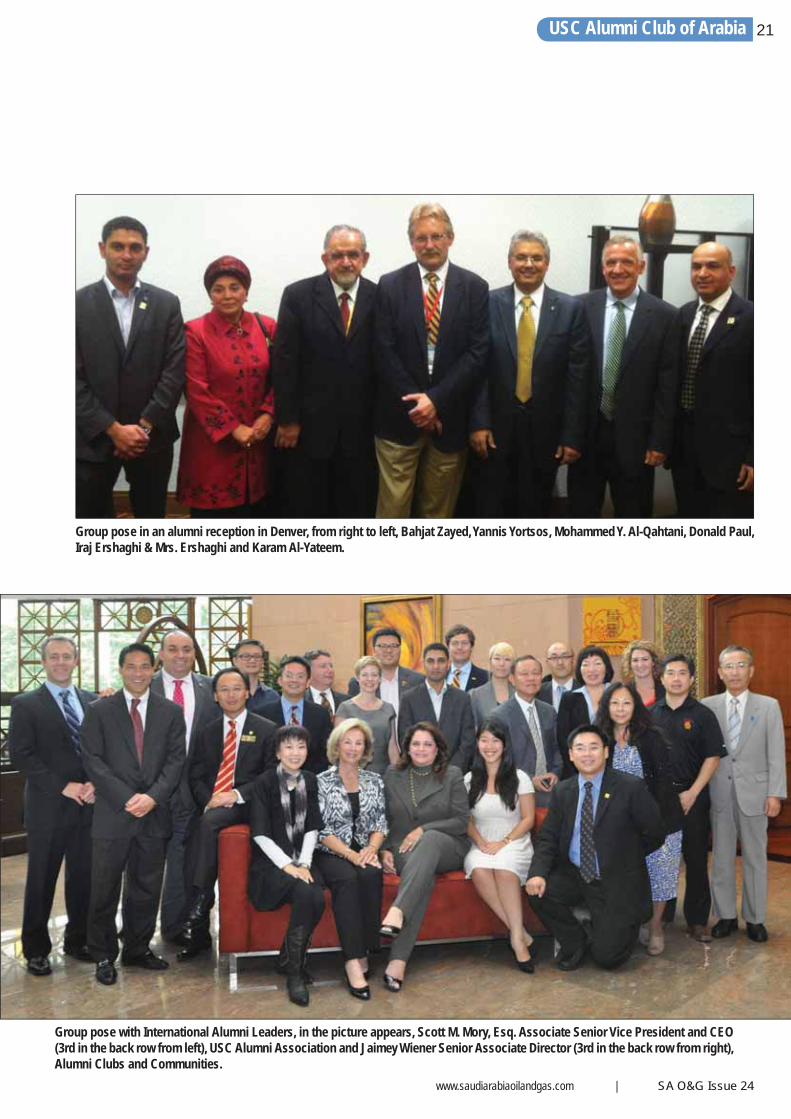
Generations of Saudi Aramco USC graduates posing for a memorial group picture, some showing the victory sign – FIGHT ON!
USC Alumni Club of Arabia
www.saudiarabiaoilandgas.com | SA O&G Issue 24
23Saudi Young Professionals
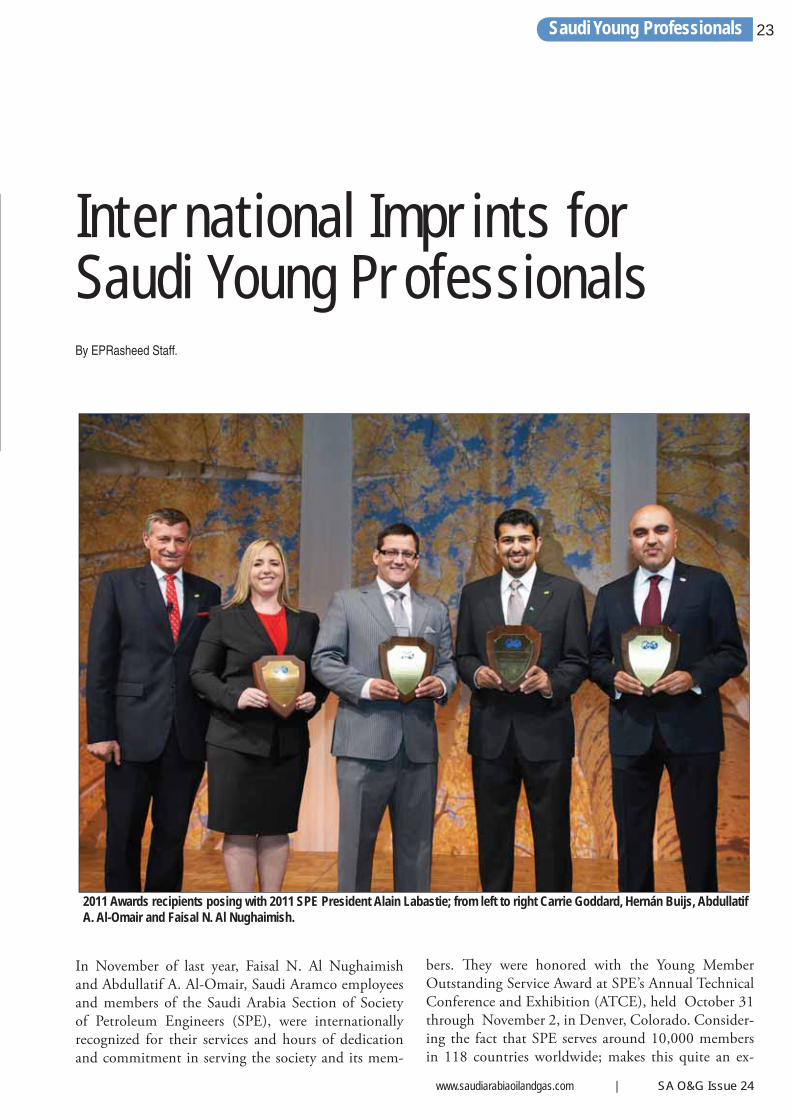
In November of last year, Faisal N. Al Nughaimish and Abdullatif A. Al-Omair, Saudi Aramco employees and members of the Saudi Arabia Section of Society of Petroleum Engineers (SPE), were internationally recognized for their services and hours of dedication and commitment in serving the society and its mem-
International Imprints forSaudi Young Professionals
2011 Awards recipients posing with 2011 SPE President Alain Labastie; from left to right Carrie Goddard, Hernán Buijs, Abdullatif A. Al-Omair and Faisal N. Al Nughaimish.
bers. Th ey were honored with the Young Member Outstanding Service Award at SPE’s Annual Technical Conference and Exhibition (ATCE), held October 31 through November 2, in Denver, Colorado. Consider-ing the fact that SPE serves around 10,000 members in 118 countries worldwide; makes this quite an ex-
By EPRasheed Staff.
24
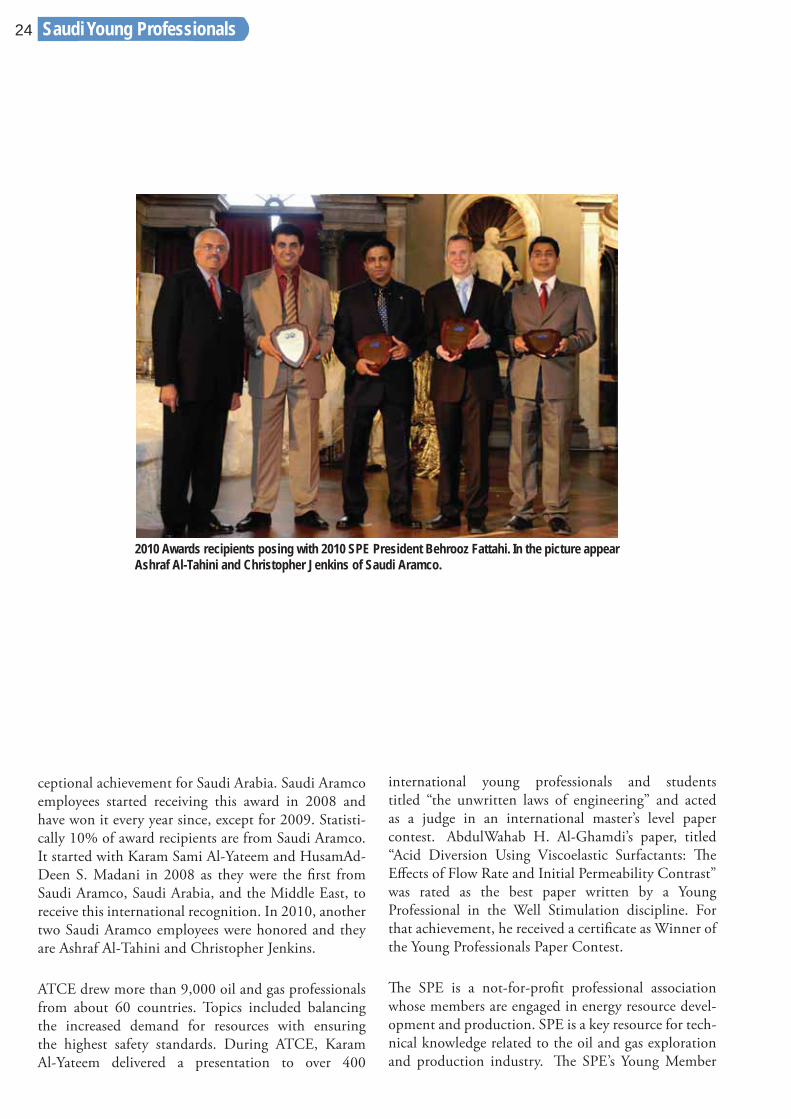
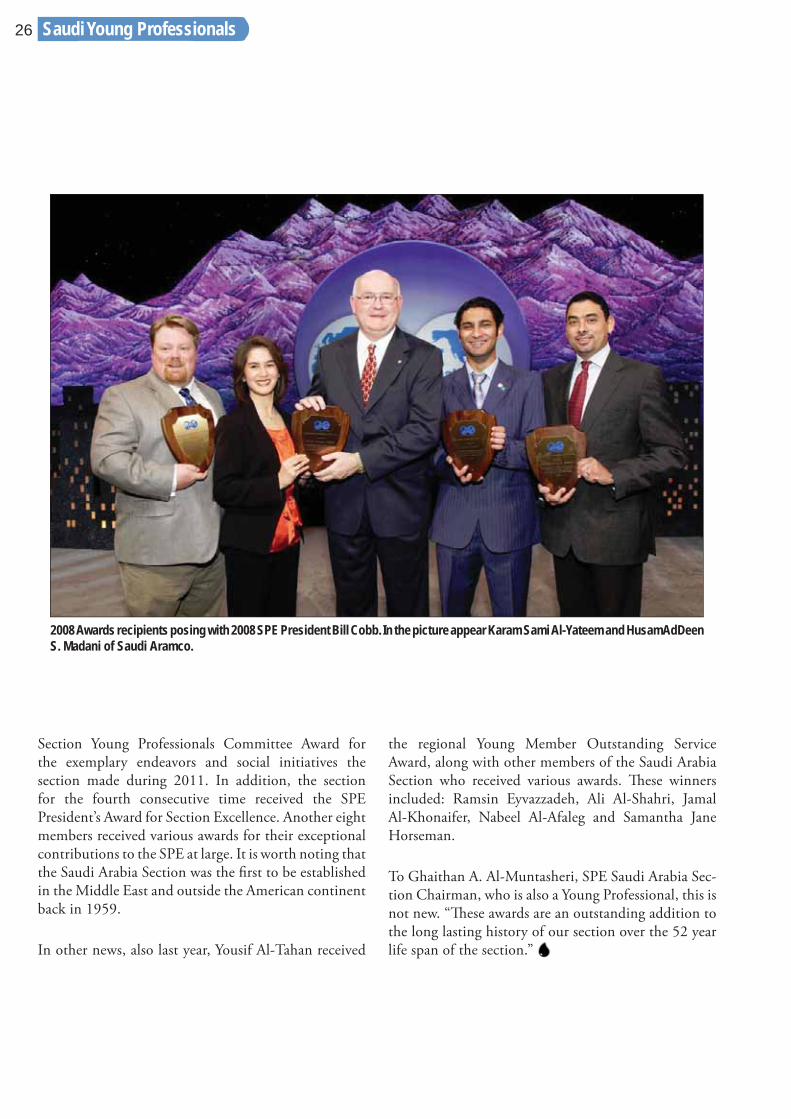
ceptional achievement for Saudi Arabia. Saudi Aramco employees started receiving this award in 2008 and have won it every year since, except for 2009. Statisti-cally 10% of award recipients are from Saudi Aramco. It started with Karam Sami Al-Yateem and HusamAd-Deen S. Madani in 2008 as they were the fi rst from Saudi Aramco, Saudi Arabia, and the Middle East, to receive this international recognition. In 2010, another two Saudi Aramco employees were honored and they are Ashraf Al-Tahini and Christopher Jenkins.
ATCE drew more than 9,000 oil and gas professionals from about 60 countries. Topics included balancing the increased demand for resources with ensuring the highest safety standards. During ATCE, Karam Al-Yateem delivered a presentation to over 400
international young professionals and students titled “the unwritten laws of engineering” and acted as a judge in an international master’s level paper contest. AbdulWahab H. Al-Ghamdi’s paper, titled “Acid Diversion Using Viscoelastic Surfactants: Th e Eff ects of Flow Rate and Initial Permeability Contrast” was rated as the best paper written by a Young Professional in the Well Stimulation discipline. For that achievement, he received a certifi cate as Winner of the Young Professionals Paper Contest.
Th e SPE is a not-for-profi t professional association whose members are engaged in energy resource devel-opment and production. SPE is a key resource for tech-nical knowledge related to the oil and gas exploration and production industry. Th e SPE’s Young Member
2010 Awards recipients posing with 2010 SPE President Behrooz Fattahi. In the picture appear Ashraf Al-Tahini and Christopher Jenkins of Saudi Aramco.
Saudi Young Professionals
www.saudiarabiaoilandgas.com | SA O&G Issue 24
25
Outstanding Service Award recognizes contributions to and leadership in public and community matters, the Society, the petroleum engineering profession, and/or the petroleum industry by SPE members un-der the age of 36. Th is award generally recognizes out-standing contributions in the oil and gas industry. Th e recipients have been nominated by their colleagues and selected by a committee of peers for achievements in their fi eld.
Al Nughaimish’s work is known to most members of the SPE Saudi Arabia section through his continuous support for young professionals and students. He has held several positions in the region, the most recent was chairman of the 2010 SPE/DGS Annual Technical Symposium and Exhibition. Th e event was a fi rst in the
Middle East region. He is also a very active member internationally.
Al-Omair leads and assigns full participation in his personal and professional capacity, seeking to promote, maximize and support the full potential of team, company, SPE, and family. His enthusiastic actions have had a positive impact in promoting technical and leadership skills to the increasingly growing number of young professionals in the industry. Al-Omair is a member of the Executive Board of the SPE Saudi Arabia Section and serves as Vice-Chairperson, Technical Symposium.
On a similar note, Msalli Alotaibi, 2011 vice chairman of the Young Professionals and Students Outreach of the Saudi Arabia Section, received the Outstanding
Saudi Young Professionals
Outstanding Service Awardrecognizes contributions to and
leadership in public and community matters, the Society, the petroleum engineering profession, and/or the
petroleum industry by SPEmembers under the age of 36.
26
Section Young Professionals Committee Award for the exemplary endeavors and social initiatives the section made during 2011. In addition, the section for the fourth consecutive time received the SPE President’s Award for Section Excellence. Another eight members received various awards for their exceptional contributions to the SPE at large. It is worth noting that the Saudi Arabia Section was the fi rst to be established in the Middle East and outside the American continent back in 1959.
In other news, also last year, Yousif Al-Tahan received
the regional Young Member Outstanding Service Award, along with other members of the Saudi Arabia Section who received various awards. Th ese winners included: Ramsin Eyvazzadeh, Ali Al-Shahri, Jamal Al-Khonaifer, Nabeel Al-Afaleg and Samantha Jane Horseman.
To Ghaithan A. Al-Muntasheri, SPE Saudi Arabia Sec-tion Chairman, who is also a Young Professional, this is not new. “Th ese awards are an outstanding addition to the long lasting history of our section over the 52 year life span of the section.”
2008 Awards recipients posing with 2008 SPE President Bill Cobb. In the picture appear Karam Sami Al-Yateem and HusamAdDeen S. Madani of Saudi Aramco.
Saudi Young Professionals
www.saudiarabiaoilandgas.com | SA O&G Issue 24
27
Award/Certification Recipient
2011 PresidentÊs Awards for Section Excellence
and Century Club Award Abdulaziz A. Al-Ajaji
Distinguished Service Award Sami A. Al-Neaim
Distinguished Service Award Sunil L. Kokal
Young Member Outstanding Service Award Faisal N. Al-Nughaimish
Young Member Outstanding Service Award Abdullatif A. Al-Omair
Century Club Award and Membership Contest
Section Award Abdulaziz M. Al-Marshad
Century Club Award Saleh A. Al-Haidary
Century Club Award Sarah H. Al-Mahroos
2011 SPE YP Paper Contest Winner Certificate AbdulWahab H. Al-Ghamdi
Outstanding Section YP Committee Award Msalli A. Al-Otaibi
2011 ATCE Saudi Arabia Section Award & Certification Recipients
Saudi Young Professionals
28
A complex carbonate oilfi eld in Saudi Arabia required pressure support to sustain production. Saudi Aramco was looking to achieve sustained production using the best in-class reservoir management practices. Th e nat-ural drive mechanism came from an aquifer screened from the overlying reservoir by a semi-impermeable tar mat, the geometry of which was relatively unknown, although it was thought to be continuous. Even so, it was suspected that the tar mat might not be completely sealing. Accordingly, any enhanced oil recovery (EOR) plan using traditional water injection would not be ef-fective. Th is article describes a comprehensive, long-term injectivity test whose objective was to characterize reservoir sweep patterns so the optimum number and location of injectors could be determined.
Well placement was criticalTh e initial approach to avoiding the tar mat issue was to geosteer horizontal injector wells so they landed just above the tar mat, in the transition zone between the heavy and light oil. Geologist and reservoir engineers were faced with the challenge of placing the injectors optimally, so injection water would drive crude oil to the producing wells, leaving no movable oil residuals behind.
Before the entire reservoir pressure support scheme was committed, two pilot tests were designed involving a
Reliability Key to Long Term Injectivity Test
By Mubarak A Dhufairi, Khalid AI Omairen, Saudi Aramco, and Paul Docherty, Schlumberger.
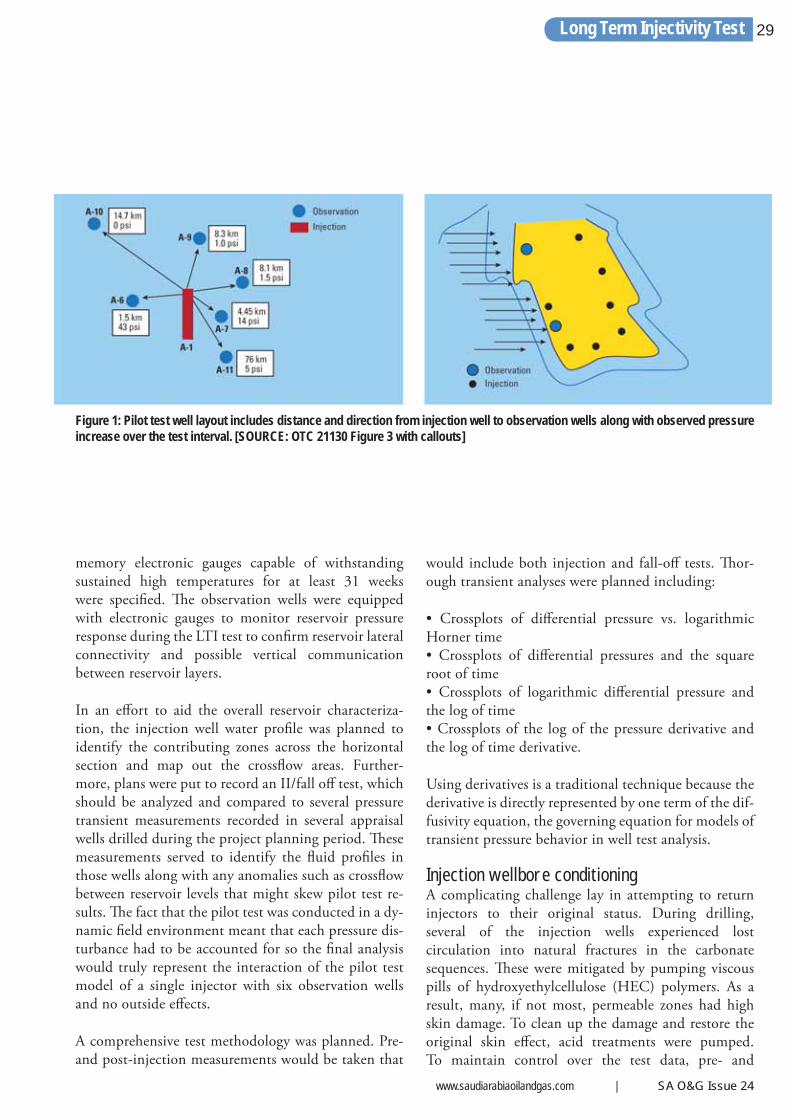
single injector well and six producers located at vary-ing distances and directions. Th e six producers were intended to be utilized for observation and to moni-tor the rate of pressure build up with time for each. Th e producers/observation wells were equipped with downhole permanent and/or retrievable, high-accu-racy, long-lasting, battery-powered electronic gauges. It was decided to perform a long-term injectivity (LTI) test with the objective of mapping the sweep pattern and eff ectiveness of the injection scheme, in addition to qualifying the injection wells placement strategy. Th erefore, to obtain supportable results, a massive test was envisioned involving some 3 million bbl of injected water over a 200-day period. Reliability, resolution and accuracy of the downhole gauges was absolutely essen-tial because it was predicted that changes due to injec-tion water could be quite subtle, particularly on the most remote wells in the observation pattern. At the same time, reliability of the injection setup and equip-ment was equally important. Any breakdowns could completely mask the data transients the engineers were trying to measure.
Design anticipates tough conditions With such reservoir conditions, proper placement of injection wells relative to producing wells was of paramount concern to deliver production targets with the highest sweep effi ciency model. Robust dual
Long Term Injectivity Test
ESPs used in non-traditional role help profi le production incarbonate oilfi eld to unlock higher reservoir potential
www.saudiarabiaoilandgas.com | SA O&G Issue 24
29
memory electronic gauges capable of withstanding sustained high temperatures for at least 31 weeks were specifi ed. Th e observation wells were equipped with electronic gauges to monitor reservoir pressure response during the LTI test to confi rm reservoir lateral connectivity and possible vertical communication between reservoir layers.
In an eff ort to aid the overall reservoir characteriza-tion, the injection well water profi le was planned to identify the contributing zones across the horizontal section and map out the crossfl ow areas. Further-more, plans were put to record an II/fall off test, which should be analyzed and compared to several pressure transient measurements recorded in several appraisal wells drilled during the project planning period. Th ese measurements served to identify the fl uid profi les in those wells along with any anomalies such as crossfl ow between reservoir levels that might skew pilot test re-sults. Th e fact that the pilot test was conducted in a dy-namic fi eld environment meant that each pressure dis-turbance had to be accounted for so the fi nal analysis would truly represent the interaction of the pilot test model of a single injector with six observation wells and no outside eff ects.
A comprehensive test methodology was planned. Pre-and post-injection measurements would be taken that
would include both injection and fall-off tests. Th or-ough transient analyses were planned including:
• Crossplots of diff erential pressure vs. logarithmic Horner time• Crossplots of diff erential pressures and the square root of time• Crossplots of logarithmic diff erential pressure and the log of time• Crossplots of the log of the pressure derivative and the log of time derivative.
Using derivatives is a traditional technique because the derivative is directly represented by one term of the dif-fusivity equation, the governing equation for models of transient pressure behavior in well test analysis.
Injection wellbore conditioning A complicating challenge lay in attempting to return injectors to their original status. During drilling, several of the injection wells experienced lost circulation into natural fractures in the carbonate sequences. Th ese were mitigated by pumping viscous pills of hydroxyethylcellulose (HEC) polymers. As a result, many, if not most, permeable zones had high skin damage. To clean up the damage and restore the original skin eff ect, acid treatments were pumped. To maintain control over the test data, pre- and
Figure 1: Pilot test well layout includes distance and direction from injection well to observation wells along with observed pressure increase over the test interval. [SOURCE: OTC 21130 Figure 3 with callouts]
Long Term Injectivity Test
30
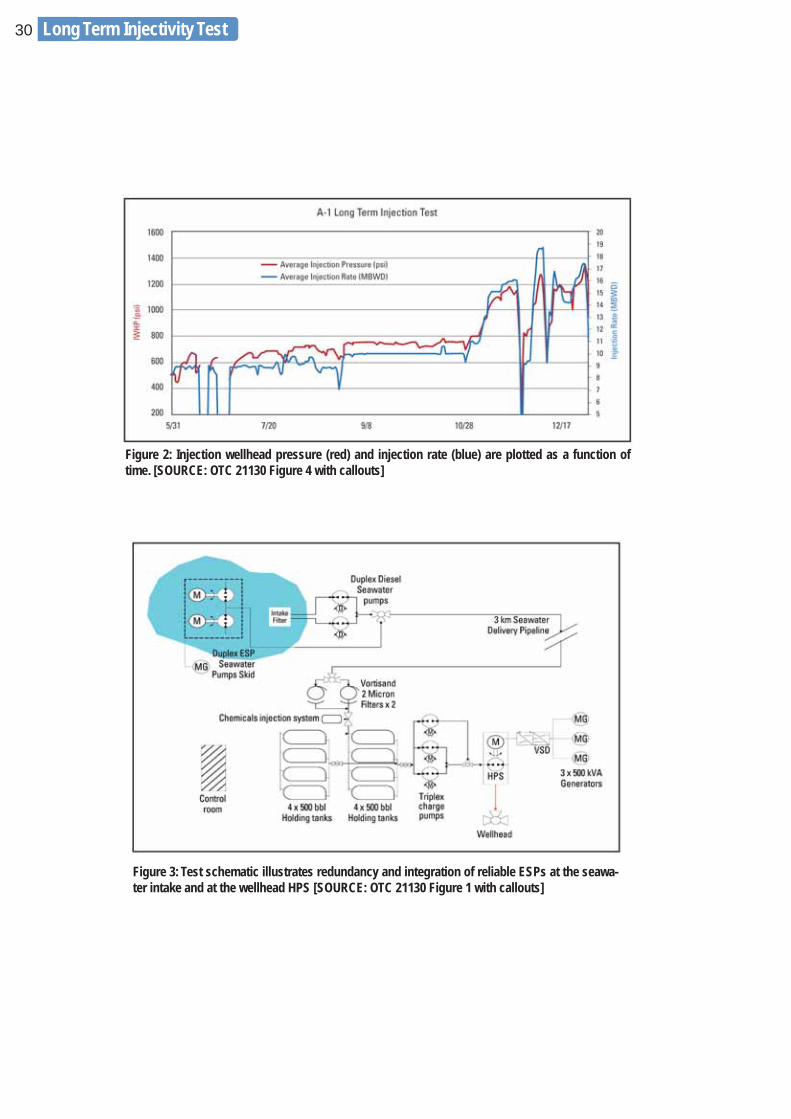
Figure 2: Injection wellhead pressure (red) and injection rate (blue) are plotted as a function of time. [SOURCE: OTC 21130 Figure 4 with callouts]
Figure 3: Test schematic illustrates redundancy and integration of reliable ESPs at the seawa-ter intake and at the wellhead HPS [SOURCE: OTC 21130 Figure 1 with callouts]
Long Term Injectivity Test
www.saudiarabiaoilandgas.com | SA O&G Issue 24
31
post-treatment injectivity tests were run. Th e skin mitigation program was not without its challenges. Deployed into the lateral using coiled tubing pulled by a downhole tractor, the tools became clogged with lost circulation material. A solution was implemented involving bullheading 300 bbl of solvent to dissolve the material that was aff ecting the control assembly of the tractor.
Th e post-treatment injection measurements, made us-ing downhole gauges deployed on slickline, consisted of pumping 20,000 bbl of treated seawater into the formations; then pausing to conduct a pressure fall-off test. Th e fall-off test, which took 96 hours, provided vital information regarding the parameters of the in-jection scheme. Near-wellbore skin, interwell average reservoir pressure and permeability were determined.
Injection well performance was assessed using Hall-ef-fect plots, based on injection volume and surface injec-tion pressures.
Surface facilities designed for reliabilityTo avoid further complications, considerable forethought was built-in to the surface system. Basically the plan was to use treated seawater, pumped through a 1.9 mile (3 km) 6-in. diameter pipeline. At the injection well site, two, 2-micron,Vortisand™ sand fi lters were deployed plus a chemical injection module before the water was pumped into eight, 500 bbl skid-mounted holding tanks. Th e tanks supplied a set of electrically-powered triplex charge pumps providing input to the horizontal above-ground ESP pumping system (HPS). Th e pumps were energized using a Schlumberger variable speed drive (VSD) powered by
three 500 kVA generator sets.
At the intake, duplex diesel-powered pumps drew sea-water from a shallow seaside location. Th ese proved to be unreliable and were replaced by duplex submerged ESPs supplied by a motor generator. To assure the LTI test as a reliable source of injection water, the ESPs were determined to be the best solution. Th e original diesel pumps were retained onsite as backup. System design capacity was 20,000 bbl/day. At the wellhead, the HPS delivered 10,000 bbl/day of fi ltered, treated seawater at up to 2,500 psi.
During the design and construction of the surface fa-cility, several important lessons were learned:
• Ensure pump intakes were deep, clean and clear of sand and debris• Ensure pump not deadheaded into a closed valve• Address careful alignment of shafts• Provide a compressor to facilitate system maintenance• Install tank supports to keep bottom valves acces-sible• Use duplex pumps to provide system integrity and backup• Provide concrete bases for rotating equipment• Install a subsurface safety valve to block H2S fl ow-back from well• Perform full review of generators and VSDs for com-patibility
Injectivity tests reduce uncertainties,save moneyTh e pilot injectivity tests were very successful. Dynamic data, including pressure transient analysis, removed
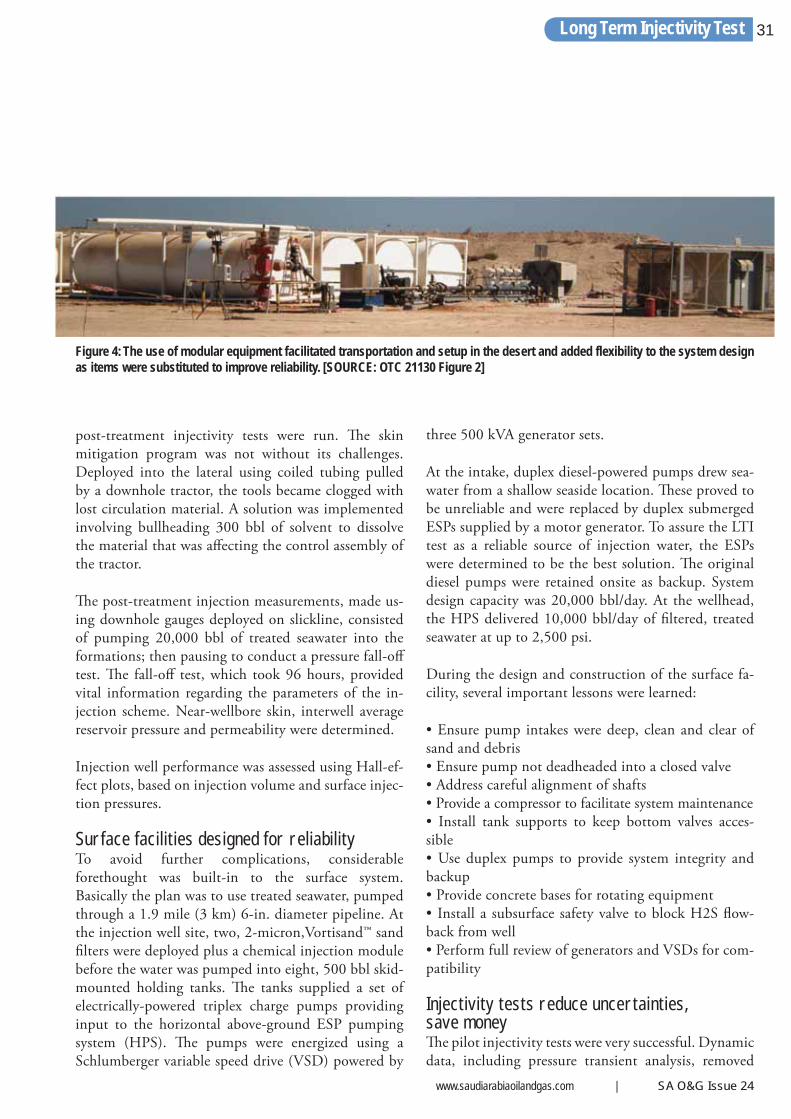
Figure 4: The use of modular equipment facilitated transportation and setup in the desert and added flexibility to the system design as items were substituted to improve reliability. [SOURCE: OTC 21130 Figure 2]
Long Term Injectivity Test
32
BiographiesMubarak A. Al-Dhufairi is a Production Engineering Supervisor of the Manifa development. His experience includes working on several fi elds, including Safaniya, Shaybah and Berri fi elds, along with his experience in
drilling engineering. Mubarak received both his B.S. and M.S. degrees in Petroleum Engineering from King Fahd University of Petroleum and Minerals (KFUPM), Dhahran, Saudi Arabia.
Khalid Al-Omairen holds over 25 years of experience in the Oil & Gas industry. His fi rst assignment right after graduation was with Production Engineering for Aindar fi eld in 1986. Later
on, he worked as a Foreman and a Superintendent for several off shore and onshore facilities, including Northern Area Oil Operations (NAOO) Well Services Division. Currently, Khalid is the General
Supervisor of Safaniya Production Engineering Division overseeing over 2 MMBOD. He has a unique passion to create a work culture attached to continuous simplifi cation of the routine through the adaptation of new technologies and process improvement, a culture that is proactive and fl exible enough to accept change and resist returning to old time thinking. Khalid received his B.S. degree in Petroleum Engineering from the University of Louisiana, Lafayette, LA.
Paul R.J. Docherty is an Electrical Engineer. He worked for Shell and Esso as an Electrical Engineer on the FLAGS project upon leaving university, before moving to BP Wytch Farm and joining
the ESP Task Force at that location. Paul has some 25 years of experience in ESP Systems, having worked for Schlumberger for 22 years in various capacities. He received his Polytechnic Diploma from Northumbria University, Newcastle, U.K.
several faults from the geological model. At least 13 injector wells were dropped from the fi eld development plan, largely because uncertainties about the tar mat sealing were redefi ned. System design issues were successfully resolved to address test goals and result in almost 96% uptime. It was determined that lower powered water injector pumps were required because the injectivity index turned out to be better than expected, and ESPs proved more reliable than diesel-powered pumps. Schlumberger pressure gauge systems
and permanent downhole monitors proved both rugged and reliable over the 31-week test period in a hot and highly corrosive environment.
Importantly, data integration with other sources such as drilling data, fi eld production history, available geol-ogy and petrophysical analysis from well logs all helped to mitigate risks of skewed interpretation.
*Mark of Schlumberger
MaSdifiSa
KoiHaPA
on he worked as a For
PEwaFuB
Long Term Injectivity Test
UNITED KINGDOMAdam Mehar268 Bath Road, Slough, Berkshire,United Kingdom Main 44 1753 708872Fax 44 1753 725460Mobile 44 777 [email protected]
UNITED ARAB EMIRATESAbdul [email protected]: (971) 5056 8515
SAUDI ARABIAAkram ul HaqPO Box 3260, Jeddah [email protected]: (966) 557 276 426
Saudi Arabia Oil & Gas (Online) ISSN 2045-6689
Saudi Arabia Oil & Gas (Print) ISSN 2045-6670
For advertising, contact:
www.saudiarabiaoilandgas.com
34 Horizontal Drilling in Saudi Arabia
AbstractWith the focus on continuous drilling optimization, a collaborative eff ort was implemented to analyze and assess drilling challenges encountered while drilling ex-tended horizontal wells in the Khurais fi eld in Saudi Arabia. Th e primary goal was to enhance the effi ciency of conventional downhole motor systems for direc-tional drilling in the challenging horizontal reservoir section. Khurais fi eld is located in a remote area in the central part of Saudi Arabia, approximately 200 km from the Saudi capital, Riyadh, and 300 km from the Eastern Province port city of Dammam. Th e producer wells are drilled in the middle of the fi eld and the water injector wells are drilled close to the fi eld boundaries.
An average of 12 rigs worked simultaneously through-out the duration of the project to drill and complete the required increment wells. Th e horizontal wells comprise the producers, trilateral producers and pow-er water injectors. Th e wells are drilled to an average measured depth (MD) of 14,000 ft, with an average of 6,500 ft of open hole section across the reservoir. Th e 61⁄8” horizontal open hole section is particularly
Successful Application of New Sliding Technology for Horizontal Drilling in Saudi Arabia
By Roberto H. Tello Kragjcek, Abdullah S. Al-Dossary, Waleed G. Kotb and Abdelsattar H. El-Gamal.
Reprinted with kind permission from Saudi Aramco Journal of Technology.
challenging. It is drilled with steerable mud motors with the assistance of real time geosteering and logging while drilling tools to maintain the horizontal open hole section of the well close to the top of the reservoir within a window of 3 ft.
Th e fracture intervals, coupled with high permeability, make the drilling of this section particularly challeng-ing, as mud losses are frequently encountered in this section. Th e improve the ROP during the sliding proc-ess by almost 50% and presents real cases supported by fi eld data. It also underscores the importance of post-action reviews and rig crew training in the achievement of record ROP in the sliding mode. Historical cases are presented, and the benefi ts of the application of this technology in these wells are explained.
Introduction An innovative slider system was trial tested in the 61⁄8” horizontal section of Khurais’ power water injec-tor wells across the reservoir. Th is section was drilled through the Arab formation, consisting of four mem-bers composed of porous layers of carbonates separated by anhydrite. Because special equipment was to be run
www.saudiarabiaoilandgas.com | SA O&G Issue 24
35Horizontal Drilling in Saudi Arabia
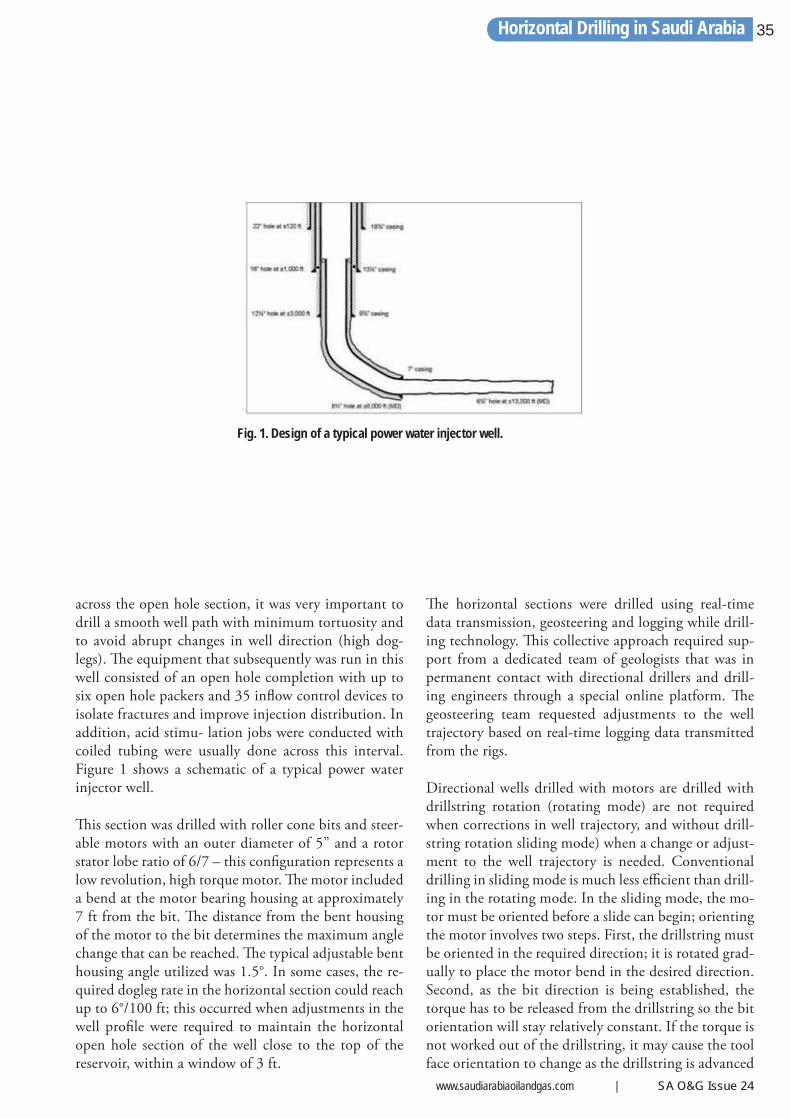
across the open hole section, it was very important to drill a smooth well path with minimum tortuosity and to avoid abrupt changes in well direction (high dog-legs). Th e equipment that subsequently was run in this well consisted of an open hole completion with up to six open hole packers and 35 infl ow control devices to isolate fractures and improve injection distribution. In addition, acid stimu- lation jobs were conducted with coiled tubing were usually done across this interval. Figure 1 shows a schematic of a typical power water injector well.
Th is section was drilled with roller cone bits and steer-able motors with an outer diameter of 5” and a rotor stator lobe ratio of 6/7 – this confi guration represents a low revolution, high torque motor. Th e motor included a bend at the motor bearing housing at approximately 7 ft from the bit. Th e distance from the bent housing of the motor to the bit determines the maximum angle change that can be reached. Th e typical adjustable bent housing angle utilized was 1.5°. In some cases, the re-quired dogleg rate in the horizontal section could reach up to 6°/100 ft; this occurred when adjustments in the well profi le were required to maintain the horizontal open hole section of the well close to the top of the reservoir, within a window of 3 ft.
Th e horizontal sections were drilled using real-time data transmission, geosteering and logging while drill-ing technology. Th is collective approach required sup-port from a dedicated team of geologists that was in permanent contact with directional drillers and drill-ing engineers through a special online platform. Th e geosteering team requested adjustments to the well trajectory based on real-time logging data transmitted from the rigs.
Directional wells drilled with motors are drilled with drillstring rotation (rotating mode) are not required when corrections in well trajectory, and without drill-string rotation sliding mode) when a change or adjust-ment to the well trajectory is needed. Conventional drilling in sliding mode is much less effi cient than drill-ing in the rotating mode. In the sliding mode, the mo-tor must be oriented before a slide can begin; orienting the motor involves two steps. First, the drillstring must be oriented in the required direction; it is rotated grad-ually to place the motor bend in the desired direction. Second, as the bit direction is being established, the torque has to be released from the drillstring so the bit orientation will stay relatively constant. If the torque is not worked out of the drillstring, it may cause the tool face orientation to change as the drillstring is advanced
Fig. 1. Design of a typical power water injector well.
36
for drilling. Th e bit is initially pointed in a direction clockwise from the desired drilling direction, thereby counteracting the reactive torque of the motor. Th is process is often dif-fi cult and ineffi cient to implement1.
Based on an analysis of approximately 280 horizon-tal wells drilled with steerable motors in Khurais fi eld, it was found that approximately 30% of the drilling time was spent in the sliding drilling mode. In a sliding mode, hole cleaning is less effi cient because there is no pipe rotation and cuttings accumulate on the low side of the hole and produce excessive friction that makes it progressively more diffi cult for the drillstring to slide smoothly. Th is friction also makes it diffi cult to keep a constant weight on the bit (WOB); consequently, the stalling of the steerable motor becomes an issue. Main-taining an acceptable rate of penetration (ROP) while preventing the motor from stalling requires that the motor be operated in a narrow load range. To mini-mize the problems with maintaining WOB and pre-venting motor stalling, roller cone bits were used in the Khurais project. Rotary steerable systems (RSSs) with point-the-bit technology were also utilized in the Khurais project. Th is technology was only used to drill the last part of the extended horizontal sections,
when it was diffi cult to continue drilling with steerable motors due to the high friction that made the sliding process very diffi cult. Th e cost of RSS tools is much higher than that of the conventional steerable motors; the new technology presented in this article allows the drilling of higher horizontal displacements with con-ventional steerable motors, thereby minimizing the overall directional drilling costs.
Brief Description of theStandard Drilling ProcessTh e directional drilling plan for a typical Khurais well requires landing the 7” liner on top of the reservoir at 88°. Th e 61⁄8” horizontal section is drilled to 89° at a 2°/100 ft buildup rate, and the angle is held to to-tal depth (TD) at approximately 14,000 ft measured depth (MD). To maintain the well trajectory in a win-dow of 3 ft close to the top of the reservoir, a series of rotating and sliding intervals is required, following the instructions of the specialized geosteering center. Tool face orientation can shift with changes in WOB and torque; as weight is applied to the bit, torque at the bit increases. Th erefore, the overall gross ROP is much less during sliding mode with a steerable motor than during rotating mode. It is not unusual to have the
To maintain the well trajectory in a window of 3 ft close to the top of
the reservoir, a series of rotatingand sliding intervals is required,following the instructions of the
specialized geosteering center.
Horizontal Drilling in Saudi Arabia
www.saudiarabiaoilandgas.com | SA O&G Issue 24
37
sliding ROP be as much as 70% less than the rotating ROP2.
To execute a slide, the driller normally stops drilling, picks up the drill bit off the bottom and reciprocates the drillstring to release trapped torque. Th e downhole motor, with its bent housing approximately 7 ft above the bit, experiences an equal force in the opposite di-rection (left) of the bit rotation, called reactive torque. To compensate for the eff ect of the reactive torque on the bit, the driller then must reorient the tool face (clockwise) and control the slack off at the surface to achieve the desired tool face angle. Th e average clock-wise direction compensation required was about 40° in the wells drilled in Khurais fi eld.
Weight is transferred to the bit by slacking off at the surface. Th e diff erence between the weight that the bit actually receives and the amount slacked off at the surface is the drag force that opposes pipe movement. Controlling bit weight in the sliding mode is diffi cult because of the friction (drag) in extended sections, which can cause the WOB to be released suddenly. If a sudden transfer of weight to the bit exceeds what the downhole motor can handle, the motor will stall and the bit rotation will come to a sudden halt. Such stall-ing conditions can damage the rubber of the steerable motor stator; the amount of damage depends on the amount of the weight transferred to the bit and the number of times the motor stalls. Sudden transfers of weight to the bit are often diffi cult to prevent1, 2.
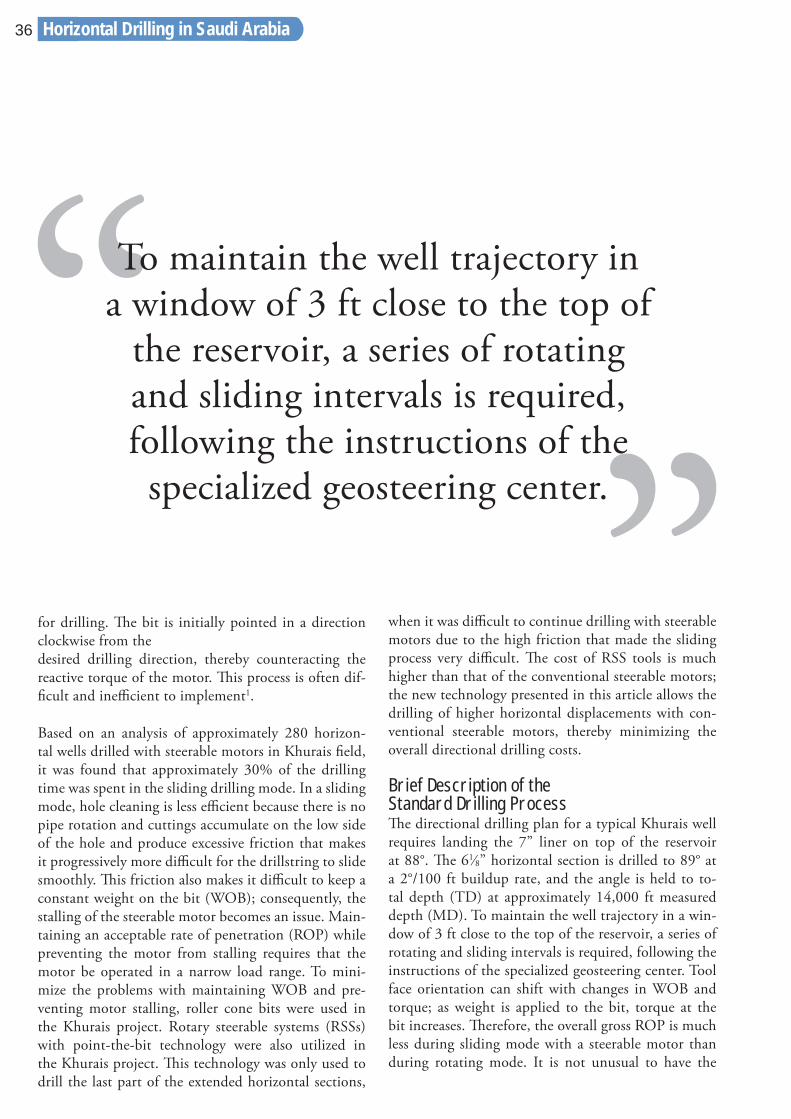
Fig. 2. Illustration of how the new slider technology works.
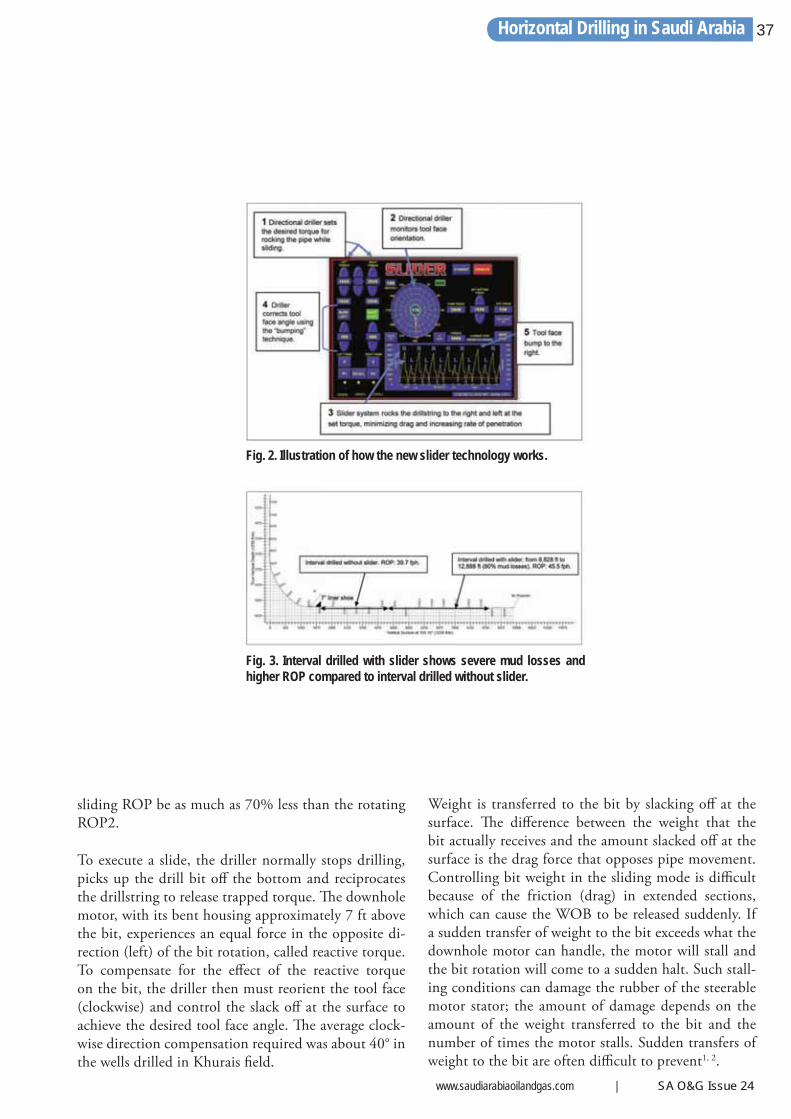
Fig. 3. Interval drilled with slider shows severe mud losses and higher ROP compared to interval drilled without slider.
Horizontal Drilling in Saudi Arabia
38
In conventional sliding mode, achieving the proper ori-entation of the tool face becomes more challenging the more that the horizontal departure increases because of the increased diffi culty in eliminating torque from the system during initial reciprocations. Once a proper tool face orientation is achieved, maintaining that ori-entation also becomes more diffi cult with increasing horizontal departuresbecause the weight transfer to the bit becomes more erratic, thereby aff ecting the reac-tive torque, and consequently changing the tool face angle1. Th e solution to this problem, Fig. 2, describes a sequence of steps to illustrate how the new slider sys-tem works.
New Steerable Motor Control System Saudi Aramco’s drilling team and the protect team se-lected candidate wells for testing the new sliding tech-nology, which consists of a surface control system that interfaces with the top drive control system to over-come many of the friction related problems of steerable motors.
Th e system works by rotating the top of the drillstring, alternately clockwise and counterclockwise until pre-determined surface torque values are achieved; in this way, the upper part of the drillstring always experiences tangential motion. Th e amount of cyclical torque ap-plied at the surface depends on the particular frictional characteristics of the well. Th is method keeps drillstring friction in the dynamic mode and signifi cantly reduces axial friction. Th e amount of cyclical torque applied at the surface depends on the particular frictional charac- teristics of the well. By sensing the amount of surface torque needed to transfer the proper amount of weight to the bit, and eliminating the need to bring the drill-string off the bottom to make tool face corrections, automated slide drilling allows substantial increases in both the daily footage drilled and the length of hori-zontal sections that can be achieved1, 2.
Subsequently, there is no time lost in orienting the tool face, as compared to the conventional method of changing modes. Th rough manipulation of the surface
Th e depth to which the point ofinfl uence is driven is limited bythe fact such that a section ofdrillstring remains in static
friction above the section infl uenced by the motor torque.
Horizontal Drilling in Saudi Arabia
www.saudiarabiaoilandgas.com | SA O&G Issue 24
39
that a keel stabilizes a ship. In practice, the optimal oscillating torque applied to the drillstring is deter-mined dynamically at the rig rather than through cal-culations.
Description Th e sliding automation technology consists of software and hardware components. Th e software component receives three main inputs; information from a manual input screen, surface torque from the top drive and standpipe pressure (as an indication of reactive torque). During the rocking cycle, the system permanently fi ne-tunes the amount of surface torque applied to the right
torque oscillations, the driller can move the point of rocking depth as deep along the drillstring as desired. Th e slider control system uses this principle to improve the performance of drilling with steerable motors. Th e system drives the point of infl uence deep enough to signifi cantly reduce the axial friction that causes stick/slipduring sliding.
Th e depth to which the point of infl uence is driven is limited by the fact such that a section of drillstring remains in static friction above the section infl uenced by the motor torque. Th is static zone provides rota-tional stability for the motor tool face in much the way
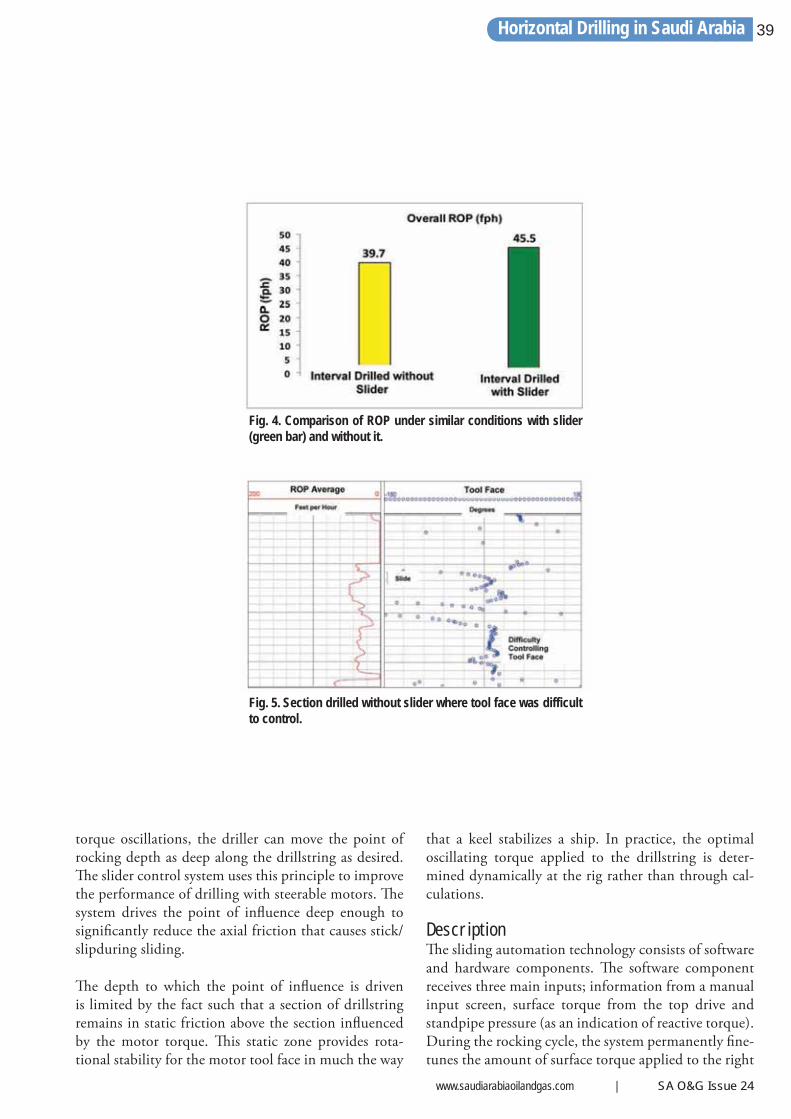
Fig. 4. Comparison of ROP under similar conditions with slider (green bar) and without it.
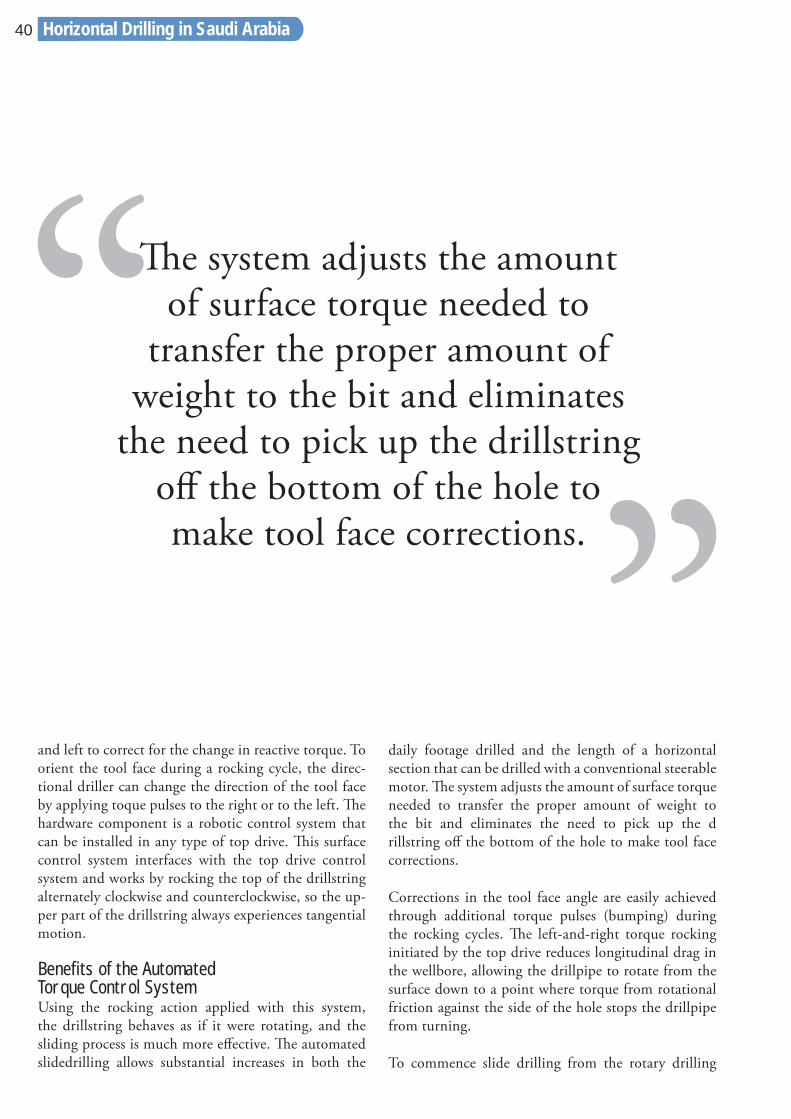
Fig. 5. Section drilled without slider where tool face was difficult to control.
Horizontal Drilling in Saudi Arabia
40
and left to correct for the change in reactive torque. To orient the tool face during a rocking cycle, the direc-tional driller can change the direction of the tool face by applying toque pulses to the right or to the left. Th e hardware component is a robotic control system that can be installed in any type of top drive. Th is surface control system interfaces with the top drive control system and works by rocking the top of the drillstring alternately clockwise and counterclockwise, so the up-per part of the drillstring always experiences tangential motion.
Benefits of the AutomatedTorque Control System Using the rocking action applied with this system, the drillstring behaves as if it were rotating, and the sliding process is much more eff ective. Th e automated slidedrilling allows substantial increases in both the
daily footage drilled and the length of a horizontal section that can be drilled with a conventional steerable motor. Th e system adjusts the amount of surface torque needed to transfer the proper amount of weight to the bit and eliminates the need to pick up the drillstring off the bottom of the hole to make tool face corrections.
Corrections in the tool face angle are easily achieved through additional torque pulses (bumping) during the rocking cycles. Th e left-and-right torque rocking initiated by the top drive reduces longitudinal drag in the wellbore, allowing the drillpipe to rotate from the surface down to a point where torque from rotational friction against the side of the hole stops the drillpipe from turning.
To commence slide drilling from the rotary drilling
Th e system adjusts the amountof surface torque needed to
transfer the proper amount of weight to the bit and eliminates
the need to pick up the drillstring off the bottom of the hole tomake tool face corrections.
Horizontal Drilling in Saudi Arabia
www.saudiarabiaoilandgas.com | SA O&G Issue 24
41
mode, the driller simply initiates an automatic rock-ing action by applying torque to the right and then to the left enough to allow appropriate weight transfer to the bit. Th e transfer of weight is controlled through automatic adjustments of rocking depth, which com-pensate for changes in reactive torque1.
Field Test ResultsFigure 3 shows the directional path of a typical well drilled in the Khurais fi eld. Th e 61⁄8” horizontal sec-tion had an extension of 8,460 ft from a 7” liner shoe: 5,889 ft to 14,350 ft. Th e liner shoe was set to an incli-nation of 85°. Th e section was drilled with a steerable motor and without slider technology from the liner shoe to 8,828 ft MD. When the well reached 7,000 ft, a severe loss of circulation zones was encountered, and mud returns were only 20%. Under this situation, due to the poor hole cleaning of conventional sliding
mode, cuttings began to accumulate in the low side of the lateral. Th e drilling process continued with water and gel sweeps, but at 8,828 ft MD, the conventional sliding drilling process became extremely diffi cult due to severe drillstring friction. Th e operator decided to install the new slider system afterwards to address the excessive friction issue. Th e slider system was utilized to drill almost 4,000 ft of the horizontal section from 8,828 ft MD to 12,888 ft MD with only 20% mud re-turn. Despite these severe hole conditions, the sliding drilling was carried out successfully.
Figure 4 shows the overall ROP (sliding and rotating) for both sections drilled with the same bottom-hole as-sembly (BHA) and a similar type of tricone roller bit. Th e overall ROP in the section where the slider system was used is higher in spite of the additional horizontal departure.
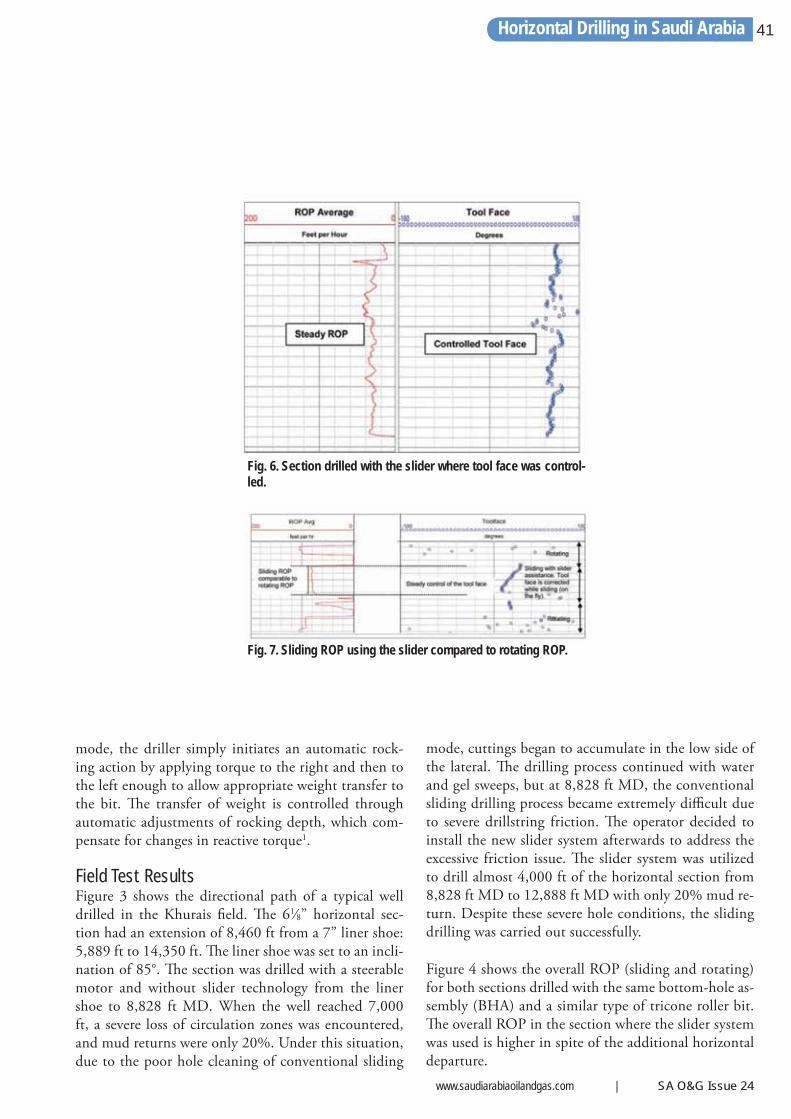
Fig. 6. Section drilled with the slider where tool face was control-led.
Fig. 7. Sliding ROP using the slider compared to rotating ROP.
Horizontal Drilling in Saudi Arabia
42
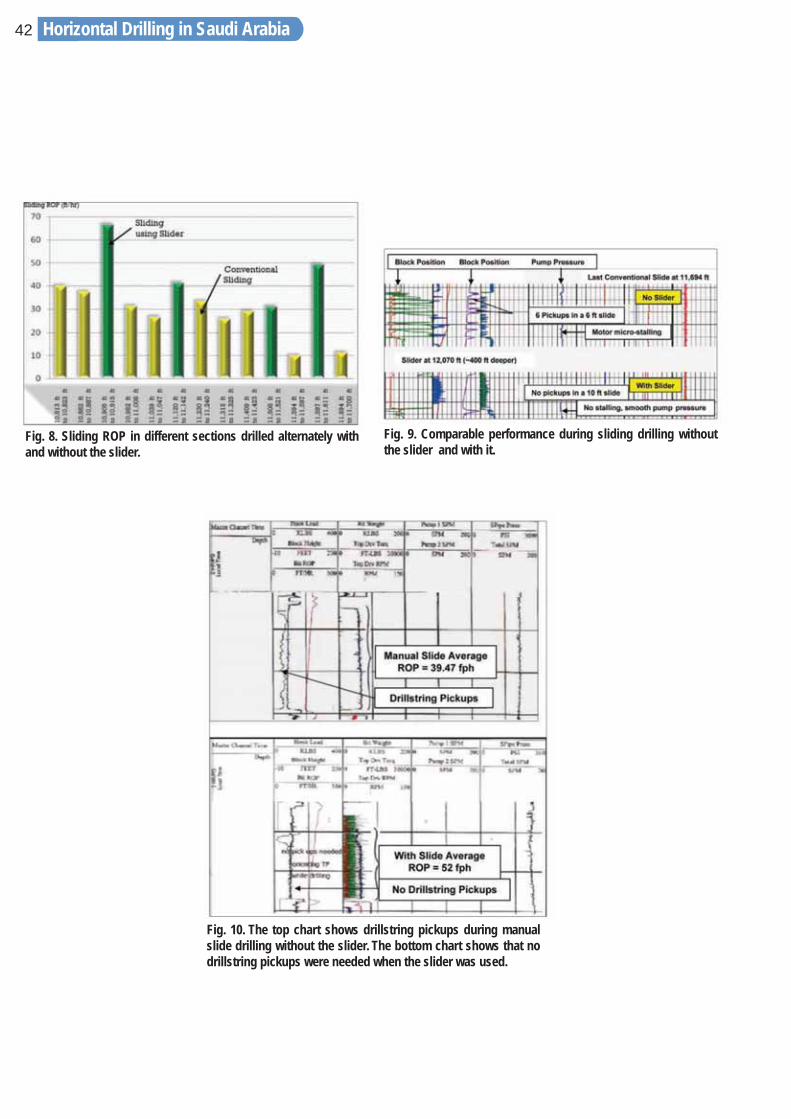
Fig. 8. Sliding ROP in different sections drilled alternately with and without the slider.
Fig. 9. Comparable performance during sliding drilling without the slider and with it.
Fig. 10. The top chart shows drillstring pickups during manual slide drilling without the slider. The bottom chart shows that no drillstring pickups were needed when the slider was used.
Horizontal Drilling in Saudi Arabia
www.saudiarabiaoilandgas.com | SA O&G Issue 24
43
At 12,888 ft MD, after a vertical departure of almost 8,800 ft, the drilling team decided to utilize a RSS due to the extremely high frictions.
Th e slider system was also utilized to drill the multilat-eral Well B. In this well, the 7” liner was set at 7,850 ft with 85° inclination, and the 61⁄8” horizontal moth-erbore section was then drilled to 9,536 ft, where it became very diffi cult to slide with an acceptable ROP; at that point it was decided to install the slider control system. Th e drilling continued with the utilization of the slider control system until the TD of the mother-bore at 12,070 ft was reached.
A section that was drilled without the assistance of the slider system where the tool face was unsteady and dif-fi cult to control due to reactive torque and stalling of the steerable motor is shown in Fig. 5. A plot from a section drilled with the slider, Fig. 6, shows a steadier tool face as a result of the elimination of motor stalling and achievement of smooth WOB due to the slider’s rocking action.
Figure 7 shows the ROP while sliding with the slider system vs. the ROP while rotating; both are in a com-parable range. If the slider had not been used, the slid-ing ROP would have been approximately 30% of the rotating ROP. A greater sliding ROP is another benefi t of this technology.
From the information tracked in drilling morning reports and on the directional driller parameter sheet, the team determined that the distribution of the drilling time when the slider system wasn’t used was 60% sliding and 40% rotating, but with the utilization of the slider system, the ratio changed to 25% sliding and 75% rotating. Th is reduction in percentage of sliding time is mainly due to the increase in the ROP achieved during sliding mode while using this new technology.
In Well C, the drilling team decided to drill intervals al-ternately with and without the slider, with the objective of comparing the benefi ts of this new technology un-der the same hole conditions and using the same BHA design. Th e 7” liner was set at 6,200 ft MD and at an
Th e depth to which the point ofinfl uence is driven is limited bythe fact such that a section ofdrillstring remains in static
friction above the section infl uenced by the motor torque.
Horizontal Drilling in Saudi Arabia
44
inclination of 84°; after drilling the 61⁄8” section to 7,737 ft, the driller started utilizing the slider system.
Comparable sliding ROPs are shown in Fig. 8. With the use of the slider, the average improvement in the sliding ROP was approximately 60%.
In Fig. 9, a comparison of drilling parameters (block position and pump pressure) in two sections drilled in sliding mode with and without the slider is shown. Th e top chart shows motor stalling and drillstring pickups due to ineffi cient transfer of weight to the bit, the bottom chart shows that with the assistance of the slider system, no drillstring pickup was required and no pump pressure spikes were experienced.
In Well D, the slider was used to drill the whole hori-zontal interval from 6,200 ft MD to 11,213 ft MD. At
9,500 ft, the drag reached 45,000 lbs, but rocking the drillstring with the slider was eff ective in overcoming the friction and minimizing pipe buckling to eff ective-ly transfer weight to the bit.
Figure 10 shows two charts. Th e top chart represents the manual sliding section, showing the drillstring pickups required to orient the tool face, and the bot-tom chart shows that drillstring pickups were not nec-essary when the slider was used.
Conclusions Th is new technology proved that it is possible to over-come the friction related problems of steerable motors by rotating the drillstring alternately clockwise and counterclockwise, so the upper part of the drillstring always experiences tangential motion. Th is technol-ogy allows the transfer of weight smoothly to the bit, thereby eliminating motor stall. Th e sliding ROP was
Th is new technology proved thatit is possible to overcome the
friction related problems of steerable motors by rotating the drillstring al-
ternately clockwise andcounterclockwise, so the upper part of the drillstring always experiences
tangential motion.
Horizontal Drilling in Saudi Arabia
www.saudiarabiaoilandgas.com | SA O&G Issue 24
45
increased by 70% in some cases. Th e slider system en-sured a very steady tool face and showed an excellent capability to correct the tool face angle whenever re-quired, and it provides a means to correct the tool face orientation while sliding.
Th e success of the slider depends on the proper train-ing of the directional drillers and ensuring they use it in the way it was designed to be used. Th e training usu-ally takes 31⁄2 hours, and it is recommended that train-ing occur away from the rig. Nothing goes downhole, so there are virtually no failures.
Acknowledgements Th e authors would like to thank the management of Saudi Aramco for their support and permission to publish this article.
Th is article was presented at the SPE Saudi Arabia Sec-tion Technical Symposium and Exhibition, al-Khobar, Saudi Arabia, May 15-18, 2011.
References 1. Maidla, E. and Haci, M.: “Understanding Torque: Th e Key to Slide Drilling Directional Wells,” IADC/SPE paper 87162, presented at the IADC/SPE Drilling Conference, Dallas, Texas, March 2-4, 2004.
2. Maidla, E., Haci, M., Jones, S., Cluchey, M., Al-exander, M. and Warren, T.: “Field Proof of the New Sliding Technology for Directional Drilling,” IADC/SPE paper 92558, presented at the IADC/SPE Drill-ing Conference, Amsterdam, the Netherlands, Febru-ary 23-25, 2005.
Th e slider system ensured a very steady tool face and showed an excellent capability to correctthe tool face angle whenever
required, and it provides a means to correct the tool face orientation
while sliding.
Horizontal Drilling in Saudi Arabia
46
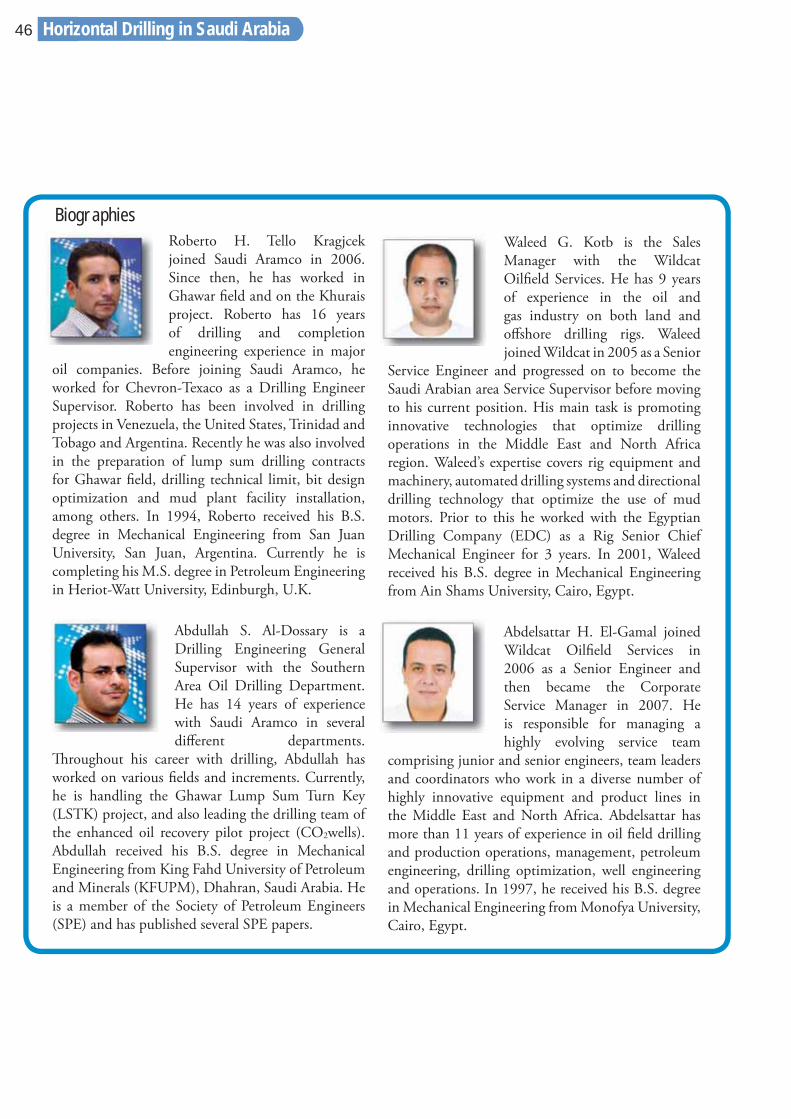
Roberto H. Tello Kragjcek joined Saudi Aramco in 2006. Since then, he has worked in Ghawar fi eld and on the Khurais project. Roberto has 16 years of drilling and completion engineering experience in major
oil companies. Before joining Saudi Aramco, he worked for Chevron-Texaco as a Drilling Engineer Supervisor. Roberto has been involved in drilling projects in Venezuela, the United States, Trinidad and Tobago and Argentina. Recently he was also involved in the preparation of lump sum drilling contracts for Ghawar fi eld, drilling technical limit, bit design optimization and mud plant facility installation, among others. In 1994, Roberto received his B.S. degree in Mechanical Engineering from San Juan University, San Juan, Argentina. Currently he is completing his M.S. degree in Petroleum Engineering in Heriot-Watt University, Edinburgh, U.K.
Abdullah S. Al-Dossary is a Drilling Engineering General Supervisor with the Southern Area Oil Drilling Department. He has 14 years of experience with Saudi Aramco in several diff erent departments.
Th roughout his career with drilling, Abdullah has worked on various fi elds and increments. Currently, he is handling the Ghawar Lump Sum Turn Key (LSTK) project, and also leading the drilling team of the enhanced oil recovery pilot project (CO2wells). Abdullah received his B.S. degree in Mechanical Engineering from King Fahd University of Petroleum and Minerals (KFUPM), Dhahran, Saudi Arabia. He is a member of the Society of Petroleum Engineers (SPE) and has published several SPE papers.
Waleed G. Kotb is the Sales Manager with the Wildcat Oilfi eld Services. He has 9 years of experience in the oil and gas industry on both land and off shore drilling rigs. Waleed joined Wildcat in 2005 as a Senior
Service Engineer and progressed on to become the Saudi Arabian area Service Supervisor before moving to his current position. His main task is promoting innovative technologies that optimize drilling operations in the Middle East and North Africa region. Waleed’s expertise covers rig equipment and machinery, automated drilling systems and directional drilling technology that optimize the use of mud motors. Prior to this he worked with the Egyptian Drilling Company (EDC) as a Rig Senior Chief Mechanical Engineer for 3 years. In 2001, Waleed received his B.S. degree in Mechanical Engineering from Ain Shams University, Cairo, Egypt.
Abdelsattar H. El-Gamal joined Wildcat Oilfi eld Services in 2006 as a Senior Engineer and then became the Corporate Service Manager in 2007. He is responsible for managing a highly evolving service team
comprising junior and senior engineers, team leaders and coordinators who work in a diverse number of highly innovative equipment and product lines in the Middle East and North Africa. Abdelsattar has more than 11 years of experience in oil fi eld drilling and production operations, management, petroleum engineering, drilling optimization, well engineering and operations. In 1997, he received his B.S. degree in Mechanical Engineering from Monofya University, Cairo, Egypt.
Biographies
Horizontal Drilling in Saudi Arabia
EPRASHEEDsignature series
Purchase Now
The Hydrocarbon Highway“I found the book excellent because it provides a balanced and realistic view of the oil industry and oil as an important source of energy for the world”
Please send me copies of Th e Hydrocarbon Highway
Name:
Title:
Company:
Mailing Address
Phone: Fax:
Please debit my credit card:
Visa/Mastercard Number
Name on Card Expiry
I enclose a cheque or banker's order in US Dollars, payable to EPRasheed Ltd
Charges Per Book:Th e Hydrocarbon Highway: $39.95Standard Delivery: $10.00 Express Delivery $30.00
Signature
Dr AbdulAziz Al Majed, Chairman, Department of Petroleum Engineering, King Fahd University of Petroleum & Minerals.
Mail all Orders to:11 Murray St, Camden, NW1 3RE, London, England
The Hydrocarbon Highway
By Wajid Rasheed
The Hydrocarbon Highway by Wajid Rasheed
48 Utilizing NMR and Formation Pressure Testing
Abstract Detecting the presence of tar, or heavy oil that does not fl ow, using conventional production technologies presents numerous challenges in fi eld development. Tar, acting as a permeability barrier, will often break fl ow and pressure communication from the aquifer to the oil zone. Th is results in inadequate water pressure support, which is necessary for sustaining production levels that maximize oil recovery. One of the key issues in developing a fi eld with known tar mat accumulation is how to optimally place the injectors away from the tar. Th e problem becomes more complicated when the exact location of the tar mat is uncertain, either later-ally or vertically. Tar mats are usually neither fl at nor uniformly thick across a fi eld. Th ese uncertainties pose a challenge in planning wells, especially water injec-tors.
Detection of tar is critical for reservoir characteriza-tion, reserves calculation and well placement. Direct and indirect techniques are employed to detect tar, including core analysis, well testing, wireline logging and the Pyrolitic Oil Productivity Index (POPI). Th ese produce measurements that are good indicators of tar; however, the challenge is to identify the tar while drill-
ing the well. Early detection requires the deployment of logging while drilling (LWD) technology for real-time interpretation of data.
To accurately identify tar in reservoir sections in real-time, the integration of conventional logging while drilling (LWD) measurements with new technolo-gies, such as the slim hole nuclear magnetic resonance (NMR) and formation pressure while drilling (FPWD), is necessary. Th is allows for timely adjustments to the well path and prevents costly remedial actions.
Th is article discusses successful real-time applica-tions of slim hole NMR and FPWD technologies to detect tar and optimally place water injectors. Th is is further demonstrated with a discussion of two case studies involving extended reach power water injec-tors.
Introduction Many reservoirs in the Middle East are characterized by layers of heavy immobile oil, also referred to as tar mats, which create additional challenges to pressure support and recovery strategies. Tar mats are present in numerous Middle East reservoirs, including those
Utilizing NMR and FormationPressure Testing While Drilling to Place Water Injectors Optimally in a Field in Saudi Arabia
By Dr. Dhafer A. Al-Shehri, Mohammed S. Kanfar, Yusuf Al-Ansari and Syed Abu Faizal.
Reprinted with kind permission from Saudi Aramco Journal of Technology.
www.saudiarabiaoilandgas.com | SA O&G Issue 24
49Utilizing NMR and Formation Pressure Testing
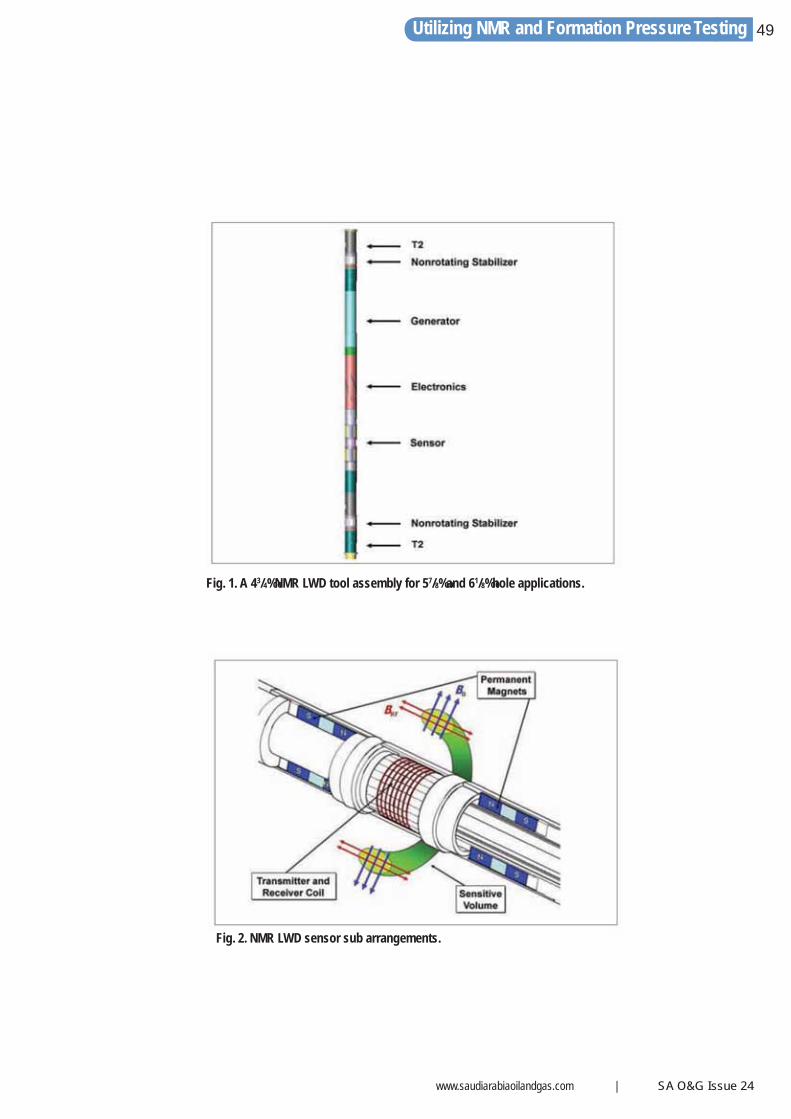
Fig. 1. A 43/4‰ NMR LWD tool assembly for 57/8‰ and 61/8‰ hole applications.
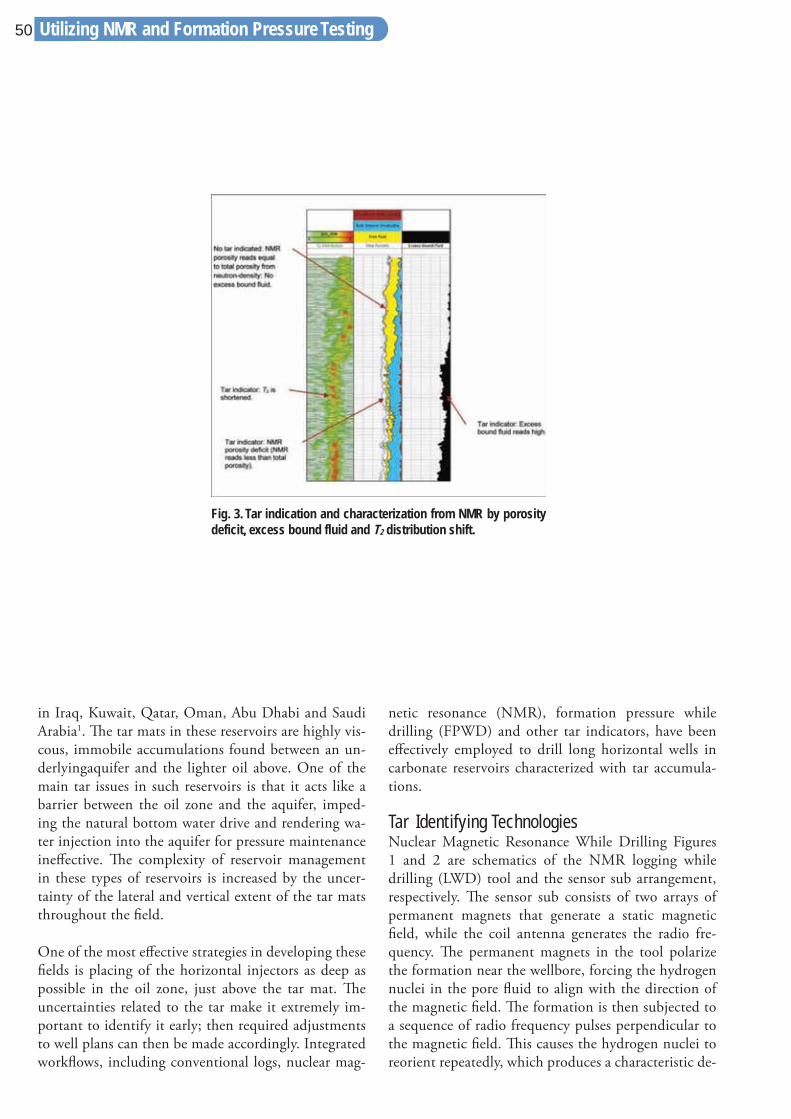
Fig. 2. NMR LWD sensor sub arrangements.
50
in Iraq, Kuwait, Qatar, Oman, Abu Dhabi and Saudi Arabia1. Th e tar mats in these reservoirs are highly vis-cous, immobile accumulations found between an un-derlyingaquifer and the lighter oil above. One of the main tar issues in such reservoirs is that it acts like a barrier between the oil zone and the aquifer, imped-ing the natural bottom water drive and rendering wa-ter injection into the aquifer for pressure maintenance ineff ective. Th e complexity of reservoir management in these types of reservoirs is increased by the uncer-tainty of the lateral and vertical extent of the tar mats throughout the fi eld.
One of the most eff ective strategies in developing these fi elds is placing of the horizontal injectors as deep as possible in the oil zone, just above the tar mat. Th e uncertainties related to the tar make it extremely im-portant to identify it early; then required adjustments to well plans can then be made accordingly. Integrated workfl ows, including conventional logs, nuclear mag-
netic resonance (NMR), formation pressure while drilling (FPWD) and other tar indicators, have been eff ectively employed to drill long horizontal wells in carbonate reservoirs characterized with tar accumula-tions.
Tar Identifying Technologies Nuclear Magnetic Resonance While Drilling Figures 1 and 2 are schematics of the NMR logging while drilling (LWD) tool and the sensor sub arrangement, respectively. Th e sensor sub consists of two arrays of permanent magnets that generate a static magnetic fi eld, while the coil antenna generates the radio fre-quency. Th e permanent magnets in the tool polarize the formation near the wellbore, forcing the hydrogen nuclei in the pore fl uid to align with the direction of the magnetic fi eld. Th e formation is then subjected to a sequence of radio frequency pulses perpendicular to the magnetic fi eld. Th is causes the hydrogen nuclei to reorient repeatedly, which produces a characteristic de-
Fig. 3. Tar indication and characterization from NMR by porosity deficit, excess bound fluid and T2 distribution shift.
Utilizing NMR and Formation Pressure Testing
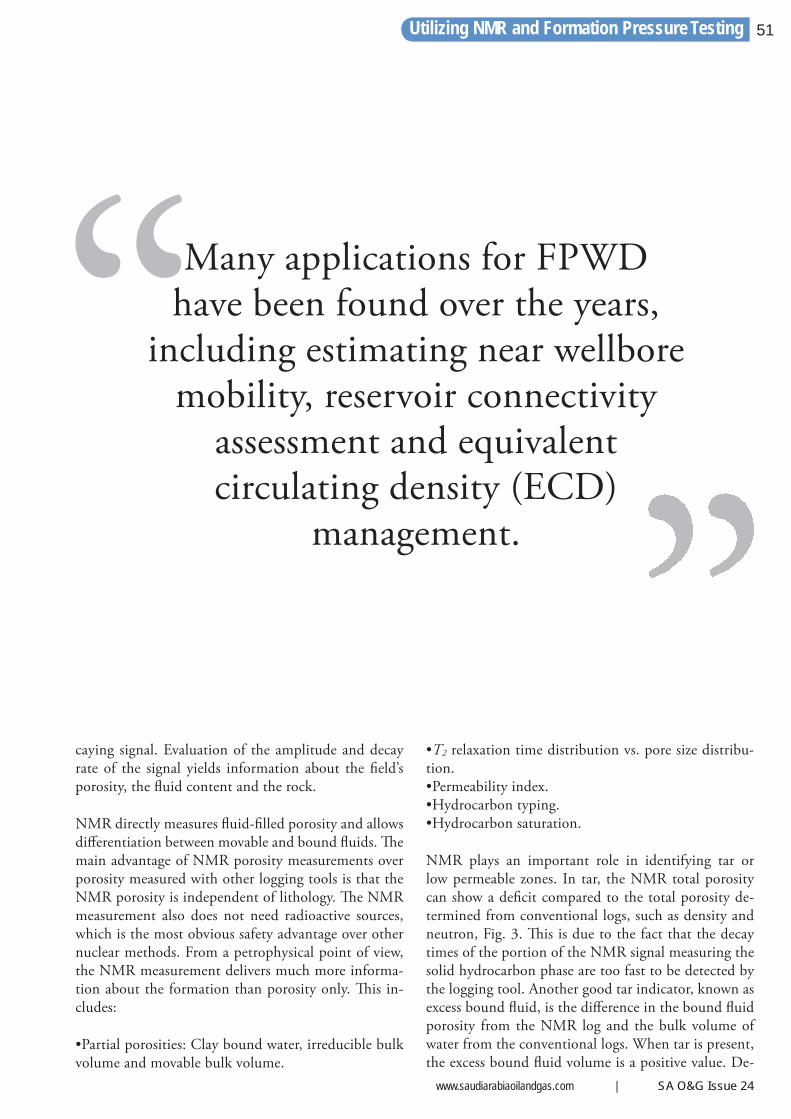
www.saudiarabiaoilandgas.com | SA O&G Issue 24
51
caying signal. Evaluation of the amplitude and decay rate of the signal yields information about the fi eld’s porosity, the fl uid content and the rock.
NMR directly measures fl uid-fi lled porosity and allows diff erentiation between movable and bound fl uids. Th e main advantage of NMR porosity measurements over porosity measured with other logging tools is that the NMR porosity is independent of lithology. Th e NMR measurement also does not need radioactive sources, which is the most obvious safety advantage over other nuclear methods. From a petrophysical point of view, the NMR measurement delivers much more informa-tion about the formation than porosity only. Th is in-cludes:
•Partial porosities: Clay bound water, irreducible bulk volume and movable bulk volume.
•T2 relaxation time distribution vs. pore size distribu-tion. •Permeability index. •Hydrocarbon typing. •Hydrocarbon saturation.
NMR plays an important role in identifying tar or low permeable zones. In tar, the NMR total porosity can show a defi cit compared to the total porosity de-termined from conventional logs, such as density and neutron, Fig. 3. Th is is due to the fact that the decay times of the portion of the NMR signal measuring the solid hydrocarbon phase are too fast to be detected by the logging tool. Another good tar indicator, known as excess bound fl uid, is the diff erence in the bound fl uid porosity from the NMR log and the bulk volume of water from the conventional logs. When tar is present, the excess bound fl uid volume is a positive value. De-
Many applications for FPWDhave been found over the years,
including estimating near wellbore mobility, reservoir connectivity
assessment and equivalentcirculating density (ECD)
management.
Utilizing NMR and Formation Pressure Testing
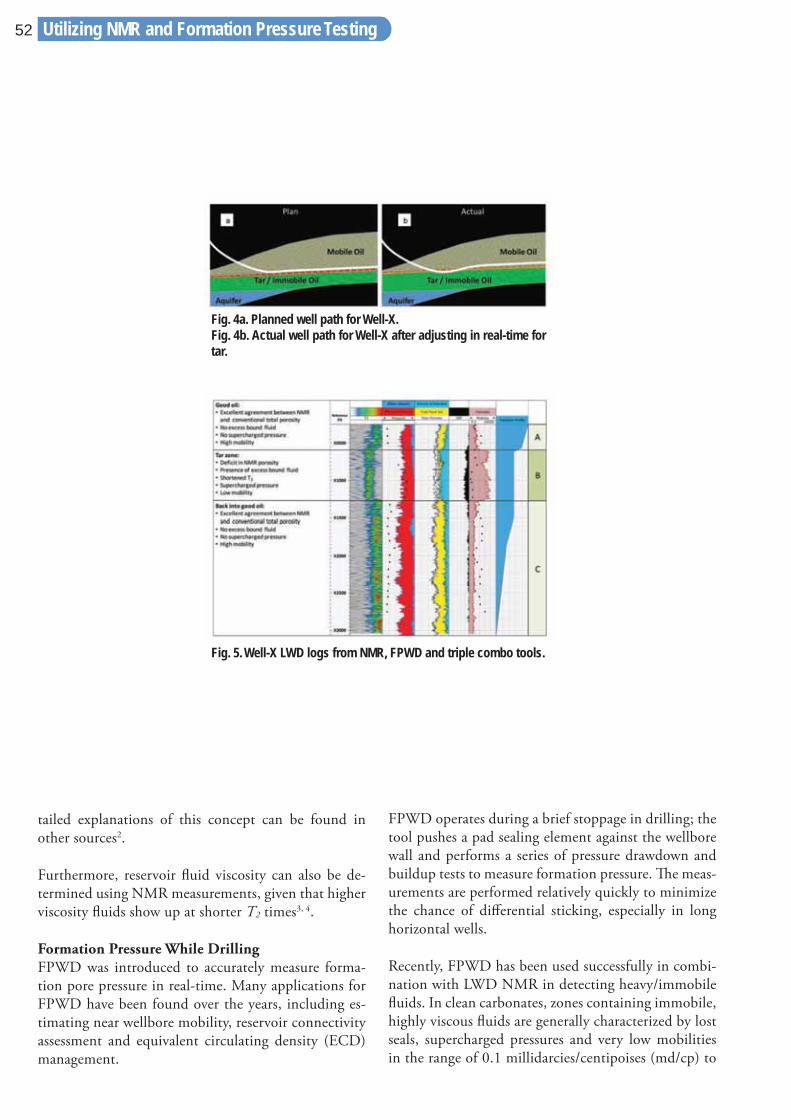
52
tailed explanations of this concept can be found in other sources2.
Furthermore, reservoir fl uid viscosity can also be de-termined using NMR measurements, given that higher viscosity fl uids show up at shorter T2 times3, 4.
Formation Pressure While Drilling FPWD was introduced to accurately measure forma-tion pore pressure in real-time. Many applications for FPWD have been found over the years, including es-timating near wellbore mobility, reservoir connectivity assessment and equivalent circulating density (ECD) management.
FPWD operates during a brief stoppage in drilling; the tool pushes a pad sealing element against the wellbore wall and performs a series of pressure drawdown and buildup tests to measure formation pressure. Th e meas-urements are performed relatively quickly to minimize the chance of diff erential sticking, especially in long horizontal wells.
Recently, FPWD has been used successfully in combi-nation with LWD NMR in detecting heavy/immobile fl uids. In clean carbonates, zones containing immobile, highly viscous fl uids are generally characterized by lost seals, supercharged pressures and very low mobilities in the range of 0.1 millidarcies/centipoises (md/cp) to
Fig. 4a. Planned well path for Well-X. Fig. 4b. Actual well path for Well-X after adjusting in real-time for tar.
Fig. 5. Well-X LWD logs from NMR, FPWD and triple combo tools.
Utilizing NMR and Formation Pressure Testing
www.saudiarabiaoilandgas.com | SA O&G Issue 24
53
0.2 md/cp5. Real-time detection of zones with immo-bile fl uids and low permeability allows drillers to avoid them and makes geosteering long horizontal wells into sweet spots possible.
Pyrolytic Oil Productivity Index Th e POPI was developed by Saudi Aramco to provide a quantitative assessment of reservoir quality, productiv-ity, water saturation and tar identifi cation from residu-al hydrocarbon staining on drill cuttings. Unlike other logging tools, the POPI provides a direct assessment of residual hydrocarbons on rock samples, which can be used to assess the oil’s connectivity with the active fl uid system in the reservoir.
Th e POPI employs various pyrolysis methods, such as the assessment of API gravity, the apparent saturation method, and the volume organic matter method. Th e POPI can accurately quantify tar volume over a wide
range of concentrations to support real-time applica-tion and geosteering of horizontal wells6.
Integrating Tar Identifying Technologies Two case studies from a Saudi Arabian fi eld demon-strate the successful integration of tar identifying technologies. Both cases involve long horizontal wa-ter injectors drilled in oil bearing clean carbonate for-mations. Th e knowledge of the tar zone depth gained from the fi rst well was thoroughly utilized in drilling the second well. In both cases, diff erent tar identifying technologies were eff ectively used to properly geosteer the wells and achieve the production objectives.
Case 1 Well-X is a water injector that in real-time was suc-cessfully placed away from the tar in a clean carbonate reservoir that is both heterogeneous and characterized by an undulating tar mat. Based on the best tar depth
Unlike other logging tools,the POPI provides a direct
assessment of residual hydrocarbons on rock samples, which can be
used to assess the oil’s connectivity with the active fl uid system
in the reservoir.
Utilizing NMR and Formation Pressure Testing
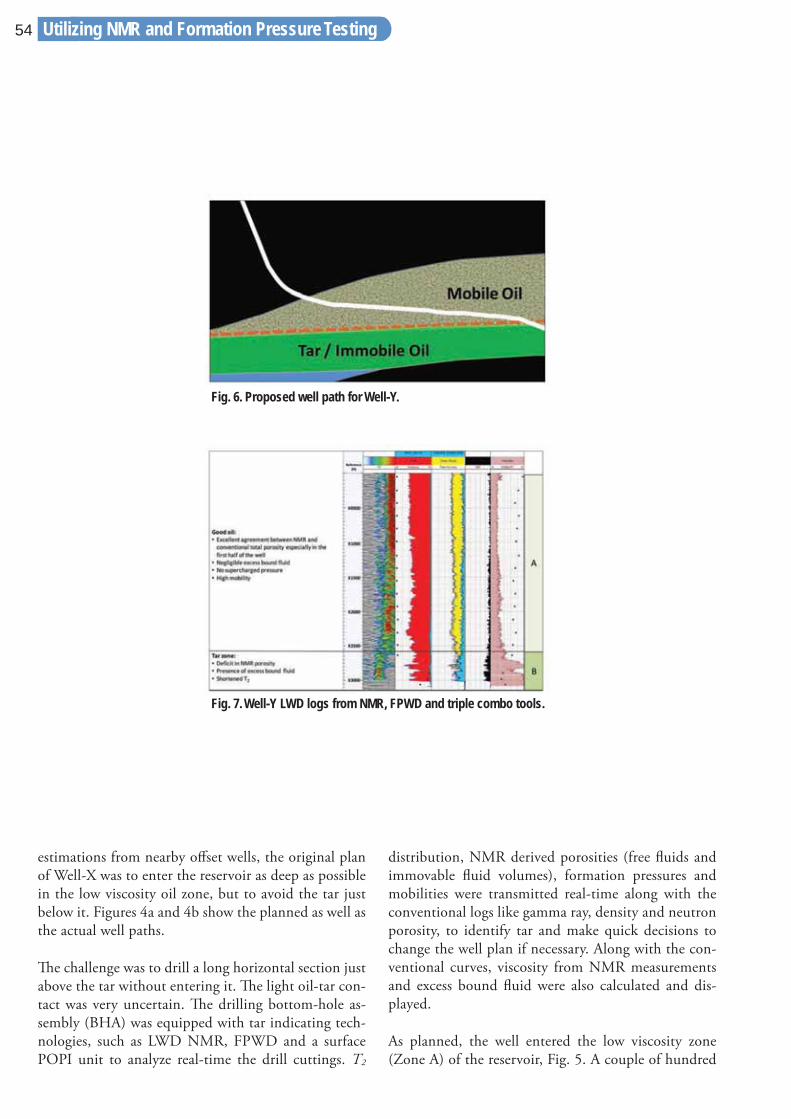
54
estimations from nearby off set wells, the original plan of Well-X was to enter the reservoir as deep as possible in the low viscosity oil zone, but to avoid the tar just below it. Figures 4a and 4b show the planned as well as the actual well paths.
Th e challenge was to drill a long horizontal section just above the tar without entering it. Th e light oil-tar con-tact was very uncertain. Th e drilling bottom-hole as-sembly (BHA) was equipped with tar indicating tech-nologies, such as LWD NMR, FPWD and a surface POPI unit to analyze real-time the drill cuttings. T2
distribution, NMR derived porosities (free fl uids and immovable fl uid volumes), formation pressures and mobilities were transmitted real-time along with the conventional logs like gamma ray, density and neutron porosity, to identify tar and make quick decisions to change the well plan if necessary. Along with the con-ventional curves, viscosity from NMR measurements and excess bound fl uid were also calculated and dis-played.
As planned, the well entered the low viscosity zone (Zone A) of the reservoir, Fig. 5. A couple of hundred
Fig. 6. Proposed well path for Well-Y.
Fig. 7. Well-Y LWD logs from NMR, FPWD and triple combo tools.
Utilizing NMR and Formation Pressure Testing
www.saudiarabiaoilandgas.com | SA O&G Issue 24
55Utilizing NMR and Formation Pressure Testing
feet into the reservoir, the formation pressure tests were performed and showed pressures indicating super-charged (Track 3) and very low mobility values (Track 6). Th e tails of the NMR T2 distribution (Track 2) also showed a shift towards the left (towards faster re-laxation times). Th ese were the fi rst indications of tar, though the shape and position of the T2 distributions are not a unique tar indicator and can be aff ected by other factors (pore size reduction, wettability altera-tion, etc.) as well.
Track 4 of Fig. 5 compares the total porosity derived from neutron-density logs (blue curve) with free and bound fl uid porosities from NMR (shaded in yellow and blue), respectively. Th ere is very good agreement
between total porosity and NMR porosity in Zones A and C; however, in Zone B, once the T2 distribu-tion shifts towards faster relaxation times, the NMR shows a porosity defi cit compared to total porosity, and the computed viscosity indicates highly viscous tar. Another clear tar indication comes from the excess bound fl uid, which is shown in Track 5 as a black-fi lled curve.
Th ese indications proved to be very useful in making decisions in real-time. Th e well plan was revised to navigate the well out of the tar zone. Once the depth of the tar zone was identifi ed, the rest of the well sec-tion was maintained above it, which is clearly indicated by the data from Zone C, Fig. 5. Th e benefi ts of these
Th e benefi ts of these technologies were made clear by a short-term
injectivity test conducted after the well was completed, which
showed poor injectivity in theidentifi ed tar zone (Zone B), but a very goodinjection rate in the low
viscosity oil zone (Zone C).
Utilizing NMR and Formation Pressure Testing
56
technologies were made clear by a short-term injectiv-ity test conducted after the well was completed, which showed poor injectivity in the identifi ed tar zone (Zone B), but a very good injection rate in the low viscosity oil zone (Zone C).
Case 2 Based on the knowledge gained from Well-X concerning the tar depth, another water injector well, Well-Y, was planned, also to be drilled and placed above the tar in the low viscosity oil zone. Th is time it was decided to drop the angle of the well towards the end in an attempt to confi rm the presence of tar just below. Figure 6 shows the proposed well path for Well-Y.
Th e same BHA, employing the tar detection technol-ogy, used in Well-X was utilized in this case as well. As per the plan, the well entered the low viscosity zone (Zone A) of the reservoir, Fig. 7, which is indicated by
high mobilities from FPWD (Track 6), late peaks in the NMR T2 distribution (Track 2) and the total po-rosity from neutron-density logs overlying the NMR derived porosity (Track 4).
Th e well angle was held for a few thousand feet to stay at the same true vertical depth, then just prior to reach-ing 300 ft from the total depth, the well was deviated downwards. As the well entered into deeper zones, the NMR T2 distribution shifted towards the left, a defi -cit in NMR porosity was indicated, and excess bound fl uid showed an increase.
Th erefore, all indicators confi rmed the presence of tar.
Conclusions Th e case studies prove the eff ectiveness of inte-grating NMR, FPWD and POPI technologies in real-time for identifying tar zones in clean carbonate reservoirs.
Based on the knowledge gained from Well-X concerning the tar
depth, another water injector well, Well-Y, was planned, also to be
drilled and placed above the tar in the low viscosity oil zone.
Utilizing NMR and Formation Pressure Testing
www.saudiarabiaoilandgas.com | SA O&G Issue 24
57
1. In the fi rst case study, the tar zone depth was sucess-fully established with the help of tar identifying tech-nologies in a long horizontal injector. It was confi rmed by a short-term injectivity test, which showed extreme-ly low injectivity in the identifi ed tar zone.
2. Th e second case study shows the eff ective use of the tar depth knowledge from the previous well to drill a new long horizontal injector deep into the low viscosity zone without entering the tar. Th e depth of the oil-tar contact was confi rmed by tar identifying technologies when the well dipped into the anticipated tar zone.
Acknowledgements Th e authors would like to thank the management of Saudi Aramco for their support and permission to publish this article.
Th is article was presented at the SPE Middle East Oil and Gas Show and Conference, Manama, Bahrain, September 25-28, 2011.
References 1. Al-Kaabi, A.A., Menouar H., Al-Marhoun, M.A. and Al-Hashim, H.S.: “Bottom Water Drive in Tar Mat Res-ervoirs,” SPE Reservoir Engineering, Vol. 3, No. 3, May 1988, pp. 395-400.
2. Akkurt, R., Seifert, D.J., Al-Harbi, A., et al.: “Real Time Detection of Tar in Carbonates Using LWD Triple Combo, NMR and Formation Tester in Highly Deviated Wells,” paper presented at the 49th Society of Petrophysicists and Well Log Analysts Annual Logging Symposium, Austin, Texas, May 25-28, 2008.
3. Akkurt, R., Seifert, D.J., Eyvazzadeh, R. and Al-Beai-ji, T.: “From Molecular Weight and NMR Relaxation to Viscosity: An Innovative Approach for Heavy Oil Vis-cosity Estimation for Real-Time Applications,” Petro-physics, Vol. 51, No. 2, April 2010, pp. 89-101.
4. Chen, J. and Chen, S.: “A Mixing Rule of Self-Dif-fusivities in Methane Hydrocarbon Mixtures and the
Th e well angle was held for a few thousand feet to stay at the same
true vertical depth, then just prior to reaching 300 ft from the total depth, the well was deviated
downwards.
Utilizing NMR and Formation Pressure Testing
58
Dr. Dhafer A. Al-Shehri is currently the Manifa Subsurface Team Leader with the Northern Area Reservoir Management Department. Since joining Saudi Aramco in 1996, he has worked as an Engineer, an Engineering
Supervisor and General Supervisor for Drilling & Workover Engineering, Reservoir Management and Production Engineering. Dhafer also acted as the Chief Technologist, Drilling Technology Team, Exploration and Petroleum Engineering Center –Advanced Research Center (EXPEC ARC). Dhafer holds B.S. and M.S. degrees from King Fahd University of Petroleum and Minerals (KFUPM), Dhahran, Saudi Arabia, and a Ph.D. from Texas A&M University, College Station, TX, all in Petroleum Engineering. Prior to joining the company, he was a Petroleum Engineering Professor at KFUPM. As an active member of the Society of Petroleum Engineers (SPE), he has authored many technical papers on various topics and chaired the local 1998 SPE Technical Symposium.
Mohammed S. Kanfar joined Saudi Aramco in 2009. He is a Petroleum Engineer working for the Northern Area Reservoir Management Department. In 2010, Mohammed joined the Society of Petroleum Engineers
–Saudi Arabia Section (SPE- SAS), serving on the SPE Young Professionals and Student Outreach Committee. He received his B.S. degree in Petroleum
Engineering from Louisiana State University, Baton Rouge, LA, and is currently pursuing his M.S. degree in Petroleum Engineering from Texas A&M University, College Station, TX.
Yusuf Al-Ansari is a Geoscientist working for the Geoscience Division in Baker Hughes. He received his B.S. degree in Petroleum Engineering from King Fahd University of Petroleum and Minerals
(KFUPM), Dhahran, Saudi Arabia, and is currently pursuing a M.S. degree in Petroleum Engineering from KFUPM. Yusuf is a member of the Society of Petroleum Engineers (SPE), the Dhahran Geoscience Society (DGS) and the Society of Petrophysicists and Well Log Analysts (SPWLA).
Syed Abu Faizal is a Reservoir Engineer working for the Geoscience Division of Baker Hughes. He received his B.S. degree in Chemical Engineering from the University of Madras, Tamil Nadu, India, and his M.S.
degree in Petroleum Engineering from King Fahd University of Petroleum and Minerals (KFUPM), Dhahran, Saudi Arabia. Syed is a very active member of the Society of Petroleum Engineers (SPE) and the Dhahran Geoscience Society (DGS). He has authored and presented several technical papers at various SPE technical conferences
Biographies
Determination of GOR and Oil Viscosities from NMR Log Data,” SPE Reservoir Evaluation & Engineering, Vol. 13, No. 2, April 2010, pp. 275-282.
5. Seifert, D.J., Neumann, P.M., Dossary, S.M., et al.: “Characterization of Arab Formation Carbonates Utiliz-ing Real-time Formation Pressure and Mobility Data,” SPE paper 109902, presented at the SPE Annual Tech-nical Conference and Exhibition, Anaheim, California,
November 11-14, 2007.
6. Al-Salem, K.M., Al-Maliki, S.S., Ahyed, R.A., Jones, P.J. and Neumann, P.M.: “Real Time Well Placement above a Tar Mat, Leveraging Formation Pressure While Drilling and Pyrolitic Oil Productivity Index Technologies,” SPE paper 113550, presented at the SPE Europe/EAGE Annual Conference and Exhibition, Rome, Italy, June 9-12, 2008.
Utilizing NMR and Formation Pressure Testing

60
Reserves are very signifi cant numbers. Th ey form the base of a slew of Key Performance Indicators (KPI) for all types of oil companies. Yet, the lack of a globally ac-cepted standard makes the measurement and auditing
of reserves a thorny issue. An integrated understanding of worldwide reserves is also lacking. In this chapter, we consider reserves measurement systems, global re-serves and ‘peak oil’. One key question interests us: are
Reserves, Peak Oiland Medieval Maps
Are we running out of oil? Before we can answer that question, we need to understand what oil and gas
reserves are and how they are measured.
www.hydrocarbonhighway.com www.eprasheed.com
“There have been many books concerning the oil industry. Most are technical, some historical (e.g. the Prize) and some about the money side. There are few, if any, about
the oil industry that the non-technical person will appreciate and gain real insight from. Wajid Rasheed in this book, The Hydrocarbon Highway, has made a lovely
pen sketch of the oil industry in its entirety. The book begins with the geology of oil and gas formation and continues with the technical aspects of E & P, distribution,
refining and marketing which are written in clear language. In particular, the process of oil recovery is outlined simply and with useful examples. There is a short history
of how the oil companies have got to where they are, and finally a discussion concerning the exits—alternative energy. This is all neatly bundled into 14 chapters
with many beautiful photographs and a helpful glossary. The book is intended to give an overture to the industry without bogging the reader down. I enjoyed the journey
along the highway.”
“I found the book excellent because it provides a balanced and realistic view of the oil industry and oil as an important source of energy for the world. It also provides
accurate information which is required by the industry and the wider public. Recently, I read several books about oil which portrayed it as a quickly vanishing energy source.
It seems that many existing books predict a doomsday scenario for the world as a result of the misperceived energy shortage, which I believe is greatly exaggerated
and somewhat sensational. Therefore the book bridges the existing gap of accurate information about oil as a necessary source of energy for the foreseeable future. The Hydrocarbon Highway should also help inform public opinion about the oil industry and our energy future. It looks at the oil industry in an up-to-date and integrated view
and considers the most important factors affecting it.”
Professor Richard Dawe of the University of West Indies, Trinidad and Tobago
Dr AbdulAziz Al Majed, the Director of the Centre for Petroleum and Minerals at the Research Institute at King Fahd University of Petroleum and Minerals
ISBN 978-0-9561915-0-2Price UK £29.95 US $39.95
“A crash course in Oil and Energy. The Hydrocarbon Highway is a much-needed resource, outlining the real energy challenges we face and potential solutions.”
Steven A. Holditch, SPE, Department Head of Petroleum Engineering, Texas A&M University
The Hydrocarbon Highway
By Wajid Rasheed
1
25/2/09 12:09:37
Hydrocarbon Highway
www.saudiarabiaoilandgas.com | SA O&G Issue 24
61
we navigating through global reserves using a ‘medi-eval’ and outdated map? If so, is peak oil a physical or psychological shortage?
Invariably, reserves grab headlines due to their fi nan-cial signifi cance, measurement methods or the geo-po-litical dimension. On the one hand, the sustainability of oil companies depends on reserves and, on the other, oil company profi ts depend primarily on production. By breaking down reserves and production data, an-alysts can derive KPIs such as net worth, reserves to production ratio, reserves replacement and production quotas and positive cash-fl ow. Consequently, reserves and production are inextricably linked to fi nancial performance.
Major, National and PrivateExisting irrespective of oil company size or shareholding, the link between reserves and fi nancial performance is a fundamental one. Majors, public or ‘fl oated’ companies, will be judged by analysts on their short-term earnings and long-term prospects. Private companies will be judged by shareholders on Return
on Investment (ROI). National or state companies are subject to analysis too which we will consider short-ly. Th e stock prices of oil companies are heavily infl uenced by their stock-in-trade – oil. Th e oil company itself will use KPIs such as production rates and reserves replacement to make fi nancial valuations and earnings projections. Financial analysts ultimately look to these fi gures and make ‘buy, sell or hold’ recommendations.
Reserves, therefore are a major infl uence on the stock price of major International Oil Companies (IOCs). Of course, IOC stock prices will be aff ected by quarter-ly profi ts and shareholder dividends. Th e oil price and other contextual factors that aff ect the attractiveness of the industry as a whole for investment – geopolitics, speculation and ‘futures’ trading – will also aff ect stock ratings. Beyond annual profi t concerns, the long-term survivability of the oil company is wholly dependent on the rate at which production and reserves are in-creased. Usually this happens in one of three ways: fi rst, through the ‘drip-feed’ of incremental recovery using mature fi eld improved technology; second, by boosting reserves through the bit which means that successful
Hydrocarbon Highway
Beyond annual profi t concerns, the long-term survivability of the oil company is wholly dependent on the rate at which production and
reserves are increased.
62
wildcat strikes open new frontiers; and fi nally, by the acquisition of another oil company through its stock1.
National Oil CompaniesTh ere is a common yet incorrect perception that National Oil Companies (NOC) are somewhat immune from scrutiny of fi nancial indicators; however, there are at least two scenarios where NOCs will be judged by analysts. Th is primarily occurs when fi nancial experts assess fi nancial risk and assign credit ratings to NOCs and their countries of origin. In major oil exporters, i.e. exporting more than 2 million barrels of oil per day (MMbbl/d), the NOC is often the largest business in the country*. Country risk can therefore be considered a function of the NOC’s performance. Th is has a direct bearing on the credit rating of countries. A secondary situation occurs when analysts assess the attractiveness of fi nancial instruments or debt (bonds), issued by the oil company or government, based on ROI and risk.
Certain NOCs, such as those within the Organisation of Petroleum Exporting Countries (OPEC), also de-pend on reserves in another way. OPEC production
quotas are allocated as a proportion of total proved re-serves. Consequently, countries with high reserves vol-umes are given higher thresholds of production2,3.
UncertaintyMeasuring reserves is diffi cult and involves a basic un-certainty because reserves lie hidden away in deep sub-terranean reservoirs. It would be physically impossible to accurately measure oil and gas in place; therefore, the industry relies on extrapolated measurements as ac-curate measurements can only occur upon production. Consequently, measuring, corroborating and auditing the measurement of reserves is an inexact science.
To make matters more complex, there is no single stand-ard or methodology that is universally accepted by the industry or by the fi nancial community, i.e. regulators/analysts. Substantive variations exist between institu-tions and nations. Exemplifying this are diff erences be-tween the SPE (Society of Petroleum Engineers) and SEC (Securities Exchange Commission) criteria for reserves classifi cation, and international variations be-tween the Russian and Norwegian systems4,5.
It would be physically impossible to accurately measure oil and gas in place; therefore, the industry relies on extrapolated measurements asaccurate measurements can only
occur upon production.
Hydrocarbon Highway
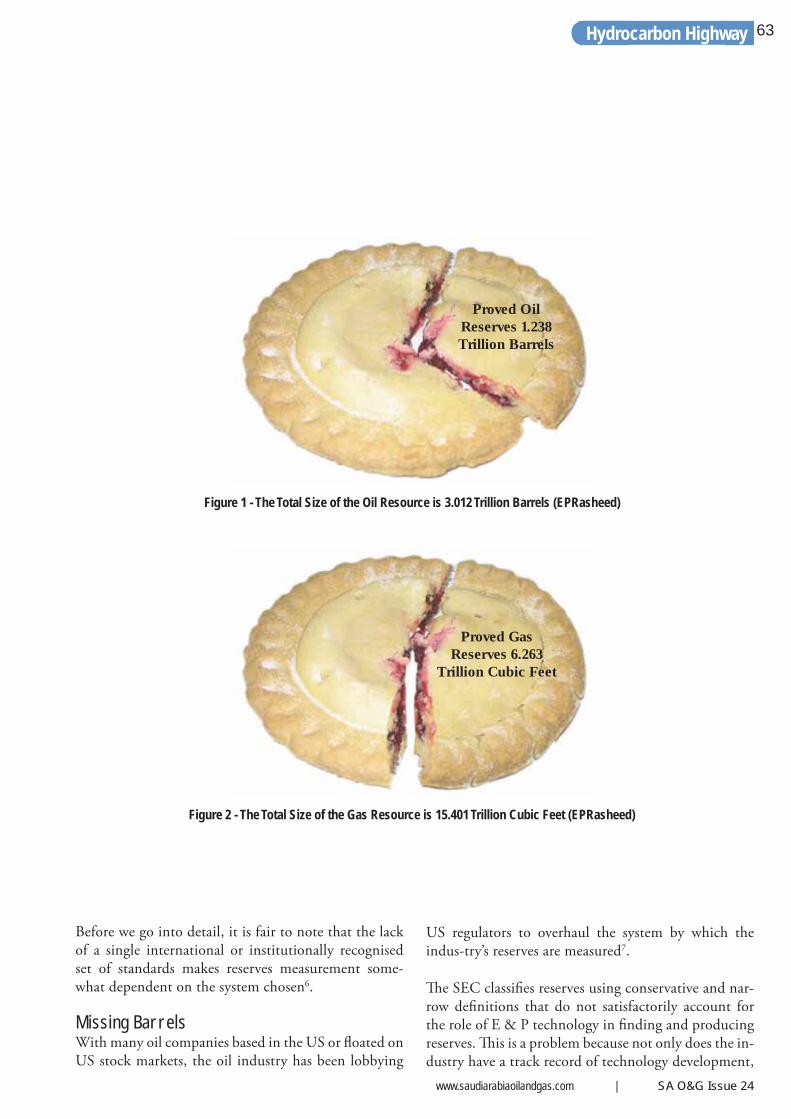
www.saudiarabiaoilandgas.com | SA O&G Issue 24
63
Proved Gas Reserves 6.263
Trillion Cubic Feet
Proved Oil Reserves 1.238 Trillion Barrels
Figure 2 - The Total Size of the Gas Resource is 15.401 Trillion Cubic Feet (EPRasheed)
Figure 1 - The Total Size of the Oil Resource is 3.012 Trillion Barrels (EPRasheed)
US regulators to overhaul the system by which the indus-try’s reserves are measured7.
Th e SEC classifi es reserves using conservative and nar-row defi nitions that do not satisfactorily account for the role of E & P technology in fi nding and producing reserves. Th is is a problem because not only does the in-dustry have a track record of technology development,
Before we go into detail, it is fair to note that the lack of a single international or institutionally recognised set of standards makes reserves measurement some-what dependent on the system chosen6.
Missing BarrelsWith many oil companies based in the US or fl oated on US stock markets, the oil industry has been lobbying
Hydrocarbon Highway
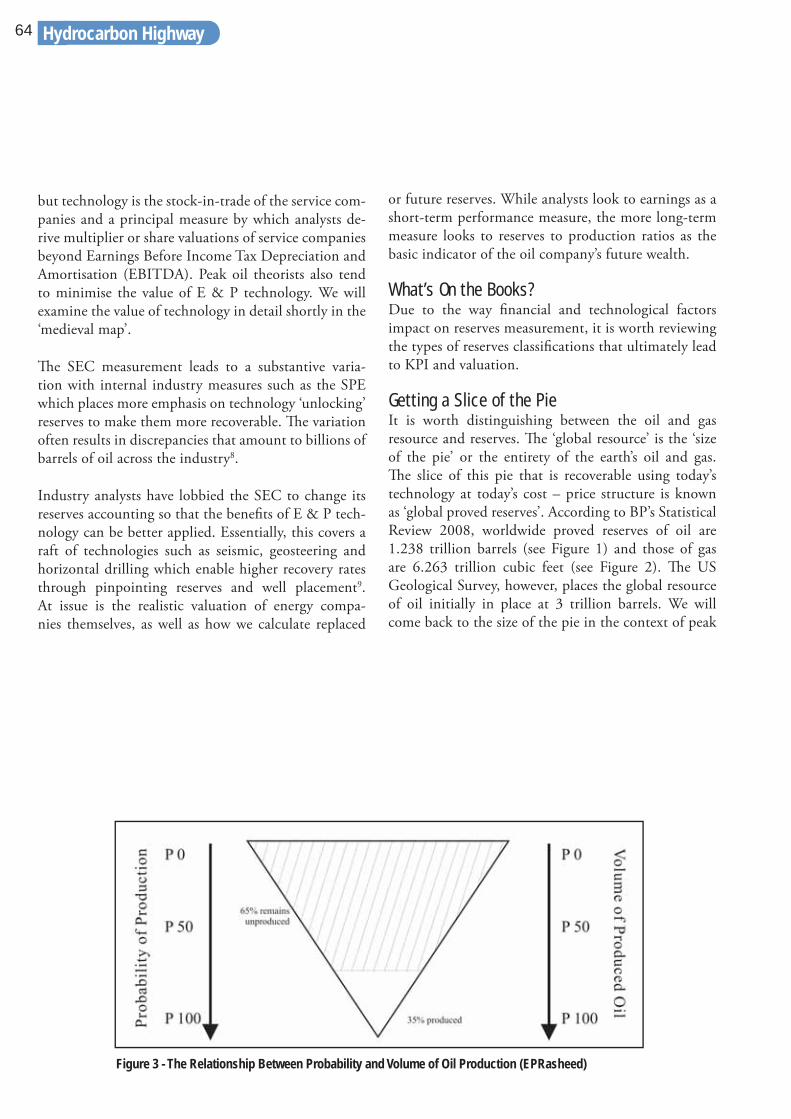
64
Figure 3 - The Relationship Between Probability and Volume of Oil Production (EPRasheed)
but technology is the stock-in-trade of the service com-panies and a principal measure by which analysts de-rive multiplier or share valuations of service companies beyond Earnings Before Income Tax Depreciation and Amortisation (EBITDA). Peak oil theorists also tend to minimise the value of E & P technology. We will examine the value of technology in detail shortly in the ‘medieval map’.
Th e SEC measurement leads to a substantive varia-tion with internal industry measures such as the SPE which places more emphasis on technology ‘unlocking’ reserves to make them more recoverable. Th e variation often results in discrepancies that amount to billions of barrels of oil across the industry8.
Industry analysts have lobbied the SEC to change its reserves accounting so that the benefi ts of E & P tech-nology can be better applied. Essentially, this covers a raft of technologies such as seismic, geosteering and horizontal drilling which enable higher recovery rates through pinpointing reserves and well placement9. At issue is the realistic valuation of energy compa-nies themselves, as well as how we calculate replaced
or future reserves. While analysts look to earnings as a short-term performance measure, the more long-term measure looks to reserves to production ratios as the basic indicator of the oil company’s future wealth.
What’s On the Books?Due to the way fi nancial and technological factors impact on reserves measurement, it is worth reviewing the types of reserves classifi cations that ultimately lead to KPI and valuation.
Getting a Slice of the PieIt is worth distinguishing between the oil and gas resource and reserves. Th e ‘global resource’ is the ‘size of the pie’ or the entirety of the earth’s oil and gas. Th e slice of this pie that is recoverable using today’s technology at today’s cost – price structure is known as ‘global proved reserves’. According to BP’s Statistical Review 2008, worldwide proved reserves of oil are 1.238 trillion barrels (see Figure 1) and those of gas are 6.263 trillion cubic feet (see Figure 2). Th e US Geological Survey, however, places the global resource of oil initially in place at 3 trillion barrels. We will come back to the size of the pie in the context of peak
Hydrocarbon Highway
www.saudiarabiaoilandgas.com | SA O&G Issue 24
65
The Three ‘Ps’Defi ned according to a sliding scale of the ‘probability’ or percentage chance of production, the three ‘Ps’—Proved, Probable and Possible—are illustrated by the fi gure below. Th ey indicate the relative ease or diffi culty with which the reserves in question can be produced. It is standard practice for a numerical ‘P factor’ to be assigned to represent the specifi c probability of the reserves being produced. Typically, ‘P’ values for ultimate recovery range from P90 for a very high probability, P50 for medium probability and P10 for a very low probability. A series of questions related to location, accessibility and technology need to be answered before ‘P’ values can be ascertained. Are the reserves located in easily accessible areas or shallow depths? Are there wells, platforms or pipelines in place? Does the technology exist to reach the reserves today? If the answer is ‘yes’ to these questions, the probability of
oil; however, for now it is worth noting that reserves are ranked based on their ultimate probability of production. Th at is to say one day in the future they will be brought to surface and sold.
Once the resource is discovered, reserves need to be booked. Th is process involves mapping out and visu-alising one or more underground structures (leads or prospects) that may extend over 200 square miles. Reserves must then be classifi ed and assigned values ac-cording to the probability of their production. Finally, the value of reserves are discounted to today’s worth. For fi nancial and asset planning purposes, the key de-terminants are the likely size of discovered reserves and their ease of recovery10.
Th e most common classifi cations are the generic three ‘Ps’ and the more specifi c ‘P factor’.
Reserves which can be producedeconomically through improved
recovery techniques (such as water injection to maintain reservoirpressure) are included in the
‘proved’ classifi cation when anincrease in production is seen.
Hydrocarbon Highway
66
production is clearly high so these are proved reserves. Where the answer is ‘no’ and nothing is in place other than outline plans, such reserves are low probability. Most reserves will fall between these two extremes in that they have varying degrees of infrastructure in place.
Corresponding to a value, i.e. P 90, P 50 or P 10, the ‘P factor’ simply represents the percentage chance of reserves being produced. Proved is 90%, Probable is 50% and Possible is 10%11.
Th is classifi cation uses a scale based on the develop-ment status, the infrastructure in place and the ease of recovery of oil and gas. Reserves that score lower on development status and infrastructure are harder to develop so their percentage chance of recovery falls;
therefore, they are assigned a lower ‘P’ class with a low-er ‘P’ value.
‘Proved reserves’ refer to the estimated quantities of crude oil, natural gas and Natural Gas Liquids (NGLs) which can be recovered with demonstrable certainty using geological and engineering data. Th is applies, for example, to future production from known reservoirs under existing economic and operating conditions, i.e., oil prices and lifting costs as of the date the esti-mate is made.
Reservoirs are considered ‘proved’ if economic produc-tion is supported by actual production or conclusive formation tests showing an increase in production. Th e area of a reservoir considered proved includes: the por-tion identifi ed by drilling and defi ned by gas-oil and/or
A common model defi nes a play as ‘a set of known or postulated oil and/or gas accumulations sharing similar geologic, geographic, and
temporal properties such as source rock, migration patterns, timing,
trapping mechanisms, andhydrocarbon types’.
Hydrocarbon Highway
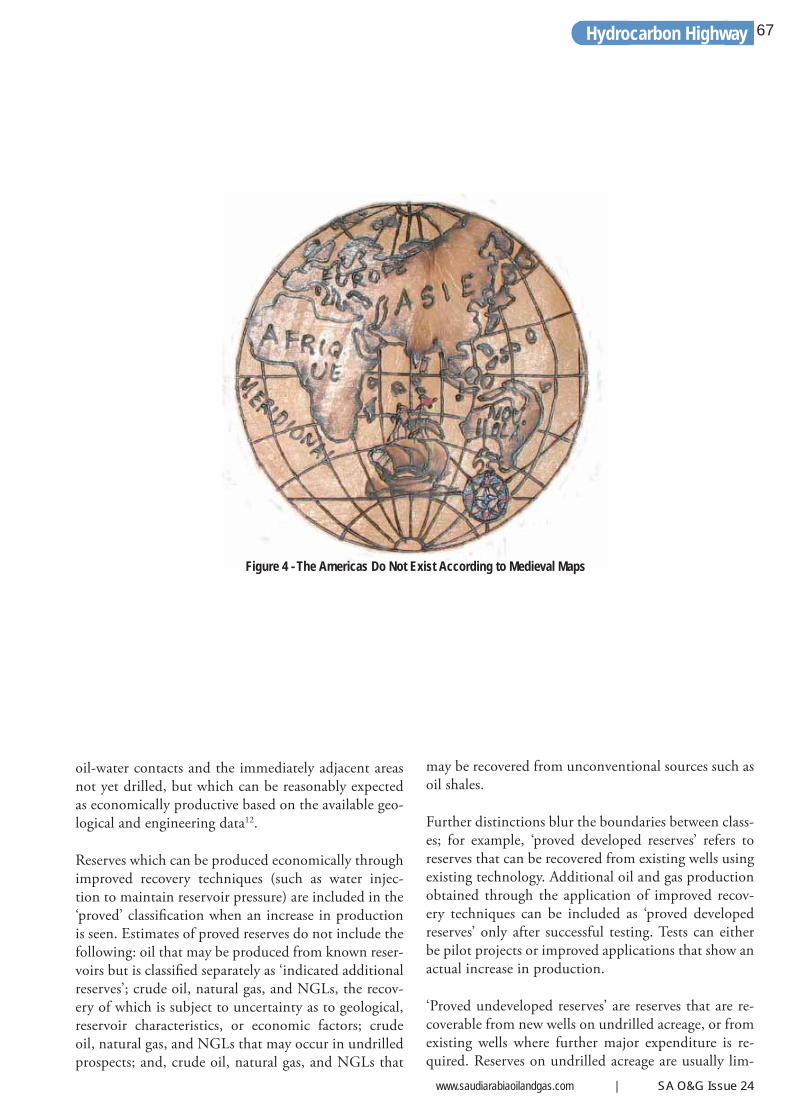
www.saudiarabiaoilandgas.com | SA O&G Issue 24
67
Figure 4 - The Americas Do Not Exist According to Medieval Maps
oil-water contacts and the immediately adjacent areas not yet drilled, but which can be reasonably expected as economically productive based on the available geo-logical and engineering data12.
Reserves which can be produced economically through improved recovery techniques (such as water injec-tion to maintain reservoir pressure) are included in the ‘proved’ classifi cation when an increase in production is seen. Estimates of proved reserves do not include the following: oil that may be produced from known reser-voirs but is classifi ed separately as ‘indicated additional reserves’; crude oil, natural gas, and NGLs, the recov-ery of which is subject to uncertainty as to geological, reservoir characteristics, or economic factors; crude oil, natural gas, and NGLs that may occur in undrilled prospects; and, crude oil, natural gas, and NGLs that
may be recovered from unconventional sources such as oil shales.
Further distinctions blur the boundaries between class-es; for example, ‘proved developed reserves’ refers to reserves that can be recovered from existing wells using existing technology. Additional oil and gas production obtained through the application of improved recov-ery techniques can be included as ‘proved developed reserves’ only after successful testing. Tests can either be pilot projects or improved applications that show an actual increase in production.
‘Proved undeveloped reserves’ are reserves that are re-coverable from new wells on undrilled acreage, or from existing wells where further major expenditure is re-quired. Reserves on undrilled acreage are usually lim-
Hydrocarbon Highway
68
ited to those areas where there is reasonable certainty of production when drilled. Proved reserves for other undrilled units can only be claimed where it can be demonstrated with certainty that there is continuity of production from the existing productive formation.
Russian and Norwegian Reserves Classification Russian and Western methods of estimation and classifi cation of reserves are somewhat diff erent. Th e Russian offi cials have divided oil and gas reserves into six classes: A, B, C1, C2, D1 and D2. Class A represents proven reserves and B provable reserves. Class C1 represents reserves estimated by means of drilling and individual tests, and C2 reserves are based on seismic exploration. Classes D1 and D2 represent hypothetical and speculative reserves13.
Norway uses its own defi nitions of reserves, which run from Category 0 – 914.
Category 0 is defi ned as ‘Petroleum resources in de-posits that have been produced and have passed the re-serves reference point. It includes quantities from fi elds in production as well as from fi elds that have been per-manently closed down’.
Category 9 includes resources in leads and unmapped resources and covers undiscovered, recoverable petrole-um resources attached to leads. It is uncertain whether the leads, and if so the estimated resources, are actually present. Th e resource estimates refl ect estimated vol-umes multiplied by the probability of making a discov-ery. Th is probability must be stated15.
Geologic Assessment ProceduresOil companies often use models to assess geologic structures or oil and gas plays. A common model defi nes a play as ‘a set of known or postulated oil and/or gas accumulations sharing similar geologic, geo-
Technology is the stock-in-trade of the service companies and a
principal measure by which analysts derive multiplier or share valuations
of service companies beyondearnings.
Hydrocarbon Highway
www.saudiarabiaoilandgas.com | SA O&G Issue 24
69
graphic, and temporal properties such as source rock, migration patterns, timing, trapping mechanisms, and hydrocarbon types’.
Oil companies use this approach to process explora-tion knowledge such as seismic or aerial surveys or wildcats generated by the exploration teams. A funda-mental part of this process is the attributing of prob-abilities for each petroleum play. Geologists will also assign subjective probability distributions to character-ise attributes of undiscovered conventional oil and gas accumulations16.
Th e geologic risk structure is modelled by assigning a probability to each play. Th is probability is based on at
least one accumulation meeting the minimum size re-quirements (50 MMBO in place or 250 BCF gas recov-erable). In particular, the oil company will assign prob-ability distributions for reservoir attributes such as net reservoir thickness, area of closure, porosity and trap fi ll.
Net pay estimates are derived from the data and include the extent and distribution of the reservoir. Th ese estimates are essentially refi ned and related to P values, i.e. P90, and are verifi ed to see whether they are consistent with existing knowledge. Other factors to be considered will be hydrocarbon recovery factor, porosity and permeability forecasts and initial production17.
Given that demand for oil and gas will rise in the long-term, and
considering the track record of the E & P industry to date, furtheradvances in E & P technology
will permit almost all petroleumreserves, irrespective of location,
to be developed before new energy sources and exits from the
Hydrocarbon Highway are created.
Hydrocarbon Highway
70
Peak Oil and Medieval MapsSince the publication of Hubbert’s Peak in 1956, the theory of ‘peak-oil’ has gained in importance with a growing chorus of support from within the industry and wider society. Yet is peak oil really a physical decline in production levels or is it a philosophical debate mired in the minutiae of reserves and production systems?
To answer these questions, we need to adopt a global E & P perspective that integrates prospective E & P areas with technology applications. Equally we need to recognise the limits of conventional wisdom. Are we navigating with a ‘medieval map’ of worldwide hydro-carbon reserves – one that does not adequately refl ect the total resource?18.
Optimist or Pessimist?Two schools of thought exist. Optimists state there is an
abundance of oil and gas and that there is enough for everyone, while pessimists state there is a defi cit and we are doomed. Th ese two positions, and the consequent debate, have generated much emotion, not to mention a multi-million dollar niche industry. What appears to be important here is that no-one disagrees that a peak or decline will occur, that is the natural state of systems. Yet, no-one can agree on when or even why this event will occur. It is worth considering this debate as it can help us understand the ‘psychological’ supply shortfall of prospects. Th is has a knock-on psychological eff ect on supply which is compounded by a herd mentality within the oil and gas markets (see Chapter 12: Paper Barrels for detail).
Th e pessimists reason as follows:
1. Rare conditions allow petroleum reserves to be
Th e West African margin has been extended from the high-profi le plays
in the shallow waters of the Niger Delta, Nigeria and the CongoBasin, Angola to deeper waters
and to highly prospectivesub-salt plays.
Hydrocarbon Highway
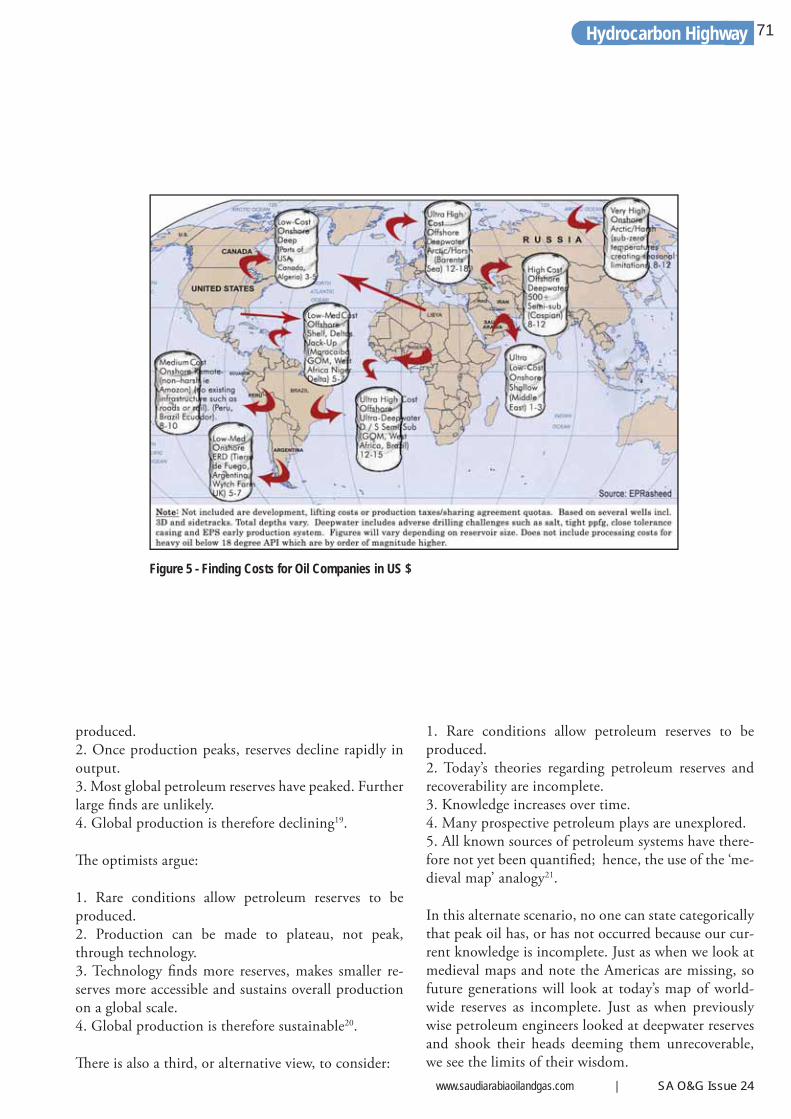
www.saudiarabiaoilandgas.com | SA O&G Issue 24
71
Figure 5 - Finding Costs for Oil Companies in US $
produced.2. Once production peaks, reserves decline rapidly in output.3. Most global petroleum reserves have peaked. Further large fi nds are unlikely.4. Global production is therefore declining19.
Th e optimists argue:
1. Rare conditions allow petroleum reserves to be produced.2. Production can be made to plateau, not peak, through technology.3. Technology fi nds more reserves, makes smaller re-serves more accessible and sustains overall production on a global scale.4. Global production is therefore sustainable20.
Th ere is also a third, or alternative view, to consider:
1. Rare conditions allow petroleum reserves to be produced.2. Today’s theories regarding petroleum reserves and recoverability are incomplete.3. Knowledge increases over time.4. Many prospective petroleum plays are unexplored.5. All known sources of petroleum systems have there-fore not yet been quantifi ed; hence, the use of the ‘me-dieval map’ analogy21.
In this alternate scenario, no one can state categorically that peak oil has, or has not occurred because our cur-rent knowledge is incomplete. Just as when we look at medieval maps and note the Americas are missing, so future generations will look at today’s map of world-wide reserves as incomplete. Just as when previously wise petroleum engineers looked at deepwater reserves and shook their heads deeming them unrecoverable, we see the limits of their wisdom.
Hydrocarbon Highway
72
Deepwater production has been made routine, almost mundane through ‘game-changing’ and cost-eff ective technology. Th is ranges from pre-drill packages that in-corporate sub-salt imaging to seabed to surface risers to directional drilling techniques that can enable multiple reservoir completions.
In this way, the ultimate recoverability of reserves is tempered by the cost of technology. If E & P tech-nology can be made available at cost-eff ective prices, reserves can be developed. Th is is because fi nding and lifting costs ultimately determine development. If the costs of development outweigh the price of oil, there simply is not enough profi t to develop them.
As noted earlier, the SEC classifi es reserves according to very narrow defi nitions that do not satisfactorily ac-count for the role of E & P technology in fi nding and producing reserves. Peak oil theorists tend to use such classifi cations too.
Peak oil theorists tend to overlook the industry’s track record of technology development. Technology is the stock-in-trade of the service companies and a principal measure by which analysts derive multiplier or share valuations of service companies beyond earnings.
Th is does not imply that petroleum is infi nite. It means that even though petroleum is a fi nite and scarce re-source, technology can increase production and ulti-mate recovery.
Aside from the technology factor, there is the question of the medieval map of reserves. As our globe-trotting exercise will show shortly, there are still several petro-leum provinces waiting to be mapped out.
Given that demand for oil and gas will rise in the long-term, and considering the track record of the E & P industry to date, further advances in E & P technology will permit almost all petroleum reserves, irrespective
Game-changing technology such as 3D seismic improved the
visualisation of reserves, whilehorizontal drilling and geosteering altered the defi nition of what was
deemed uneconomic or unreachable at a given time.
Hydrocarbon Highway
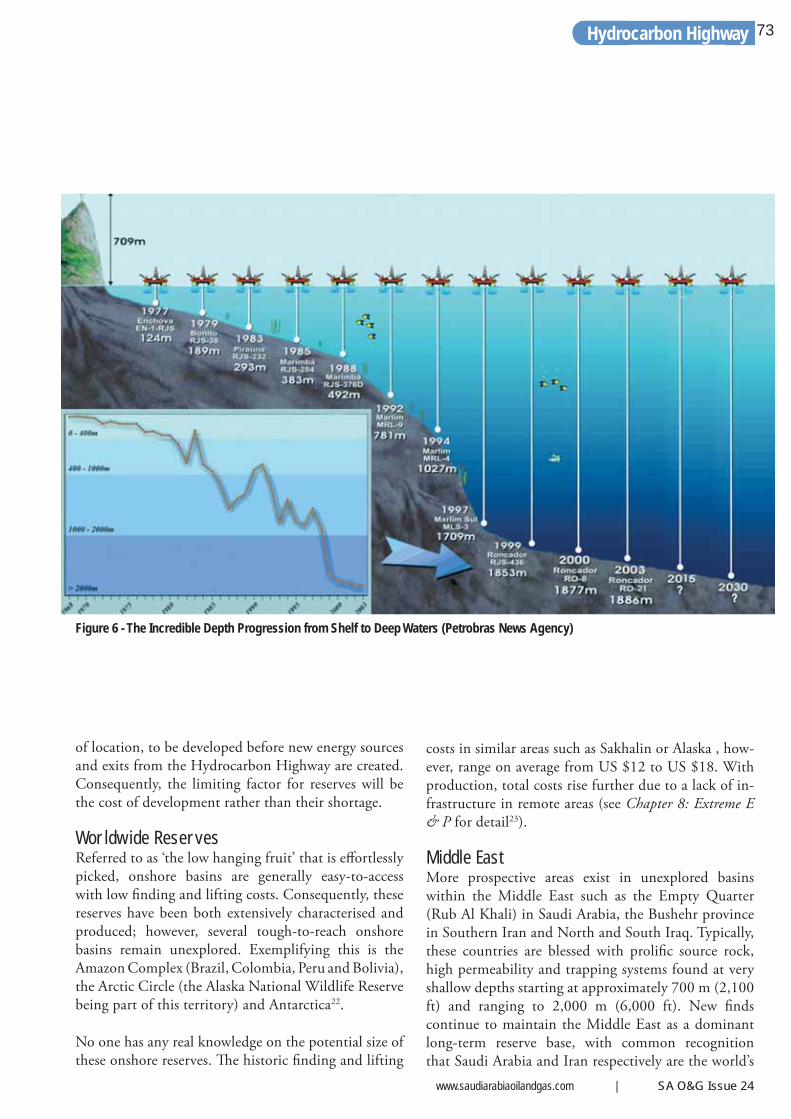
www.saudiarabiaoilandgas.com | SA O&G Issue 24
73
Figure 6 - The Incredible Depth Progression from Shelf to Deep Waters (Petrobras News Agency)
of location, to be developed before new energy sources and exits from the Hydrocarbon Highway are created. Consequently, the limiting factor for reserves will be the cost of development rather than their shortage.
Worldwide ReservesReferred to as ‘the low hanging fruit’ that is eff ortlessly picked, onshore basins are generally easy-to-access with low fi nding and lifting costs. Consequently, these reserves have been both extensively characterised and produced; however, several tough-to-reach onshore basins remain unexplored. Exemplifying this is the Amazon Complex (Brazil, Colombia, Peru and Bolivia), the Arctic Circle (the Alaska National Wildlife Reserve being part of this territory) and Antarctica22.
No one has any real knowledge on the potential size of these onshore reserves. Th e historic fi nding and lifting
costs in similar areas such as Sakhalin or Alaska , how-ever, range on average from US $12 to US $18. With production, total costs rise further due to a lack of in-frastructure in remote areas (see Chapter 8: Extreme E & P for detail23).
Middle East More prospective areas exist in unexplored basins within the Middle East such as the Empty Quarter (Rub Al Khali) in Saudi Arabia, the Bushehr province in Southern Iran and North and South Iraq. Typically, these countries are blessed with prolifi c source rock, high permeability and trapping systems found at very shallow depths starting at approximately 700 m (2,100 ft) and ranging to 2,000 m (6,000 ft). New fi nds continue to maintain the Middle East as a dominant long-term reserve base, with common recognition that Saudi Arabia and Iran respectively are the world’s
Hydrocarbon Highway
74
largest and second largest holders of oil reserves. Further, fi nding, lifting and production costs are the lowest worldwide, averaging between US $1 to US $3 a barrel24.
Lifting costs can vary, however, by way of comparison. In other relatively low-cost areas like Malaysia and Oman, lifting costs can range from US $3 to US $12 a barrel to produce. Production costs in Mexico and Russia might potentially be as low as US $6 to US $12 per barrel (higher under current production arrange-ments by local companies)25.
By reviewing the world’s prospective shallow coastal waters, deltas and oceans, it becomes clear that our map of global resources is incomplete. In the off shore realm, there are many unexplored basins with fi nding, lifting and production costs varying from US $18 to US $25 per barrel for certain deeper waters. Large tracts off the coast of West and North Africa are undeveloped. Th e West African margin has been extended from the high-profi le plays in the shallow waters of the Niger Delta, Nigeria and the Congo Basin, Angola to deeper waters and to highly prospective sub-salt plays. Mauritania
and Tanzania are other examples where new discover-ies have been made26.
South of Australia in Tasmania, oil companies have been studying gas plays since 2000 which had previ-ously been neglected due to the search for oil. Th is has led to indications of oil being found in Africa near Madagascar, which has been identifi ed as a potential new petroleum province27. Mauritania and Tanzania are other examples where new African discoveries have been made. Another area is off shore Morocco, where the deposition of an ancient river system was found over salt. A mobile substrate, either salt or shale, is a key element all along the West African margin be-cause it provides geological factors necessary for oil and gas28.
Continental Plate ReconstructionA clear example of continental plate reconstruction and conjugate oil and gas of plays is off shore West Africa and off shore Brazil. By using reconstructions, it can be seen that the Rio Muni Basin was the ‘mirror’ basin to the Sergipe-Alagoas Basin in Brazil, and the Congo Basin to the Campos Basin. By repeating this
In addition to developing thetechnology to drill in deeper waters,
the industry has developed theability to drill extreme off setsfrom a single surface location.
Hydrocarbon Highway
www.saudiarabiaoilandgas.com | SA O&G Issue 24
75
process along the coast of West Africa and Brazil, several emerging oil and gas plays can be drawn up. Th ese include the sub-salt frontiers of off shore Brazil including Tupi. Although production is not likely to make a major impact on world oil exports over the next decade, the point is that new frontiers have been discovered29.
In Central America, the off shore area between Venezuela and Trinidad, the Gulf of Paria, is largely unexplored as are the waters off Colombia and Peru30.
Th e Gulf of Mexico (GOM) has unexplored waters that stretch from the shallow waters off Florida, US and move into the territorial GOM waters of Cuba, vast areas of deep waters in the Mexican GOM and the deeper waters of the US GOM. Within the US GOM, the sub-salt play has been instrumental in new fi nds.
Off shore production in areas like the North Sea with off shore platforms, can run to US $12 to US $18 a
barrel. As reservoirs become smaller, those costs tend to rise. In Texas and other US and Canadian fi elds, where deep wells and small reservoirs make production espe-cially expensive, costs can run above US $20 a barrel.
Further East, we note that certain areas of the Northern North Sea and the Barents Sea are still to be explored. While in Russia, Sakhalin Island, the Central Asian Republics, the Red Sea, the Persian Gulf, the Indian Ocean, Off shore Australia and New Zealand, several off shore basins represent prospective yet unexplored areas31.
What is the total resource base? Th e US Geological Survey puts this at 3 trillion barrels of oil. Again, it’s hard to say because we are still waiting to fi nalise the map.
SweatingTh e Finding and Development in Figure 5 clear-ly shows that, when crude oil prices fall below US $20 a barrel, many areas become unprofi table and
In river deltas worldwide, as the shallow water plays were developed, exploration eff orts evolved into the
deepwater usually with onlymajor international oil
companies that could qualifyfor the blocks.
Hydrocarbon Highway
76
production is reduced if not halted altogether. Only certain lower cost areas can remain profi table and hence maintain production during a ‘good sweating’ period32.
Two factors emerge from this globe-trotting exercise: fi rst, there is a lack of characterisation in many highly prospective basins and gulfs; and second, there is high prospectivity, but it is tempered by technical limita-tions and increased costs.
None of these areas is mature; most are unexplored and some are even unlicensed. Th is is despite adjoining proven hydrocarbon producing basins or sharing geo-logical characteristics such as source rock, trapping and faulting. It is fair to say that we have not yet character-ised the world’s oil and gas basins nor their accompa-nying reserves. Consequently, how can we even assume that global peak oil production has occurred? (Gas is another matter entirely as it can be man-made).
Conventional Wisdom and the Limits of Our Map Th e limitations of our map of oil and gas reserves start to become clear when we consider past theories. In the 1990s, one widely held view stated that off shore oil and gas reserves would not be found at extreme conditions, i.e. depths exceeding a TVD of 20,000 ft (6,096 m). It was suggested that overburden pressures would either cause a loss of hydrocarbons due to migration to shallower traps or compaction33. Now that theory has changed because oil and gas trends have been located at far greater depths than prior knowledge would indicate. Th ink deep gas, US GOM.
In the 1980s, another example of a change in thinking occurred concerning the fl ow paths of fl uvial deposi-tion. Ancient river systems account for the sedimenta-tion that leads to accumulations of oil and gas. In river deltas worldwide, as the shallow water plays were de-veloped, exploration eff orts evolved into the deepwater usually with only major international oil companies
Th e billion-dollar think tanks and research and development facilities that major service companies own
are continually creating newtechnologies that help access
reserves previously considereduneconomic or unreachable.
Hydrocarbon Highway
www.saudiarabiaoilandgas.com | SA O&G Issue 24
77
that could qualify for the blocks34.
Smaller oil companies, therefore, were limited to ex-ploring other geologic scenarios and plays. Th ey recog-nised that over time the places where these river systems had been depositing sediment had changed, and the Independents’ exploration discovered ‘new’ margins.
Another example of limited knowledge has been sub-salt basins. Th ese have been discovered and are being explored in the GOM and worldwide. Sub-salt plays in West Africa, Brazil and GOM show deeper accumula-tions of oil and gas trends that had not been predicted or expected earlier.
Game-Changing TechnologyBack in the late 1980s, it was thought that development of thin sands such as ‘Norwegian Troll oil’ would never
be economically feasible, because the oil reserves were so thinly layered and the price of oil was US $10 per barrel. Game-changing technology such as 3D seismic improved the visualisation of reserves, while horizontal drilling and geosteering altered the defi nition of what was deemed uneconomic or unreachable at a given time. Th e billion-dollar think tanks and research and development facilities that major service companies own are continually creating new technologies that help access reserves previously considered uneconomic or unreachable. Service companies and operators develop technology in-house through joint industry projects and with best-in-class companies; for example, Shell and Petrobras respectively are involved in the monobore and the Procap 3000 initiatives—two examples of technology cascading downward. Underlying the monobore (a vision of drilling and casing a single-diameter well from top to bottom) is the creation of
Th e buzzwords of ‘ultra-deepwater, digital oilfi eld and barrel-chasing’ may fi rst be heard in oil company
offi ces due to the engineeringchallenges and risks oil
companies ‘buy’.
Hydrocarbon Highway
78
businesses to develop the downhole tools, tubes and markets for expandable tubulars. Procap 3000, a range of exploration and production technologies, is paving the way in ultra-deepwater development. Drilling contractors have introduced simultaneous drilling and completion of two wells by way of the dual-activity derrick system35.
TechnologyScarcity of oil reserves and increasing reserve replace-ment costs are the twin factors that have accelerated the technological evolution of E & P and enabled ex-treme E & P (see Chapter 8: Extreme E & P). Th is evo-lution is most clearly visualised in the dramatic shift from onshore to off shore exploration. Th e incredible depth progression from land to shallow coastal waters to deep waters to the extremes of ultra-deepwater is shown in the graphic below36.
A few decades ago, it was not considered possible to pro-duce in waters beyond 6,561 ft (2,000 m) depth, and accordingly, those reserves were listed as ‘P 10s’ with a very low possibility of production. Rigs and risers were
just some of the incredible challenges. Th e industry has, however, progressively tapped deepwater accumu-lations. First, it targeted shallow onshore reserves as the less challenging ‘low-hanging fruit’. As those resources became scarcer, E & P went deeper onshore and spread to shallow off shore waters. E & P operations in 8,200 ft (2,500 m) water depth are routine, and the challenge now is 9,842 ft (3,000 m) and deeper.
Records are continually set and broken not just in deeper water depths (3,000 m) but also in deep res-ervoirs below salt domes, tar zones and in the remote basins of the world and in new frontiers. Th is includes the latest subsea water separation systems and sub-sea sand separation to achieve maximum production. Remarkably, however, almost all of this enabling E & P technology is considered an outsourced commod-ity marketed by service and supply companies, which means the NOCs have no shortage of technology ven-dors. Th e buzzwords of ‘ultra-deepwater, digital oilfi eld and barrel-chasing’ may fi rst be heard in oil company offi ces due to the engineering challenges and risks oil companies ‘buy’. Th ey resonate most loudly, however,
Records are continually set andbroken not just in deeper water
depths (3,000 m) but also indeep reservoirs below salt domes,
tar zones and in the remotebasins of the world and in
new frontiers.
Hydrocarbon Highway
www.saudiarabiaoilandgas.com | SA O&G Issue 24
79
throughout the service-side: in product development, in research facilities and on test rigs before technology is commercially run in fi eld applications37.
In addition to developing the technology to drill in deeper waters, the industry has developed the ability to drill extreme off sets from a single surface location. Th is has profound implications in reducing our en-vironmental ‘footprint’ and providing economic ac-cess to thousands of ‘satellite fi elds’. As of 2008, the world’s record Extended Reach Drilling (ERD) well was drilled in the Persian Gulf from a jack-up drilling rig. Th e total measured depth of the well was 40,320 ft (12,293 m), and the well’s bottom was off set 37,956 ft (11,572 m) from its surface location. In the UK, ERD techniques enabled BP to develop Wytch Farm, an en-tire oil fi eld under an environmentally sensitive resort and vacation area on the south coast of England, with no visible footprint. Off Sakhalin Island in far east Siberia, Russian companies are exploiting oil reservoirs from land by drilling ERD wells out under sea ice that would ordinarily damage off shore facilities.
Th ese feats were inconceivable to Hubbert when he developed his peak oil theory. Hubbert was correct to state that oil is a fi nite resource – and he can’t be blamed for letting a medieval mentality aff ect his pre-
diction of when we would run out. People today who are still letting medieval thinking guide them, however, should know better.
What emerges from the peak oil debate is that we are reading the directions to worldwide reserves from a ‘medieval map’. Clearly, there are new frontiers and plays to be developed. Th ink Subsalt, Arctic and Deepwater E & P which is changing the defi nition of P 10’s into P 90’s. Coupling this with innovative think-ing and cutting-edge technology makes for a convinc-ing argument; peak oil as far as reserves are concerned, is a philosophical debate rooted in a psychological shortage not a physical one.
We are not in fact running out of oil. We have many ar-eas yet to explore before we have to worry about oil and gas shortages. As we have been shown, there are plenty of barrels of oil remaining. Th e next logical question then would be ‘What is in a barrel of oil?’ Everyone al-ways talks about barrels, but no really talks about their composition or how this aff ects recovery.
References1. See Harts E & P Sept 2002 Drilling Column. ‘Manage your tapped resources’ by Wajid Rasheed. Discussion on industry cycles and reserves acquisition.
In addition to developing thetechnology to drill in deeper waters,
the industry has developed theability to drill extreme off sets from a
single surface location.
Hydrocarbon Highway
80
2. Th e OPEC Statute requires OPEC to pursue stabil-ity and harmony in the petroleum market for the ben-efi t of both oil producers and consumers. To this end, OPEC Member Countries respond to market funda-mentals and forecast developments by co-ordinating their petroleum policies.
3. See Booklet: What is OPEC? Production regulations are simply one possible response. If demand grows, or some oil producers are producing less oil, OPEC can increase its oil production in order to prevent a sudden rise in prices. OPEC might also reduce its oil produc-tion in response to market conditions. Public Relations & Information Department, OPEC Secretariat, Obere Donaustrasse 93, A–1020 Vienna, Austria. Tel: +43 1 211 12-279, (www.opec.org).
4. See Oil and Gas Reserves Committee (OGRC) “Mapping” Subcommittee Final Report – December 2005 p 14, Russian Reserves Classifi cation based on Russian Ministry of Natural Resources (RF-2005).
5. Ditto p 16 Norwegian based on Norwegian Petroleum Directorate (NPD–2001).
6. Th ere are as many as 7 diff erent reserves classifi ca-tion systems in practice.
7. Th e SPE is seeking to overhaul and standardize cur-rent classifi cation methods.
8. Th e Industry is lobbying the SEC for a rule change.
9. E & P technology clearly make reserves more acces-sible. Th e problem is at what cost? Th e issue is not sim-ply related to oil price v technology cost but certainly more account should be made of the role of technology and reserves classifi cations.
10. Th is is what determines asset valuation and cash fl ow.
11. Standard knowledge in the industry.
12. See SPE (OGRC) “Mapping” Subcommittee Final Report Defi nition of Proved Reserves page 31.
13. Ditto p 14 Russian Classifi cations.
14. Ditto p 16 Norwegian Classifi cations.
15. Ditto.
16. Baker, R.A., Gehman, H.M., James, W.R., and White, D.A., 1984, Geologic fi eld number and size as-
Service companies and operatorsdevelop technology in-house
through joint industry projects and with best-in-class companies...
Hydrocarbon Highway
www.saudiarabiaoilandgas.com | SA O&G Issue 24
81
sessments of oil and gas plays: American Association of Petroleum Geologists Bulletin, v. 68, no. 4, p. 426–437.
17. Plays and Concessions—A Straightforward Method for Assessing Volumes, Value, and Chance, P. Jeff rey Brown and Peter R. Rose
18. U.S. Geological Survey World Petroleum Assessment 2000—Description and Results By USGS World Energy Assessment Team.
19. Communications with Dr Colin Campbell, one of the leading voices of Peak Oil.
20. Optimists.
21. Th is is the Author’s own view. Th e three Ps are commonly recognized measures of probability of production.
22. Clearly, at some point Antarctica will be opened up for E & P. See Th e Petroleum Potential of Antarctica, Macdonald, David University of Aberdeen, UK.
23. Remote projects that I have worked on i.e. Brazil Foz de Amazonas, Amazon, have had the lack of infra-
structure create major problems for planned operations and unplanned events.
24. From both IOC and NOC data.
25. Th ese are not replacement costs but historic costs. Report on UK Sector NWECS 2000 Wajid Rasheed.
26. See Brazil Oil and Gas Issue 1, Interview with Petrobras International Executive Manager Joao Figueira (www.braziloilandgas.com).
27. See Th e Tectonic and Paleogeographic Context of Madagascan Petroleum Systems, Hoult et al Models of a pre-Jurassic Gondwana fi t range from a palaeo loca-tion for Madagascar off Mozambique (Flores, 1970) to that of Reeves et al. (2004) who, like most current authors, place Madagascar off the Kenya/Somali coast. Th e precise tightness of fi t is still a matter of debate.
28. See AAPG Explorer Magazine Nov 2002 Kathy Shirley.
29. See Brazil Oil and Gas Issue 11 p 6 Tupi’s recover-able volume of 5 to 8 billion barrels of oil equivalent may place Brazil in the select group of petroleum ex-porting countries (www.braziloilandgas.com/issue10).
Just as when we look at medieval maps and note the Americas are
missing, so future generations will look at today’s map of worldwide
reserves as incomplete.
Hydrocarbon Highway
82
In 2008, Petrobras announced new oil discoveries in the Santos, Espírito Santo, Campos, and Jequitinhonha Basins. In the Santos Basin pre-salt layer alone, the company estimates recoverable volumes of 9.5 billion and 14 billion barrels of oil and gas in barrel equivalent in the Tupi, Iara, and Jupiter areas. In September 2008, the Company started producing in the pre-salt in the Espírito Santo sea, in the Jubarte Field, located in the Campos Basin.
30. Th e Identifi cation of Th e Depositional Environ-ments Of Th e Cruse, Forest And Morne L’Enfer Formations In Th e Southern Half Of Th e Gulf Of Paria, Trinidad, West Indies Curtis Archie, PetroTrin.
31. Oil from the South: Mesozoic Petroleum Systems, Proven and Potential, in Mid to High Southerly Latitudes Bradshaw, Marita et al. Is there a corre-sponding belt of petroliferous basins in the southern hemisphere? Notable oil provinces do occur in mid to high southerly latitudes. Oil source rocks include marine Early Cretaceous shales (San Jorge and Magallanes/Austral basins, South America; Bredasdorp Basin, South Africa) and Late Cretaceous to Eocene coaly sediments (Gippsland Basin, south-east Australia; Taranaki Basin, New Zealand). Frontier Mesozoic rift basins occur in off shore East Africa, along Australia’s southern margin (Bight and Mentelle basins), on the Lord Howe Rise, off shore New Zealand and in the Falklands. Regional studies of the shared history of Gondwana breakup and paleoclimatic and environ-mental reconstructions can guide exploration in these frontier areas.
32. See page 230 Th e Prize: Th e epic quest for Oil, Money and Power Daniel Yergin Publisher: Simon and Schuster (Jan 01 1993) ISBN: 0671799320.
33. AAPG Explorer, October 2008, Independents Find Africa Success.
34. Gas Beckons in Deep Shallows. Louise Durham Gas exploration to depths of 30,000 ft.
35. Th e Discoverer Enterprise of Transocean is the fi rst ultra-deepwater drillship with dual activity drilling technology, which aims to reduce the cost of an ultra-
deepwater development project by up to 40 percent. Two full-sized rotary tables are designed into a drill fl oor more than twice as large as a conventional one.
36. Th e industry is looking at ultra-deepwater as 3,000 m.
37. Harts E & P Mar 2002 Drilling Column, by Wajid Rasheed. ‘Small companies and tangled thickets’.
38. See Th e Medieval Map page 45.
39. Campbell, Peak Oil … Hubberts Peak: Th e Impending World Oil Shortage Deff yes.
40. Author’s notes on acreage in emerging markets.
41. Lifting costs EPRasheed.
42. Idem.
43. Th e End of Oil: On the Edge of a Perilous New World Roberts Publisher: Houghton Miffl in; (May 15, 2004) 400 pages ISBN: 0618239774.
44. AAPG Morocco substrate.
45. Deepwater plays are among the most complex, high cost projects requiring large capital investment therefore favouring large IOCs.
46. Expand your mind, Harts E & P 2004 Wajid Rasheed.
47. Petrobras evolution off shore.
48. Th e Oil Factor: How Oil Controls the Economy and Your Financial Future Donna & Stephen Leeb Published: February, 2004 ISBN: 0446533173.
49. Coming Oil Crisis, Campbell Publisher: Multi-Science Publishing Co. Ltd.; (April 1, 2004) 210 pages ISBN: 0906522110.
50. Hubberts Peak: Th e Impending World Oil Shortage Deff yes Publisher: Princeton University Press; (August 11, 2003) 224 pages ISBN: 0691116253.
Hydrocarbon Highway

Jan/Feb Mar/Apr May/Jun Jul/Aug Sep/Oct Nov/Dec
Editorial 2012 Calendar
Contribute to Saudi Arabia Oil & Gas during 2012
BONUS CIRCULATION
SPECIAL PUBLICATIONS
www.saudiarabiaoilandgas.com
New Stimulation Technology
Advances in DrillingTechnology Smart Reservoirs
Deep Diagnostics & Reservoir Mapping
Geosciences
E&P SoftwareSolutions for Asset, Field and WellManagement
Intelligent Fields
Oil Field Automation and Optimization
Extreme ReservoirContact
Seismic
Near Surface
Wide Azimuth
Near SurfaceResolution
Integration inUpstream
Shale GasDevelopments
Shale GasTechnologyChallenges
Real Time Operations
I Field
Drilling Automation
Deep Water Red Sea Challenges
Assessment of KSA & IOCs Gas ExplorationInitiatives
KSA UpstreamResearch &Development
KFUPM Techno Valley
Tight GasTechnologyDevelopment
KSA Offshore Gas Development Projects (Karan, Wasit, Arabia, etc....)
Smart WaterChemistry inCarbonate Recovery
Maximizing Sweep Efficiency inHeterogeneousCarbonate Reservoir Using AdvancedIntelligentCompletionTechnology
Red Sea SaltChallenges
EPRasheed is looking for editorial submissions on the topics outlined in the editorial calendar. This can provide your company with the opportunity to communicate EP technology to the wider oil and gas community.
Please send abstracts or ideas for editorial to [email protected]
Preference is given to articles that are Oil Company co-authored, peer reviewed or those based on Academic research.
10th Middle EastGeosciencesConference &Exhibition* 4-7 March 2012 Bahrain
SPE/IADC DrillingConference 6-8 March 2012San DiegoCaliforniaUSA
SPE/DGS AnnualTechnical Symposium &Exhibition*8-11 April 2012 KhobarSaudi Arabia
Offshore Technology Conference30 April - 3 May 2012Houston, TexasUSA
The 8th Middle East Refi ning &PetrochemicalsConference &Exhbition 20-23 May 2012ManamaBahrain
SPE Annual Technical Conference and Exhibition8-10 October 2012San AntonioTexas, USA
* Offi cial Technical Magazine * Offi cial Technical Magazine** Offi cial Saudi Magazine * Media Partner
Ad Closing:2 Jan 2011Materials Closing:9 Jan 2011
Ad Closing:6 March 2012Materials Closing:13 March 2012
Ad Closing:21 April 2012Materials Closing:28 April 2012
Ad Closing:4 July 2012Materials Closing:11 July 2012
Ad Closing:30 August 2012Materials Closing:31 August 2012
Ad Closing:6 October 2012Materials Closing:13 October 2012
Issue 24 ‘Deep Diagnostics’
Issue 25‘The Intelligent Field’
Issue 26‘Shale Gas’’
Issue 27‘Red Sea Challenges’
Issue 28Offshore Gas’
Issue 29‘Maximising SweepEffi ciency’
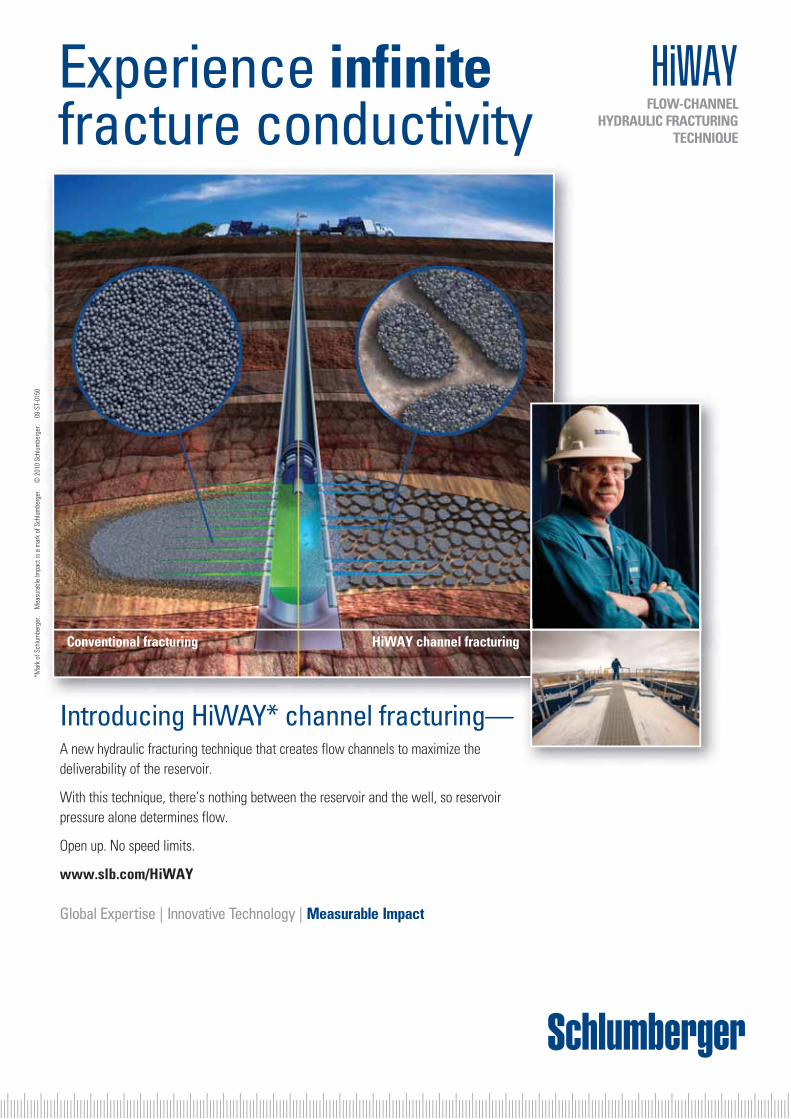
*Mar
k of
Sch
lum
berg
er.
Mea
sura
ble
Impa
ct is
a m
ark
of S
chlu
mbe
rger
. ©
201
0 S
chlu
mbe
rger
. 0
9-S
T-01
50
Introducing HiWAY* channel fracturing— A new hydraulic fracturing technique that creates flow channels to maximize the
deliverability of the reservoir.
With this technique, there’s nothing between the reservoir and the well, so reservoir
pressure alone determines flow.
Open up. No speed limits.
www.slb.com/HiWAY
Global Expertise | Innovative Technology | Measurable Impact
Experience infinite fracture conductivity FLOW-CHANNEL
HYDRAULIC FRACTURING TECHNIQUE
HiWAY
Conventional fracturing HiWAY channel fracturing