Embed Size (px)
Citation preview

8/7/2019 Saturn V Launch Vehicle Flight Evaluation Report - AS-509 Apollo 14 Mission
http://slidepdf.com/reader/full/saturn-v-launch-vehicle-flight-evaluation-report-as-509-apollo-14-mission 1/254

8/7/2019 Saturn V Launch Vehicle Flight Evaluation Report - AS-509 Apollo 14 Mission
http://slidepdf.com/reader/full/saturn-v-launch-vehicle-flight-evaluation-report-as-509-apollo-14-mission 2/254
8/7/2019 Saturn V Launch Vehicle Flight Evaluation Report - AS-509 Apollo 14 Mission
http://slidepdf.com/reader/full/saturn-v-launch-vehicle-flight-evaluation-report-as-509-apollo-14-mission 3/254

8/7/2019 Saturn V Launch Vehicle Flight Evaluation Report - AS-509 Apollo 14 Mission
http://slidepdf.com/reader/full/saturn-v-launch-vehicle-flight-evaluation-report-as-509-apollo-14-mission 4/254
8/7/2019 Saturn V Launch Vehicle Flight Evaluation Report - AS-509 Apollo 14 Mission
http://slidepdf.com/reader/full/saturn-v-launch-vehicle-flight-evaluation-report-as-509-apollo-14-mission 5/254

8/7/2019 Saturn V Launch Vehicle Flight Evaluation Report - AS-509 Apollo 14 Mission
http://slidepdf.com/reader/full/saturn-v-launch-vehicle-flight-evaluation-report-as-509-apollo-14-mission 6/254

8/7/2019 Saturn V Launch Vehicle Flight Evaluation Report - AS-509 Apollo 14 Mission
http://slidepdf.com/reader/full/saturn-v-launch-vehicle-flight-evaluation-report-as-509-apollo-14-mission 7/254

8/7/2019 Saturn V Launch Vehicle Flight Evaluation Report - AS-509 Apollo 14 Mission
http://slidepdf.com/reader/full/saturn-v-launch-vehicle-flight-evaluation-report-as-509-apollo-14-mission 8/254

8/7/2019 Saturn V Launch Vehicle Flight Evaluation Report - AS-509 Apollo 14 Mission
http://slidepdf.com/reader/full/saturn-v-launch-vehicle-flight-evaluation-report-as-509-apollo-14-mission 9/254

8/7/2019 Saturn V Launch Vehicle Flight Evaluation Report - AS-509 Apollo 14 Mission
http://slidepdf.com/reader/full/saturn-v-launch-vehicle-flight-evaluation-report-as-509-apollo-14-mission 10/254

8/7/2019 Saturn V Launch Vehicle Flight Evaluation Report - AS-509 Apollo 14 Mission
http://slidepdf.com/reader/full/saturn-v-launch-vehicle-flight-evaluation-report-as-509-apollo-14-mission 11/254

8/7/2019 Saturn V Launch Vehicle Flight Evaluation Report - AS-509 Apollo 14 Mission
http://slidepdf.com/reader/full/saturn-v-launch-vehicle-flight-evaluation-report-as-509-apollo-14-mission 12/254

8/7/2019 Saturn V Launch Vehicle Flight Evaluation Report - AS-509 Apollo 14 Mission
http://slidepdf.com/reader/full/saturn-v-launch-vehicle-flight-evaluation-report-as-509-apollo-14-mission 13/254

8/7/2019 Saturn V Launch Vehicle Flight Evaluation Report - AS-509 Apollo 14 Mission
http://slidepdf.com/reader/full/saturn-v-launch-vehicle-flight-evaluation-report-as-509-apollo-14-mission 14/254

8/7/2019 Saturn V Launch Vehicle Flight Evaluation Report - AS-509 Apollo 14 Mission
http://slidepdf.com/reader/full/saturn-v-launch-vehicle-flight-evaluation-report-as-509-apollo-14-mission 15/254

8/7/2019 Saturn V Launch Vehicle Flight Evaluation Report - AS-509 Apollo 14 Mission
http://slidepdf.com/reader/full/saturn-v-launch-vehicle-flight-evaluation-report-as-509-apollo-14-mission 16/254

8/7/2019 Saturn V Launch Vehicle Flight Evaluation Report - AS-509 Apollo 14 Mission
http://slidepdf.com/reader/full/saturn-v-launch-vehicle-flight-evaluation-report-as-509-apollo-14-mission 17/254

8/7/2019 Saturn V Launch Vehicle Flight Evaluation Report - AS-509 Apollo 14 Mission
http://slidepdf.com/reader/full/saturn-v-launch-vehicle-flight-evaluation-report-as-509-apollo-14-mission 18/254

8/7/2019 Saturn V Launch Vehicle Flight Evaluation Report - AS-509 Apollo 14 Mission
http://slidepdf.com/reader/full/saturn-v-launch-vehicle-flight-evaluation-report-as-509-apollo-14-mission 19/254

8/7/2019 Saturn V Launch Vehicle Flight Evaluation Report - AS-509 Apollo 14 Mission
http://slidepdf.com/reader/full/saturn-v-launch-vehicle-flight-evaluation-report-as-509-apollo-14-mission 20/254

8/7/2019 Saturn V Launch Vehicle Flight Evaluation Report - AS-509 Apollo 14 Mission
http://slidepdf.com/reader/full/saturn-v-launch-vehicle-flight-evaluation-report-as-509-apollo-14-mission 21/254

8/7/2019 Saturn V Launch Vehicle Flight Evaluation Report - AS-509 Apollo 14 Mission
http://slidepdf.com/reader/full/saturn-v-launch-vehicle-flight-evaluation-report-as-509-apollo-14-mission 22/254

8/7/2019 Saturn V Launch Vehicle Flight Evaluation Report - AS-509 Apollo 14 Mission
http://slidepdf.com/reader/full/saturn-v-launch-vehicle-flight-evaluation-report-as-509-apollo-14-mission 23/254

8/7/2019 Saturn V Launch Vehicle Flight Evaluation Report - AS-509 Apollo 14 Mission
http://slidepdf.com/reader/full/saturn-v-launch-vehicle-flight-evaluation-report-as-509-apollo-14-mission 24/254

8/7/2019 Saturn V Launch Vehicle Flight Evaluation Report - AS-509 Apollo 14 Mission
http://slidepdf.com/reader/full/saturn-v-launch-vehicle-flight-evaluation-report-as-509-apollo-14-mission 25/254

8/7/2019 Saturn V Launch Vehicle Flight Evaluation Report - AS-509 Apollo 14 Mission
http://slidepdf.com/reader/full/saturn-v-launch-vehicle-flight-evaluation-report-as-509-apollo-14-mission 26/254

8/7/2019 Saturn V Launch Vehicle Flight Evaluation Report - AS-509 Apollo 14 Mission
http://slidepdf.com/reader/full/saturn-v-launch-vehicle-flight-evaluation-report-as-509-apollo-14-mission 27/254

8/7/2019 Saturn V Launch Vehicle Flight Evaluation Report - AS-509 Apollo 14 Mission
http://slidepdf.com/reader/full/saturn-v-launch-vehicle-flight-evaluation-report-as-509-apollo-14-mission 28/254

8/7/2019 Saturn V Launch Vehicle Flight Evaluation Report - AS-509 Apollo 14 Mission
http://slidepdf.com/reader/full/saturn-v-launch-vehicle-flight-evaluation-report-as-509-apollo-14-mission 29/254

8/7/2019 Saturn V Launch Vehicle Flight Evaluation Report - AS-509 Apollo 14 Mission
http://slidepdf.com/reader/full/saturn-v-launch-vehicle-flight-evaluation-report-as-509-apollo-14-mission 30/254

8/7/2019 Saturn V Launch Vehicle Flight Evaluation Report - AS-509 Apollo 14 Mission
http://slidepdf.com/reader/full/saturn-v-launch-vehicle-flight-evaluation-report-as-509-apollo-14-mission 31/254

8/7/2019 Saturn V Launch Vehicle Flight Evaluation Report - AS-509 Apollo 14 Mission
http://slidepdf.com/reader/full/saturn-v-launch-vehicle-flight-evaluation-report-as-509-apollo-14-mission 32/254

8/7/2019 Saturn V Launch Vehicle Flight Evaluation Report - AS-509 Apollo 14 Mission
http://slidepdf.com/reader/full/saturn-v-launch-vehicle-flight-evaluation-report-as-509-apollo-14-mission 33/254

8/7/2019 Saturn V Launch Vehicle Flight Evaluation Report - AS-509 Apollo 14 Mission
http://slidepdf.com/reader/full/saturn-v-launch-vehicle-flight-evaluation-report-as-509-apollo-14-mission 34/254

8/7/2019 Saturn V Launch Vehicle Flight Evaluation Report - AS-509 Apollo 14 Mission
http://slidepdf.com/reader/full/saturn-v-launch-vehicle-flight-evaluation-report-as-509-apollo-14-mission 35/254

8/7/2019 Saturn V Launch Vehicle Flight Evaluation Report - AS-509 Apollo 14 Mission
http://slidepdf.com/reader/full/saturn-v-launch-vehicle-flight-evaluation-report-as-509-apollo-14-mission 36/254

8/7/2019 Saturn V Launch Vehicle Flight Evaluation Report - AS-509 Apollo 14 Mission
http://slidepdf.com/reader/full/saturn-v-launch-vehicle-flight-evaluation-report-as-509-apollo-14-mission 37/254

8/7/2019 Saturn V Launch Vehicle Flight Evaluation Report - AS-509 Apollo 14 Mission
http://slidepdf.com/reader/full/saturn-v-launch-vehicle-flight-evaluation-report-as-509-apollo-14-mission 38/254

8/7/2019 Saturn V Launch Vehicle Flight Evaluation Report - AS-509 Apollo 14 Mission
http://slidepdf.com/reader/full/saturn-v-launch-vehicle-flight-evaluation-report-as-509-apollo-14-mission 39/254

8/7/2019 Saturn V Launch Vehicle Flight Evaluation Report - AS-509 Apollo 14 Mission
http://slidepdf.com/reader/full/saturn-v-launch-vehicle-flight-evaluation-report-as-509-apollo-14-mission 40/254

8/7/2019 Saturn V Launch Vehicle Flight Evaluation Report - AS-509 Apollo 14 Mission
http://slidepdf.com/reader/full/saturn-v-launch-vehicle-flight-evaluation-report-as-509-apollo-14-mission 41/254

8/7/2019 Saturn V Launch Vehicle Flight Evaluation Report - AS-509 Apollo 14 Mission
http://slidepdf.com/reader/full/saturn-v-launch-vehicle-flight-evaluation-report-as-509-apollo-14-mission 42/254

8/7/2019 Saturn V Launch Vehicle Flight Evaluation Report - AS-509 Apollo 14 Mission
http://slidepdf.com/reader/full/saturn-v-launch-vehicle-flight-evaluation-report-as-509-apollo-14-mission 43/254

8/7/2019 Saturn V Launch Vehicle Flight Evaluation Report - AS-509 Apollo 14 Mission
http://slidepdf.com/reader/full/saturn-v-launch-vehicle-flight-evaluation-report-as-509-apollo-14-mission 44/254

8/7/2019 Saturn V Launch Vehicle Flight Evaluation Report - AS-509 Apollo 14 Mission
http://slidepdf.com/reader/full/saturn-v-launch-vehicle-flight-evaluation-report-as-509-apollo-14-mission 45/254

8/7/2019 Saturn V Launch Vehicle Flight Evaluation Report - AS-509 Apollo 14 Mission
http://slidepdf.com/reader/full/saturn-v-launch-vehicle-flight-evaluation-report-as-509-apollo-14-mission 46/254

8/7/2019 Saturn V Launch Vehicle Flight Evaluation Report - AS-509 Apollo 14 Mission
http://slidepdf.com/reader/full/saturn-v-launch-vehicle-flight-evaluation-report-as-509-apollo-14-mission 47/254

8/7/2019 Saturn V Launch Vehicle Flight Evaluation Report - AS-509 Apollo 14 Mission
http://slidepdf.com/reader/full/saturn-v-launch-vehicle-flight-evaluation-report-as-509-apollo-14-mission 48/254
8/7/2019 Saturn V Launch Vehicle Flight Evaluation Report - AS-509 Apollo 14 Mission
http://slidepdf.com/reader/full/saturn-v-launch-vehicle-flight-evaluation-report-as-509-apollo-14-mission 49/254

8/7/2019 Saturn V Launch Vehicle Flight Evaluation Report - AS-509 Apollo 14 Mission
http://slidepdf.com/reader/full/saturn-v-launch-vehicle-flight-evaluation-report-as-509-apollo-14-mission 50/254

8/7/2019 Saturn V Launch Vehicle Flight Evaluation Report - AS-509 Apollo 14 Mission
http://slidepdf.com/reader/full/saturn-v-launch-vehicle-flight-evaluation-report-as-509-apollo-14-mission 51/254

8/7/2019 Saturn V Launch Vehicle Flight Evaluation Report - AS-509 Apollo 14 Mission
http://slidepdf.com/reader/full/saturn-v-launch-vehicle-flight-evaluation-report-as-509-apollo-14-mission 52/254
8/7/2019 Saturn V Launch Vehicle Flight Evaluation Report - AS-509 Apollo 14 Mission
http://slidepdf.com/reader/full/saturn-v-launch-vehicle-flight-evaluation-report-as-509-apollo-14-mission 53/254

8/7/2019 Saturn V Launch Vehicle Flight Evaluation Report - AS-509 Apollo 14 Mission
http://slidepdf.com/reader/full/saturn-v-launch-vehicle-flight-evaluation-report-as-509-apollo-14-mission 54/254

8/7/2019 Saturn V Launch Vehicle Flight Evaluation Report - AS-509 Apollo 14 Mission
http://slidepdf.com/reader/full/saturn-v-launch-vehicle-flight-evaluation-report-as-509-apollo-14-mission 55/254

8/7/2019 Saturn V Launch Vehicle Flight Evaluation Report - AS-509 Apollo 14 Mission
http://slidepdf.com/reader/full/saturn-v-launch-vehicle-flight-evaluation-report-as-509-apollo-14-mission 56/254

8/7/2019 Saturn V Launch Vehicle Flight Evaluation Report - AS-509 Apollo 14 Mission
http://slidepdf.com/reader/full/saturn-v-launch-vehicle-flight-evaluation-report-as-509-apollo-14-mission 57/254

8/7/2019 Saturn V Launch Vehicle Flight Evaluation Report - AS-509 Apollo 14 Mission
http://slidepdf.com/reader/full/saturn-v-launch-vehicle-flight-evaluation-report-as-509-apollo-14-mission 58/254

8/7/2019 Saturn V Launch Vehicle Flight Evaluation Report - AS-509 Apollo 14 Mission
http://slidepdf.com/reader/full/saturn-v-launch-vehicle-flight-evaluation-report-as-509-apollo-14-mission 59/254
8/7/2019 Saturn V Launch Vehicle Flight Evaluation Report - AS-509 Apollo 14 Mission
http://slidepdf.com/reader/full/saturn-v-launch-vehicle-flight-evaluation-report-as-509-apollo-14-mission 60/254

8/7/2019 Saturn V Launch Vehicle Flight Evaluation Report - AS-509 Apollo 14 Mission
http://slidepdf.com/reader/full/saturn-v-launch-vehicle-flight-evaluation-report-as-509-apollo-14-mission 61/254
8/7/2019 Saturn V Launch Vehicle Flight Evaluation Report - AS-509 Apollo 14 Mission
http://slidepdf.com/reader/full/saturn-v-launch-vehicle-flight-evaluation-report-as-509-apollo-14-mission 62/254

8/7/2019 Saturn V Launch Vehicle Flight Evaluation Report - AS-509 Apollo 14 Mission
http://slidepdf.com/reader/full/saturn-v-launch-vehicle-flight-evaluation-report-as-509-apollo-14-mission 63/254

8/7/2019 Saturn V Launch Vehicle Flight Evaluation Report - AS-509 Apollo 14 Mission
http://slidepdf.com/reader/full/saturn-v-launch-vehicle-flight-evaluation-report-as-509-apollo-14-mission 64/254

8/7/2019 Saturn V Launch Vehicle Flight Evaluation Report - AS-509 Apollo 14 Mission
http://slidepdf.com/reader/full/saturn-v-launch-vehicle-flight-evaluation-report-as-509-apollo-14-mission 65/254

8/7/2019 Saturn V Launch Vehicle Flight Evaluation Report - AS-509 Apollo 14 Mission
http://slidepdf.com/reader/full/saturn-v-launch-vehicle-flight-evaluation-report-as-509-apollo-14-mission 66/254
8/7/2019 Saturn V Launch Vehicle Flight Evaluation Report - AS-509 Apollo 14 Mission
http://slidepdf.com/reader/full/saturn-v-launch-vehicle-flight-evaluation-report-as-509-apollo-14-mission 67/254

8/7/2019 Saturn V Launch Vehicle Flight Evaluation Report - AS-509 Apollo 14 Mission
http://slidepdf.com/reader/full/saturn-v-launch-vehicle-flight-evaluation-report-as-509-apollo-14-mission 68/254

8/7/2019 Saturn V Launch Vehicle Flight Evaluation Report - AS-509 Apollo 14 Mission
http://slidepdf.com/reader/full/saturn-v-launch-vehicle-flight-evaluation-report-as-509-apollo-14-mission 69/254

8/7/2019 Saturn V Launch Vehicle Flight Evaluation Report - AS-509 Apollo 14 Mission
http://slidepdf.com/reader/full/saturn-v-launch-vehicle-flight-evaluation-report-as-509-apollo-14-mission 70/254

8/7/2019 Saturn V Launch Vehicle Flight Evaluation Report - AS-509 Apollo 14 Mission
http://slidepdf.com/reader/full/saturn-v-launch-vehicle-flight-evaluation-report-as-509-apollo-14-mission 71/254

8/7/2019 Saturn V Launch Vehicle Flight Evaluation Report - AS-509 Apollo 14 Mission
http://slidepdf.com/reader/full/saturn-v-launch-vehicle-flight-evaluation-report-as-509-apollo-14-mission 72/254

8/7/2019 Saturn V Launch Vehicle Flight Evaluation Report - AS-509 Apollo 14 Mission
http://slidepdf.com/reader/full/saturn-v-launch-vehicle-flight-evaluation-report-as-509-apollo-14-mission 73/254
8/7/2019 Saturn V Launch Vehicle Flight Evaluation Report - AS-509 Apollo 14 Mission
http://slidepdf.com/reader/full/saturn-v-launch-vehicle-flight-evaluation-report-as-509-apollo-14-mission 74/254

8/7/2019 Saturn V Launch Vehicle Flight Evaluation Report - AS-509 Apollo 14 Mission
http://slidepdf.com/reader/full/saturn-v-launch-vehicle-flight-evaluation-report-as-509-apollo-14-mission 75/254

8/7/2019 Saturn V Launch Vehicle Flight Evaluation Report - AS-509 Apollo 14 Mission
http://slidepdf.com/reader/full/saturn-v-launch-vehicle-flight-evaluation-report-as-509-apollo-14-mission 76/254
8/7/2019 Saturn V Launch Vehicle Flight Evaluation Report - AS-509 Apollo 14 Mission
http://slidepdf.com/reader/full/saturn-v-launch-vehicle-flight-evaluation-report-as-509-apollo-14-mission 77/254
8/7/2019 Saturn V Launch Vehicle Flight Evaluation Report - AS-509 Apollo 14 Mission
http://slidepdf.com/reader/full/saturn-v-launch-vehicle-flight-evaluation-report-as-509-apollo-14-mission 78/254

8/7/2019 Saturn V Launch Vehicle Flight Evaluation Report - AS-509 Apollo 14 Mission
http://slidepdf.com/reader/full/saturn-v-launch-vehicle-flight-evaluation-report-as-509-apollo-14-mission 79/254

8/7/2019 Saturn V Launch Vehicle Flight Evaluation Report - AS-509 Apollo 14 Mission
http://slidepdf.com/reader/full/saturn-v-launch-vehicle-flight-evaluation-report-as-509-apollo-14-mission 80/254

8/7/2019 Saturn V Launch Vehicle Flight Evaluation Report - AS-509 Apollo 14 Mission
http://slidepdf.com/reader/full/saturn-v-launch-vehicle-flight-evaluation-report-as-509-apollo-14-mission 81/254

8/7/2019 Saturn V Launch Vehicle Flight Evaluation Report - AS-509 Apollo 14 Mission
http://slidepdf.com/reader/full/saturn-v-launch-vehicle-flight-evaluation-report-as-509-apollo-14-mission 82/254
,
/POTERT IOCnER
ORIFICE\
;gr” SEM lEAK AtE (E: PILOT VALV EFRDlr LH2 OR LOX PRES S.
SEMI= L I# STS TE# C.O. OISCWRECT\ \I
. w-v. e- __--..-
VE ylll ii-i&; LIME (Pt)
_- ._----I! Ii fli.JER BELLOWS (B)
\ BIRS IIE6ilUTOR~CKouT~ FtWcw6ER
R- tiEED(PI) LIllL PESSRE
Figure 6-g. S-II LOX lank Pressurization Regulator
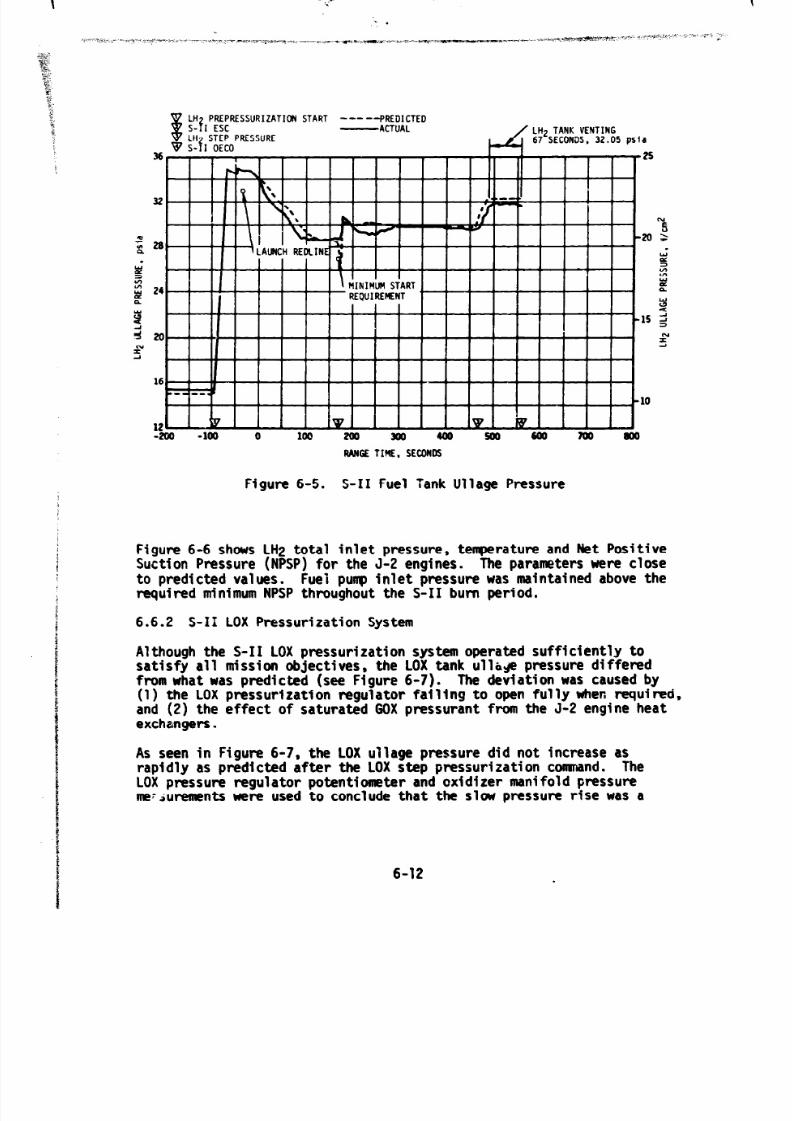
Though the ullage pressure was lower than predicted, it was sufficient tomeet NPSP requirements except for the final 0.5 second of winstage
which is to be expected.34.4 psia. At cutoff, the ullage pressure had decayed to
LOX engine inlet total pressure, tew-ature and WSP are presented inFigure 6-10 fcr the S-II bum phase.
6.7 S-II PNEUMATIC CONTROL PRESSURE SYSTEM
The pneumatic control system functioned satisfactorily throughout theS-ICand S-II boost periods. Bottle pressure was 30% psia at -30 seconds anddue to normal valve activities during S-II burns decayed to approxietately2640 psia after S-II OECO.
Regulator outlet pressure during flight remined at a constant 710 psia,except for the expected momntary pressure drops when the recirculationor prevalves were actuated closed just after engine start, at CECO andOECO.
6-16

8/7/2019 Saturn V Launch Vehicle Flight Evaluation Report - AS-509 Apollo 14 Mission
http://slidepdf.com/reader/full/saturn-v-launch-vehicle-flight-evaluation-report-as-509-apollo-14-mission 83/254
v S-II ESCv LOX STCP PRESSURIZATION
v S-II EMR SHIFTBS-II OECO
----- PREDICTED
VS-II CECOACTUAL
--we MINIMUMNPSPREQUIREMENT
30
-288
0”- -290
:s -292Lisc-294
z“-2965
Figum 6-10. S-II LOX Punp Inlet ConditSons
6-17

8/7/2019 Saturn V Launch Vehicle Flight Evaluation Report - AS-509 Apollo 14 Mission
http://slidepdf.com/reader/full/saturn-v-launch-vehicle-flight-evaluation-report-as-509-apollo-14-mission 84/254
6.8 5-11 i!ELiUM INJECTIOr\i SYSTEFi
lhe performance of the helium injection system was satisfactory. Thesupply bott le YES pressurized to 3010 psia prior to liftoff and by ESLthe pressure was 1730 psia as compared to 730 psia at S-II-8 ESC. Thepressure at ESC was higher for S-11-9 dye to +.he addjtion of another
1.5 ft3 supply bottle to the helium injecticn system for servicing thecenter engine feed1 ine accumulator. Helium injection average total flow-rate during supply bottl e blowdown (-30 to 163 seconds) was 65 SCFM.
6.9 Pi3GO SUPPRESSIOV SYSTEM
A center engine LOX feedline accumulator was installed for the ti;-,sttime on this flicjht as a +OGO supp:ession device. Propulsion/structuralanalysis indicates that the accumulator did suppress the S-II BOG0oscillations. See paragraph 8.2.3 for complete derails. A schematiccf the POGO suppresslL in system is shown in Figure 6-11.
Figure 6-11. S-II LOX Center Engine Feedline Kccmulator and HeliumInjection System
6-18

8/7/2019 Saturn V Launch Vehicle Flight Evaluation Report - AS-509 Apollo 14 Mission
http://slidepdf.com/reader/full/saturn-v-launch-vehicle-flight-evaluation-report-as-509-apollo-14-mission 85/254
The accumulator bleed system must maintain subcooled LOX in the accumulatorthrough S-!C boost and S-II engine start. This requirement is accom-plished by LOX flowing through a 3/4-inch line from the top of the accumu-lator to the center engine LOX recirculation return line. Thai-e is alsoa Shutoff valve in this bleed line that is used to terminate the bleedflow 1.0 second prior to S-II engine start. Figure 6-12 shows therequired accumulator temperature at S-II engine start, the predictedtemperatures during S-IC boost, and the actual temperatures experiencedduring the AS-509 flight. As can be seen, the maximum allowable tempera-ture of -2C1.5"F at engine sta;-t was more than adequately met (-294.5"F).
The accumulator fil l system is required to displace the LOX in the accumu-lator with helium soon after engine start. The accumulator fil l must becompleted in 5 to ;7 seconds after its init iation and must be maintaineduntil CECO. This is accomplished by opening two parallel scllenoid valves(one at engine start plus 4.1 seconds and the other engine start plus4.3 seconds) and initia ting a helium flow of 0.0045 to 0.0060 lbm/s fromtwo 1.5 ft3 bottles (pressurized to 2800 to 3100 psia prior to LOX heliuminjection), through a regulator, and then into the accumulator. This flowis terminated at CECO by closing the two fi ll solenoids.
I rdxIpcM ALLO&LE AT ESC[
I I A-: AmJN FLiWT PERWMCE(ALL 3 ACLUWLATOR TEWERATURES)
*
1 1 I I II
w I I I I I I Iw _^A
110
105
loo .'
2zs
95 fj
90
05
-200 -1OG 0 loo LUU
RANGE TIK E. SECONDS
Figure 6-12. S-II Center Engine LOX Feedline AccumulatorBleed System Performance
5-19

8/7/2019 Saturn V Launch Vehicle Flight Evaluation Report - AS-509 Apollo 14 Mission
http://slidepdf.com/reader/full/saturn-v-launch-vehicle-flight-evaluation-report-as-509-apollo-14-mission 86/254
Figure 6-13 shows accumulator LOX level versus time during the filltransient as determined from the time the three accumulator temperatureprobes indicated dry. Based on these data, the accumulator was full ofhelium 6.3 seconds after the start of fill, thus meeting the 5 to 7 secondfill time requirement. After the accumulator was filled with helium (justafter engine start), it remained in that state until CECO when the heliumflow was terminated and LOX backed up into the accumulator due to the post-CECC) feedline pressure buildup. There was no sloshing or abnormal liquidlevel behavior observed in the accumulator while the center engine wasoperating. Figure 6-14 shows the performance of the helium supply portionof the acculmulator fill system.
6.10 S-II HYDFMJLIC SYSTEM
S-II hydraulic system performance was normal throughout the flight.System supply and return pressures, reservoir volumes, and system fluidter;rperatures were within predicted ranges. All servoactuators respondedto comMnds with good precision. The maximum engine deflection was
TIK m START OF ACCUUATOR FIU. SECONDSIK m START OF ACCUUATOR FIU. SECONDS
Figure 6-13. S-Ii Center Engine LOX Feedline Accunwrlator Fill Transient
6-20

8/7/2019 Saturn V Launch Vehicle Flight Evaluation Report - AS-509 Apollo 14 Mission
http://slidepdf.com/reader/full/saturn-v-launch-vehicle-flight-evaluation-report-as-509-apollo-14-mission 87/254
v LMBILICAL LINE VEN T 0 s-11 CEWtp WELIln INJE CTIO )( SW0 ACCWJLATOR FILL SLART
fy s-11 OEW-mm - PREDICTICN- ACTUAL
“t- i iI I He’WJEcTfcwRIAAR”
/‘MIFICE IKLf3 PRESSURE
INLET PRESSURE
0 Zoo 300 400 so0
PAHGE TmE . Sfcms
lo
Figure 6-14. S-II Center Engine LOX Feedline Accumulator HeliumSupply System Performance
approximately 1.4 degrees in pitch on engine No. 4 in response to theseparation and engine start transients. Actuator loads were well withindesign limits. The maximum actuator load was approximately 9,700 lbf forthe yaw actuator of engine Na. 1 and occurred during initiation of Itera-tive Guidance Mode (IGM).
There was no evidence of the engine No. 2 system accumulator lockupvalve leakage that was encountered during Flight Readiness Test (FRT)and COOT.
The engine No. 3 accumulator reservoir manifold assembly was replacedprior to launch countdown due to reservoir piston seal leakage. Thereplacement unit performed satisfactorily in countdown and flight.
6-21/6-22

8/7/2019 Saturn V Launch Vehicle Flight Evaluation Report - AS-509 Apollo 14 Mission
http://slidepdf.com/reader/full/saturn-v-launch-vehicle-flight-evaluation-report-as-509-apollo-14-mission 88/254
SECTION 7
S-IVB PROPULSION
7.1 SUMKARY
The J-Z engine operated satisfactorily throughout the operational phaseof first and second burn and had normal shutdowns. S-IVB first burntimewas 1~7.2 seconds which was 4.1 seconds less than predicted. Approxi-m ': *' 2.4 seconds of the shorter burntime can be attributed to higherS-. performance. The remainder can be attributed to the S-IC and S-IIstage performance and the change in the flight azimuth. The engine
performance during first burn, as determined from standard altitudereconstruction analysis, deviated from the predicted Start Tank Dis-charge Valve (STDV) open +130-second time slice by 1.48 percent forthrust and 0.14 percent for specific impulse. The higher than predictedperformance can be attributed primarily to a decrease in gas generatorsystem resistance. The S-IVB stage first burn En ine C&off (ECO) wasinitiated by the Launch Vehicle Digital Computer 9LVDC) at 700.56 seconds.
The Continuous Vent System (CVS) adequately regulated LH2 tank ullagepressure at an average level of 19.2 psia during orbit, and the Oxygen/Hydrogen (02/H2) burner satisfactorily achieved LH2 and LOX tank repres-surization for restart. Engine restart conditions were within specified
limits. The restart at full open Propellant Utilization (PU) valve posi-tion was successful.
S-IVB second burntime was 350.8 seconds which was 5.5 seconds less thanpredicted. The engine performance during second bum, as determined fromthe standard altitude reconstruction analysis, deviated from the pre-dicted STDV +2OO-second time slice by 1.57 percent for thrust and0.14 percent for specific impulse. The higher than predicted per'ormanceis attributed to the same reason as for first bum. Second burn EC0 wasinitiated by the LVDC at 9263.24 seconds (02:34:23.24).
A small shift in LOX chilldown flowrate and pump differential pressureobserved during boost has been determined to be due to vehicle-inducedlongitudinal dynamics.
Subsequent to second burn, the stage propellant tanks and.helium sphereswere safed satisfactorily. Sufficient impulse was derived from LOX dump,LH CVS operation and Auxiliary Propulsion System (APS) ullage burn toac ieve a successful lunar impact within the planned target area.
7-1

8/7/2019 Saturn V Launch Vehicle Flight Evaluation Report - AS-509 Apollo 14 Mission
http://slidepdf.com/reader/full/saturn-v-launch-vehicle-flight-evaluation-report-as-509-apollo-14-mission 89/254
The APS pressurization system performed nominally throughout the flightexcept for a helium leak in Module No. 1 from 5 to 7 hours. The averageleakage was about 70 Standard Cubi: Inches/Minute (SCIM). The magnitudeand duration of this leak was not large enough to present any problems.
The S-IVB hydraulic system performance was satisfactory during the entiremission.
7.2 S-IV6 CHILLDOWN AND BUILDUP TRANSIENT PERFORMANCE FOR FIZST BURN
The thrust chamber temperature at launch was well below the maximumallowable redline limit of -133°F.Command (ESC), the temperature was
At S-IVB first burn Engine Start-141°F. which was within the require-
ment of -189.6 fllO"F.
The chilldown and loading of the engine Gaseous Hydrogen (GH2) start tankand pneumatic control bottle prior to liftoff was satisfactory.
A 40 minute hold for adverse weather conditions occurred during terminalcount. A countdown recycle was avoided by utilizing the start tankrechill sequence which was developed during the AS-509 Countdown Demon-stration Test (CDDT). When the count was picked up (at -482 seconds) thestart tank vent and supply valves were opened, allowing cold flow throughthe tank. Adequate chilldown was achieved in 93 seconds, and starttank conditions were well within acceptable limits at liftoff. The enginecontrol sphere was vented three times during hold to maintain acceptablepressure levels.
The engine control sphere pressure and temperature at liftoff were 3040 psand -165°F. At first burn ESC the start tank conditions were within the
required region of 1>25 *75 psia and -170 230°F for start. The dischargewas completed and the refill initiated at first burn ESC +3.8 seconds.The refill was satisfactory and in good agreement with the acceptancetest.
ia
The propellant recirculation systems operation, which was continuous frombefore liftoff until just prior to first ECS, was satisfactory. Start andrun box requirements for both fuel and LOX were met, a5 shown in Figure 7-1.At first ESC the L3X pump inlet tenperatrrre was -295.5"F a;ld the LH2 pump,inlet temperature was -421.8"F. A small downward shSft in LOX chilldmflowrate and pump delta P, observed from approximately 124 to 174 secondsduring boost, has been determined to be due to vehicle-induced longitudinal
dynamics. This response was noted during pump qualification vibrationtesting and is not considered a problem.
The first burn start transient was satisfactory. The thrust buildup waswithin the established limits. This buildup was similar to the thrustbuildups observed on AS-506 through AS-508. The Mixture Ratio Control (MRC)
7-2

8/7/2019 Saturn V Launch Vehicle Flight Evaluation Report - AS-509 Apollo 14 Mission
http://slidepdf.com/reader/full/saturn-v-launch-vehicle-flight-evaluation-report-as-509-apollo-14-mission 90/254
LOX PIMP INLET TOTAL PRESSURE, N/an*
-28Or "25 30
I I I 1 1
ITEM TIME FROMESC, SEC
I
35-rr100
I Ii 50 55LOX PW INLET TOTAL PRESSURE, psia
FML PW INLET TOTAL PESSURE, M/an2
FUEL PWP INLET TOTAL PRESSURE,psfa
Figure 7-l. S-ii% Start Box and Run Requirements - First gum
7-3

8/7/2019 Saturn V Launch Vehicle Flight Evaluation Report - AS-509 Apollo 14 Mission
http://slidepdf.com/reader/full/saturn-v-launch-vehicle-flight-evaluation-report-as-509-apollo-14-mission 91/254
valve was in the closed position prior to first start and performanceindicates it remained closed during first burn. The total impulse fromSTDV open to STDY open t2.E seconds was 193,080 lbf-s for first start.
First burn fuel lead followed the predicted pattern and resulted insatisfactory conditions as indicated by the thrust chamber temperaturesand the associated fuel injector temperatures.
7.3 S-IVB MAINSTAGE PERFORMANCE FOR FIRST BURN
The propulsion reconstruction analysis showed that the stage performanceduring mainstage operation was satisfactory. A comparison of predictedand actual performance of thrust, specific impulse, total flowrate, andHixture Ratio (MR) versus time is shown in Figure 7-2. Table 7-l showsthe thrust, specific impulse. flowrates and MR deviations from the pre-dicted at the STDV +130-second time slice.
A mixture ratio control valve setting 2 degrees higher than predictedwould correspond to the observed thrust but not the observed mixture
~ ratio. Reconstructed propellant ratic usage indicates that the MRprofile was very n&r tb p&?dicted. .%.hetatorce-, CM &k&J. .~~r'.forrl#ricc .at the predicted mixture ratio can be attributed primarily to a decreasein gas generator system resistance.
The performance of the J-2 engine helium control system was satisfactoryduring mainstage operation. The engine control bottle was connected tothe stage ambient repressurization bottles, therefore, there was littlepressure decay. Helium usage is estimated as 0.30 lbm during first burn.
7.4 S-IVB SHUTDOWN TRANSIENT PERFORMANCE FOR FIRST BURN
S-IVB EC0 was initiated at 700.56 seconds by a guidance velocity cutoffcommand which resulted in a 4.1-second less than predicted burntime.Approximately 2.4 seconds of the shorter burntime can be attributedto higher S-IVB performance. The remainder can be attributed to S-ICand S-II stage performance 2nd the change in flight azimuth.
The EC0 transient was satisfactory. The total cutcff impulse to zeropercent,of rated thrust was 44,300 lbf-s which was 172i lbf-s lowerthan-predicted. Cutoff occurred with the MRC valve in the 5.0 position.
7.5 S-IVB PARKING ORBIT COAST PHASE CONDITIONING
The LH2 CVS performed satisfactorily, maintaining the fuel tank ullagepressure at an average level of 19.2 psia. This was well within thei8 to 21 psia band of the inflight specifi,ation.
7-4

8/7/2019 Saturn V Launch Vehicle Flight Evaluation Report - AS-509 Apollo 14 Mission
http://slidepdf.com/reader/full/saturn-v-launch-vehicle-flight-evaluation-report-as-509-apollo-14-mission 92/254
v S-IVB FIRST ESC - ACTUALW S-IVB FIRST EC0 ---- PREDICTED
--- -- --200' To I -900
_--- --1---- ----.----I-------- - 850
180. ,800
420
410400
500
490
480
470
460
450
4 ;
4.0
225
220
215
210
205
TIM FldDMSTDV + 2.5 SECONDS
560 580 600 620 640 660 680 700RANGETIME, SECONDS
Figure 7-2. S-IVB Steady-State Performance - First Burn
7-5

8/7/2019 Saturn V Launch Vehicle Flight Evaluation Report - AS-509 Apollo 14 Mission
http://slidepdf.com/reader/full/saturn-v-launch-vehicle-flight-evaluation-report-as-509-apollo-14-mission 93/254
Table 7-l. S-IV5 Steady-State Performance - First Bum(STDV +130-Second Time Slice at Standard Altitude Conditions)
--
"ERCENTFLIGHT DEVIATION
PARAMETER FREDiCTED RECONSTRUCTION DEVIATION FROM PREDICTED
Thrust, lbf 198,627 201,572 2945 1.483
Specific !mpul;e,lbf-s/lbm 426.5 427.1 0.6 0.141
-0X Flowrate,lbm/s 386.78 392.14 5.36 1.386
-uel Flowrate,lbm/S 78.95 79.80 0.85 1.077
Engine Mixture
* 4.914 .Q.306
The continuous vent regulator was activated at 759.7 seconds and wasterminated at 8376.3 seconds. The US performance is shown in Figure 7-3.
The thrust between 5400 seconds and the end of CVS operation was abovethe predicted laBgel because the orbital heat input was higher thanexpected.
Calculations b.?sed on estimated temperatures indicate that the massvented during parking orbit ~a.5 1935 lbm and that the boiloff mass was2242 lbm.
7.6 S-IVB CHILLDOWN AND BUILDUP TRANSIENT PERFORMANCE FOR SECOND BURN
Repressurization of the LOX and LH2 tanks was satisfactorily accomplishedby the 02/H2 burner. Helium heater "ON" command was initiated at5376.1 seconds. The LH2 repressurization control valves were opened atburner "ON" 6.1 seconds and the fuel tank was repressurized from 19.2 to30.5 psia i,l 186 seconds. There were 25.9 lbm of cold helium used torepressurize the LH2 tank. The LOX repressurization control valves wereope?sd at i urner "ON"' 6.3 seconds and the LOX tank was repressurized from35.8 to 39.8 psia in 152 seconds. There were 4.7 lbm of helium used toreoressurize the LOX tank. LH:, and LOX ;rll-aoe pressures are shown inFigure 7-4. The burner contin;ed to operate-for a total of 454.9 secondsprovid ing nominal prope 1 lant settling forces. The performance of theAS-509 Op/H2 burner was satisfactory as shown in Figure 7-5.
7-6

8/7/2019 Saturn V Launch Vehicle Flight Evaluation Report - AS-509 Apollo 14 Mission
http://slidepdf.com/reader/full/saturn-v-launch-vehicle-flight-evaluation-report-as-509-apollo-14-mission 94/254
RANGE TIME, loo0 SECONDS
Qc 4
0:w:w 0:3o:w 1:Oo:w 1:30:00 2:w:w 2:3O:w
RANGE TM. HOURS:Ml~JlEf:SECONDS
Figure 7-3. S-M CVS Performance - Coast Phase
The S-IN LOX recirculation system satisfactorily provided conditionedoxidizer to the J-2 engine for restart. The LOX and fuel pump inletconditions are plotted in the start and run boxes in Figure 7-6. Atsecond ESC, the LOX and fuel pump inlet temperatures were -294.9"F and-419.6"F, respectively. Fuel recirculation system performance wasadequate and conditions at the pump inlet weie satisfactory at secondSTDV open. Second burn fuel lead generally followed the predictedpattern and resulted in satisfactory conditions as indicated by thrustchamber temperature and the associated fuel injector temperature. SinceJ-2 start system performance was nominal during coast and restart, nohelium recharge was required from the LOX ambient repressurizationsystem (bottle No. 2). The start tank performed satisfactorily duringsecond burn blowdown and recharge sequence. The engine start tank wasrecharged properly and maintained sufficient pressure during coast. Theengine co:rtrol sphere first burn gas usage was as predicted; the ambienthelium sly!yeres recharged the control sphere to a nominal level forrestart.
7-7

8/7/2019 Saturn V Launch Vehicle Flight Evaluation Report - AS-509 Apollo 14 Mission
http://slidepdf.com/reader/full/saturn-v-launch-vehicle-flight-evaluation-report-as-509-apollo-14-mission 95/254
f
Oz/Hz BURNER ONLW AND LOX CRYOGE NIC REPRtSS VALVES OPENTEMINATIO N OF LOX TANK APRLSSTERC(INATlON OF LH2 TANK EPNfSS
vDp/tI2 WANNER OFF; .
d-30 “*.,
PREDICTED MAxIMU
PAEDICTED MINIMW
I I I I I12424
PREDICTED RINIMIM
-1616
-m-e* 1212
x I I I I I II5S, I I I I I I-100100 0 10000 20000 30000 40000 SD0D0
TIM E FROH 02/H2 BURIER STA RT. SECDNDS 6 i!VE FROM 3,/Hp OURNEQ STAR T. SECONDS
, WV v ,02:ld:OO D2:20:00 52,22:03 02:2b:W 02:26:00 02:28:00
RANGE TInE. !~OURS:M~NUTES:SECONOS
Figure 7-4. S-IVB Ullage Conditions During Figure 7-5. S-IVB 02/H2 Burner Thrust andRepressurization Using 02/H2 Burner Pressurant Flowrate
v $(.tVER TPRTOWAN0v th' AND LO1 iANK ‘1fi’RESSs 'VALVFS OPLNv T~WNATION OF LOX TANK IEPPLSSv lk+!lNAlIW OF LlC2 T&K REPRLSSV BUNfR CUTOFF
O.LOtI
,oI
i
0.15 bb
8’ 0.10 -. -0.050 3’5 ; ,’ ;35 4
; N 0.05 ’‘trz
I
3. - .o
0.04'0 ..0.015 2E <
3"
0.03 - /-,ztl,
e'J , ~.O.O lO.02 - 2- -- _.____2 ;
8 7. .v v v ,32:16:30 J2:20:00 02:22:00 32:24:00 !J2:26 :00 02:2a 00

8/7/2019 Saturn V Launch Vehicle Flight Evaluation Report - AS-509 Apollo 14 Mission
http://slidepdf.com/reader/full/saturn-v-launch-vehicle-flight-evaluation-report-as-509-apollo-14-mission 96/254
LOX PIMP INLET TOTAL FRESSURE,N/m2
20 25-28o !TEM TIt!E FROM SECOND
LA.0 ESC. SEC -T-Tl'ooxI1 0
2 8: 20000
5 3096 EC0
I-
Y -290 -r
2
- F
5-295
-“0*+--y .
(STDV) 198 ‘1-- II !ii
lg6 2RW BOX1 p
/ !
1 35 4D 45 SD 55I IIX Dim 7NI FTTIITAI DUFCUIRK nrirC . -- ..RI. .“..B . .---.‘-, r w
FUEL PlMP IKE1 TOTAL PRESSURE, N/cm2
-426,+ ’ 1 1 I I I I J
15 20 25 30 35 40 45 50FUEL PUMP INLET TOTAL PRESSURE, psi a
Figure 7-6. S-IVB Start Box and Run Requirements - Second Burn
7-9
8/7/2019 Saturn V Launch Vehicle Flight Evaluation Report - AS-509 Apollo 14 Mission
http://slidepdf.com/reader/full/saturn-v-launch-vehicle-flight-evaluation-report-as-509-apollo-14-mission 97/254
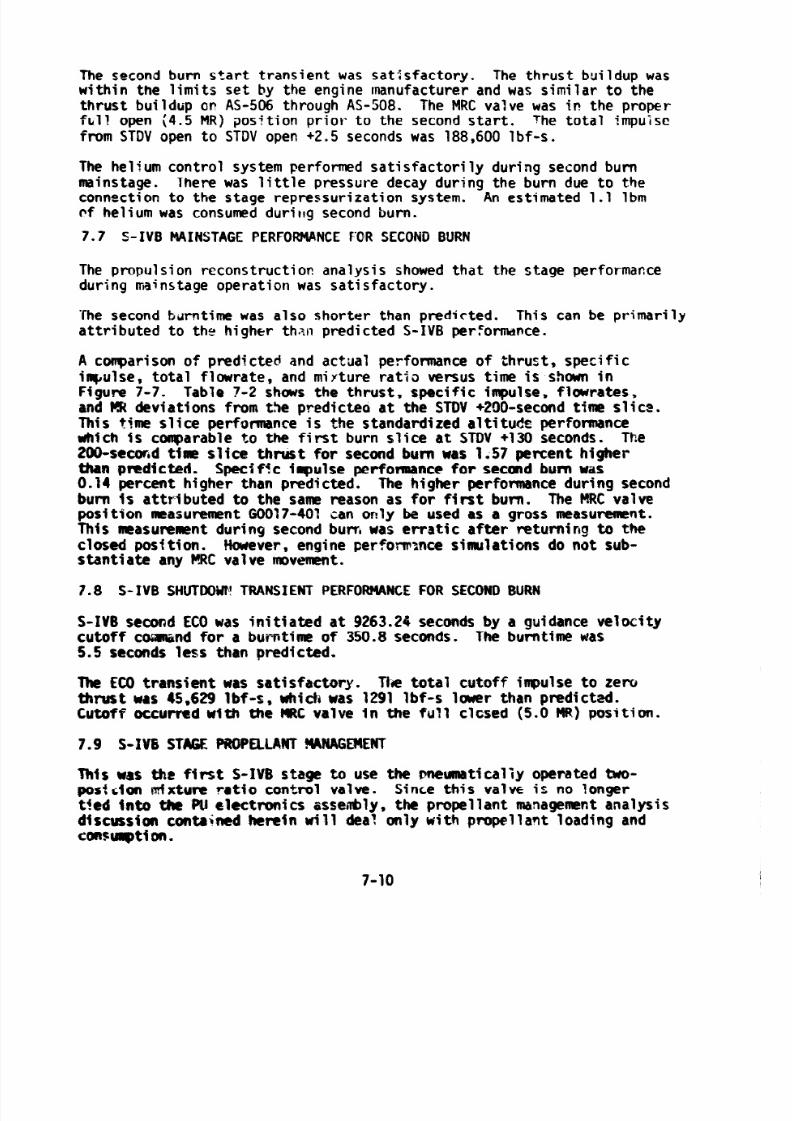
The second burn start transient was satisfactory. The thrust buildup waswithin the limits set by the engine manufacturer and was similar to thethrust buildup on AS-506 through AS-508. The MRC valve was in the properfull open (4.5 MR) position prior to the second start. The total impulsefrom STDV open to STDV open +2.5 seconds was 188,600 lbf-s.
The helium control system performed satisfactorily during second bummainstage. There was little pressure decay during the burn due to theconnection to the stage repressurization system. An estimated 1.1 lbmcf helium was consumed duriug second burn.
7.7 S-IVB WHSTAGE PERFORMANCE FCR SECOND BURN
The propulsion reconstruction analysis showed that the stage performanceduring rainstage operation was satisfactory.
The second ttimtime was also shorter than predicted. This can be primarilyattributed to the higher than predicted S-IVB performance.
A conpari son of predicted and actiral performance of ,thrust, specificiq.ulse, total flowrate, and mirture ratio versus time is shown inFigure 7-7. Table 7-2 shass the thrust, specific impulse, flowrates,and KR deviations from the predicted at the STDV +2!Xksecond time slice.This time slice performance is the standardized altitude performanceuhich is conparable to the first burn slice at STDV +13G seconds. The200-semd tine slice thrUst for second bum was 1;57 percent higherthan predicted. Specif!c inpulse perfomnce for secald bum was0.14 percent higher than predicted. The higher performance during secondbum is attributed to the same reason as for first bum. The MRC valveposition measurement 60017-40 1 can only be used as a gross measurement.This neasumwnt during second bum was erratic after returning to theclosed position. However, engine performance sinrrlations do not sub-stantiate any f!RC valve movement.
7.8 S-IVB SWTIXW TRANSIENT PERFORMANCE fOR SECOND BURN
S-IVB second EC0 was initiated at 9263.24 seconds by a guidance velocitycutoff CCWWK! for a burrntim of 350.8 seconds. The bumtime was5.5 seconds less than predicted.
The EC0 transient was satisfactory. The total cutoff iffpulse to zerothrust was 45,629 lbf-s, which was 1291 lbf-s 1-r than predicted.Cutoff occurred with the 1IRC valve in the full closed (5.0 HR) position.
7.9 S-IVB STAGE PRWELLMT ?WAGEnENT
This was the first 5-M stage to use the Pneumatically operated two-porf~Aarl enfxtun ratio control valve. Since this valve is no longert!cd Into the PU electronics assehly, the propellant mnagenent analysisdlscussion contained herein will dea? only with propellant loading andconsugtion.
7-10

8/7/2019 Saturn V Launch Vehicle Flight Evaluation Report - AS-509 Apollo 14 Mission
http://slidepdf.com/reader/full/saturn-v-launch-vehicle-flight-evaluation-report-as-509-apollo-14-mission 98/254
V S-IVB SECOND ESC- ACTUAL
v S-IVB SECONG EC0 ---- PREDICTED BAND
220200 900
mz180 800 z
.s160 700 !z
2
140 600 '
120
440 43co $s
4230 p
430 4200 idLW
4150 sttg ':420 mz
500c
220
200
180
I I I I I I I I I-
I 1 I I I I I 1
0 50 100 150 200 250 300 350 400TIME FROM STDV +2.5 SECONDS
y 1 1 I v 12:36:00 2:38:00 2:40:00 2:42:00
RANGE TIME, HOURS:MINUTES:SECONDS
Figure 7-7. S-IVB Steady-State Performance - Second Burn
7-11

8/7/2019 Saturn V Launch Vehicle Flight Evaluation Report - AS-509 Apollo 14 Mission
http://slidepdf.com/reader/full/saturn-v-launch-vehicle-flight-evaluation-report-as-509-apollo-14-mission 99/254

8/7/2019 Saturn V Launch Vehicle Flight Evaluation Report - AS-509 Apollo 14 Mission
http://slidepdf.com/reader/full/saturn-v-launch-vehicle-flight-evaluation-report-as-509-apollo-14-mission 100/254
Table 7-3. S-IVB Stage Propellant Mass History
EVEN:I
UNITST
S-IC Liftoff lbm
First S-IVBIgnition lbn
F:rst S-IVBCutoff
lbm
Second S-IVB ,b,,,Ignition
Second S-IVB ,brncutoff
PREOICTED PU INDICATED PU VOLW4ElRIC FLW INTEGR AL BEST ESTIW JE(CORRECTED)
LOX
189.837
189.831
135.583
135.346
1.791
--
L”t LOX L"2 LOX
43.500 189.884 43.531 190.884
43.499 lBg.BB4 43.531 lgO.BB4
32.413 136.375 32.4B3 137.090
30.101 136.145 30.422 l#.WO
2,353 5,664 2,658 5.674
L”2 LOX LH2
43.488 190.473 4396
43.188 190.473 43.544
32,557 lJ.815 32.605
30.315 136,551 30,428
2.648 5,812 2.672
At second ESC +145.5 seconds, the valve was cotnnanded to the closed posi-tion (approximately 5.0 MR) and remained there throughout the remainderof the flight.
7.10 S-IVB PRESSURIZATION SYSTEM
7.10.; S-IVB Fuel Pressurization System
The LH2 pressurization system met all of its operational requirements.The LH2 pressurization system indicated acceptable performance duringprepressurizatiqn, boost, first burn, coast phase, and second burn.
The LH2 tank prepressurization command was received at -96.6 seconds andthe tank pressurized signal was received 12.8 seconds later. Followingthe termination of prepressurization, the ullage pressure reached reliefconditions, approximately 31.6 psia, and remained at that level untilliftoff, as shown in Figure 7-8. A small ullage collapse occurred duringthe first 25 seconds of boost. The ullage pressure returned to the relieflevel by 70 seconds due to self pressurization.
During first burn, the average pressurization flowrate was approximately0.70 lbm/s providing a total flow of 96.4 lbm. All during the burn theullage pressure was at the relief level, as predicted.
'-he LH2 tank was satisfactorily repressurized for restart by the 02/H2burner. The LH2 ullage pressure was 31.0 psia at second burn ESC, asshown in Figure 7-8. The average second burn pressurization flowratewas 0.71 lbm/s until step pressurization when it increased to 1.38 lbm/s.This provided a total flow of 300.9 lbm during second burn. Significantventing during second burn occurred at second ESC +280 seconds when step
7-13

8/7/2019 Saturn V Launch Vehicle Flight Evaluation Report - AS-509 Apollo 14 Mission
http://slidepdf.com/reader/full/saturn-v-launch-vehicle-flight-evaluation-report-as-509-apollo-14-mission 101/254
' INITIATION OF PREPRESSURIZATION8
QOPEN CVSFIRST ESC
v FIRST EC0BCRYOGENIC REPRESSURIZATIOIYBSECOND ESC
35 d-24.--- 1
I-
307
I c
I
-- I 1 1PREDICTED BAND
'-8
-lO 12 3 4 5 6 7 8 9
RANGE TI!4E, 1000 SECONDS
Q
k VJ 1 1 1 1 IxAo:oo:oo 0:30:00 l:OO:oo 1:u):DO 2:00:00 2:3D:OO
RANGE TIME, HOURS:MINUTES:SECONDS
Figure 7-8. S-IV8 LH2 Ullage Pressure - First Burn and Parking Orbit
pressurization was initiated. This behavior was as predicted. The LH2ullage pressure during the second bum EC0 and translunar coast is shownin Figure 7-9. The delayed third prograrrd vent cycle is discussed in
paragraph 7.13.1.
The LH2 pump inlet Net Positive Suction Pressure (NPSP) was calculatedfrom the pump interface temperature and total pressure. These valuesindicated that the NPSP at first burn ESC was 15.9 psi. At the minimumpoint, the NPSP was 7.5 psi above the required value. Throughout the burn,the NPSP had satisfactory agreement with the predicted values. The NPSPat second turn ESC was 5.7 psi which was 1.2 psi above the required value.Figures 7-10 and 7-11 summarize the fuel pump inlet conditions for firstand second bums.
7-14

8/7/2019 Saturn V Launch Vehicle Flight Evaluation Report - AS-509 Apollo 14 Mission
http://slidepdf.com/reader/full/saturn-v-launch-vehicle-flight-evaluation-report-as-509-apollo-14-mission 102/254
f
SLcom EC0
%
CLOSE cvsOPEN CVS CLOSELMCHIffi HPVOPEN LAtCHIffi NPV A~IENT HLLIIJM NPV f
OPEN LATCHING NPV CLOSE CVSCLOSE LATCHING WPV OPEN lAfCHING WVOPEN cvs
25 26 27 28
v ’ L VI L I I I VI 1 I I2:30:00 3:OO:m 3:m:oO 4:OO:Oo 4:M:ml 5:oo:oo 5:30:00 6:00:00 6:30:00 7:00:00 7:30:00 am00
RANGE IME, MWRf:~lRJTEf:fECOMDf
Figure 7-g. S-IVB LH2 Ullage Pressure - Secofid Burn and Translunar Coast

8/7/2019 Saturn V Launch Vehicle Flight Evaluation Report - AS-509 Apollo 14 Mission
http://slidepdf.com/reader/full/saturn-v-launch-vehicle-flight-evaluation-report-as-509-apollo-14-mission 103/254
PI/N 'dSdN 2H1I)'" 'WI55316
13lNl 11101 dYn d hl1, '3w-llV~3dY31
13MI dWfId ZHi
@!%I '3WlSS3Ud 4, '3unlw36131
:3N1 NlOl dYlld hl 13-M dllld 2Hl
2WJlN '38nSS31d 13jN1 1, 'JUnlYU3dH31
WlfN 'dSdN hl 1~101 dYlM I+1 131131 dtind hi,
1Sd 'dSdN 'hl PLG '311M53ad 4" '3L1nlvLl3dc13113111 -Iv101 dnnd hl 13x41 &nd kl
7-16

8/7/2019 Saturn V Launch Vehicle Flight Evaluation Report - AS-509 Apollo 14 Mission
http://slidepdf.com/reader/full/saturn-v-launch-vehicle-flight-evaluation-report-as-509-apollo-14-mission 104/254
7.10.2 S-IVB LOX Pressurization System
LOX tank prepressurization was initiated at -16/ seconds and increasedthe LOX tank ullage pressure from atiient to 40.2 psia within 23 seconds
3s shown in Figure 7-12. Five makup cycles were required to maintainthe LOX tank ullage pressure before the ullage temperature stabilized.At -96 seconds the LOX tank ullage pressure increased from 39.5 to40.4 psia due to fuel tank prepressuritation. The pressure then graduallyincreased to 42 psia at liftoff.
During boost there was a normal rate of ullage pressure decay caused byan acceleration effect and ullage collapse. No makeup cycles occurredbecause of an inhibit until after Time Base 4 (T4). LOX tank ullagepressure was 37.S psia just prior to ESC ar.d was increasing at ESC dueto a makeup cycle.
1 LDX TANK PREPRESSURIZATIDN INITIATED
fS-IVB FIRST ENGINE START COMMANDS-IVB VELOCITY CUTOFF COWiAN
V CRYOGENIC REPRESSURIZATIONINITIATED
50
30
20
10-1 0 1 3 5 7 9
vRANGE.TIME, 1000 SECONDS
IV 1 1 Vc:DD:oD 1 cc:cD 2:cc:oo
RANGETIME, HDURS:MINUTES:SECDNDS
Figure 7-12. S-IVB LOX Tank Ullage Pressure - First Burn and EarthParking Orbit
7-17

8/7/2019 Saturn V Launch Vehicle Flight Evaluation Report - AS-509 Apollo 14 Mission
http://slidepdf.com/reader/full/saturn-v-launch-vehicle-flight-evaluation-report-as-509-apollo-14-mission 105/254
During first burn, five over-control cycles were initiated including theprogramed over-control cycle initiated prior to ESC. The LOX tank pres-surization flowrate variation was 0.24 to 0.29 lbm/s during under-controlsystem operation. This variation is normal and is caused by temperatureeffects. Heat exchanger performance during first bum was satisfactory.
During orbital coast the LOX tank ullage pressure experienced a decaysimilar to that experienced on the AS-507 flight. This decay was withinthe predicted band, and was not a problem.
Repressurization of the LOX tank prior to second burn was required andwas satisfactorily accomplished by the burner. The tank ullage pressurewas 39.8 psia at second ESC and satisfied the engine start requirements.
Pressurization system performance during second burn was satisfactory.
There was one over-control cycle as compared to a predicted of from zeroto one. Helium flowrate varied between 0.31 to 0.39 lbm/s. Heat exchangerperformance was satisfactory.
The LOX NPSP calculated at the interface was 27.2 psi at first bum ESC.The fyPSP decreased after start and reached a minimum value of 24.2 psiat 1 second after ESC. This was 11.4 psi above the required NPSP atthat time. The LOX pump static interface pressure during first bumfollowed the cyclic trends of the LOX tank cllage pressure.
The NPSP calculated at the engine interface was 22.5 psi at second burn
ESC. At all times during second burn, NPSP was above the required level.figures 7-13 and 7-14 summarize the LOX pump conditions for first andsecond burns, respectively. The run requirements for first and secondburns were satisfactorily met.
The cold helium supply was adequate to meet all flight requirements.At first bum ESC the cold helium spheres contained 382 lbm of helium.At the end of second bum, the helium mass had decreased to 161 lbm.Figure 7-15 shows helium supply pressure history.
7.11 S-IYB PNEUMATIC CONTROL PRESSURE SYSTEM
The pneumatic control and purge system performed satisfaciorily duringall phases of the mission. The new series redundant regulation system,which replaced the old pneumatic power control module, performed satis-factorily with the regulator dischage pressure remaining in the centerof the 470 *12 psid band. The dynamic response of the new regulatorwas superior to the previous regulator, with regulator discharge pressuredecrease transients occurring only at the prevalves close command (maxi-mum flow periods).
7-18

8/7/2019 Saturn V Launch Vehicle Flight Evaluation Report - AS-509 Apollo 14 Mission
http://slidepdf.com/reader/full/saturn-v-launch-vehicle-flight-evaluation-report-as-509-apollo-14-mission 106/254
8
IW 'dsdll x01 r!sa ~3mssmd13-w n101 dmd ro1
p/r ‘as&r01R <
s 51 52
pm ‘3wnl3W13N1 -101 dad 101& R
8 s
)I, '3unlvu3dn3113lNl dim 101
.n 0 * ?
e
7-19

8/7/2019 Saturn V Launch Vehicle Flight Evaluation Report - AS-509 Apollo 14 Mission
http://slidepdf.com/reader/full/saturn-v-launch-vehicle-flight-evaluation-report-as-509-apollo-14-mission 107/254
f
S-IVB FIRST ESCS-IV8 FIRST EC0STAR T CRYOGENIC REPRtSSURIZATlDN f
S-IV8 SECOND EC0STA RT COLD HELIUM DUMPEND COLD HELIUM DUMP %
END COLD PELIUM DUMPSTAR T COLD HELIUM DUMPEND COLD HELlUM DUMP
S-IV8 SECOND EX 87~tA~ f COLD HELIUM DUMP
c3000 -
0 2 4 6 a 10 12 14 16 la 20 22 24 i
--zoo0
a-400
.28
RANGE TIM E. 1000 SECONDSm WI‘I
LW VW 0. ww I,~ 1 1 w w
o:oo:oo 1:OD:DD 2:DO:DD 3:oo:OD 4:OO:DD 5:DO:W 6:DO:oO 7:DD:DD
RAhGE TIME. tlOURS:MINUTES:SECONOS
Figure 7-15. S-W Cold Helium Supply Hlstory

8/7/2019 Saturn V Launch Vehicle Flight Evaluation Report - AS-509 Apollo 14 Mission
http://slidepdf.com/reader/full/saturn-v-launch-vehicle-flight-evaluation-report-as-509-apollo-14-mission 108/254
7.12 S-IVB AUXILIARY PROPULSION SYSTEM
The APS pressurization systems demonstrated nominal performance throughout
the flight with the exception of a helium leak in Module No. 1. The leakstarted at approximately 5 hours and continued until approximately 7 hoursas shown i1 Figure 7-16. The average leak rate was about 70 SCIM duringthis 2 hour period. The total helium leakage was approximately 0.05 lbmwhich is 5 percent of the quantity loaded. Figure 7-16 shows the heliumbottle masses and temperatures for Module No. 1 and 2. As in flightsAS-504 and AS-SOS when helium leaks were observed, the leak occurred inthe cold module when the helium bottle Eempcrature began to decrease.The leak rate for this flight was less than those previously experienced.AS-504 hs3 a leak rate of approximately 235 SCIM while AS-505 had a leakrate of 180 SCIM. The allowable helium leak at liftoff is 60 psi/hr
which is equivalent to a 63 SCIM leakage. As in the AS-504 and AS-505flights there is no way of determining where in the system the leak isoccurring. The magnitude and duration of this leak was not large enoughto present any problems.
I.lodule No. 1 regulated outlet pressure was maintained between 192 and201 psia and Module No. 2 regulated outlet pressure between 192 and198 psia.
The APS ullage pressures in the propellant ui lage tank- ranged from187 to 197 psia.
The oxidizer and fuel supply systems performed as expected during theflight. The propellant temperatures measured in the propellant controlmodules ranged frcm 538 to 56g'F. The APS propellant usage was asexpected. Table 7-4 presents the APS propellant usage during specificportions of the mission.
The performance of the attitude control thrusters and the ullage thrusterswas s,atisfactory throughout the mission. The thruster chamber pressuresranged from 95 to 103 pSid. The ullage thrusters successfully completedthe three sequenced burns of 86.7 seconds, 76.7 seconds and 80.0 secondsas well as the ground comnandec! 252-second lunar impact burn. Thepassive thermal control maneuver was successfully initiated at 42,086 sec-onds (11:41:26).
7.13 S-IVB ORBITAL SAFING OPERATIONS
The S-IVR high pressure systems were safed following J-2 engine cutoff.The thrust developed during the LOX dump was utilized to provide avelocity change for the lunar impact maneuver. The manner and sequencein which the safing was performed is presented in Figure 7-17.
7-21

8/7/2019 Saturn V Launch Vehicle Flight Evaluation Report - AS-509 Apollo 14 Mission
http://slidepdf.com/reader/full/saturn-v-launch-vehicle-flight-evaluation-report-as-509-apollo-14-mission 109/254
v FIRST ULLAGE ENGINE BURN A-m )wI F WI 1 0 EVASIVE ULLAGE ENGINE BURNv SECOND ULLAGE ENGINE BURN B-MOW-- --_ -
.-- ..-. . -.- _--. -- - .-_ ~- --...ILE M. 2 w LUNAR IMPACT ULLAGE ENGINE BURN
24 :
v * IUIIGETME, l&W SECOM6w
o:m:w 2:m:oo 4:W:W 6:W:W 8:W:W 1o:w:wRANGE TINE .tKluRs :IIINUTES : SECOWDS
Figure 7-16. APS Heliun Bottle Ccndftions (Sheet 1 of 2)
0.2
7-22

8/7/2019 Saturn V Launch Vehicle Flight Evaluation Report - AS-509 Apollo 14 Mission
http://slidepdf.com/reader/full/saturn-v-launch-vehicle-flight-evaluation-report-as-509-apollo-14-mission 110/254
VT8VLOX DmP
AVERAGE HELIUM LEAKRATE = 70 SCIW BETUEEN 5 AND7 HOURS AFTER LIFT OFF
15' s
+i 3DATA IOT AVAILABL;m
8i -30 0
-
RANGE TIM E. SECONDS
J .v v I3:oo:oo 4:W:O0 5:oo:oo 6:00:00 7:W:O0 8:OO:W 9:oo:Do
RANGE TIME, HOURS:MI’~~.ES:SECONDS
Figure 7-16. APS Helium Bottle Conditions (Sheet 2 of 2)
7.13.1 Fuel Tank Safing
The LH2 tank was satisfactorily safed by utilizing both the NonpropulsiveVent (NPV) and the U'S, a5 indicated in Figure 7-17. The LH2 tank ullagepressure during safing is shown in Figure 7-9. At second ECO. the LH2tank ullage pressure was 32.6 psia and after two programed vent cycleshad decayed to 6.8 psia. Due to extended docking operations, the thirdprogramed vent cycle was delayed by 6300 seconds, permitting the ullagepressure to increase to the relief level, 32.2 psia, at 20,840 seconds(05:47:20), as shown in Figure 7-9. After approximately 2000 secondsof relief venting, the third vent cycle was initiated and the ullagepressure decayed to 0 psia at 27,000 seconds (07:30:00).
7.13.2 LOX Tank Dumping and Safing
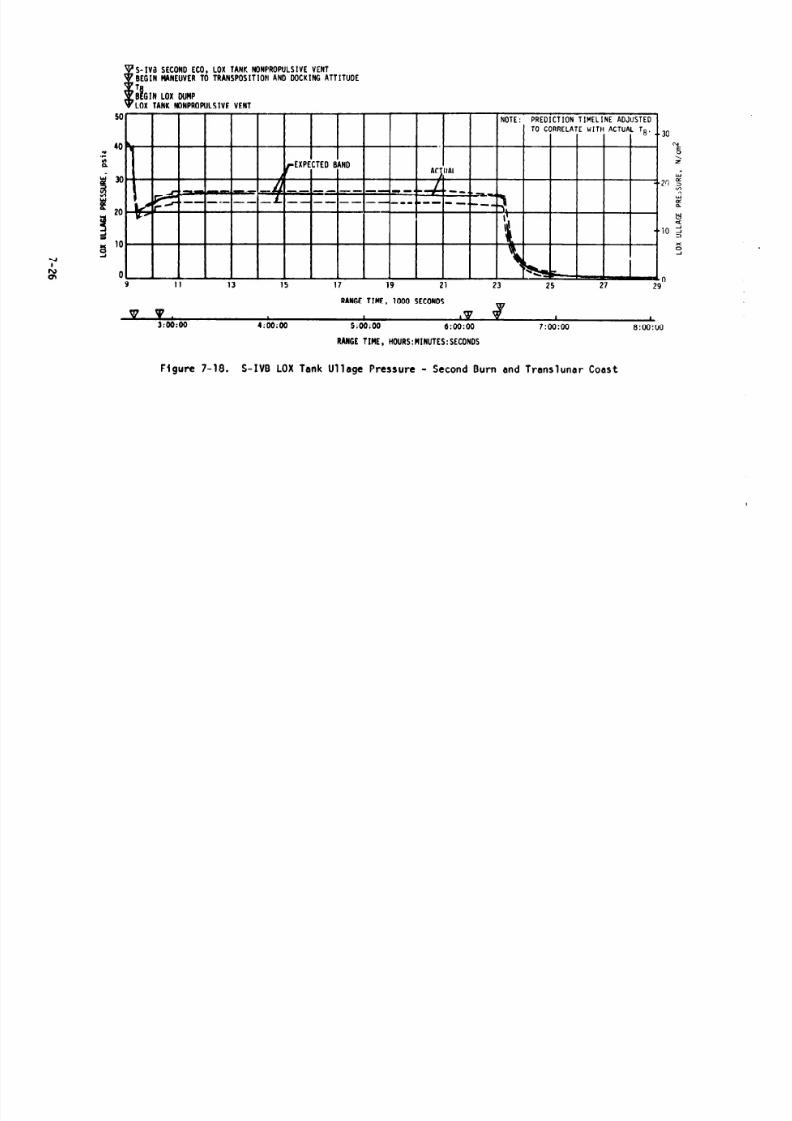
Immediately foliowing second burn cutoff, a programed 150-second ventreduced LOX tank ullage pressure from 39.8 psia to 18.0 psia, as shownin Figure 7-18. Approximately 70 lbm of helium and 125 lbm of GOX were
7-23

8/7/2019 Saturn V Launch Vehicle Flight Evaluation Report - AS-509 Apollo 14 Mission
http://slidepdf.com/reader/full/saturn-v-launch-vehicle-flight-evaluation-report-as-509-apollo-14-mission 111/254
Table 7 4. S-IVB APS Propellant Consumption
TIME FERIOD
Initial Load
First Burn(Rol r Control)
EC7 to End of First AFSUllage Burn
End of First Ullage Burn toStart of Second Ulla9e Burn
Second Ullage BurnSecond Burn(Roll Control)
EC0 to 20,694 set
From 20,694 to 23,572 setThis ir.cludes Evasive Ullage
TMODULE AT POSITION I1 MODULE AT POSITIOrY II--
FUEL,LBM
Bwn and LOX Dump
OXIDIZER,LBM
204.2
0.7
10.8
9.51.3
15.6
18.9
From 23,572 set to Startof Lu1.w llrlpact Burn
9.3 5.8 9.7 6.1
Lunar InpactUllage Burv ! 31.0 25.7 34.4 27.8
End of Lunar Impact Burnto 41,971 set
13.2 8.2 10.5
Total Usage
T
I
I
FUEL. OXIDIZER,LBM LBM
125.9 204.2
0.5 0.7
125.9
0.5
10.4 13.4 10.4
3.9 6.9 2.6
7.7 10.8 8.70.9 1.3 0.9
9.4 15.7 9.6
13.8 18.9 13.8
86.3 122.3
6.6
97.0
1
vented overboard. As indicatec in Figure 7-18 the ullage pressure thenrose gradually, due to self-pressurization, to 23.2 psia at the initia-tion of the Transposition, Docking and Ejection (TC&E) maneuver.
The LOX tank dump was initiated at 23,120.5 seconds (06:25:20.5) andwas satisfactorily accomplished.was reached within 11 seconds.
A steady-state liquid flow of 360 gemGas ingestion did not occur during dump.
The LOX residual at the start of dump was 5452 lbm. Calculations indicate
7-24

8/7/2019 Saturn V Launch Vehicle Flight Evaluation Report - AS-509 Apollo 14 Mission
http://slidepdf.com/reader/full/saturn-v-launch-vehicle-flight-evaluation-report-as-509-apollo-14-mission 112/254
LS2 TAN K CVS CPEh
LOX TANK NPb VALVE OPfb
if, ;ANh I.PTCH N@V irALVE OPFN
.0X CnG!EN : REPRESS HEL!UM DUYP
CO LI! lit L :lJM DUMP
WlEIfkT FtWESS HELIUN DUMP
G-2 ENGINE ST AY TANK DL’MP
ST AG f CONTR OL HELiUM D?1?*0
APS ‘lLLAG,E r’dr”drc ONI 01, L_I
LOi DUMP
J-i ENGINE CONTROL HELIJY DUMF
AUX HVDRAULIC PUMP ON
J--,-i _'__-_ 7--'--+-/~"-i-j-~~~---t -i:;TmLmL;. _ (-
9 1” 13 ia 22 23 20 25
WNGE TIME. iDD0 SECONDS
I A h I
2:30:00 2:so:oo 3:3O:OJ 3:50:00 6:OO:O O 6:20:00 6:ao:oo ~:w:ooRANGE TIM E, HOURS:M:NU?ES:SECONOj
Figure 7-17. S-IVB LOX Dump and Orbital Saf'ng Sequence
that 2542 lbm of LOX was dumped. During dump, the ullage pressuredecreased from 24.2 to 23.6 psia. LOX dump ended at 23,168.S seconds(06:26:08,5) as scheduled by closure of the Main Oxidizer Valve (MOV).
A steady-state LOX dump thrust of 700 lbf was attained. The totalimpulse before MOV closure was 32,200 lbf-s, resulting in a calculatedvelocity change of 28.0 ft/s. Figure 7-19 shows the LOX dump thrust,LOX flowrate, oxidizer mass, and LOX ullage pressure during LOX dump.The predicted curves presented for the LOX flowrate and dump thrustcorrespond with the quantity of LOX dumped and the actual ullage pressure.
Seventy-two seconds following termination of LOX dump, the LOX NPV valvewas opened and remained open for the duration of the mission. LOX tankullage pressure decayed from 23.6 psia at 23,241 seconds (C)6:27:20) tozero pressure at approximately.37,000 seconds (10:16:40), as shown inFigure 7-18.
Scfficient impulse was derived from the LOX dump, LH2 CVS operation,and APS ullage burn to achieve a successful lunar impact. For furtherdiscussion of the lunar impact refer to Section 17.
7 .:3.3 Cold Helium Dump
A total of approximately 156 lbm of heli urn was dumped during the th,.eeprogramed dumps, which occurred as shown in Figure 7-17.
7-25
8/7/2019 Saturn V Launch Vehicle Flight Evaluation Report - AS-509 Apollo 14 Mission
http://slidepdf.com/reader/full/saturn-v-launch-vehicle-flight-evaluation-report-as-509-apollo-14-mission 113/254
s-Iva SECOND ECO, LOX TANK N~NPROPULSIVE VENTBEGIN WNEUVER TO TRANSPOSlTlON AND DOCKING A TTITUOE
&IN LOX DUMPLOX TANK NONPROPULSIVE VENT
RANGE TIME, 1000 SECONOS
v v. 1 I 1 13:oo:oo 4:oo:Oo 5:oo:oo 6:00:00 7:oo:oo 8:OO:LJO
RANGE TIME. HOURS:MINUTES:SECONDS
Flgure 7-18. S-IV6 LOX Tank Ullage Pressure -Second Burn and Translunar Coast

8/7/2019 Saturn V Launch Vehicle Flight Evaluation Report - AS-509 Apollo 14 Mission
http://slidepdf.com/reader/full/saturn-v-launch-vehicle-flight-evaluation-report-as-509-apollo-14-mission 114/254
v START OF LOX DUMPVTERMINATION OF LOX DUMP
Btwuu000
: 3OODOOD000000 ”
ii 4000 2oD0wo iii4000
E i
E 2000000 loo0oo0 ;;: 0
0
a
a”z:yq5:
RANGETIME, SECONDS
P 1 1 v I6:25:20 6:25:40 6:26:00 6:26:20
RANGETIME, HOURS:MINUTES:SECONDS
Figure 7-19. S-IV6 LOX Dump Parameter Histories
7.13.4 Ambient Helium Oump
The two LOX ambient repressurization spheres were dumped through the LOXambient repress control module into the LOX tank NPV system for 40 seconds.During this dump the pressure decayed from 2880 psia to 1230 psia.
7-27

8/7/2019 Saturn V Launch Vehicle Flight Evaluation Report - AS-509 Apollo 14 Mission
http://slidepdf.com/reader/full/saturn-v-launch-vehicle-flight-evaluation-report-as-509-apollo-14-mission 115/254
During the Lti2 ambient repressurization helium dump approximately 42.0 lbmof helium in LC)X repressurization sphere No. 1 and the LH2 repressuri-zation spheres was dumped via the fuel tank. The 62-second dump beganat 12.864 seconds (03:34:24). The pressure decayed from 2950 psia to320 psia.
7.13.5 Stage Pneumatic Contro? Sphere Safing
The stage pneumatic control spnere and LOX repressurization sphere No. 2were safed by initiating the J-2 engine pump purge and flowing heliumthrough the engine pump seal cavities for 3600 seconds. This activitybegan at 21,541 seconds (06:04:01) and satisfactorily reduced the pressurein the spheres from 2020 psia to 1150 psia.
7.13.6 Engine Start Tank Safing
The engine start tdnic was safed during a period of approximately 150 sec-onds beginning at 12,864 seconds (03:34:24). Safing was accomplished byopening the tank vent valve. Pressure was decreased from 1245 psia to20 psia with 3.7 lbm of hydrogen being vented.
7.13.7 Engine Control Sphere Safing
The safing of the engine control Sphere began at 23,120 seconds (06:25:20).The helium control soienoid was energized to vent helium through the enginepurge system. The initia l pressure in the sphere was approximately 3400psia. At this time gaseous helium from the ambient repressurization
spheres began flowing to the engine control spnere. Helium from thecontrol sphere and repressurization spheres continued to vent until24,170 seconds (06:42:50). During this time, the pressure in the repres-surization spheres had decayed from about 650 to 125 psia. The controlsphere pressure had decayed to 110 psia. Subsequent to the ciosing ofthe control solenoid, the control spnere repressurized to 160 psia withoucany noticeable decay in stage ambient repressurization sphere pressure.During the safing period, a total of 13.6 lbm of tielium was vented over-board.
7.14 HYDKAiJLIC SYSTEU
The S-IVB hydrauiic system performance was satisfactory during the entiremission (S-IC/S-II boost, first and second burns of S-IVB, and orbitalcoast).
7-28

8/7/2019 Saturn V Launch Vehicle Flight Evaluation Report - AS-509 Apollo 14 Mission
http://slidepdf.com/reader/full/saturn-v-launch-vehicle-flight-evaluation-report-as-509-apollo-14-mission 116/254
SECTION 8
STRUCTURES
8.1 SUMMARY
The structural loads experienced during the S-IC boost phase were wellbelow design values. The maximum bending moment was 116 X lo6 lbf-inat the S-IC LOX tank (45 percent of the design value). Thrust cutofftransients experienced by AS-509 were similar to those of previousflights. The maximum longitudinal dynamic responses at the InstrumentUnit (IU) were to.25 g and 20.35 g at S-IC Center Engine Cutoff (CECO)and Outboard Engine Cutoff (OECO), respectively. The magnitudes of thethrust cutoff responses are considered normal.
During S-IC stage boost, 4 to 5 hertz oscillations were detected beginningat approximately 100 seconds. The maximum amplitude measured at the IUws to.06 g. Oscillations in the 4 to 5 hertz range have been observedon previous flights and are considered to be normal vehicle response to
flight environment. POGO did not occur during S-IC boost.
The S-II stage center engine LOX feedline accumulator successfully in-hibited the 14 to 16 hertz POGO oscillations experienced on previousflights. A peak response of f0.6 g was measured on engine No. 5 gimbalpad during steady-state engine operation. As on previous flights, lowamplitude 11 hertz oscillations were experienced near the end of S-IIburn. Peak engine No. 1 gimbal pad response was 20.16 g. PC%0 did notoccur during S-II boost. The POGO limiting backup cutoff system per-formed satisfactorily during p relaunch and flight operations. The systemdid not produce any discrete outputs.
The structural loads experienced during the S-IVB stage burns were wellbelow design values. During first burn the S-IVB experienced lw ampli-tude, 16 to 20 hertz oscillations. The amplitudes measured on the gimbalblock were comparable to previous flights and well within the expectedrange of values. Similarly, S-IVB second burn produced intermittent lowamplitude oscillations in the 12 to 14 hertz frequency range which peakednear second burn cutoff.
8-l

8/7/2019 Saturn V Launch Vehicle Flight Evaluation Report - AS-509 Apollo 14 Mission
http://slidepdf.com/reader/full/saturn-v-launch-vehicle-flight-evaluation-report-as-509-apollo-14-mission 117/254
8.2 TOTAL VEHICLE STRUCTURES EVALUATION
8.2.1 Longitudinal Loads
The structural loads experienced during boost were well within designvalues. The AS-509 vehicle liftoff occurred at a steady-state accel-eration of 1.2 g. Maximum longitudinal dynamic response masured duringthrust buildup and release was 20.25 g in the IU (Figure 8-l) andto.50 g at the Command Module (CM). Comparable values have been seenon previous flights.
The longitudinal loads experienced at the time of maximum bending moment(76 seconds) were as expected and are shown in Figure 8-2. The steady-sta?e long itudinal acceleration was 1.9 g as compared to 1.9 g and 2.0 gon r&508 and AS-507, respectively.
Figure 8-2 also shows that the maximum longitudinal loads imposed on theS-IC stage thrust structure, fuel tank, and intertank area occurred atS-IC CECO (135 seconds) at a longitudinal acceleration of 3.5 g. Themaximum longitudina l loads imposed on all vehicle structure above theS-IC intertank area occurred at S-IC OECO (164 seconds) at an accelerationof 3.8 g.
8.2.2 Bending Moments
Lateral response of the vehicle at liftoff was comparable to those seen
on previous flights. The maximum response level seen at the CMwasapproximately to.16 g (0.111 Grms) as compared to the AS-508 maximumof to.17 g (0.118 Grms). The 20: 16 g was 25 percent of the predicted3-sigma value of i0.64 g.
The inf light winds that existed during the maximum dynamic pressure phaseof the flight peaked at 102.6 knots at 43,720 feet altitude. As shown
-2 -1 0 1 2
RANGE TIME, SECONDS
Figure 8-l. Longitudinal Acceleration at IU During Thrust Buildup
and Launch
8-2

8/7/2019 Saturn V Launch Vehicle Flight Evaluation Report - AS-509 Apollo 14 Mission
http://slidepdf.com/reader/full/saturn-v-launch-vehicle-flight-evaluation-report-as-509-apollo-14-mission 118/254

8/7/2019 Saturn V Launch Vehicle Flight Evaluation Report - AS-509 Apollo 14 Mission
http://slidepdf.com/reader/full/saturn-v-launch-vehicle-flight-evaluation-report-as-509-apollo-14-mission 119/254
~_. -.. .- .__ r -.I . _ . - . . . . ,
VEHICLE S TAT ION. in.
A m 3 o m 2Doa 1000 01 ,
VEHICLE STATICN, m
60 50 40 30 M 10
YITH STRuCTUlUC
I
Figure 8-3. Bending Moment Distribution at Time ofMaximum Bending Moment
The AS-509 S-IC CECO and OECO transient responses (Figure 8-5) weresimilar to those of previous flights. The maximum longitudinal dynamicsat the IU resulting from S-IC CECO and OECO were 5.25 g and 9.35 g,respectively. Corresponding values on AS-508 were HI.20 g at CECO andfl.28 g at OECO.
The S-II 14 to 16 hertz POGO oscillations encountered on AS-508 were notobserved on AS-539. The AS-509 vehicle incorporated a center engineaccumulator in the LOX feedline of the S-II stage to inhibit suchoscillations by "de-tuning" or uncoupling the structural and propulsionresponses. Figure 8-6 shows a comparison between the AS-508 levels andthe responses seen on AS-509. The peak gimbal pad response of approxi-mately 233.7 g (reconstructed value) on AS-508 compares to a peak responseof H.6 g on AS-509. The HI.6 g level is typical of the maximum responsethroughout the steady-state regime when the center engine was opera-tional. The effectiveness of the accumulatcr system in suppressing thePOGO oscillations generally exceeded expectatiort.
The purpose of the accumulator is to reduce the fundamental feedlinefrequency from about 26 hertz to about 3.5 to 4.0 hertz. This is touncouple the feedline response from the fundamental crossbeam response
8-4
8/7/2019 Saturn V Launch Vehicle Flight Evaluation Report - AS-509 Apollo 14 Mission
http://slidepdf.com/reader/full/saturn-v-launch-vehicle-flight-evaluation-report-as-509-apollo-14-mission 120/254
0.06
0.06YzCLmL
g 0.04
z,"ti=:<
0.02
01
I 1 IAs-505 THROUGHAS-508 ENVELOP
1 I 1I I 1
iO5 110 115 1
RANGE TIME, SECOND5
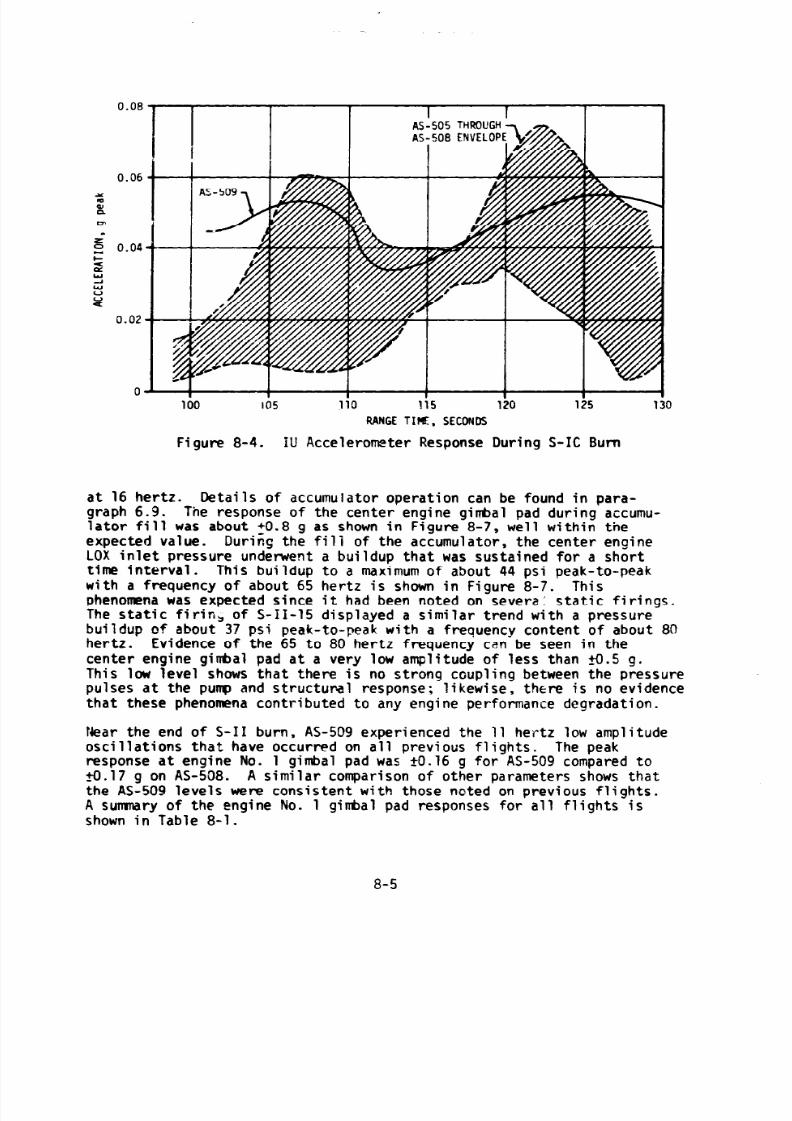
Figure 8-4. iU Accelerometer Response During S-IC Bum
at 16 hertz. Details of accumulator operation can be found in para-graph 6.9. The response of the center engine gimbal pad during accumu-lator fi ll was about +0.8 g as shown in Figure 8-7, well within theexpected value. During the fi li of the accumulator, the center engineLOX inlet pressure underwent a buildup that was sustained for a shorttime interval. This buildup to a maximum of about 44 psi peak-to-peakwith a frequency of about 65 hertz is shown in Figure 8-7. Thisphenomena was expected since it had been noted on severa: static firings.The static firin, of S-II-15 displayed a similar trend with a pressurebuildup of about 37 psi peak-to-peak with a frequency content of about 80hertz. Evidence of the 65 to 80 hertz frequency can be seen in thecenter engine gitial pad at a very low amplitude of less than fo.5 g.This low level shows that there is no strong coupling between the pressurepulses at the pump and structuml response; likewise, there is no evidencethat these phenomena contributed to any engine performance degradation.
Near the end of S-II burn, AS-509 experienced the 11 hertz low amplitudeoscillations that have occurred on all previous flights. The peakresponse at engine No. 1 gimbal pad was fD.16 g for AS-509 compared tofl.17 g on AS-508. A similar comparison of other parameters shows thatthe AS-509 levels were consistent with those noted on previous flights.A sumnary of the engine No. 1 gimbal pad responses for all flights is
shown in Table 8-l.
8-5

8/7/2019 Saturn V Launch Vehicle Flight Evaluation Report - AS-509 Apollo 14 Mission
http://slidepdf.com/reader/full/saturn-v-launch-vehicle-flight-evaluation-report-as-509-apollo-14-mission 121/254

8/7/2019 Saturn V Launch Vehicle Flight Evaluation Report - AS-509 Apollo 14 Mission
http://slidepdf.com/reader/full/saturn-v-launch-vehicle-flight-evaluation-report-as-509-apollo-14-mission 122/254
-

8/7/2019 Saturn V Launch Vehicle Flight Evaluation Report - AS-509 Apollo 14 Mission
http://slidepdf.com/reader/full/saturn-v-launch-vehicle-flight-evaluation-report-as-509-apollo-14-mission 123/254
v STA RT ACClMULATOR FILL
5. v ACCUMULATOR FILL COMPLETE
--
g 25
KAHGETiRE. SECONDS
Figure 8-7. AS-509 Pump Inlet Pressure and Thrust Pad AccelerationOscillations during Accumulator Fill Transient (0 to 110 Hz Filter)
Table 8-l. S-II Engine No. 1 Peak Response Sumnary for Post CECO 11Hertz Oscillations (8 to 14 Hertz Bandpass Filter)
RANGE ACCELERATION LOX LEVELSTIME AT PEAK 1 LOX LEVEL AT PEAK AT l/3 AMPLITUOE
AMPLITUDE PEAK FREQUENCY AMPLITUDEFLIGHT (SECONDS) AMPLITUDE(G) (HZ) (INCHES OF LOX)
(INCHES OF LOX)START I STOP
501 NO MEASUREMENT OF ACCELERA TION
I 506 1 NO LOU FREQUENCY OSCILLATION INSTRUMENTATION I1
507 545 0.09 11.4 15 27 12
508 5Pf 0.17 11.1 19 2? 9
509 542 0.16 11.0 26 32 18
Ilm
DATA QUESTIONABLEAS-502 - 2 ENGINES OUT
I
AS-502 L AS-503 - LARGEATTEWA TION AT 11 HZ ON
El ACCELERATION
8-8

8/7/2019 Saturn V Launch Vehicle Flight Evaluation Report - AS-509 Apollo 14 Mission
http://slidepdf.com/reader/full/saturn-v-launch-vehicle-flight-evaluation-report-as-509-apollo-14-mission 124/254
which is considered sisyificant is the probable definition of the funda-mental mode of the oatboard LOX feedline. Figure 8-8 shows a contourgramof the amplitudelfreauency density 3f the engine No. 1 LOX pump inletpressure. The solid line has been sketched on top of the contour toindicate the frequens:! time history trend of the outboard LOX line. Sznsi-tivity of the line fr?qjency to NPSP and EMR can be inferred by comparingthe trends of NPSP with the suggested fundamental feedline frequency(Figure 8-8).
During S-IVB first burn, low frequency (16 to 20 hertz) longitudinaloscillations similar to t!lose observed on previous flights were againevident on AS-509. The AS-509 amplitudes (20.06 g at gimbal block) wzrewell below the maximum measured cn AS-505 !+0.3 g) and within the expectedrange of values.
The S-IVB second burn produced intermittent, low level, 10 to 14 hertzoscillations similar to those experienced on all previous flights. Theosciilations, corresponding to the first longitudinal mode, began approxi-mately 100 seconds prior to second cutoff. The oscillations pea&cd 10 to40 seconds prior to cutoff with approximately to.36 g seen at the gimbalpad. This compares to a ~0.07 g level measured on AS-508.
There was no significant change in vibration levels at around 2 minutesintr, second burn when the flight crew reported a "buzzing" wnich continueduntil engine cutoff. Engine mixture ratio shift occurred about 2.5 mirlutes
35
1
ZO C/
3bo 4X
RANGE TI T. SEt3W
Figure 8-8. S-II Engine No. 1 LOX Pump Inlet Pressure Contobrgram/NPSPComparison
8-9

8/7/2019 Saturn V Launch Vehicle Flight Evaluation Report - AS-509 Apollo 14 Mission
http://slidepdf.com/reader/full/saturn-v-launch-vehicle-flight-evaluation-report-as-509-apollo-14-mission 125/254
into second burn and resulted in increased acceleration but no signifi-cant change in vibration. This is not the nonpropulsive venting ?roblemexperienced on AS-SOS.
8.3 POGO LIMITING BACKUP CUTOFF SYSTEM
AS-539 incorporated a vibration limit monitor system which would providefor automatic engine shutdown if response levels exceeded predeterminedlevels.
The backup cutoff system consists of three sensors, a two-out-of-threevoting logic, and an engine rutoff arming function. Each sensor con-sists of an accelerometer, f'lter, noise rejector, limit detector andsolid-state output switch. Each sensor provides three cutputs: an analogsignal proportiorai to the filtered acceleration oscillation; a discrete40 I1lillisecond pulse which is current l'oited, and a discrete 40 millisecondpulse that is not current limited. The analog signal and current limitedpulse are used as inputs to the 'elemetry system. The unlimited pulse isused to energize a relay in the voting logic. The voting circuit pre- tsa single circuit malfunction from providing an inadvertent engine cut*The arming function prevents engine cutoff until normal structural dynamicvibrations due to separation and engine start have been attenuated.
The backup cutoff system did not produce discrete outputs during prelaunchor flight operations. The analog outputs from each sensor were 22.8 gqeak during S-II engine start with the sinusoidal phase angle differenceoetween the three units beiry less than +12 degrees. The coincidence
between discrete outputs would have been within +2 milliseconds if thebeam vibration had exceeded the preset limit of 13.6 +l g peak.
The G switch performance is depicted in Figure 8-9. This is an overlayof the response of the three G switches following engine start. Theamplitude and phase correlation between the three measurements was lessthan 0.1 g in amplitude and 12 degrees in phase.
8-10

8/7/2019 Saturn V Launch Vehicle Flight Evaluation Report - AS-509 Apollo 14 Mission
http://slidepdf.com/reader/full/saturn-v-launch-vehicle-flight-evaluation-report-as-509-apollo-14-mission 126/254
0 MAXIMUM PEAK ACCELERATION = 2.89 AT ENGINE STA RT
l ACCELERATION DEVIATION LESS THAN O.lg BETWEEN SWITCHF:
0 PHASE DEVIATION LESS THAN 12 DEGREES BETWEEN SWITCHES
ON0 SWITCH OUTPU TS DURING S-IC AND S-II BOO ST4
ENGINE STAR T TRANSIENT 1 I I I I I I I 1
-4
169.5 169.0
RANGE TIM E, SECONDS
Figl;re 8-9. G-Switch Performance
8-11/8-12

8/7/2019 Saturn V Launch Vehicle Flight Evaluation Report - AS-509 Apollo 14 Mission
http://slidepdf.com/reader/full/saturn-v-launch-vehicle-flight-evaluation-report-as-509-apollo-14-mission 127/254
SECTION 9
GUIDANCE AND NAVIGATION
9.1 SUMMARY
9.1.1 Performance of the Guidance and Navigation System as Imple-
mented in the Flight Program
The guidance and navigation system performed satisfactorily in theaccomplishment of all mission objectives.
9.1.2 Guidance and Navigation System Components
The ST-124M-3 inertial platform, the Launch Vehicle Data Adapter (LVDA),and the Launch Vehicle Digital Computer (LVDC) performance was satis-factory. LVDA telemetry, however, indicated one hardware measurementfailure. The LVDA internal hardware monitor of the switch selector
reaister driver status did not indicate the correct state of the bit 5driver. This is a measurement for telemetry only: performance of thedriver and al l associated switch selector functions was unaffected andsatisfactory.
9.2 GUIDANCE COMPARISONS
The postflight guidance error analysis was based on comparisons of theST-124M-3 platform system measured velocities with the final postflighttrajectory established from external tracking data (see paragraph 4.2).Velocity differences for boost-to-Earth Parking Orbit (EPO) are shownin Figure 9-l. A positive difference indicates trajectory data greaterthan the platform system measurement. The velocity differences at firstS-IV6 Engine Cutoff (ECO) were 0.30 m/s (0.98 ft/s), -2.09 m/s(-6.86 ft/s), and -0.82 m/s (-2.69 ft/s) for vertical, crossrange, anddownrange velocities, respectively. These differences are relativelysmall and well within the accuracy of the data compared and the expectedhardware errors. Telemetry indicated no velocity shift as seen onAS-508 during the AS-509 thrust buildup and liftoff.
9-1

8/7/2019 Saturn V Launch Vehicle Flight Evaluation Report - AS-509 Apollo 14 Mission
http://slidepdf.com/reader/full/saturn-v-launch-vehicle-flight-evaluation-report-as-509-apollo-14-mission 128/254
64
2-02
1;
i=
100 200 300 400 500 600 700 800Zk
8=RANGE TIME, SECONDS
Figure 9-l. Trajectory and ST-124M-3 Platform Velocity ComparisonBoost-to-EPO (Trajectory Minus Guidance)
The platform velocity comparisons for the second S-IVB burn mode areshown in Figure 9-2. The curves represent the differences in velocityaccumulated from Time Base 6 (T6) initiation. The crossrange velocitydifferences are consistent with the boost-to-parking orbit datl. Thevertical and downrange velocity differences are not compatible with theboost-to-parking orbit data and/or hardware errors. The second burntrajectory was constructed by constraining the telemetered platformvelocity measurements to parking orbit and translunar orbit solutions.The in-plane velocity differences indicate some inconsistency betweenthe two orbit solutions. Since both the vertical and downrangedifferences have built up to about 1 m/s (3 ft/s) at ignition, thetrajectory state vector at ignition for the Translunar Injection (TLI)solution appears more accurate than the EPO solution.
Platform velocity measurements at significant event times are shown inTable 9-l along with corresponding values from both the postflight andOperational Trajectories (OT). The differences between the telemeteredand postflight trajectory data reflect some combination of small guidancehardware errors and tracking errors. The differences between thetelemetered and OT values reflect off-nominal performance and environmentalconditions. The values shown for the second S-IVB burn mode represent
component velocity changes from T6. The characteristic velocity
9-2

8/7/2019 Saturn V Launch Vehicle Flight Evaluation Report - AS-509 Apollo 14 Mission
http://slidepdf.com/reader/full/saturn-v-launch-vehicle-flight-evaluation-report-as-509-apollo-14-mission 129/254
1
0
-1
-2
v S-IVB SECOND EC0
fgg=jzJ
-2-4-6
::0-12-14-16
t;u,
$:8rr-i9000 9100 9200 9300
8E RANGE TIME, SECONDS ILxzb 1 1 . I
02:28:20 02:30:00 02:31:40 02:33:20 02:35:00RANGE TIME, HOURS:MINUTES:SECONDS
Figure 9-2. Trajectory and ST-124M-3 Platfonr Velocity Comparisonat S-IVB Second Burn (Trajectory Minus Guidance)
determined from the platform measured velocities during second burn wasclose to nominal. At TLI, the guidance characteristic velocity was 0.05
m/s (0.16 ft/s) higher than the postflight trajectory and 3.17 m/s(0.56 ft/s) lower than the OT. However, the measured velocity increasebetween cutoff signal and TLI was 0.44 m/s (1.44 ft/s) higher than theOT. The velocity increase after first S-IVB cutoff was also higherthan the OT by 0.16 m/s (0.52 ft/s).
Comparisons of navigation (PACSS 13 Coordinate System) positions,velocities, and flight path angle are shown for significant flightevent times in Table 9-2. Position and velocity component differencesbetween LVDC and OT values reflect off-nominal flight environment andvehicle performance. Velocity cutoff was given with only -0.02 m/s
(-0.07 ft/s) deviation. At first guidance cutoff signal, the LVDC
9-3

8/7/2019 Saturn V Launch Vehicle Flight Evaluation Report - AS-509 Apollo 14 Mission
http://slidepdf.com/reader/full/saturn-v-launch-vehicle-flight-evaluation-report-as-509-apollo-14-mission 130/254
Table 9-1. Inertial Platform Velocity Comparisons(PAM 12 Coordinate System)
EVENT DATA SOURCE VELOCITY - M/S (FT/S)
VERTICAL CROSSRANGE Dow RANQ
m (i) Ii,
Guldance (LVDC) 2617.80 2.75 2216.20(8588.58) (9.02) (7271.00)
s-IC Postflight Trajec tory 2617.98 2.34 2215.63
OECO(8589.17) (7.68) (7269.13)
Operational Tra jectory 2622.71 -1.44 2212.61(8604.27) (-4.73) (7258.09)
Guidance (LVDC) 3466.65 -6.40 6825.15(11.373.52) (-21.00) (22.392.22)
S-II Postflight Trajec tory 3467.20 -8.59 6824.57
OECO(11.375.33) (-28.18) (22.390.32)
Operational Tra jectory 3475.09 -4.33 6818.74(11.401.21) (-14.21) (22.371.19)
Guidance (LVDC) 3229.02 -1.90 7603.M(10.593.90) (-6.23) (24.944.36)
S-IV8 Postfllght Trajec tory 3229.32 -3.99 7602.22
FIRST EC0(10.594%) (-13.09) (24.941.67)
I Operattonal Trajectory
IGuidance (LVDC)
PARKING ORBIT
I
Postfllght TrajectoryINSERTIW
I Operational Trajectory
Guidance (LVDC)
S-IV8
SE(XI(O ECO*
Postfllght Trajectory
Operatlonal Trajectory
3234.54 -2.32(10.612.01) (-7.61)
3228.25 -1.90(10.591.37) (-6.23)
3328.73 -3.94(10.592.95) (-12.93)
I 2661.31 72.90(8731.33) (239.17)
I
2659.77
I
77.69(8726.27) (254%)
76D2.36(24.942.13)
7604.65(24349.64)
7603.94(24.947.31)
7603.85(24.947.01)
-1670.41(-5480.35)
-1671.23(-5483.04)
-1675.30(-54os.40)
I uidance (LVDC)
I
2665.55
I
77.90
I
-1671.90(8745.24) (255.58) (-5485.24)
TRANSLUlAR Postfllght TrajectoryINJECTIOR l
I I
2664.02(8740.22)
i I
73.01 -1672.59(239.53)
I(-5487.50)
OperatIonal Trajectory 2662.81 77.85 -1676.60(8736.25) (255.40) (-5500.67)
*Values represent vcloclty chaqe from Ti m Base 6.
9-4

8/7/2019 Saturn V Launch Vehicle Flight Evaluation Report - AS-509 Apollo 14 Mission
http://slidepdf.com/reader/full/saturn-v-launch-vehicle-flight-evaluation-report-as-509-apollo-14-mission 131/254
Table 9-2. Guidance Comparisons (PAW 13)
EVENT
S-ICOECO
--
s-t1
ccc0
S-Iv0Fint EC0
Parkingorb1 t1nscrtim
Tim?me 6
GIVESecond EC0
MT ASOURCE
T
GUI bncl!(LWPostflightTrajectory
OperatlonrlTrajcctoy
Guidance(LVOC)
Postflight
TnjcctovyCperationrlTrajectory
Guldanct(LVOC)
PortflightTrrjcctory
OpcratimrlTrajrctoy
Cd dance(LVK)
PostflightTrajectory
OpcrrtlmrlTrajectory
Guldanct(LVK)
PostflightTrajectory
Operation41Trajectory
Guidance(LVK)
PostflIghtTrajectory
Opcrationrlfrajcctoy
Guidance(LVK)
PostflightTrajectory
OperrtlonalTrajectory
POSITIONSmERS (FT)
I I
6.4X.364.6(21.123.243.4)
6.438.311.2(21.123.0613.2)
6.437.910.7(21.121.754.2)
6.278.525.2(20.598.83b.O)
6.278.632.6
(20.599.188.3)6.282,761.6
(20.612.734.7)
5.901.671.6(19.362.439.6)
5.901.855.5(19.363.043.0)
5.896.982.2(19.347.054.2)
5,867.147.9(19.249.172.9)
5.8b7.349.0(19.249.835.3)
5.862.358.1(19.233.458.2)
-6.539,546.9-21.455.2Ob.4)
-6.534.169.5-21.438.548.2)
-6.538.938.7-21.453.211.0)
-2.050.021.8c-6.725.793.3)
-2.020.042.1l-6.627.434.7)
-2.004.243.7t-6.575.602.7)
-1.951.544.0(-6.402.703.4)
-1.923.411.7i-b.310.5b9.9)
-1,905,643.1(-6.252.109.9)
75.818.9I
2.870.560.8(248.749.7) (9.417.850.4)
76.650.8 2.880.434.8(251.479.1) (9.450.245.2)
+
77.151.4 2.940.772.3(253.121.)) (9.648.203.1)
76.367.4 2.940.424.6(2S0.549.2) (9.b47.ObZ.3)
-115.343.0 -6.424.840.9-370.421.9) I-21,07.9,874.3)
-113.489.5 -6.438.903.8-372.340,9) (-21.125.012.5)
L
I
R
6.440.545.1(21.130.397.3)
6.440.489.9 850.42(21,130,216.2) (2790.09)
6.440.098.6 a45.18(il,i28.932.3)
6.560,574.6(21.524.194.9\
b.MO.601 1(21.524.281 8)
6.559.772.2(21.521.562.3)
6.563.348.7(21.533.296.3)
6.563.365.5(21.533.351.4)
6.563.320.6(21.533.iO4.0)
5.553.346.6(21.533.289.4)
6.563.362.6(21.533.341.9)
6.563.319.8(21.533.201.0)
X.374.2(21.543.222.4)
6.563.571.9(21.534.028.5)
6.565.722.6(Ll.541.084.6)
6.696.115.2(21.96a.881.9)
6.693.941.3(21.961.749.7)
6.701.983.9(2l.9aa.l36.2)
6.709.689.3(22.013.416.3)
6.707.577.0(22.006.486.2)
6.715.939.0(22.033.920.6)
VELOCIXIS IF
85j.17('789.27)
(2771.03)
-1952.14(-6404.66)
-1951.60
(-6402.84)-1927.04
t-6322.66)
-3408.85(-ii.ia3.89)
-3408.58(-11.183.01)
-342'3.31(-ii.22i.48)
-3492.65(-11.458.83)
-3492.16(-11.457.22)
-3503.86f-11.495.63)
701.30(23oo.as)
733.02(2404.92)
700.49(2298.20)
9831.26(32.254.79)
5847.95(32.309 55)
9844.02(32.296.65)
9061.20(32.353.28)
9876.83(32.404.30)
9872.93(32.391.50)
V.>-_
99.55(313.48)
99.21(312.37)
95.42,313.04)
65.25(214.17)
63.1'9
(207.32)67.93
(222.as)
57.x(187.20)
55.25(la1.27)
56.94(186.82)
56.15(iar.zLj
54.35(178.31)
55.39(183.69)
-129.30-424.21)
-127.23-417.42)
-129.31-424.25)
53.84(176.64)
51.43(168.73)
54.56(179.OOj
55.46(181.96)
52.38(173.82)
56.15(184.22)
iiTT/S
8 FLiGnT P&lI AJIGLt (MC
1
2597.91;8523.33)
2597.32(8521.331
2593 .RG,e5ll.l6)
b7d3 1
(21.993.473
67bJ.d')
(21.991.77)6704.47
::1.596.73)
7005.91(22.985.27)
7305.1'3(22.562.9lj
7000.34f22.967.30)
6966.50(22.855.97)
6965.95(22.854.17)
5960.72(22.837.00)
-7762.95-25.469.00)
-7761.75-25.465.06)
-7763.67-25.471.36)
-4544.e3-14.9lo.aa)
-4512.e7-lA,gO6.00)
-4505.27-14.781.07j
-4A61.58-i4.637.73)
-4429.32-14.531.89)
-4421.79-14.507.19)
V, Y2735.2) !? 7875
I-(8?7P,Li.,
?7lA.!,l I , .I<J(k.>72.17J
OJ81. ”
I
J a2(22.~05.SA)
6976 2A 1.67
7796.28 0.01(25.578.35)
-t-10.831.07 t.9742
(35.535.01)
lo.im.a6 7.2473(35.540.88)
lC,JZb.ll 7.18(35.518.80)

8/7/2019 Saturn V Launch Vehicle Flight Evaluation Report - AS-509 Apollo 14 Mission
http://slidepdf.com/reader/full/saturn-v-launch-vehicle-flight-evaluation-report-as-509-apollo-14-mission 132/254
radius vector was 28 meters (92 ft) greater than the OT prediction. TheLVDC and postflight trajectory data are in good agreement for the boost-to-parking orbit burn mode. The differences are well within theaccuracies of the hardware measurements and/or trajectory data. Vent
thrust was lower than the LVDC programed thrust from orbital navigation(EC0 +lOD seconds) to approximately 2500 seconds (00:41:40). Figure9-3 presents the continuous vent thrust profiles used in the LVDC alongwith a postflight reconstruction and updated nominal. The low ini tia lvent thrust also has been observed on both AS-507 and AS-508 flights.The low init ial vent thrust together with the state vector differencesat EPO caused oscillatory buildup in velocity component differencesbetween the LVDC and postflight trajectory during parking orbit. Table9-3 presents a breakdown of the factors contributing to the position andvelocity errors at T6. At T6, the differences in geocentric radius andtotal velocity were -2802 meters (-9194 ft) and 1.69 m/s (5.54 ft/s),respectively. Table 9-4 presents the state vector differences at TLIbetween the LJDC and both the postflight trajectory and OT. The LVDC
503: i : Y i iI VBEGIN ORBITAL NAVIGATION
VSTART OF T61 '
/ I / *REF. S&E-ASTN-?F-71-M-26
i lOb0 2&x 30-W 4ObO 5ObO 6doo 7ObO 60'00 9doo
TIMC FROM TIMEBASE 5. SECONDS
P v .00:30:00 o1:OO:oo 01:30:00 02:w:oo 02:30:00
RANGE TIS . HOlJRS:MIWiTES:SECONDS
Figure 9-3. LH2 Continuous Vent Thrust During Parking Orbit
9-6
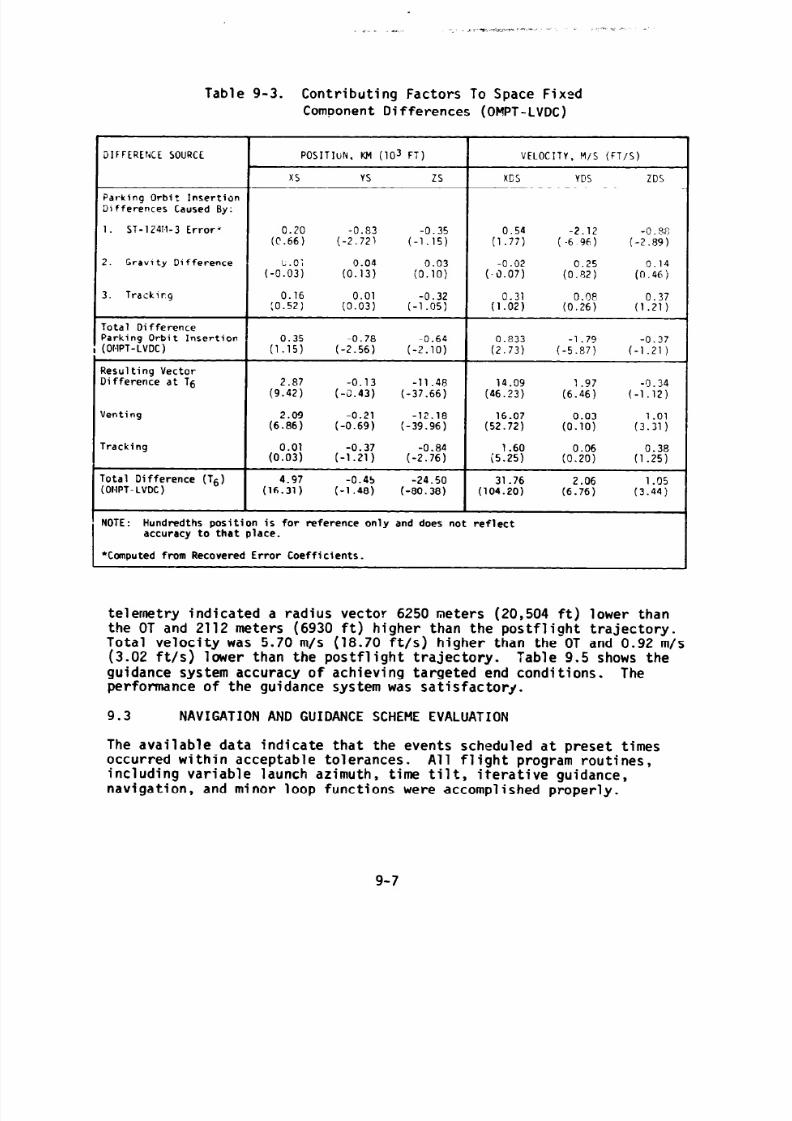
8/7/2019 Saturn V Launch Vehicle Flight Evaluation Report - AS-509 Apollo 14 Mission
http://slidepdf.com/reader/full/saturn-v-launch-vehicle-flight-evaluation-report-as-509-apollo-14-mission 133/254
Table 9-3. Contributing Factors To Space FixedComponent Differences (OMPT-LVDC)
DIFFERENCE SOURCE
Parking Orbit InsertionDifferences Caused By:
1. ST-12411-3 Error'
2. Gravity Difference
3. Trackirg
Total DifferenceParking Orbit Insertion(Dl.lpT-LvDC)
?esulting VectorBfference at T6
tenting
Fracking
POSITIuN . KM (103 FT ) I VELOCITY, M/S (FT/S)
KS YS ZS xcs YDS ZDS
0.20 -0.s3 -0.35(C.66) (-2.721 (-1.15)
c;.CI 0.04 0.03(-0.03) (0.13) (0.10)
0.16 0.01 -0.32(0.52) (3.03) (-1.05)
0.54 -2.12 -0 88(1.77) (-6 96) (-2.89)
-0.02 0.25 0.14(.3.07) (0.82) (D.46)
0.31 0.08 0.37(1.02) (0.26) (1.21)
0.35 -0.78 -0.64(1.15) (-2.56) (-2.10)
0.833 -1.79 -0.37(2.73) (-5.87) (-1.21)
2.87 -0.13 -11.48 14.09 1.97 -0.34(9.42) (-0.43) (-37.66) (46.23) (6.46) (-1.12)
2.09 -0.21 -12.18 16.07 0.03 1.01(6.86) (-0.69) (-39.96) (52.72) (0.10) (3.31)
0.01 -0.37 -0.84 1.60 0.06 0.38(0.03) (-1.21) (-2.76) (5.25) (0.20) (1.25)
4.97 -0.45 -24.50 I 31.76 2.06 1.05
(16.31) (-1.48) (-80.38) (104.20) (6.76) (3.44)
rota1 Difference (16)
[OWT-LVOC)
NOTE: Hundredths position is for reference only and does not reflectaccuracy to that place.
*Computed from Recovered Error Coefficients.
telemetry indicated a radius vector 6250 meters (20,504 ft) lower thanthe OT and 2112 meters (6930 ft) higher than the postflight trajectory.Total velocity was 5.70 m/s (18.70 ft/s) higher than the OT and 0.92 m/s(3.02 ft./s) lower than the postflight trajectory. Table 9.5 shows theguidance system accuracy of achieving targeted end conditions. Theperformance of the guidance system was satisfactory.
9.3 NAVIGATION AND GUIDANCE SCHEME EVALUATION
The available data indicate that the events scheduled at preset timesoccurred within acceptable tolerances. All flight program routines,including variable launch azimuth, time tilt, iterative guidance,navigation, and minor loop functions were accomplished properly.
9-7

8/7/2019 Saturn V Launch Vehicle Flight Evaluation Report - AS-509 Apollo 14 Mission
http://slidepdf.com/reader/full/saturn-v-launch-vehicle-flight-evaluation-report-as-509-apollo-14-mission 134/254
Table 9-4. State Vector Differences at Translunar Injection
PARAMKTER
Ax*. metersw
Ays, meters(ft)
AZ,, metersm.1
AR, metersVt)
.Ax,, m/s
(W*).
Ays, m/s(ft;s)
.AZ,, m/s
m/s)
AVS, m/Sm/s)
OPERATIONAL POSTFLIGHT
TRAJECTORY TRAJECTORYMINUS LVDC MINUS LVDC
45,901 28,082(150,594) (92,133)
150 -1,703(493) (-5,588)
-20,299 -6,236(-66,596) (-20,458)
6,250 -2,112(20,504) (-6,930)
11.65 15.55(38.22) (51.02)
0.69 -2.48(2.26) (-8.14)
39.79 32.26(130.54) (105.84)
-5.70 0.92(-18.70) (3.02)
9.3.1 Variable Launch Azimuth
Due to the unscheduled hold in the countdown at approximately -482seconds, the variable launch azimuth function of the flight program wasrequired to perform over a time variation greater than for any previousvehicle. The shift of range zero time from the nominal value of 20:23:00Universal Time (UT) to 21:03:02 UT resulted in a change of the flightazimuth from 72.067 degrees nominal to 75.5579 degrees. The performanceof the flight program in achieving the targeted parameters was moreaccurate than any previous Saturn/Apollo launch.
The time delta between true UT and UT received by the LVDC was approxi-mately 250 milliseconds. The flight program sensed a UT which yieldedan elapsed time from window opening (TD) of 2440.9414 seconds, while the
correct TD was approximately 2440.6914 seconds. A comparison of the
9-8

8/7/2019 Saturn V Launch Vehicle Flight Evaluation Report - AS-509 Apollo 14 Mission
http://slidepdf.com/reader/full/saturn-v-launch-vehicle-flight-evaluation-report-as-509-apollo-14-mission 135/254
Table 9-5. AS-509 Guidance System Accuracy
EVENT
jarking Orbit[nsertionlerminal
'oint
TranslunarInSectionTenninal
Foint
PARAMETER TARG ETED GUIDANCE GUIDANCE ACHIEVE IACHIEVED MINUS TARGE TED
Inclination, deg 31.114279 31.114285 0.000006
Descending Node, deg 117.43194 117.43231 0.00037
Radius, m 6.563.366.0 6.563.354.6 -11.4
Velocity, m/s 7793.0429 7793.0449 0.0020
Path Angle, deg 0.0 -0.000511 0.000511
Inclination , deg 30.812924 30.813160 0.000236
Descen ding Node, deg 117.40299 117.40258 -0.00041
Twice Speci 1 ic Orbital -1,665,728.0 -1.665.685.3 42.7Energy, m /s2
Eccen tricity 0.97243580 0.97243651 0.00000071
Argument of Perigee, deg -124.19118 -124.19213 -0.00095
results of both TO's is shown for targeting parameters below:
TO
AZ (pirads)
AZ (dedi
A
'3aCQS Ua
na
aa
ea
ACTUAL
2440.9414 2440.6914 0.25OC
0.4197662 0.4197642 0.0000020
75.5579 75.5575 0.0004
31.114276 31.114407 -0.000131
117.4?i91 117.43252 -0.00061
-1,665,727 -1,665,728 -10.9957228 0.9957228 0
-0.6353672 -0.6353672 0
-0.1480349 -0.1480349 0
0.9724502 0.9724502 0
DIFFERENCECORRECTED (ACTUAL-C~RRE~TEO)
The differences are not enough to affect parking orbit noticeablyand the effect was negligible-to-nonexistent at TLI.
9-9

8/7/2019 Saturn V Launch Vehicle Flight Evaluation Report - AS-509 Apollo 14 Mission
http://slidepdf.com/reader/full/saturn-v-launch-vehicle-flight-evaluation-report-as-509-apollo-14-mission 136/254
9.3.2 First Boost Period
All first stage maneuvers were performed within predicted tolerances.The 1.25 degree yaw maneuver was initiated at Tl +1.388 seconds and
terminated at Tl +9.326 seconds. Pitch and roll guidance was initiated atTl t12.244 seconds and the roll maneuver was completed at Tl +27.430seconds. The pitch time tilt polynomial was arrested at Tl t163.518seconds.
Iterative Guidance Mode (IGM) performance for first boost was nominal.The pitch and yaw rate-limited steering commands are illustrated inFigure 9-4. Phase I IGM began properly at T3 t40.6 seconds and wasimplemented at T3 t41.802 seconds. Implementation of IGrl wasaccompanied by a t6.877 degree change in pitch corwnand and a -0.452degree change in yaw command. The time to go in Phase I IGM (TlI)reached zero at approximately T3 t307.4 seconds. The first S-II enginemixture ratio shift switch selector conrnand was issued at T3 t308.749seconds followed by Phase II IGM implementation in the artificial Taumode at T
at309.926 seconds. Real Tau 2 computation was implemented
at T3 +32 .960 seconds with a change in Tau 2 of 18.50 seconds.
The Chi freeze was initiated at the start of T4 and released atTq t9.195 seconds with the implementation of Phase III IGM. The com-manded pitch change at Phase III IGM start was -0.036 degree and thecomnanded yaw change was to.042 degree. The real Tau 3 computation wasimplemented at T4 t20.37 seconds with a -21.9;{ second change in Tau 3.
Tern;inal guidance was initiated at T4 +108.017 seconds and the highspeed cutoff loop was entered at Tq t134.106 seconds. Ten passesthrough the high speed loop were made before S-IVB cutoff. The velocityat the time of the S-IVB velocity cutoff command was 7791.42 m/s'25,562.40 ft/s). Table 9-6 shows the parking orbit insertion parameters.
9.3.3 Earth Parking Orbit
At the start of T5 a Chi freeze was initiated using the gimbal anglereadings on the first pass to establish the commanded angles (Chi's)for the freeze. The local reference maneuver scheduled for T5 +20
seconds was initiated within the one computation cycle tolerance atT5 t21.302 seconds.
The initiation of orbital navigation occurred at T5 t101.533 secondswhich was within the one computation cycle tolerance from the scheduledstart at T5 +lOO seconds. Orbital navigation was terminated and boostnavigation resumed at approximately T6 -9 seconds. The exact time ofboost navigation resumption could not-be determined because of missingtelemetry data, but entry to boost navigation before T6 start tiasconfirmed.
9-10

8/7/2019 Saturn V Launch Vehicle Flight Evaluation Report - AS-509 Apollo 14 Mission
http://slidepdf.com/reader/full/saturn-v-launch-vehicle-flight-evaluation-report-as-509-apollo-14-mission 137/254
Figure 9-4. Attitude Camnands Figure 9-5. Attitude CamnandsDuring Boost-to-EPO During S-IVB Second Bum
9-11

8/7/2019 Saturn V Launch Vehicle Flight Evaluation Report - AS-509 Apollo 14 Mission
http://slidepdf.com/reader/full/saturn-v-launch-vehicle-flight-evaluation-report-as-509-apollo-14-mission 138/254
Table 9-6. Parking Orbit 1nse;tion Parameters
OPERATIONAL POSTFLIGHTPARAMFTER TRAJEC TORY TRAJECT ORY GUILIANCE OMPT LVDC
(OT) (OMPT) (LVDC) HINU; OT MINUS OT
Space-Fixed 7793.058 7792.470 7793.190 -5.5F.7 0.13:Velo city, m/s (ft/s) (25.567.7) (25.565.8) (25.568.2) (-1.4) (0.4)
Geocentric Radius, 6.563,320 6,563.362 6.563.345 r
meters (ft) :21.533 ,158) I (21.533.297) (21.533.242) 03:; (8:s
Flight Path Angle, -0.000787 -0.003050 -0.000746 .-0.002264 0.000041de9
Descending Node.de9
Inclination, deg
Eccentricity
117.429981 117.455978 117.429870 0.025996 -0.3OOill
31.114436 31.120518 31.114338 0.006082 -0.000098
0.000014 D.OOCi57 0.000037 U.000143 0.000023
9.3.4 Second Boost Period
Sequencing of restart preparations by the flight program was accom-plished as predicted. Transfer ellipse targeting was computed and
telemetered just prior to init iation of second burn IGM.
IGM for the S-IVB second burn was implemented at T6 +584.941 secondswith a change of -5.637 degrees in pitch attitude command and a change of0.244 degree in yaw attitude command. The pitch and yaw Chi values areillustrated in Figure 9-5. The post mixture ratio shift IGM phase wasimplemented at T6 +717.020 seconds following the engine mixture ratioshift. Real Tau 3 computations were implemented at T6 +746.418 secondswith a -63.51-second change in Tau 3.
Terminal guidance steering was init iated at T6 +901.893 seconds and
the high speed loop was entered at T6 +926.731 seconds. Three passesthrough the high speed loop were made with the velocity cutoff commandoccurring at the start of the fourth pass. The velocity at the timeof S-IVB cutoff cormnand was 10,231.021 m/s (35,534.85 ft/s). Table 9-7s)hows the TLI parameter;.
9.3.5 Post TLI Period
The local horizontal mareuver was initiated at T7 t151.594 seconds.The Transposition Docking and Ejection (TD&E) naneuver was initiatedat T7 t900.869 seconds. The minor loop Chi's had all reached coFrnandedvalues by T7 t1129.7 seconds. The vehicle had reached the commanded
9-12

8/7/2019 Saturn V Launch Vehicle Flight Evaluation Report - AS-509 Apollo 14 Mission
http://slidepdf.com/reader/full/saturn-v-launch-vehicle-flight-evaluation-report-as-509-apollo-14-mission 139/254
Table 9-7. Translunar Injection Parameters
-
PARAMETERj nDERATICtkL -';;;;W;;",;
TRAZ ECT rRY GL'IOChCE owl L1'DC(CT) !CE PT) ;L1DC) litINS 01 / MINUS OT
Space-Fixed Velocity, lL?,Fls .i'4: 10,824.66~ 10,523.753 6.6251( 5.709
m/ s, (ft/s ) (35.S92.2) :35,513.91 (35.510.9) (21.7) I (lE.7)
Geocentric kadius, f,;lj,936 6,737 7 6.7@9,666 -8361 -6250neters :ft) (22,033,873) (22.5C6.4*2! (22.013.367) (-27 '32) (-20.507)
Cescrrding A-w, ~17.:@0~50 li;.355ill 117.402217 -0.041739 0.00136ideg
Inclirstion, deg 30.E12696 30.513569 39.813378 0.000873 ( 0.000682
Eccentricity G.9:?30i 0.372246 0.972521 -0.000061 0.000214
-1,673,578 -1,678,167 -1,660.602 -4509 12.976(-18,C14,244) :-;6.063,639) i-17.574.571) (-43,395) (139,673)
attitude by T7 +1259.9 seconds. The implementation of post-TLI orbitalnavigation occurred at T7 +151.371 seconds.
At 10,955.861 seconds (03:02:35.861) (Tfrom the H0060-603 measurement (LVDC/LV At1692.389 seconds), telemetrytelemetry) ceased as discussed
in paragraph 15.3.3. No further details of flight program performance areavailable beyond that time. Certain key events can be monitored bydiscrete telemetry but no navigation or guidance information is available.
9.a GUIDANCE SYSTEM COMPONENT EVALUATION
9.4.1 LVDC and LVDA Performance
The LVDC and LVDA and all constituent circuits and modules performed
nominally with the exception of one hardware monitor measurement. Thetelemetered status of the monitor did not reflect the true state of theassociated hardware, switch selector register bit 5.
The LVDC flight program steps in commanding a switch selector functioninclude the following:
a. Execute a switch selector stage select and address ccmnand fora given switch selector function to set the LVDA switch seiectorregister.
b. Effect a time delay to ensure that at least one of the four LVDAData Output Multiplexer (DOM) storage channels will accept data.
9-13

8/7/2019 Saturn V Launch Vehicle Flight Evaluation Report - AS-509 Apollo 14 Mission
http://slidepdf.com/reader/full/saturn-v-launch-vehicle-flight-evaluation-report-as-509-apollo-14-mission 140/254
C. Execute a Process Input/Output (PIO) command to read the status ofthz LVDA Switch Selector Register and Giscrete Output Registerdrover outputs (SSDO word) which are stored in DOM for telemetry viameasurement H0060-603.
For each switch selector function conmand that required a logical oneoutput from switch selector regisier bit 5, the SSDO word indicatedthat bit 5 was a logical zero. For each case, the switch selectorfunction and switch selector feedback outputs were correct. Therefore,the failure mechanism did not affect the SS5 driver output function.
A review of z/stern test data indicates that the failure was present atliftoff and occurred prior to or during IU-509 systems test. Furtherinvestigation revealed that the LVDA component level testi as presentlyconfigured will not detect the observed failure. Recommendation ofchanges to the LVDA component level tests and to systems test dataevaluation are in progress.
The multiplexer latch and multiplexer serializer logic circuits andthe telemetry storage select and delay iine logic circuits throughwhich the 555 driver output status signal flows are common with otherdata signal flow. The only circuits which are unique to the 555 driveroutput monitor are Discrete Input, Type A(DIA) circuit, AND circuit,2nd interconnecting networks from the 555 driver to the multiplexerlatch input (DM7A). The failure mechanism, therefore, is constrainedto these circuits.
For the observed indications, any mechanism which could produce theequivalent effect of a voltage, 2 2.5 vdc, at point A of the circuitin Figure 9-6 is a possible cause of the failure which existed betweenpoints B and C.
9.4.2 ST-124M-3 Stabilized Platform Subsystem
T+e ST-124M-3 Stabilized Platform Subsystem (ST-124M-3 SPS) operatedwithin desired limits through the first 13,900 seconds (03:51:40) offlight as depicted in available data. Although the vibration levelsat liftoff were slightly higher than those on IU-508, no accelerometeranomalies were in evidence.
Proper servo loop response was evident at liftoff. Pickoff deflectionsat Command and Service Module (CSrl) separation were lower than on IU-508.Pickoff deflections were:
x gym
Y gyro
Z w-0
AS-509 AS-508
0.67"P-P 1.6"P
O.l7OP-P 0.32"P-P
0.41"P-P 1.36"P-P
9-14

8/7/2019 Saturn V Launch Vehicle Flight Evaluation Report - AS-509 Apollo 14 Mission
http://slidepdf.com/reader/full/saturn-v-launch-vehicle-flight-evaluation-report-as-509-apollo-14-mission 141/254
rcITO
sss TO RETA7A
SUITCJ4 SELECTOR 1SIGRET
Figure 9-6. Switch Selector Bit 5 Driver Monitor Circuit
As on previous vehicles, oscillations of D.2S"P-P at approximately5 hertz were in evidence on the Z* gyro pickoff before and after S-ICCECO. Also, spurts of 2.5 hertz at @.l"P-P were noted on the Z** 9yropickoff just prior to S-II CECO.
The accelerometer servo loops operated properly even though the vibrationlevels at liftoff were slightly higher than those on IU-508 where avelocity anomaly occurred. As on previous vehicles, the E0009-603measurement showed a slightly higher burst of vibration at 3.3 seconds.This is the time period where the velocity anomalies occurred on IU-506and IU-508. As can be seen on Figure 9-7. the Y (crossrange) accelero-meter pickoff perturbation was small in this time period.
At CSM separation the accelerometer gyro pickoff deflections werecomparable to that of IU-508:
AS-509 AS-508
X 0.95OP-P l.D"P-P
Y 2.5OP-P 2.9"P-P
Z 2.5"P-P 2.2OP-P
l On AS-508, this was erroneously reported as being on the X gyro pickoff.*On AS-508, this was erroneously reported as being on the Y gyro pickoff.
9-15

8/7/2019 Saturn V Launch Vehicle Flight Evaluation Report - AS-509 Apollo 14 Mission
http://slidepdf.com/reader/full/saturn-v-launch-vehicle-flight-evaluation-report-as-509-apollo-14-mission 142/254
8/7/2019 Saturn V Launch Vehicle Flight Evaluation Report - AS-509 Apollo 14 Mission
http://slidepdf.com/reader/full/saturn-v-launch-vehicle-flight-evaluation-report-as-509-apollo-14-mission 143/254
SECT1014 10
COUTROL AND SEPARATION
10.1 SUMCiARY
The AS-509 control system, which was essentially the same as the AS-508,performed satisfactorily. The Flight Control Computer (FCC), ThrustVector Control (TVC) System, and Auxiliary Propulsion System (APS)satisfied all requirements for vehicle attitude control during theflight. Bending and slosh dynamics were adequately stabilized. Theprelaunch programed yaw, roll, and pitch maneuvers were properly executedduring S-IC boost.
During the maximum dynamic pressure region of flight, the launch vehicleexperienced winds that were less than 95-percentile January winds. Themaximum average pitch and yaw engine deflections were in the maximumdynamic pressure region.
S-IC/S-II first and second plane separations were accomplished with no
significant attitude deviations. Related data indicate that the S-ICretromotors performed as expected. At Iterative Guidance Mode (IGM)initiation, a pitchup transient occurred similar to that seen on previousflights. The S-II retromotors and S-IVB ullage motors performed asexpected and provided a normal S-II/S-IVB separation.
Satisfactory control of the vehicle was maintained durin first and secondS-IVB burns and during coast in Earth Parking Orbit (EPO3 . During theCormnand and Service Module (CSM) separation from the S-IVB/InstrumentUnit (IU) and during the Transposition, Docking, and Ejection (TDLE)maneuver, the control system maintained the vehicle in a fixed inertialattitude to provide a stable docking platform. Following TD&E, S-IVB/IUattitude control wzs maintained during the evasive maneuver, the maneuverto lunar impact attitude, and the LOX dump and APS burn.
10.2 S- IC CONTROL SYSTEM EVALUATION
The AS-509 control system performed satisfactorily during S-IC poweredflight. The vehicle flew through winds which were less than 95 percentilefor January in the maximum dynamic pressure region of flight. Less than10 percent of the available engine deflect ion was used throughout theflight (based on average engine gimbal ang le). The S-K outboard eng inescanted as planned.
10-l

8/7/2019 Saturn V Launch Vehicle Flight Evaluation Report - AS-509 Apollo 14 Mission
http://slidepdf.com/reader/full/saturn-v-launch-vehicle-flight-evaluation-report-as-509-apollo-14-mission 144/254
All dynamics were within vehicle capability. In the region of highdynamic pressure, the maximum angles of attack were approximately2.6 degrees in pitch and 3.9 degrees in yaw. The maximum averagepitch and yaw engine deflections were -0.4 degree and 0.5 degree,respectively, in the maximum dynamic pressure region. Doth deflec-tions were due to wind shears. ihe absence of any divergent bendingor slosh dynamics showed that these modes were adequately stabilized.
Vehicle attitude errors required to trim out the effects of thrustunbalance, thrust misalignment,within predicted envelopes.
and control system misalignments wereVehicle dynamics prior to S-IC/S-II first
plane separation were within staging requirements.
Maximum controi parameters during S-IC burn are listed in Table 10-1,pitch and yaw attitude error time histories are shown in Figure 10-l.Dynamics in the region between liftoff and 40 seconds resulted pri-
marily from guidance commands. In the region between 40 and 110 seconds,maximum dynamics were caused by the pitch tilt program, wind magnitude,and wind shears. Dynamics from 110 seconds to separation were causedby high altitude winds, separated air flow aerodynamics, center engineshutdown, and tilt arrest. The transient at Center Engine Cutoff (CECO)indicates that the center engine cant was 0.23 degree in pitch and0.15 degree in yaw.
The attitude errors between liftoff and 20 seconds indicate that theequivalent thrust vector misali.gnments prior to outboard engine cantwere -0.02, 0.0, and -0.02 degree in pitch, yaw, and roll, respectively.
Table 10-l. Maximum Control Parameters During SIC Flight
PITCH PLANE YAW CLANE F'LL PLAN6
QANCE QANGE R4NtEPARAMETER AMPLITUDE TIME AMPLITUDE TIME AMPLITUDE TIME
(SEC) (SEC) (SEC)
Attitude Error, deg 0.91 95.0 -1.26 4 . 3 -0.40 Id.@
Angular Rate, deg/s -1.0 03.5 -0.52 00.0 1.2 1 5 :2
Average Gimbal -0.39 . 84.5 0.51 76.5Angle, deg
Angle-of-Attack, deg 2.57 76.8 3.90 ?6.8
Angle-of-AttackDyllamic PressureProduct, deg-N/cm2 7.97(deg-lbf/ft2) 77.0 12.1 77.0
(1660) (2530)
NormalAcceleration, m/s2 -0.34 90.0(ft/s2)
0.69 75.5(-1.12) (2.26)
10-2

8/7/2019 Saturn V Launch Vehicle Flight Evaluation Report - AS-509 Apollo 14 Mission
http://slidepdf.com/reader/full/saturn-v-launch-vehicle-flight-evaluation-report-as-509-apollo-14-mission 145/254
VBEGIN YAW M4NEUVERVEND YAW MANEUVER, 9.9
BEGIN PITCH/ROLL MANEUVER, 12.8OUTBOARD ENGINE CANT
-MEASURED----SIMULATED
VMAX QV FIRST GAIN SWITCHv SECOND GAIN SWITCHv S-IC CECO'qy TILT ARREST, S-IC DECO
1.61 ,I I I I I I I I I I I I I
0
-..fj.!##+1.6
0.8
-0.8
-1.660 80 100 120 140 160
RANGE TIME, SECONDS
Figure 10-l. Pitch and Yaw Plane Dynamics During S-IC Burn
10-3

8/7/2019 Saturn V Launch Vehicle Flight Evaluation Report - AS-509 Apollo 14 Mission
http://slidepdf.com/reader/full/saturn-v-launch-vehicle-flight-evaluation-report-as-509-apollo-14-mission 146/254
These errcrs are required to trim out the effects of thrust unbalance,offset Center-of-Gravity (CG), thrust vector misalignment, and controlsystem misalignments. The equivalent thrust vector misalignments afteroutboard engine cant were 0.03, 0.01, and 0.01 degree in pitch, yaw, androll, respectively.
The predicted and measured misalignments, slow release forces, winds,and thrust-to-weight ratio are shown in Table 10-2.
Table 10-2. AS-509 Liftoff Misalignment Sumnary
PREFLIGHT PREDICTED LAUNCHPARAMETER
PITCH YAW ROLL PITCH YAW ROLL
Thrust Misalignment, to.34deg*
f0.34 to.34 -0.02 0.0 -0.02
Center Engine Cant, - - - 0.23 0.15 -degServo Amp Offset, +D.l to.1 fD.l - -degleng
Vehicle Stacking 6 to.29 f0.29 0.0 -0.05 0.05 -0.02Pad Misalignment,degAttitude Error at
Holddown ArmRelease, deg
-0.11 0.01 0.01
Peak Soft ReleaseForce Per Rod,N(lbf)
Wind
Thrust to Weight
Ratio
415,900 (93.500) Data Not Available
19.55 m/s (38 knots)8.5 m/s**(16.5 knots:at 161.5 meters at 161.5 meters
(530 feet) (530 feet)
1.177 1.213+
*Thrust misalignment of 0.34 degree encompasses the centerengine cant. A positive polarity was used to determineminimum fin tip/umbil'cal tower clearance. A negative polaritywas used to determine vehicle/GSE clearances.
b*One minute average about T-O.+Determined by simulating vehicle rise history recorded by
camera during launch.
10-4

8/7/2019 Saturn V Launch Vehicle Flight Evaluation Report - AS-509 Apollo 14 Mission
http://slidepdf.com/reader/full/saturn-v-launch-vehicle-flight-evaluation-report-as-509-apollo-14-mission 147/254
Because of the DPl-A0 multiplexer data loss reported in paragraph15.3.2, pitch and yaw angle-of-attack measurements are not available.Figure 10-Z shows the simulated pitch, yaw, and total angles ofattack compared to those calculated from postflight trajectoryparameters. A total angle-of-attack measurement was available from
spacecraft telemetry. This measurement is shown in Figure 10-3.The peak angle-of-attack measured at the Q-Ball during the highdynamic pressure region of flight was 4.76 degrees.
10.3 S-II COUTROL SYSTEM EVALUATION
The S-II stage attitude control system performance was satisfactory.The maximum values of pitch and yaw control parameters occurred inresponse to IGt4 Phase 1 initiation. The maximum values of roll controlparameters occurred in response to S- IC/S-II separation disturbances.The response at other times was within expectations. The maximum controlparameter values for the period of S-II burn are shown in Table 10-3.
Betwen the events of S-IC Outboard Engine Cutoff (OECO) and initiationof IGfl, the attitude cotmnands were held constant. Significant eventsoccurring during that interval were S-IC/S-II separation, S-II stageJ-Z engine start, second plane ,eparation, and Launch Escape Tcwer(LET) jettison. The attitude control dynamics throughout this intervalindicated stable operation as shown in Figure 10-4. Steady state atti-tudes were achieved within 20 seconds of S-IC/S-II separation.
At IGt4 initiation the FCC received TVC commands to pitch the vehicle upand then down. The transient magnitudes experienced were similar to
previous flights.
At S-II CECO the guidance routines reacted properly to the decrease intotal thrust. The attitude commands that resulted were similar tonominal CECO conditions except that the magnitudes were somewhat higher(See Figure 10-4). Differences between the two can be accounted forlargely by engine location misalignments, thrust vector misalignments,and uncertainties in engine thrust buildup characteristics.
10.4 S-IVB CONTROL SYSTEM EVALUATION
The S-IVB TVC system provided satisfactory pitch and yaw control duringpowered flight. The APS provided satisfactory roll control during firstand second burns.
During S-IVB first and second burns , control system transients wereexperienced at S-II/S-IVB separation, guidance initiation, Engine MixtureRatio (EMR) shift, terminal guidance rode, and S-IVB Engine Cutoff (ECO).These transients were expected and were well within the capabilities ofthe control system.
10-5

8/7/2019 Saturn V Launch Vehicle Flight Evaluation Report - AS-509 Apollo 14 Mission
http://slidepdf.com/reader/full/saturn-v-launch-vehicle-flight-evaluation-report-as-509-apollo-14-mission 148/254
DBEGIN YAW MANEUVER VMAXQa END YAW MANEUVER, 9.9
vvi!RST GAIN SWITCH
BEGIN PITCH/ROLL MANEUVER, 12.8 VSECOND GAIN SWITCH' OUTBOARD
v
ENGINE CANT VS-IC CECO
END ROLL MANEUVER v TILT ARREST, S-IC OECOVMACH 1
-CALCULATED FROM OBSERVED TRAJECTORY---- SIMULATED
I I I I’.1 I I I I I I I I I1 I I1!II
0 20 40 60 80 100 120 140 160RANGE TIME, SECONDS
Figure 10-2 Angle-of-Attack During SIC Bum
10-6

8/7/2019 Saturn V Launch Vehicle Flight Evaluation Report - AS-509 Apollo 14 Mission
http://slidepdf.com/reader/full/saturn-v-launch-vehicle-flight-evaluation-report-as-509-apollo-14-mission 149/254
MACH1
vAX
QVFIRST GAIN SWITCH
m--s CALCULATED FROM Q-BALLSIMULATED
PSECOND GAIN SWITCHVS-IC CECOVTILT ARREST, S-IC OECO
20 40 60 80 100 120 140
RANGE TIME, SECONDS
Figure 10-3. Total Angle-of-Attack at Q-Ball
160
10-7

8/7/2019 Saturn V Launch Vehicle Flight Evaluation Report - AS-509 Apollo 14 Mission
http://slidepdf.com/reader/full/saturn-v-launch-vehicle-flight-evaluation-report-as-509-apollo-14-mission 150/254
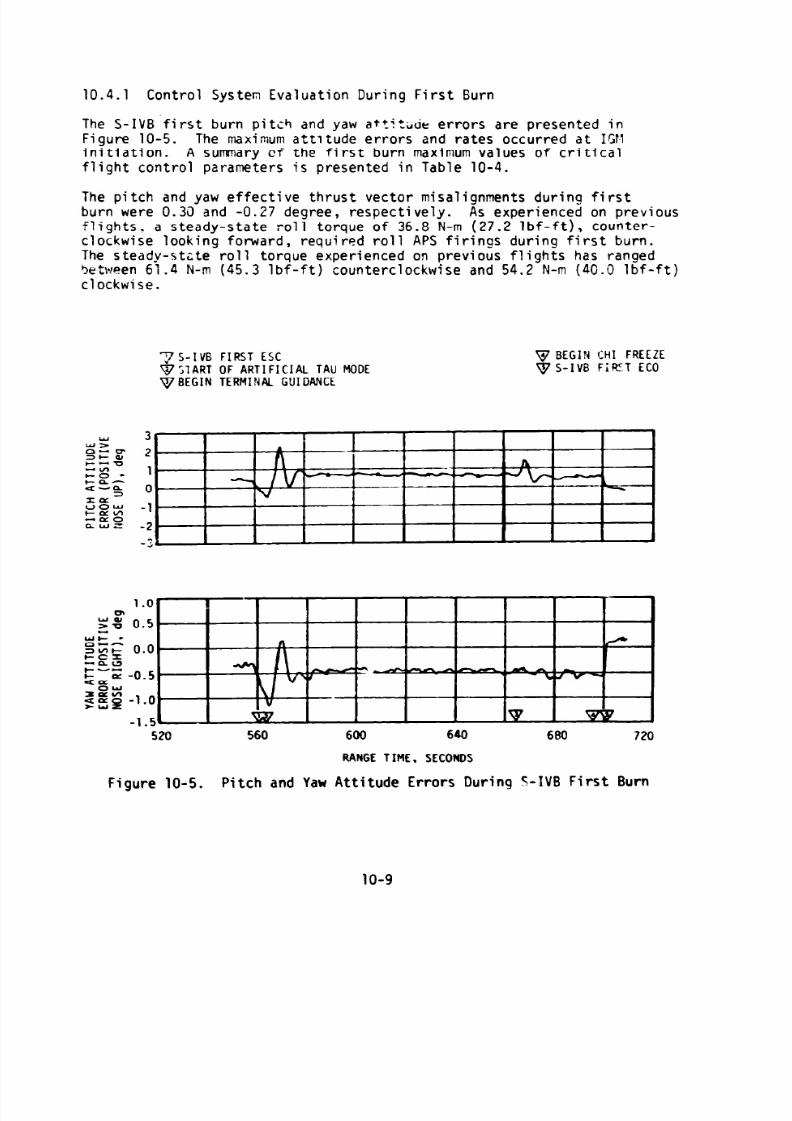
8/7/2019 Saturn V Launch Vehicle Flight Evaluation Report - AS-509 Apollo 14 Mission
http://slidepdf.com/reader/full/saturn-v-launch-vehicle-flight-evaluation-report-as-509-apollo-14-mission 151/254
10.4.1 Control System Evaluation During First Burn
The S-IVB first burn pitch and yaw at+jt~& errors are presented inFigure 10-S. The maximum attitude errors and rates occurred at IGMinitiation. A summary of the first burn maximum values of criticalflight control parameters is presented in Table 10-4.
The pitch and yaw effective thrust vector misalignments during firstburn were 0.30 and -0.27 degree, respectively. As experienced on previousflights. a steady-state roll torque of 36.8 N-m (27.2 lbf-ft), counter-clockwise looking forward, required roll APS firings during first burn.The steady-state roll torque experienced on previous flights has rangedbetween 61.4 N-m (45.3 lbf-ft) counterclockwise and 54.2 N-m (40.0 lbf-ft)clockwise.
TS-IV6 FIRST ESC V BEGIN CHI FREEZEg;lART OF ARTIFICIAL TAU MODE VS-IV8 FiRT EC0VBEGIN TERMINAL GUIDANCE
1.00,
g% 0.5WI- -;zE 0.0-na+-zz&z -0.5
I",ng -1.0
-1.5520 560 600 640 680 720
RANGE TIME, SECONDS
Figure 10-5. Pitch and Yaw Attitude Errors During S-IVB First Burn
10-g

8/7/2019 Saturn V Launch Vehicle Flight Evaluation Report - AS-509 Apollo 14 Mission
http://slidepdf.com/reader/full/saturn-v-launch-vehicle-flight-evaluation-report-as-509-apollo-14-mission 152/254
Table lCl-4. Maximum Control Parameters During S-IYB First Burn
r---_ -_-___ -_-__
P!?C!! P?ANE!? C! ! P?ANE YW PLANEW PLANE ROLL PLANEOLL PLANE
PPRAMITERPRAMITER AYPtIiiJDEYPtIiiJDE RANGE ilMEANGE ilME AMPLITUDEMPLITUDE RINGE T! YEINGE T! YE AMPLITUDEMPLITUDE RANGi TIMEANGi TIME!sr':sr': (SEC)SEC) (SEC)SEC)
Attitude trror. degttitude Error. deg 2.34.34 570.170.1 -1.221.22 564.464.4 -0.770.77 568.868.8
Angular Rate. deg.5ngular Rate. deg.5 -1;zj1 ;zj 571.371.3 0.47.47 567.067.0 0.45.45 560.260.2
I
k*lmum Gltidl*lmum Gltidl 1 3636 569.769.7 -1.;1.; 564.364.3Angle, degngle, deg
I
c
Propellant sloshing during first burn was observed on data obtained fromthe Propellant Utilization (HI) mass probe sensors. The propellant sloshdid not have any noticeable effect on the operation of the attitlrde controlsystem.
10.4.2 Control System Evaluation During Parking Orbit
The APS provided satisfactory orientation and stabilization during parking
orbit. Following S-IVB first ECO, the vehicie was maneuvered to theinplane local horizontal and th: orbital pitch rate was established. Thepitch attitude error for parking orbit is shown in Figure 10-6.
10.4.3 Control System Evaluation During Second Burn
The S-IVB second burn pitch and yaw attitu+ errors are presented inFigure 10-7. The maximum attitlrde errors and rates occurred at IGM init ia-tion. A summary of the second burn maximum values of critical fiight con-trol parameters is presented in Table 10-5. Control system attitude errcrtransients resulted from pitch and yaw attitude commands at the termination-c l keVI arti c: pi alCllL -. -.I IL4.A. Tau guidance mode (E!IR shift plus 30 seconds).
The pitch and yati effective thrust vrctcr misalignments during secondburn were approximately 0.43 and -0.29 degree, respectively. The steady-state roll torque during second burn ranged from 36.6 N-m (27.0 lbf-ft),counterclockwise looking forward, at the low MR to 29.6 N-,rn (21.8 lbf-ft)at the 5.O:l.O Er?R.
iO-10

8/7/2019 Saturn V Launch Vehicle Flight Evaluation Report - AS-509 Apollo 14 Mission
http://slidepdf.com/reader/full/saturn-v-launch-vehicle-flight-evaluation-report-as-509-apollo-14-mission 153/254
v S-IVB FIRST EC0g BEGIN MANEUVER TO LOCAL HORIZONTAL ATTITUDE
0
-1
-2
-3300 550 600 650 700 750 800 850 900
RANGE TIME, SECONDS
Figure 10-6. Pitch Attitude Error During Parking Orbit
950
Propellant sloshing during second burn was observed on data obtainedfrom the PU mass probe sensors. The propellant slosh did not have anynoticeable effect on the operation of the attitude control system.
10.4.4 Cortrol System Evaluation After S-IVB Second Bum
The APS provided satisfactory orientation and stabilization from Trans-lunar Injection (TLI) through the S-IVB/IU Passive Thermal ControlManeuver ("Barbecue Maneuver"). Each of the planned maneuvers was per-formed satisfactorily although the maneuvers after spacecraft separationwere delayed due to the delay in spacecraft docking. Effects of thedelay in dockinq on attitude control is discussed below. Effects oftelemetry data loss on evaluation of attitude control is also discussedbelow.
Significant periods of interest related to translunar coast attitudeconYo1 were the maneuver to the inplane local horizontal followingsecond ECO, the maneuver to the TO&E attitude, spacecraft separation,spacecraft docking, Lunar Module (LM) ejection, the maneuver to theevasive ullage burn attitude, the maneuver to the LOX dump attitude,the maneuver to the lunar irrpact ullage burn attitude, and the "BarbecueManeuver." The pitch attitude error for events during which telemetrydata were available is shown in Figure 10-8;
Following S-IVB second ECO, control response to the maneuver to theinplane local horizontal and tne maneuver to the separation TO&Eattitude was nominal.
10-11

8/7/2019 Saturn V Launch Vehicle Flight Evaluation Report - AS-509 Apollo 14 Mission
http://slidepdf.com/reader/full/saturn-v-launch-vehicle-flight-evaluation-report-as-509-apollo-14-mission 154/254

8/7/2019 Saturn V Launch Vehicle Flight Evaluation Report - AS-509 Apollo 14 Mission
http://slidepdf.com/reader/full/saturn-v-launch-vehicle-flight-evaluation-report-as-509-apollo-14-mission 155/254
Table 10-5. Maximun Control Parmters During S-IVB Second Burn
TPARAFTTER
Attitude Error. deg
Angular Rate. degfs
Maxine GimbalAngle, deg
PlTC'
AMPLITUDL
2.6
-1.1
1.31
e923.7 -0.85 1 8911.3
I
8926.0 0.35 892b. 0 0.16 8990.0
8923.2 -0.76 8913.2
0. ?5 8989.5
Nominal APS engine firings were noted during three docking attempts;11,690 seconds (03:14:50), 12,220 seconds (03:23:40), and 16,340 seconds(04:32:20).
S-IVB VHF telemetry data were available to 13,655 seconds (D3:47:35).The lack of available data after this time resulted in the loss of atti-tude error data, angular rate data, and APS chamber pressure data. TheAPS control relay operation continued *:a be telemetered via the DPl-BO
multiplexer.
The reaction to spacecraft docking, which occurred at 17,816 seconds(04:56:56), appeared to be normal. Yaw-roll disturbon:zs were slightlylarger than those experienced on previous flights. LM ejection occurredat 20,834.4 seconds (05:47:14.4) with nominal disturbances.
At 21,330 seconds (05:55:30), a maneuver was initiated to attain thedesired attitude for the evasive ullage burn. This involved maneuveringfrom the TD&E yaw attitude of -40.9 degrees to +40.0 degrees. At21,842 seconds (06:04:02), the APS ullage engines were commanded on
for 80 seconds to provide the necessary separation distance betweenthe S-IVB/IU and the spacecraft.
The maneuver to the LOX dump attitude was performed at 22,423 seconds(06:13:43) and appeared to be nominal.(06:25:20) and lasted for 48 seconds.
LOX dump occurred at 23,120 seconds
10-13'

8/7/2019 Saturn V Launch Vehicle Flight Evaluation Report - AS-509 Apollo 14 Mission
http://slidepdf.com/reader/full/saturn-v-launch-vehicle-flight-evaluation-report-as-509-apollo-14-mission 156/254
v BEGIN MAliEUVER TO LOCAL HORIZON‘IAL ATTITUDEv BEGIN MApEUVEi? TO TDBE ATTITUDE
LA?v SPACECRAFT SEPARITION
o- 'J 4q
3t- aJt;5;- 2 WEE?-u-n- o+.- --___--
pz =-2' -- ----. ._
zzg-49400 9415 9430 9445 9460 9475 9490 9505 9520 9535 9550
RANGE TiMC, SECONDS
II 1 1 I I 4
2:36:40 2:37:10 2:37:40 2:38:10 2:38:40 2:39:10
RANGE TIME, HOURS:MINUTES:SECONDS
Ad&o-cn23+-Qt;5;= 0LC'Z-u-n-2 3zfsu-4LEi::nwz -6
10.110 10,160 10,210 10,260 10,310 10,360 10,410 10,460 10.510 10,560 10,610RANGE TIME, SECONDS
J v I I I I 12:48:30 2:SO:lO 2:51:50 2:53:30 2:55:10 2:56:50
RANGE TIME, HOURS:MINUTES:SECONDS
11,000 11.025 11.050 11,075 11.100RANGE TIME. SECONDS
I IV I I 13:01:40 3:02:30 3:03:2o 3:04:10 3:os:oo
RANGE TIME. HOURS:MINUTES:SECONDS
Figure 10-8. Pitch Attitude Error During Translunar Coast
10-14

8/7/2019 Saturn V Launch Vehicle Flight Evaluation Report - AS-509 Apollo 14 Mission
http://slidepdf.com/reader/full/saturn-v-launch-vehicle-flight-evaluation-report-as-509-apollo-14-mission 157/254
At 31,421 seconds (08:43:41), a ground command was sent to perform anianeuver to the desired attitude for the APS ullage burn for lunar targetimpact. This was a two-axis maneuver and resulted in a pitch maneuverof -3.0 degrees and a yaw attitude maneuver of -4.0 degrees. At 32,399 sec-
Qnds (08:59:59), the APS ullage engines were corrmanded on for 252 secondsto provide i:V for lunar target impact.
At 42,082 seconds (11:41:22), the S-IVB was comnanded via Digital CommandSystem (DCS) to maneuver in the negative pitch and positive yaw directionsand establish corresponding rates of 0.3 deg/s. Following ini tiation ofthe maneuver, a DCS command was issued at 42,116 seconds (11:41:56) toinhibit the FCC leaving the S-IVB/IU in a "Barbecue" or tumble mode untillunar impact.
APS propellant consumption for attitude control and propellant settlingprior to the APS burn for lunar target impact was slightly higher thanthe mean predicted requirements. The total propel?ant (fuel and oxidizer)used prior to the ullage burn for lunar impact AV was 59.8 kilograms(131.9 lbm) and 59.1 kilograms (130.0 lbm) for Modules 1 and 2, respec-tively. This was 40.0 and 39.5 percent of the total available in eachmodule (approximately 150.0 kilogram [330.1 lbm]). p,PS propellant con-sumption is tabulated in Section 7, Table 7-4.
10.5 INSTRUMENT UNIT CONTROL COMPONENTS EVALUATION
The Flight Program Minor Loop implemented all guidance corrmands, providingsatisfactory attitude error outputs through the Launch Vehicle Data Adapter(LVDA) to the FCC. No Minor Loop Error Telemetry occurred during themission. The FCC and control rate gyros functioned predictably and satis-factorily throughout the mission.
10.6 SEPARATION
S-IC/S-II separation and associated sequencing war accomplished as planned.S-IC end conditions at separation fell within estimated limits, and wellwithin the staging limits. The AS-509 measured longitudinal accelerationof the S-IC dropped stage was similar to previcus vehicles. Pitch and yawrate measurements showed no disturbances, indicating normal staging.
Seconc plane separation occurred as predicted. There were no vehicleattitude disturbances attributed to the second plane separation. Cal-culations indicate that the separation dynamics were similar to previousflights.
k
S-II/S-IVB separation was normal with nominal S-II retromotor and S-IV6ullage motor performance. Vehicle dynamics were well within staginglimits.
Vehicle dynamics were normal during CSM separation and the TD&Emaneuver.
The vehicle maintained a stable docking platform during the several dockingattempts.
lo-15/10-16
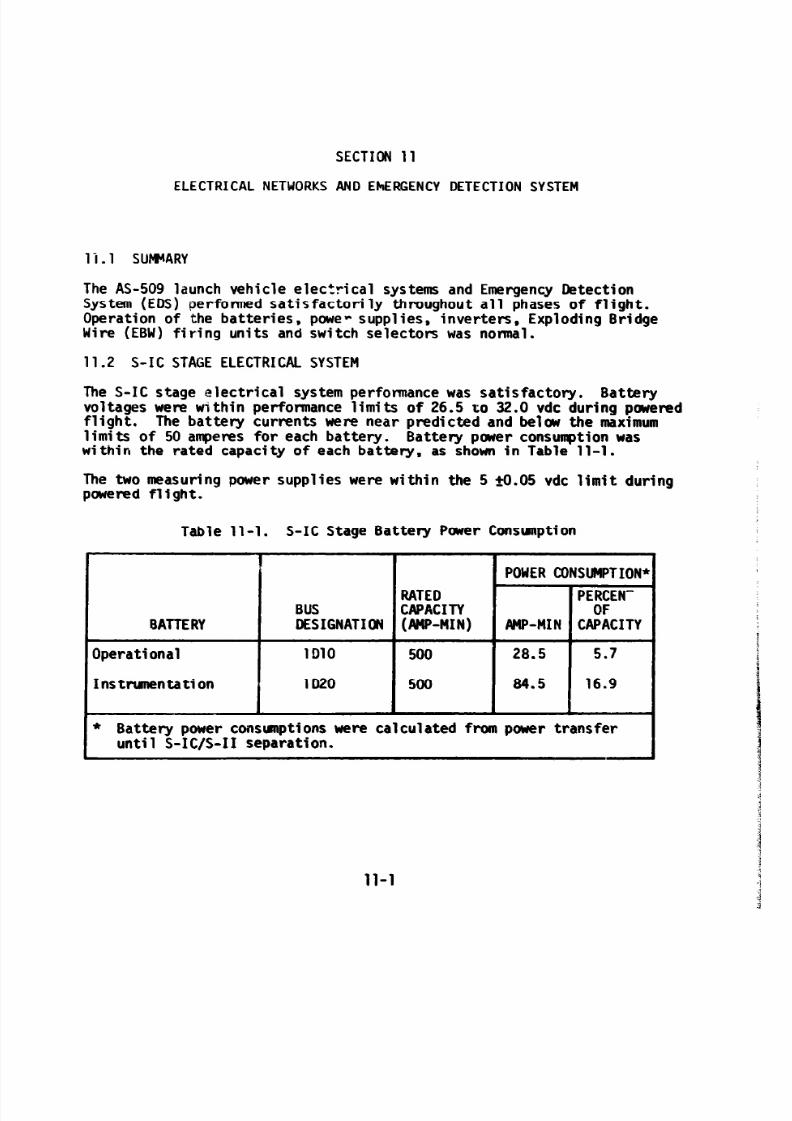
8/7/2019 Saturn V Launch Vehicle Flight Evaluation Report - AS-509 Apollo 14 Mission
http://slidepdf.com/reader/full/saturn-v-launch-vehicle-flight-evaluation-report-as-509-apollo-14-mission 158/254
SECTION11ELECTRICAL NETWORKS AND EhERGENCY DETECTION SYSTEM
li.1 SUGARY
The AS-509 launch vehicle electrical systems and Emergency DetectionSystem (EDS) performed satisfactorily throughout all phases of flight.Operation of the batteries, powe- supplies, inverters, Exploding BridgeWire (EBW) firing units and switch selectors was normal.
11.2 S-IC STAGE ELECTRICAL SYSTEM
The S-IC stage electrical system performance was satisfactory. Batteryvoltages were tithin performance limits of 26.5 to 32.0 vdc during poweredflight. The battery currents were near predicted and belaw the maximumlimits of 50 amperes for each battery. Battery power consumption waswithin the rated capacity of each battery, as shown in Table 1l-l.
The two measuring power supplies were within the 5 20.05 vdc limit duringpowered flight.
Table 11-l. S-IC Stage Battery Power Consuaption
POWER CONSUMPTION*
RATED PERCEN-BUS CAPACITY OF
BATTERY DESIGNATION (AMP-MIN) AMP-MINCAPACITY
Operational lDl0 500 28.5 5.7
Instrunentation 1020 500 84.5 16.9
* Battery power consunptions were calculated from power transferuntil S-IC/S-II separation.
11-l

8/7/2019 Saturn V Launch Vehicle Flight Evaluation Report - AS-509 Apollo 14 Mission
http://slidepdf.com/reader/full/saturn-v-launch-vehicle-flight-evaluation-report-as-509-apollo-14-mission 159/254
All switch selector channels functimed as ccmvnanded by the InstrunentUnit (I;') and uerv within required tinr limits.
The seprratian and re?roAlotor EBW firing unit; were armed and triggered
as progrand. Charging time and voltage characteristics were withinperfcimliance limits.
The range safety corvnand system EBH firing units were in the requiredstate-of-readiness if vehicle destruct had been necessary.
11.3 S-11 ST&X ELECTRICAL SYSTEM
The S-II stsge electrical system performed satisfactorily. Batteryvoltages remained within specified limits through the prelaunch and flightperiods. Bus currrnts also mained within required and predicted limits.
Main bus currtnt averaged 37 weres during S-IC boost and varied from4B to 53 rapem during S-II boost. Instrumentation bus current averaged21 rapcrps during SIC and S-II boost.90 anperes during SIC boost.
Recirculation bus curlont averagedIgnition bus current averaged 30 amperes
during the S-II ignition sequence. Battery power consunption was withinthe rated capacity of each battery, as shown in Table 11-2.
The five tmperature bridge power supplies, the three instrumentationpower supplies, and the five LH2 inserters all performed within acceptablelimits.
All switch selector channels functioned as commanded by the IU and werewithin rpquired time limits.
Table 11-2. S-11 Stage Battery Power Consunption
BAllTRY
Main
Instrrrrntation
Recirculation No. 1
Recirculation No. 2
BUSDESIGNATICM
2011
2D21
2D51
2051and2061
35 14.58 41.7
35 9.86 28.2
30 12.23 40.8
30 12.27 40.9
I8attcy pauer cohsurptions were calculated fmn activation untilS-II/S-IV6 separation and include 6.1 AMP-HR consuned during thebattery activatim procedure.
11-2

8/7/2019 Saturn V Launch Vehicle Flight Evaluation Report - AS-509 Apollo 14 Mission
http://slidepdf.com/reader/full/saturn-v-launch-vehicle-flight-evaluation-report-as-509-apollo-14-mission 160/254
Performance of the EBW circuitry for the separation systems was satisfac-tory. Firing units charge and discharge responses were within predictedtime and voltage limits. The range safety command system EBW firing unitswere in the required state-of-readiness if vehicle destruct had been
necessary.11.4 S-IVB STAGE ELECTRICAL SYSTEM
The S-IVB stage electrical system performance was satisfactory. Thebattery voltages, currents, and temperatures remained within the normalrange beyond the required battery lifetime. Forward No. 2 battery depletedat 30,560 seconds (08:29:20) aiter supplying 111.2 percent of the ratedcapacity. Battery voltage and currents are shown in Figures 11-l through11-4. Battery power consumption and capacity for each battery are shownin Table 11-3.
The three 5-vdc and seven 20-vdc excitation modules all performed withinlldown inverters performed satisfac-cceptable limits.
torily.The LOX and LH2 chi
All switch selector channels functionedwithin required time limits.
as commanded by the IU and were
Performance of the EBW circuitry for the separation system was satisfactory.Firing urits charge and discharge responses were within predicted timeand voltage limits. The range safety carmand system EBW firing units werein the required state-of-readiness if vehicle destruct had been necessary.
11.5 INSTRUMENT UNIT ELECTRICAL SYSTEM
The evaluation of the IU electrical system on AS-509 was accomplished usingCP-1 telemetry data, since the normally used DQl-Ail data were lost asdiscussed in paragraph 15.3.2. Analysis of these data indicates that theelectrical system functioned normally. Available data extend through13,655 seconds (03:47:35) of the flight. All battery voltages increasedgradually from liftoff, but remained within the required limits. Batterycurrents remained within the predicted range. Loss of the DPl-NJ dataprecluded evaluation of the 6010, 6030 and 6D4D battery temperatures.However, the 6D20 batterv temperature measurenrent indicated a stabletemperature condition. .+ailable battery voltage, curmnt, and meratureplots are shown in Figures 11-5 through 11-B. Battery power consmtionand capacity for each battery are shown in Table 11-4.
Based on analysis of CP-1 data, all indications are that the 56-vdcpower supply functioned within predicted limits.
11-3

8/7/2019 Saturn V Launch Vehicle Flight Evaluation Report - AS-509 Apollo 14 Mission
http://slidepdf.com/reader/full/saturn-v-launch-vehicle-flight-evaluation-report-as-509-apollo-14-mission 161/254

8/7/2019 Saturn V Launch Vehicle Flight Evaluation Report - AS-509 Apollo 14 Mission
http://slidepdf.com/reader/full/saturn-v-launch-vehicle-flight-evaluation-report-as-509-apollo-14-mission 162/254
sowJ3s:3fflYIY:wQlWI1 mmw:m:zl W:oOlI W:MOI 00:00:6 00:00:9 w:OO:1 w:m:9 OVOO~S oo:m:9 w:m:c OO:OO ~I
I#):00:1 0
I I I 1 1
souoJ3s oool lYII am
lvn1w -n
0313Y13 - - - -SllYll 3l9IAd3lJv I::::::.::: AU
7MM 00 SllYll - ml1 ow '
!
3lJAJ JIwm9An II* '
(Urn l&l 31JAJ uuq 2 'al uv @AA0 mu JInnaAY 1111'
w suld wo111n3 WI am 101 1 AA0 s&u WmlllClps lWlW3 1
I(1 a99 301 IluJauJlnnow1111~ imd lvY3lYl 01 uusmw ,
JU~JJII~ pue a6e3LoA kawa 1 'ON 34~ a6ws flAI-S 'E-11 an6!jswoJ3s:s3mIY:wmlWI1 mm
w:m:z1 w:oo:I 00:00:01 W:m :6 w:m: 9 oo:m:1 03:6@:9 ao:oo:9 90:09:9 OO:W ~C 6o:oo:c 09:oo: I 01 I 1 I I 1
MIIJV- *03AJ3433----
SlIYIl 3l9uUIJJ9 :y:::::::::IlJAJ 93l3N AIILLII 2 'Q UV
3lJ13 UllVY 2 IIY ) AllAAn 2 '09 ln
I
031JAJ b3IV1w AllAN 3 '09 IN J
31311 93lVIll 2 IIIUI AI3llV9 I 'W AN 931JAJ 93LW?ly A131196 I 'W UVV lVJlUl@

8/7/2019 Saturn V Launch Vehicle Flight Evaluation Report - AS-509 Apollo 14 Mission
http://slidepdf.com/reader/full/saturn-v-launch-vehicle-flight-evaluation-report-as-509-apollo-14-mission 163/254
Table 11-3. S-IVB Stage Battery Power Consunption
BATTERY
Forward No. 1
Forward No. 2
Aft No. 1
Aft No. 2
l-RATEDCAPACI-TY(AMP-HR)
300.0 150.26
24.75 27.53**
300.0 147.02
75.0 40.12
SUMPTIONPERCENT OF
CAPACITY
50.1
111.2
49.0
53.5
*Actual usage to 43,000 seconds (11:56:4~) is based on flight data.
**The battery voltage fell below the defined depletion level of 26.0volts at 30,560 seconds (08:29:20). Calculations of actual powerconsumption was terminated at this time.
The 5-vdc measuring power supply appeared to function properly based onthe CP-1 data available for analysis. A pertubation of the 5-volt busat liftoff was noted during the DP-1 link investigation, but it is notpresently believed that a problem exists in the 5-vdc measuring powersupply.
Available data indicate that all switch selector channels functioned ascommanded by the Launch Vehicle Digital Computer (LVDC) and were withinrequired time limits.
11.6 SATURN V EMERGENCY DETECTION SYSTEM (EDS)
The performance of the AS-509 EDS was normal and no abort limits wereexceeded. All switch selector events associated with EDS for which dataare available were issued at the nominal times. The discrete indicationsfor EDS events also functioned normally. The performance of all thrustOK pressure switches and associated voting logic, which monitors engine
status, was naninal insofar as EDS operation was concerned. S-II and S-IVBtank ullage pressures remained within the abort limits and displays to thecrew were normal.
The maximum angle-of-attack aynamic pressure sensed by the Q-ball was1.28 psid at 75.6 seconds. This pressure was only 40 percent of the EDSabort limit of 3.2 psid.
As noted in Section 10, none of the rate gyros gave any indication ofangular overrate in the pitch, yaw or roll axis. The maximum angularrates were well below the abort limits.
11-6

8/7/2019 Saturn V Launch Vehicle Flight Evaluation Report - AS-509 Apollo 14 Mission
http://slidepdf.com/reader/full/saturn-v-launch-vehicle-flight-evaluation-report-as-509-apollo-14-mission 164/254
BATTERY
6DlO
6D20
6D3C'
6D40
Table 11-4. IU Battery Power Consumption
RATEDPOWER CONSlMPTION
CAPACITY PERCEtiT OF(AMP-HR) AMP-HR* CAPACITY
350 69.2 19.8
350 338.8** 96.8'"
350 80.6 23.3
350 121.6 34.7
*Actual usage to 13,655 seconds (03:47:35) is based on flight data.**The CCS transponder which was powered by the 6020 battery was
operating at S-IVB/IU lunar impact which occurred at 297.473.4seconds (82:37:53.4). Pwer consumption unti l S-IVB/IU lunarimpact was calculated based on nominal operation.
11-7

8/7/2019 Saturn V Launch Vehicle Flight Evaluation Report - AS-509 Apollo 14 Mission
http://slidepdf.com/reader/full/saturn-v-launch-vehicle-flight-evaluation-report-as-509-apollo-14-mission 165/254
11-8

8/7/2019 Saturn V Launch Vehicle Flight Evaluation Report - AS-509 Apollo 14 Mission
http://slidepdf.com/reader/full/saturn-v-launch-vehicle-flight-evaluation-report-as-509-apollo-14-mission 166/254

8/7/2019 Saturn V Launch Vehicle Flight Evaluation Report - AS-509 Apollo 14 Mission
http://slidepdf.com/reader/full/saturn-v-launch-vehicle-flight-evaluation-report-as-509-apollo-14-mission 167/254
0”
R Ei c -c In 0
s&w * lN31Yl-U
11-N
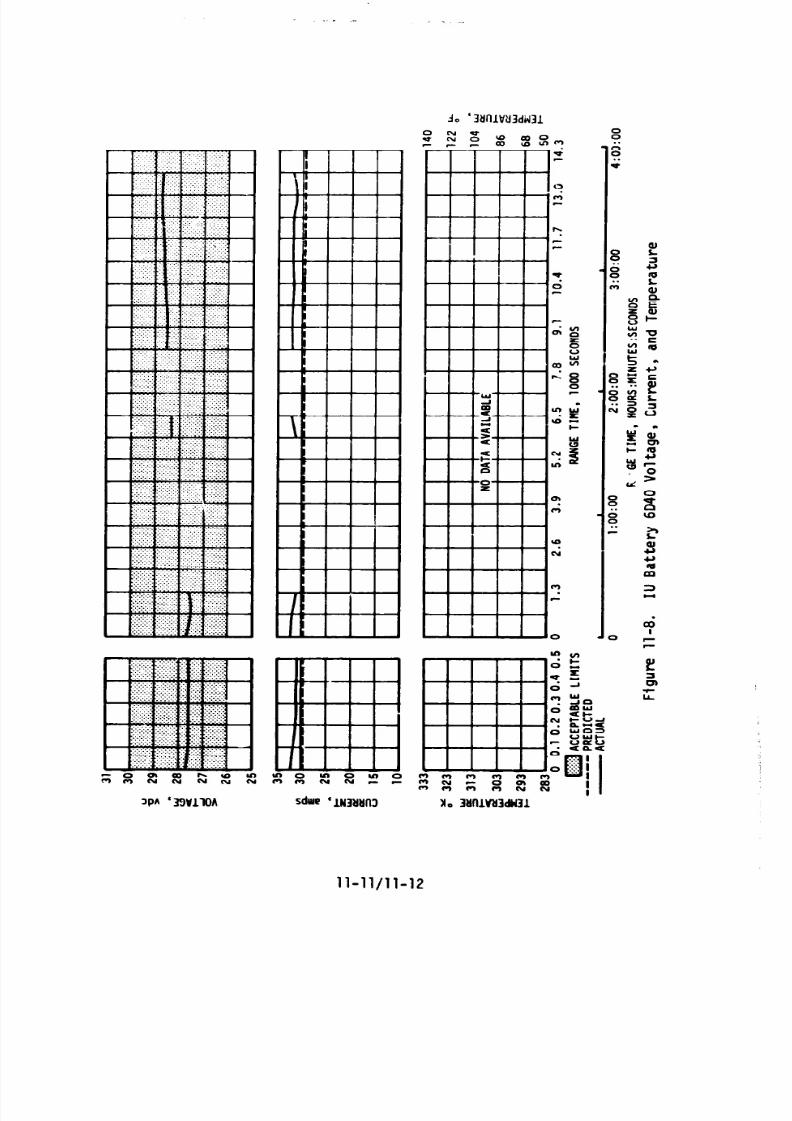
8/7/2019 Saturn V Launch Vehicle Flight Evaluation Report - AS-509 Apollo 14 Mission
http://slidepdf.com/reader/full/saturn-v-launch-vehicle-flight-evaluation-report-as-509-apollo-14-mission 168/254
8. .8E
:_:.0::.iI
12
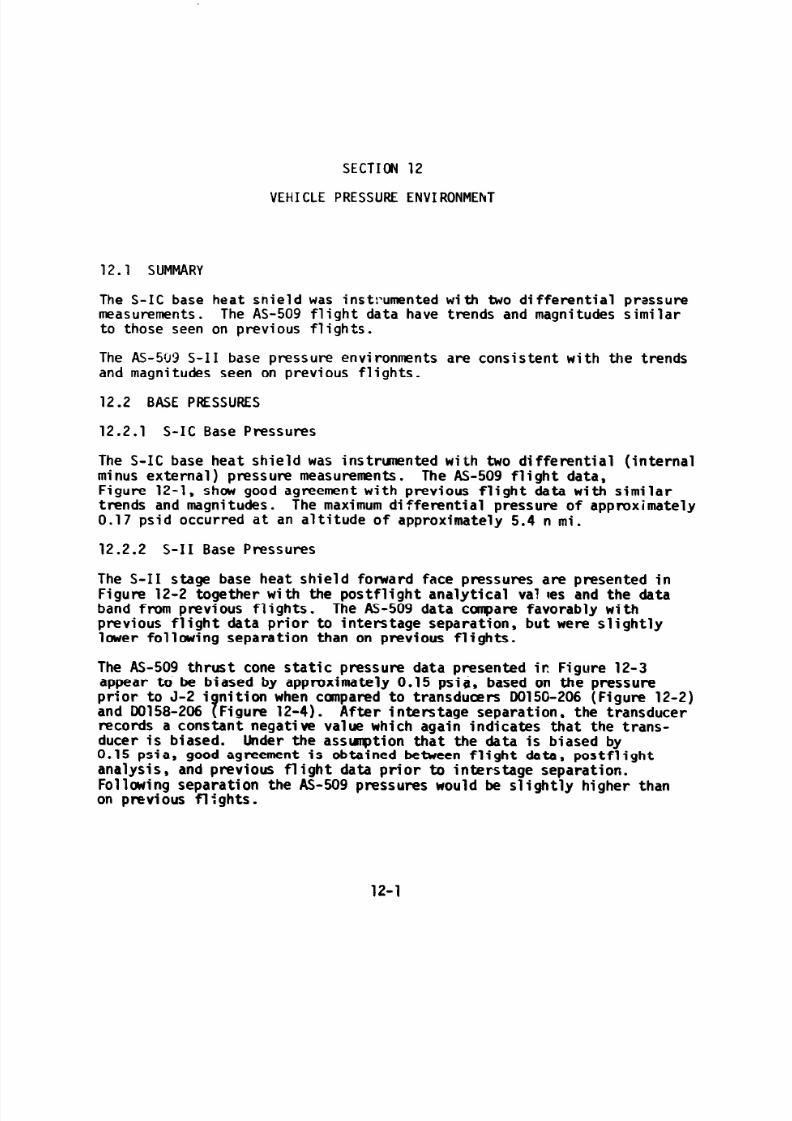
8/7/2019 Saturn V Launch Vehicle Flight Evaluation Report - AS-509 Apollo 14 Mission
http://slidepdf.com/reader/full/saturn-v-launch-vehicle-flight-evaluation-report-as-509-apollo-14-mission 169/254

8/7/2019 Saturn V Launch Vehicle Flight Evaluation Report - AS-509 Apollo 14 Mission
http://slidepdf.com/reader/full/saturn-v-launch-vehicle-flight-evaluation-report-as-509-apollo-14-mission 170/254
P!S d ’ (=‘qd-Wd)lVIlNY33AIa 3un553md
0 N N
d & 9
12-2
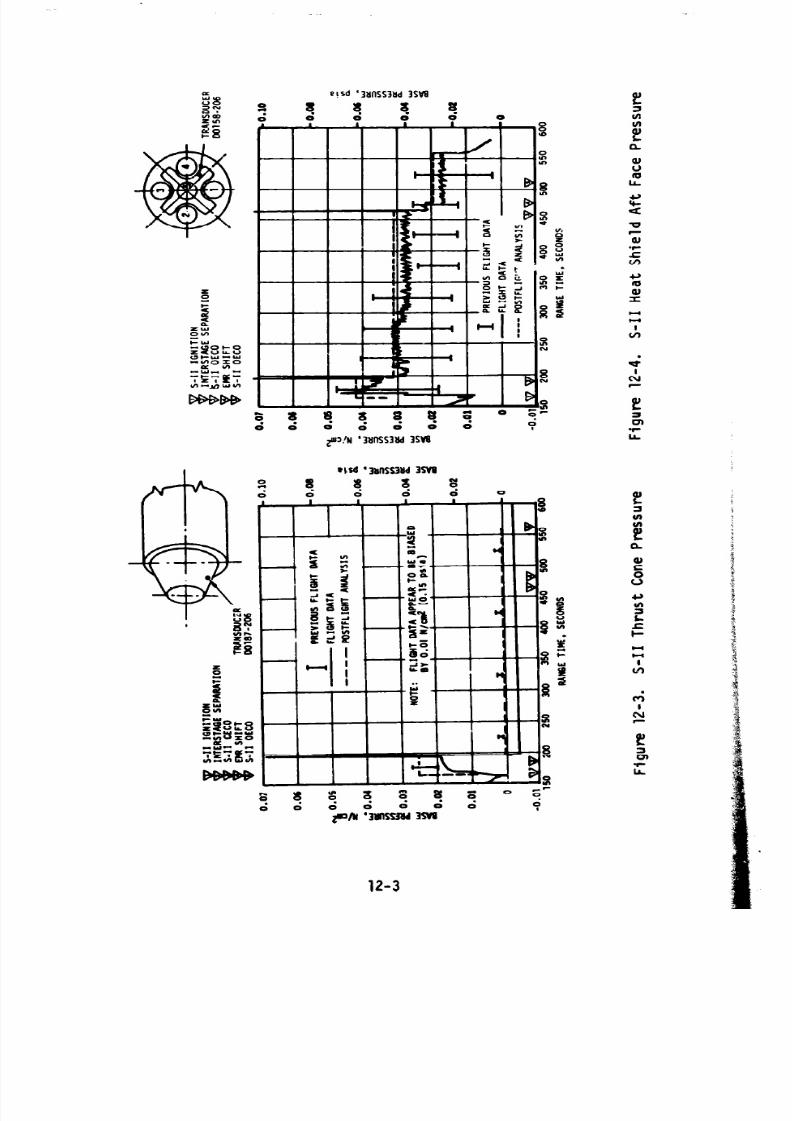
8/7/2019 Saturn V Launch Vehicle Flight Evaluation Report - AS-509 Apollo 14 Mission
http://slidepdf.com/reader/full/saturn-v-launch-vehicle-flight-evaluation-report-as-509-apollo-14-mission 171/254
e!sd ‘3LlllSS3Md 3SW
S 8 8 8 8d d d 0’
12-3

8/7/2019 Saturn V Launch Vehicle Flight Evaluation Report - AS-509 Apollo 14 Mission
http://slidepdf.com/reader/full/saturn-v-launch-vehicle-flight-evaluation-report-as-509-apollo-14-mission 172/254
The heat shield aft face pressures observed on AS-509 were comparable tothose measured on previous fl i
9hts except during the period 100 seconds
prior to Center Engine Cutoff CECO). During this period the AS-509pressures were slightly l,igher than on previous flights. The flight datatrends are consistent with those observed during previous flights and thesteady-state engine control positions for the AS-509 flight.
12-4

8/7/2019 Saturn V Launch Vehicle Flight Evaluation Report - AS-509 Apollo 14 Mission
http://slidepdf.com/reader/full/saturn-v-launch-vehicle-flight-evaluation-report-as-509-apollo-14-mission 173/254
SECTION 13
VEHICLE THERMAL ENVIRONMENT
13.1 SUMMARY
The AS-509 S-IC base region thermal environments exhibited trends andmagnitudes similar to those seen on previous flights.
The base thermal environments on the S-II stage were similar to thosemeasured on previous flights and were well below design limits. Thetatal heating rate measurement indicated higher magnitudes prior toCenter Engine Cutoff (CECO) than on previous flights, which was con-sistent with the closer inboard gimbaled position of the engines onAS-509.
Aerodynarric heating environments and S-IVB base thermal environmentswere not measured on AS-509.
13.2 S-IC BASE HEATING
Thermal environments in the base region of the AS-509 S-iC stage wererecorded by two total calorimeters and two gas temperature probes whichwere located on the base heat shield. The sensing surfaces of the totalcalorimeters were mounted flush with the heat shield surface. The basegas temperature sensing surfaces were mounted at distances aft of theheat shield surface of 0.25 inch (COO50-106) and 2.50 inches (COO52-106).Data from these instruments are compared with AS-508 flight data and arepresented in Figures 13-1 and 13-2. The AS-509 data exhibit similartrends and magnitudes as previous flights. The maximum recorded totalheating *ate was approximately 26 watt/cm2 and occurred at 19 kilometers.
The maximum gas temperature was approximately 1150°K, recorded 2.5 inchesaft of the heat shield at an altitude of 25 kilometers. In general, CECOon AS-509 produced a spike in the thermal environment data with a magni-tude and duration similar to previous flight data.
Ambient gas temperatures under the engine cocoons (measurements CO242-101through CO242-105) were within the band of previous flight data dnd with-in the predicted band. These temperatures are shown in Figure 13-3.
13-1

8/7/2019 Saturn V Launch Vehicle Flight Evaluation Report - AS-509 Apollo 14 Mission
http://slidepdf.com/reader/full/saturn-v-launch-vehicle-flight-evaluation-report-as-509-apollo-14-mission 174/254
no '3lllllVti3dW31 SEl )I, '3tlfilVtt3dW31 SW9
8
.-
C
13-2
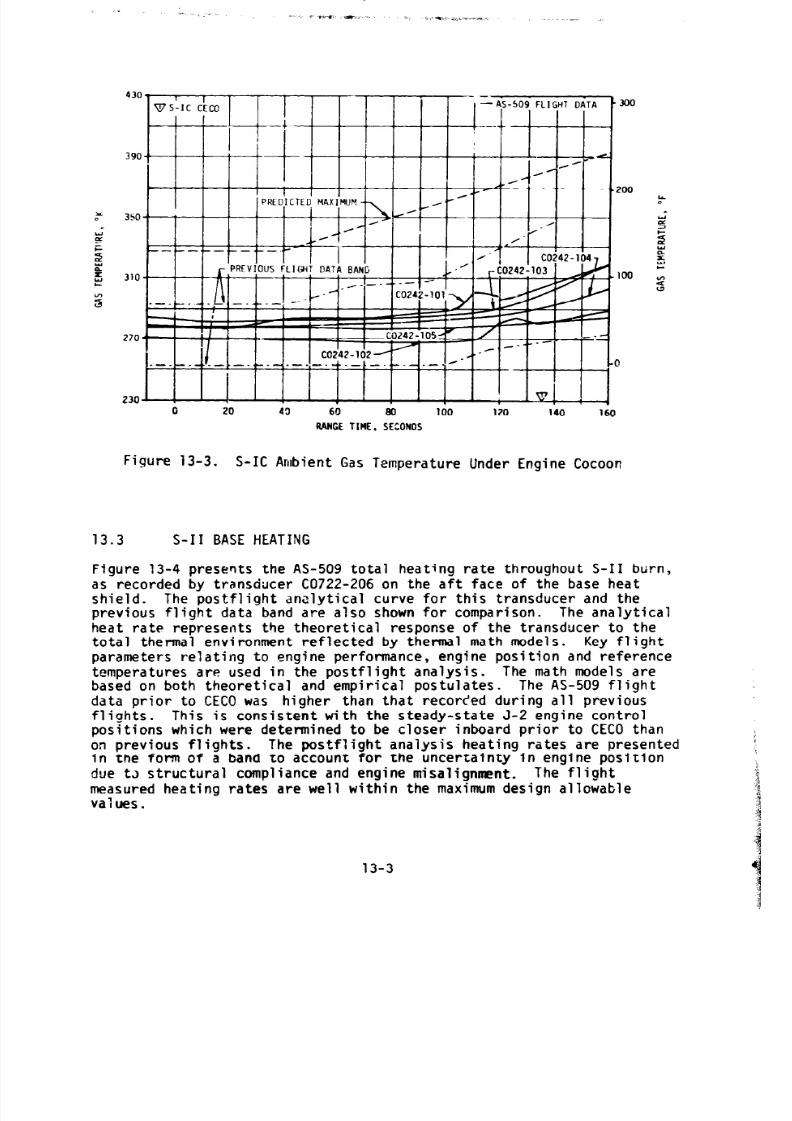
8/7/2019 Saturn V Launch Vehicle Flight Evaluation Report - AS-509 Apollo 14 Mission
http://slidepdf.com/reader/full/saturn-v-launch-vehicle-flight-evaluation-report-as-509-apollo-14-mission 175/254
I -b200
PREDICTED MAXIHUM-/
F350-J
.// '
. .'/
/ /'----.m- --.--- .-
r.PREVl.OUS FLIGH T PA?A BAN6 ,,.,,,
270
_-_ .-,I-- -. . _.-_l-. ._ -. .-.-I/
230 m: .
0 20 40 60 80 100 120 I40 160
RANGE TIM E. SECONDS
Figure 13-3. S-IC Ambient Gas Temperature Under Engine Cocoon
13.3 S-II BASE HEATING
Figure 13-4 presents the AS-509 total heating rate throughout S-II burn,as recorded by transducer CO722-206 on the aft face of the base heatshield. The postflight analytical curve for this transducer and theprevious flight data band are also shown for comparison. The analyticalheat rate represents the theoretical response of the transducer to thetotal thermal environment reflected by thermal math models. Key flightparameters relating to engine performance, engine position and referencetemperatures are used in the postflight analysis. The math models arebased on both theoretical and empirical postulates. The AS-509 flightdata prior to CECO was higher than that recorded during all previousfliohts. This is consistent with the steady-state J-2 engine controlpositions which were determined to be closer inboard prior to CECO thanon previous flights. The postflight analysis heating rates are presentedin the form of a band to account for the uncertainty in engine positiondue tJ structural compliance and engine misalignment. The flightmeasured heating rates are well within the maximum design allowablevalues.
13-3

8/7/2019 Saturn V Launch Vehicle Flight Evaluation Report - AS-509 Apollo 14 Mission
http://slidepdf.com/reader/full/saturn-v-launch-vehicle-flight-evaluation-report-as-509-apollo-14-mission 176/254
TSS-II IGNITION ~EMR SHIFTVINTERSTAGE SE"ARATION~7-11 CECO
TS-II OECO
IPREVIOUS FLIGHT DATA
- FLIGHT DATA
,'Z',: POSTFLIGHT ANALYSIS
TRANSDUCERCO722-206
150 200 250 300 350 4a 450 500 550 600RANGE TIME, SECONDS
Figure 13-4. S-II Heat Shield Aft Heat Rate
Figure 13-5 shows the AS-509 flight data and postflight analysis of theheat shield recovery temperature transducer CO731-206. The analyticaltemperature curve represents a calculated transducer reaaing based onmath ,mdels using key flight parameters. The gas recovery temperatureis an analytically derived value computed from the flight measurementdata. Note that the flight values are the probe temperatures and not the
13-4

8/7/2019 Saturn V Launch Vehicle Flight Evaluation Report - AS-509 Apollo 14 Mission
http://slidepdf.com/reader/full/saturn-v-launch-vehicle-flight-evaluation-report-as-509-apollo-14-mission 177/254
gas recovery temperatures. As shown in Figure 13-5, the AS-509 flightgas recovery temperature values were on the low side of the previousflight data envelope. This is contrary to the expected trend, since thesteady-state engine deflection pattern indicates that the engines weregimbaled closer inboard prior to CECO than on previous flights. How-
ever, as indicated by the previous flights data envelope, a considerableprobe temperature variation exists between different flights whichcannot be explained by the variation of the parameters considered in the
NOTE:
v S-II IGNITION EMR SHIFTv INTERSTAGE SEPARATION S-I: OECOV S-II CECO
I PREVIOUS FLIGHT DATA (AS-503 to AS-508)- ----GAS RECOVERY TEMPERATURE
FLIGHT DATA-----POSTFLIGHT ANALYSIS
TRANSDUCERCO731-206
THE PROBE IS EXTENDEDHPPROXIMATELY 2 INCHESFROM TH,E SURFACE
D-
I -
I-
)-
I-
I -
. 87 I I I I Iww 1 Iw J-400
150 200 2w) 300 350 400 450 500 550 600
RIVIGE TIME. SECOK&
Figure 13-5. S-II Heat Shield Recovery Temperature
13-5

8/7/2019 Saturn V Launch Vehicle Flight Evaluation Report - AS-509 Apollo 14 Mission
http://slidepdf.com/reader/full/saturn-v-launch-vehicle-flight-evaluation-report-as-509-apollo-14-mission 178/254
analysis alone. Also, since the init ial temperature is below the proberange, it is not possible to determine if the probe temperature isbiased, which might possibly account for the apparent discrepancy betweenthe measured high total heat flux and low gas recovery temperature.
Figure 13-6 shows the AS-509 flight data and postflight analysis of theheat shield aft radiation heat rate. The analytical radiation heat raterepresents the heat rate at the transducer location and is derived from amath model. Good agreement is obtained between flight and the postflightanalytical values which do not include engine position effects. Compari-son with the previous flight data envelope shows that the AS-509 data
S-II IGNITIONINTERSTAGE SEPARATIONS-II CECOEMR SHIFTS-II OECO
I PREVIOUS FLIGHT DATAFLIGHT DATA
---- POSTFLIGHT ANALYSIS I TRANSDUCERcD692-206
lso 200 250 300 350 400 450 500 550 600
RANGE TIME, SECONDS
Figure 13-6. S-II Heat Shield Aft Radiation Heat Rate
13-6

8/7/2019 Saturn V Launch Vehicle Flight Evaluation Report - AS-509 Apollo 14 Mission
http://slidepdf.com/reader/full/saturn-v-launch-vehicle-flight-evaluation-report-as-509-apollo-14-mission 179/254
\cere on the low side which is contrary to the expected trend based onthe AS-5G9 clnqer inboard steady-state engine control positions.
There were no structural temperature measurements on the bast heat shieldand only three thrust cone forward surface temperature measurertents in
the base region. To evaluate the structural temperatures on tie aftsurface of the heat shield, a postflight analysis was performed usingmaximum AS-509 postflight analysis base heating rates. The maximumpostflight analysis temperature was 743°K which compares favorablywith previous flights, ant was well below the maximum design temperaturesof 1066°K (no engine out) and 1116°K (one control engine out). Theeffectiveness of the heat shield and flexible curtains was evidencedby the relatively low temperatures recorded on the thrust cone forwardsurface. The maximum measured temperature on the thrust cone forwardsurface was 269°K. The measured temperatures were well below designvalu.3.
13.4 VEHICLE AEROHEATING THERMAL ENVIRONMENT
Aerodynamic heating environments were not measured on the AS-509 S-ICstage. Due t3 the similarity in the trajectory, the aerodynamic heatingenvironments are believed to be approximately the same as previousflight environments. Flow separation on the AS-509 vehicle was observedfrom ground optical data (Melbourne Beach) to occur at approximately 110seconds. The forward point of flow separation versus flight time ispresented in Figure 13-7. The effects of CECO during the AS-509 flightwere similar to previous flights. At higher altitudes the measured loca-tion of the forward point of flow separation is questionable due to lossof resolution in the ground optical data.
.
13-7

8/7/2019 Saturn V Launch Vehicle Flight Evaluation Report - AS-509 Apollo 14 Mission
http://slidepdf.com/reader/full/saturn-v-launch-vehicle-flight-evaluation-report-as-509-apollo-14-mission 180/254
1
AS-538 GPOUND OPTICAL DATA
+
(PONCE DE LEOL)
0 FS-509 GROUND OPTICAL DATAWLBOURNE t3EAw)
i
i
j-
RAMGE TIM E. SECONDS
Figure 13-7. Fcmard Location of Separated Flow on S-IC Stage
13-8

8/7/2019 Saturn V Launch Vehicle Flight Evaluation Report - AS-509 Apollo 14 Mission
http://slidepdf.com/reader/full/saturn-v-launch-vehicle-flight-evaluation-report-as-509-apollo-14-mission 181/254
. . _.
SECTION 14
ENVIRONMENTAL CONTROL SYSTEMS
14.1 SUMNARY
The S-IC stage forward compartment ambient temperatures were maintainedabove the minimum performance limit during AS-509 countdown. The S-IC
stage aft compartment environmental conditioning system performed satis-factorily.
The S-II thermal control and compartment conditioning system apparentlyperformed satisfactorily since the ambient temperatures external to thecontainers were nc'rmal, and there wire no problems with the equipment inthe containers.
The Instrument Unit (JU) Environmental Control System (ECS) performedsatisfactorily for the duration of its mission. Coolant temperatures,pressures, and flowrates were maintained within the required limits.
14.2 S-IC ENVlRONP'ENTAL CONTROL
The S-IC stage forward skirt ECS has three phases of operation duringprelaunch operations. xhen onboard electrical systems are energized,but prior to cryogenic loading, conditioned air is used to rraintain thedesired environment. When cryogenic loading begins, warmed GN2 issubstituted for the conditioned air. The third phase uses a warmerGN2 flow tc offset the cooling effects caused by S-II stage J-2 enginethrust cbatier chi:lJown. All three phases functioned satisfactorilyas evidenced by ambient temperature readings.
The most severe prelaunch forward compartment thermal environment(-63.2"F at CO206-120) occurred during J-2 engine Lhilldown and wasabove the minimum performance limit of -90°F. During AS-509 flightthe lowest forward conpartmnt temperature measured was -133.2"F atinstrument location CO206-120.
After the initiation of LOX loading, the temperature in the vicinity ofthe battery (12KlO) decreased to 59°F which is within the new batteryqualification limits of 35 to 95OF per ECP 578. The temperature increasedto 68°F at liftoff. Just prior to liftoff, the other atiient temperatures
14-1

8/7/2019 Saturn V Launch Vehicle Flight Evaluation Report - AS-509 Apollo 14 Mission
http://slidepdf.com/reader/full/saturn-v-launch-vehicle-flight-evaluation-report-as-509-apollo-14-mission 182/254
ranged from 66.7"F at instrument location CO203-115 to 81.1"F at instru-ment location C@205-115. During flight the lowest aft comoartment temoera-ture recorded was 53.6"F at instrument location CO203-115.
14.3 S-II ENVIRONMENTAL CONTROL
The engine compartment conditioning system mairtained the ambient tempera-ture and thrust cone surface temperatures withit- design ranges throughoutthe launch countdown. The system also maintained an inert atmospherewithin the compartment as evidenced by the absence of H2 or 02 indicationson the hazardous gas monitor.
No equipment container temperature measurements were taken. However,since the ambient measurements external to the containers were satis-factory and there were no problems with the equipment in the containers,it is assumed that the thermal control system performed adequately.
14.4 IU ENVIRONMENTAL CONTROL
14.4.1 Thermal Conditioning System
Performance of the IU Thermal Conditioning System {TCS) was satisfactorythroughout flight . The temperature of the coolant supplied to the cold-plates and internally cooled components was continuously maintained withinthe required 45 to 68°F temperature band. The TCS with the new coolantGronite Flo-Cool 100 performed as predicted.
Figure 14-1 shows the TCS coolant control temperature (COO15-601) out to14,000 seconds (03:53:20). The range of measurement COO15-601 does notallow reading the minimum coolant temperature; however, extrapolationof the data indicates that the coolant temperature did not drop belowthe specification limit.
TKATERALVE OPENYATERALEaosE ---- EXTWOLATED
291- ACTUAL
SUN WAWU200 . 1 ; ,SUN I I ; SNMOU~
1 i Ll I I ,263-r I \
[/-k-',,
~, '.d' \'., ----, coo1540 'L.
29lC I 1 1\
0 1 2 3 1 5 6 3 8 9 10 11 12 13 14
60
a
I55 =
t
50
u11rc.1ow5EsEtom
r'o W P 40 1:oo:w 2:w:oF 3:W:W 4-w.00
UQ TM . mR5:**um:sKao5
Figure 14-1. IU TCS Coolant Control Temperature
14-2

8/7/2019 Saturn V Launch Vehicle Flight Evaluation Report - AS-509 Apollo 14 Mission
http://slidepdf.com/reader/full/saturn-v-launch-vehicle-flight-evaluation-report-as-509-apollo-14-mission 183/254
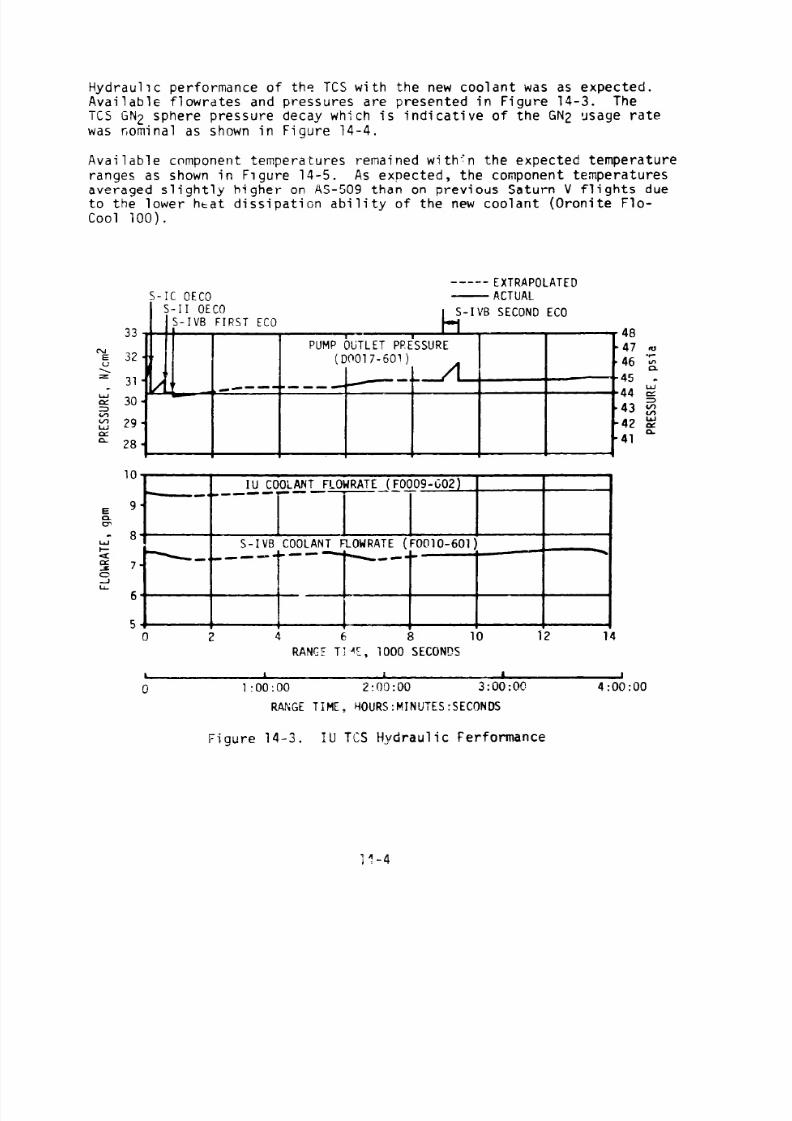
8/7/2019 Saturn V Launch Vehicle Flight Evaluation Report - AS-509 Apollo 14 Mission
http://slidepdf.com/reader/full/saturn-v-launch-vehicle-flight-evaluation-report-as-509-apollo-14-mission 184/254

8/7/2019 Saturn V Launch Vehicle Flight Evaluation Report - AS-509 Apollo 14 Mission
http://slidepdf.com/reader/full/saturn-v-launch-vehicle-flight-evaluation-report-as-509-apollo-14-mission 185/254

8/7/2019 Saturn V Launch Vehicle Flight Evaluation Report - AS-509 Apollo 14 Mission
http://slidepdf.com/reader/full/saturn-v-launch-vehicle-flight-evaluation-report-as-509-apollo-14-mission 186/254
316.
aST-124M-3 W&L GIML TMPEM TURE (CWW-603) -10815.i *
-
g 314- - 1 :106 J
ii 313. ! -104 g
x
r 3:z I . 102 E31i* 6
cpe 29?.‘\ \ I .- #.‘p.,
.
I’
*g6. ~............_ __._ ‘\. ___$ -
--- -c /’ - 1 ,i ‘.I F
295 .w._ .
*./
--.
294. 70
,..'
,... ,........ \c’
293..
292c ! .0 I 2 3 4 5 6 7 I 9 13 11 12 13 14
RAw11m,1m SECoM.6
, L L L 10 1+0:00 2:m:al 3:w:w 4:W:OO
WNGE TM , HO!R5:MIWTE5:SECOMM
Figure 14-5. Selected ID Component Temperatures
14.4.2 ST-124M-3 Gas Bearing System (GBS)
The GBS performance was nominal. The S:'-124M-3 internal ambient pressurelDOO12-603) and gas bearing inlet pressure (DOOll-60s) are shown inFigure 14-6.
The GBS GA2 supply sphere pressure decay was as expected for the nominal
case as s'iown in Figure :4-7.
lh-6
c

8/7/2019 Saturn V Launch Vehicle Flight Evaluation Report - AS-509 Apollo 14 Mission
http://slidepdf.com/reader/full/saturn-v-launch-vehicle-flight-evaluation-report-as-509-apollo-14-mission 187/254

8/7/2019 Saturn V Launch Vehicle Flight Evaluation Report - AS-509 Apollo 14 Mission
http://slidepdf.com/reader/full/saturn-v-launch-vehicle-flight-evaluation-report-as-509-apollo-14-mission 188/254
2200
2000
1800
1400
1200
‘-._ I MINIMUM EXPECTED
L --..-..‘-.- I\ --.*\ --..\ --.*
--..\ --....( __-_--
1r\\
5
--..--.*1 ‘-..
--a
\0 .-\\
J
MAXIMM ALLOWABLE\ USAGE RATE
\\\\\\
.
k
I\
\ N.
- ----
3200
2mo
2600
zoo0
1800
1600
14W
0 2 4 6 8 10 12 14
RANGE TIME, 1000 SECONDS
b I 1 1 J
0 1:oo:oo 2:Oo:oo 3:oo:oo 4:w:w
RAWGE TM, tUMS:MIWUTES:SECONM
Figure 14-7. IU GBS GN2 Sphere Pressure
14-8

8/7/2019 Saturn V Launch Vehicle Flight Evaluation Report - AS-509 Apollo 14 Mission
http://slidepdf.com/reader/full/saturn-v-launch-vehicle-flight-evaluation-report-as-509-apollo-14-mission 189/254
SECTION 15
DATA SYSTEMS
15.1 SUMM4RY
All elements of the ds.ta system performed satisfactorily throughoutflight except the Instrument Unit (IU) telemetry system. The DPl-A0270 multiplexer data and the 410K multiplexer data were lost at 0.409 sec-ond and at 10,955.861 seconds (03:02:35.861), respectively. In addition,the DP-1 telemetry RF output measurement changed abruptly several timesduring the flight.
The vehicle measurement reliability was 95.5 percent. Telemetry per-formance was normal except for the noted problems. Radiofrequency (RF)propagation was generally good, though the usual problems due to flameeffects and staging were experienced. Usable VHF data were receiveduntil 18,360 seconds (05:06:00). The Secure Range Safety ComMndSystems (SRSCS) on the S-IC, S-II and S-IVB stages were ready to per-
form their functions properly, on ccmnand, if flight conditions duringthe launch phase had required destruct. The system properly safed theS-IVB on a command transmitted from Bermuda (BDA) at 710.2 seconds. Theperfomnce of the ComMnd and Communication System (CCS) was excellent.Usable CCS telemetry data were received to 53,039 seconds (14:43:59)at which time the telemetry subcarrier was inhibited. Carnarvon (CRO),Goldstone (GDS), Hawaii (HAW), Honeysuckle (HSK), and Merritt IslandLaunch Area (MILA) were receiving CCS carrier signal at S-IVB/IU lunarimpact at 297,473.4 seconds (82:37:53.4). Good tracking data werereceived from the $-Band radar, with EDA indicating final Loss ofSignal (LOS) at 28,950 seconds (O&:02:30).
The 65 ground engineering cameras provided good data during the launch.
15.2 VEHICLE MEASUREMENTS EVALUATION
The AS-503 launch vehicle had 1382 measurements scheduled for flight;three measurements were waived prior to start of the automatic countdownsequence leaving 1379 measurements active for flight. Of the waivedmeasuremnts, one provided some valid data during the flight. Sixty-twomeasuremnts failed during flight resulting in an overall measurementsystem reliability of 95.5 percent. Fifty=-nine of these failed measure-
ments and one of the ten partially failed measuremnts were caused by
15-1

8/7/2019 Saturn V Launch Vehicle Flight Evaluation Report - AS-509 Apollo 14 Mission
http://slidepdf.com/reader/full/saturn-v-launch-vehicle-flight-evaluation-report-as-509-apollo-14-mission 190/254
.” . __ -. I*(,-- f..
IU telemetry system problems discussed in paragraphs 15.3.2 and 15.3.3.These measurement failures affected the oostfliqht evaluation of thrapplicable vehicle systems.
A sumMry of measurement reliability is presented in Tabletotal vehicle and for each stage. The waived measurements,measurements, partially failed measurements, and questionabare listed by stage in Tables 15-2, '15-3 and 15-4.
15-1 for thetotally failedle measurements
15.3 AIRBORNE VHF TELEMETRY SYSTEMS EVALtiATION
15.3.1 Performance Summary
Performance of the eight VHF telemetry links was generally satisfactory,as indicated in Table 15-5.in the IU telemetry system.
However, three significant problems occurredFirst, all analog data routed through the
DPl-A0 270 multiplexer was lost at 0.409 second. Second, the HO060-6Q3computer word routed through the 410K multiplexer locked in an all zerostate at 10,955.861 seconds (03:02:35.861). Finally, the DP-1 telemetryRF output measurement, 50029602, changed abruptly several times duringthe flight.and 15.3.4.
These problems are discussed in paragraphs 15.3.2, 15.3.3
The S-IC, S-II and S-IVB telemetry systems and the balance of the IUtelemetry system operation were normal throughout flight. All inflightcalibrations occurred as programed and were within specifications. Data
Table 15-1. AS-509 Measurement Sumnary
MEASU=NT s-IC S-II S-Iv8 INSTRWENT TOTALCATEGORY STAGE STAGE STAGE WIT VEHICLE
Scheduled
Mafed
Failums
PartialFailures
Questionable
ReliablliQPercent
287 598 271 226 1382
1 1 1 0 3
0 1 2 59 62
5
0
loo.0
3
0
99.3
1
0
73.4
10
1
95.5
15-2

8/7/2019 Saturn V Launch Vehicle Flight Evaluation Report - AS-509 Apollo 14 Mission
http://slidepdf.com/reader/full/saturn-v-launch-vehicle-flight-evaluation-report-as-509-apollo-14-mission 191/254
Table 15-2. AS-509 Flight Measurements Waived Prior to Flight
MEAi,‘Qi”t 'VT'.iWLF , IIEASUREMENT TIT LE NAT'JRE OF FAILURE Rt3UPKS
S-IC STAGE--I I- I
m113-lo? Loylne 21nbal System Filter ManifoldDiffewntral Fres5ut-e
III
COOOl-202 At 81 seconds the mersb.rcmtreturned to rgtm nt with othermmsu-ts.
I S-IVB ST&E
I 1 I --I
coos9406 Tapcrrture . LOX Tm k Ullogge Gas. Indicated higher thenla, Pcmnt ncninel tmpcrature
Firstcbserrcd during WIT LOXloading. Indicated trerdinfonution. Melfunction proboblmused by l ncessir contbctresistance of en in-linel lrctrlcrl connector.
degradation and dropouts were experienced at various times during boost,as on previous flights, due to the attenuation of RF signals. Signalattenuation was caused by main engine flame effects, S-IC/S-II staging,S-II ignition and S-II second plane separation. The magnitude of theseeffects was comparable to that experienced on previous flights. Lossof these data, however, posed no problem since losses were of such shortduration as to have little or no impact on flight analysis. Usable VHFtelemetry data were received to 18,360 seconds (05:06;00). A sunmnary ofavailable VHF telemetry coverage showing Acquisition of Signal (AOS) andLOS for each station is shown in Figure 15-1.
15.3.2 Loss of DPl-A0 Analog Data
All analog data routed through the DPl-A0 270 multiplexer (S/N 461) werelost at 0.409 second and for the remainder of the flight. This resultedin the loss of 59 out of 101 IU DPl-A0 PCM masuremnts. The remaining42 measurements \~ere redundantly routed through the CPl-A0 telemtrylink.
All data channels; showed an abrupt change follwed by a transient,as shown in Figure 15-2. The data tended to level out at 14.3 percentof full scale mtil 4.63 seconds when it decayed to 11.6 percentof full scale within 250 milliseconds.
15-3

8/7/2019 Saturn V Launch Vehicle Flight Evaluation Report - AS-509 Apollo 14 Mission
http://slidepdf.com/reader/full/saturn-v-launch-vehicle-flight-evaluation-report-as-509-apollo-14-mission 192/254

8/7/2019 Saturn V Launch Vehicle Flight Evaluation Report - AS-509 Apollo 14 Mission
http://slidepdf.com/reader/full/saturn-v-launch-vehicle-flight-evaluation-report-as-509-apollo-14-mission 193/254
Table 15-3. AS-509 Measutemnt Malfunctions (Continued)
1oool-103
+lXCll-l01
Kml-202r04)1-203
lmol-Lo1
Hmoz-101
TO T M l E A s I
1alm Crrrmt, PItc mLctvtor
v41n Lrmn r. PitaLctrmr
VIlR Curm lt. r1tcakt.rtw
va1r cwrcnt. PItchktrtor
V.lR c-t. Pitchkctutor
vr1r cuumnt. I-ktvtor
a1r krrmt. VL
LctrtwIlW tmm t. I-kutov
vwlr c-t. ‘I-kW
m f4ILlmfS. IU ~CmiTlnl
;1l”a1 k-1 mz at to14.3 plrent
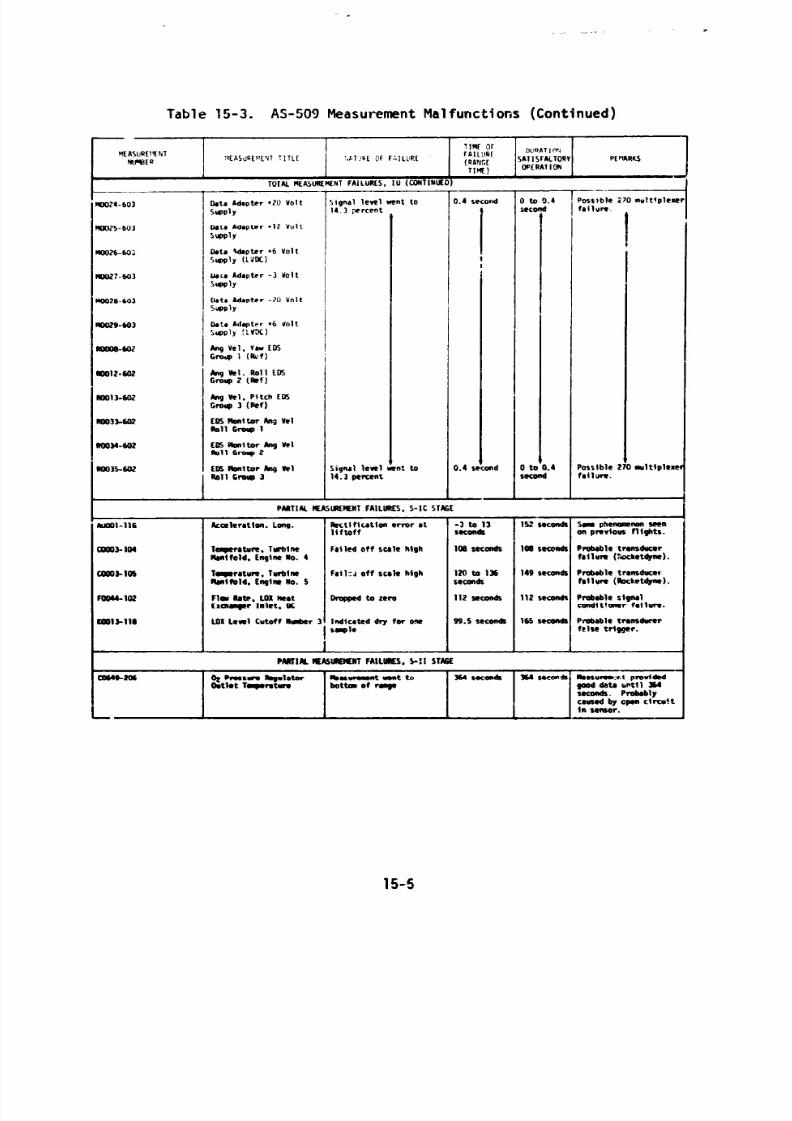
8/7/2019 Saturn V Launch Vehicle Flight Evaluation Report - AS-509 Apollo 14 Mission
http://slidepdf.com/reader/full/saturn-v-launch-vehicle-flight-evaluation-report-as-509-apollo-14-mission 194/254

8/7/2019 Saturn V Launch Vehicle Flight Evaluation Report - AS-509 Apollo 14 Mission
http://slidepdf.com/reader/full/saturn-v-launch-vehicle-flight-evaluation-report-as-509-apollo-14-mission 195/254
Table 15-3. AS-509 Measurement Malfunctions (Continued)--
TIMC OfNEIS”REHENT FPILuPt
DURRT,IIYNLMER *EaSUREMLhT TIT LE 'ilT,'RE OF Fi,LURC
( RANG1 S111SFAClOI r RFMARIS
TINE) OPERAlION
PhRT !Iv NEASuRENEN, iPILUF!ES. S-IVB ST&E
10012-411 Freq-PU In~~/Conr Frqucncy indfca~~ondpcreascd lbrwtly tooff-scale-la
*0055-411 Ilisc-l/M RF Syst Refl Pw r Higher than normal d4taIeel
PARIlK MPJUREM ENT FMLUKS. IV
19.930 0 to 19.930rerondr seconds
Pwliftoff Oat . usabledWlll9cnttreflight
Pmb4blc mchmicalCarrdatian of thetr;nrduccr presswesensing elmlent.
Pmb4ble f4iluR of thesignal ccmditionlngiirclJit~.
PoIslble systemcrlibmtion shift.
10.956seconds
0 to 10.9% Possible 410 multiplemseconds
Table 15-4. AS-509 Questionable Flight Measurements
MEASUREMENTNUlBEq MEASUCEMENT TIT LE REASON OLESTIONEO REMARKS
1i S-11 STAGE
Measufment was 2 psiahigher than rrdmdantsystem (00257-206)prior tn tank pmssur-
Ization. It was 2 pslrlaw than rtdmdantmeasurement afterpressurization.
CD01 data looked O.K . but thereappeared to bc an equivalenttrend with a delta pressure of0.5 psla.
15-7

8/7/2019 Saturn V Launch Vehicle Flight Evaluation Report - AS-509 Apollo 14 Mission
http://slidepdf.com/reader/full/saturn-v-launch-vehicle-flight-evaluation-report-as-509-apollo-14-mission 196/254

8/7/2019 Saturn V Launch Vehicle Flight Evaluation Report - AS-509 Apollo 14 Mission
http://slidepdf.com/reader/full/saturn-v-launch-vehicle-flight-evaluation-report-as-509-apollo-14-mission 197/254
v PARKING ORBIT INSERTION v TRANSLUNAR INJECTION
v BEGIN S-IVB RESTAR T PREPARATION:v S-IV0 SECONO IGNITION
--1200 -600 0 600 1200 1800 2400 3000 3600 4200 4tml
vRANGE TIME, SECONDS
o:oo:oo 0:20:00 0:40:00 l:oo:oo 1:xJ:oo
RANGE TIME, HOURS:MINUTE S:SECONDS
m -,si::
TE X
-cy: -ARIA-2-VAN -ARIA-l
-BOA -CR0 MILA--MILA ,tRIA-3 - HAN
-TEX -ARIA-41 4
4800 5400 6000 6600 7200 7800 8400 9000 9600 10.200 10.800RANGE TIME, SECONDS
L w
1:40:90 2:oo:oo 2:20:00 2:40:00 3:oo:ooRANGE TIME, HOURS:MINU TES:StCONDS
,I TE X
BDA MILA
1 HAH -HAW
11,400 12,000 12.600 13,200 13,800 14,400 15,000 15.600 16,200 16.800 17,400 1 b.000 18.600
RANGE TIME, SECONDS
1 1 1 13:2O:OU 3:40:00 4:oo:oo 4:20:00 4:40:00 5:oo:oo
RANGE TIME, HOURS:MfNUTES:SECONDS
Figure 15-l. VHF Telemetry Coverage Sumnary
8/7/2019 Saturn V Launch Vehicle Flight Evaluation Report - AS-509 Apollo 14 Mission
http://slidepdf.com/reader/full/saturn-v-launch-vehicle-flight-evaluation-report-as-509-apollo-14-mission 198/254
At 0.40 second CPl-A0 word 29 containins the IU 5 volt master measuringsupply voltage (6D81) went to the maximum value that the PCM/DDAS assemblycould code (1023 digital counts or all otres). This was a change of120 f5 millivolts and indicates that the Ycoltage was probably nigher butcould not be coded by the PCM/DDAS assembly. However, there was only aslight change in measurement MOOOl-602 (5 counts or a 31 millivolt changein the 5 volt level) at this same time, although they are measurements ofthe sarre voltage. There was also a slight change in at ieast two othermeasurements (DOOll-603 and D0012-603) that used this same 5 volt mastermeasuring supply. A reason has not yet been established as to why thesemeasurements did not show a more significant increase in value. Thisdisturbance in the 5 volt level lasted 4 seconds, which corresponds tothe same time frame for the transient in the DPl-A0 data. This 5 voltmaster measuring supply is comnon to both the CPl-A0 and DPl-A0 270 multi-plexers. There was no noticeable change at the problem time in the 6D30battery current or the 6D31 bus voltage which supplies power to the
DPl-A0 270 multiplexer. However, the nominal 270 multiplexer currentdrain is only 0.1 ampere and cannot be identified in the 6D30 currentmeasurement data.
Every time the DPl-A0 270 multiplexer was scheduled to calibrate, therewas a disturbance in the bit pattern of the data stream. Engineeringtests have shown that this is characteristic of trying to calibrate a"dead box" (power off).
Failure testing is continuing in an attempt to duplicate the completefatlure characteristic using an engineering 270 multiplexer.
15.3.3 Loss of H0@60-603 Guidance Computer Word
Data transmitted through the 410K multiplexer (S/N 442) was lost at10,955.861 seconds (03:02:35.861), resulting in the loss of ail guidancecomputer data (H0060-603). This failure occurred between channel 11frame 10 and channel 23 frame 10 (between 10,955.858 and 10,955.861 sec-onds [03:02:35.858 and 03:02:X.861]) with the data going to all zeros.The computer word ending in channel 11 frame 10 was a valid computerword. Therefore, the problem occurred in less than 3.336 milliseconds.All computer words for at least 14 seconds prior to this problem areawere valid.
15-10

8/7/2019 Saturn V Launch Vehicle Flight Evaluation Report - AS-509 Apollo 14 Mission
http://slidepdf.com/reader/full/saturn-v-launch-vehicle-flight-evaluation-report-as-509-apollo-14-mission 199/254
60--0--
6.0.coo 0.450 0.500 io 4.0 5.0 I
RAffiE TIME, SECONOS
Figure 15-2. DPl-A0 270 Multiplexer Analog Data
O.COO 0.450 0.500 3.0 4.0 5.0 I
RAffiE TIME, SECONOS
Figure 15-2. DPl-AD 270 Multiplexer Analog Data
The 410K multiplexer is supplied by the 6D30 battery. There was a dis-cernible excursion in the 6D31 bus voltage and the 6D30 battery currentat the time of the failure as can be seen in Figures 15-3 and 15-4.
The voltage dropped from 28.74 to 28.65 volts while the current rosefrom 20.72 to 22.52 amperes. This disturbance lasted for 1.162 secondsand then the voltage abruptly increased and the current decreased. Whenthe current decreased, it leveled out at an average of 0.2 ampere lowerthan the current prior to the problem. The voltage increased to anaverage of 0.01 volt higher than the voltage prior to the problem. TheIBMacceptance test for the 4lOK multiplexer (S/N 442), showed a currentdrain of approximately 0.18 ampere. This tends to indicate that the410K multiplexer ceased to draw current. The first effect seen in thefailure sequence was the abrupt loss of data and a sudden increase incurrent and decrease in battery voltage. The second effect observedwas an abrupt return of current to a lower value and tends to indicateinvolvement of the 410K multiplexer power supply. A simulation of theseevents using engineering hardware is being attempted.
15.3.4 DP-1 Telemetry RF Output Power Fluctuations
The DP-1 telemetry RF power output measurement, 50029-602, was slightlybelow the desired level of 15 watts at liftoff and exhibited abrtlptchanges or level shifts during the flight. These shifts were notsignificant enough to cause any telemetry data interruptions.
15-11

8/7/2019 Saturn V Launch Vehicle Flight Evaluation Report - AS-509 Apollo 14 Mission
http://slidepdf.com/reader/full/saturn-v-launch-vehicle-flight-evaluation-report-as-509-apollo-14-mission 200/254
P
RANGE TIME, SECONDS1 V.
3;02:36. I
3:02:35 3:02:37 3:02:38RANGE TIME, HOURS:HINUTES:SECONDS
Figure 15-3. 6D31 Bus Voltage
23
22
iaJ
21
I I I I I .
10.954.4 10.955.4 10.956.4 10.957.4 10.958.4RANGE TIME, SECONDS
I V. . 13:02:35 3:02:36 3~02~37 3:02:38
RANGE TIM, HOURS:HIWUTES:SECONDSFigure 15-4. 6030 Sattery Current
15-12

8/7/2019 Saturn V Launch Vehicle Flight Evaluation Report - AS-509 Apollo 14 Mission
http://slidepdf.com/reader/full/saturn-v-launch-vehicle-flight-evaluation-report-as-509-apollo-14-mission 201/254
Evaluation of the DP-1 and DF-1 signal strength data indicates that theproblem may have been caused by an intermittent fault in the antennasystem which is cormion to both the DP-1 and DF-1 telemetry links.
Tests are being conducted on engineering antenna subsystems in anattempt to duplicate the observed phenomena.
Prior to launch the DP-1 transmitter was replaced two different timesto correct unrelated problems.
15.4 C-BAND RADAR SYSTEM EVALUATION
The C-Band radar performed satisfactorily during flight, although severalof the ground stations experienced problems with their equipment whichcaused some loss of signal. MILA transferred to skin track from 23 to33 seconds, then resumed beacon track. This action may have been pre-
cipitated by phase front disturbances which have been experienced onprevious flights. These phase front disturbances are caused by a suddenantenna null or a distorted beacon return and result in erroneous antennapointing information. The existence of this phenomenon could not beverified since signal strength strip charts were not available.
The BDA FPQ-6 rauar experienced two dropouts of less than 60 secondseach at 13,294 seconds (03:41:34) and 13,792 seconds (03:49:52). Thesedropouts were caused by ground station computer problems.
The MILA/TPQ-18 radar experienced two dropouts because of transmitteroverload. One dropout occurred at 19,140 seconds (05:19:00) and lastedfor 60 seconds. The second dropout occurred at 23,580 seconds (06:33:00)and lasted for 3 minutes.
A 5-minute dropout was experienced by the BOA/FPQ-6 radar, beginning at23,760 seconds (06:36:00), possibly because of unfavorable look angles.Another dropout was experienced by the BOA/FPQ-6 radar at 25,540 seconds(07:05:40) and lasted for 2 minutes. The ground station transmitteroverloaded and caused this loss.
Patrick Air Force Base (PAFB) used only skin track during their contacttime.
BDA indicated final LOS at 28,950 seconds (08:02:30). A sumnary ofavailable C-Band radar coverage showing AOS and LOS for each stationis shown in Figure 15-5.
15.5 SECURE RANGE SAFETY COMMAND SYSTEMS EVALUATION
Telemetered data indicated that the comMnd antennas, receivers/decoders,Exploding Bridge Wire (EBW) networks, and destruct controllers on eachpowered stage functioned properly during flight. They were in the
15-13

8/7/2019 Saturn V Launch Vehicle Flight Evaluation Report - AS-509 Apollo 14 Mission
http://slidepdf.com/reader/full/saturn-v-launch-vehicle-flight-evaluation-report-as-509-apollo-14-mission 202/254
v PAWING ORRIT INSERTION v S-IV8 SECDND IG:rITlONv BEGIN RESTART PREPARATIOFiSV TRANSLUNAR IYJECTION
ICNV/FPS-IS
-OI/FPO-6
-MlLA/TPO-18
-iTK/TPQ-18
mANT/FPQ-6
-tIDA/RO-6
-EM/F&-l6
I 1-tvAN/FpS-16
0 SOD1
loo0 15001
2000 25Do ND0 35DD 4Dw 4500 SO D0RAKE TIR . SECDNDS
I V I0 0:3D:w l:W:W
RANGE TIM E. HDURS:MlNUTES:SECO(DS
D NILA/lw-I8
-BDA/FPS-16
-BDA/Fpo-6I \BVM/FPS-16
I5mD 5500 6DiD 6500 7liw 75iD lxial ti 9ciw 95im 10.iJoa
RAWGE mm . SEWN05
w I . w1:a:DD 2:w:w 2:3D:Do
RANGE TINE . tIDURS:HlNUTES:SE~
BWFPO-6
BWFPS-16
IIWlPQ-1.9I I I I I I I
lo.m 10.5DD 11,DaJ 11.500.I2
lZ.Oar 12.500 13.DDD 13.m 14.um 14.500 24,oooP' TIIF.SECWIS
. .I3:oo:al 3:3o:oD 4:oD:m '=
FWGE TIME. H)vRs:WINUTES:5EQIIO
t
4
MI LA/lPQ- 18g$
I24,DDD 24.54) 25,OW 25.5OD 26.OW 25.500 27.DDD 27,500 28,Oal 7t3.m 29,olm
RANGE TI~E.SEQIIEI
7:w:w 7:m:w 8:W:W
RANGE TM . HDURS:MIWUTES:SEC0NB
Figure 15-5. C-Band Radar Coverage Sumnary
15-14

8/7/2019 Saturn V Launch Vehicle Flight Evaluation Report - AS-509 Apollo 14 Mission
http://slidepdf.com/reader/full/saturn-v-launch-vehicle-flight-evaluation-report-as-509-apollo-14-mission 203/254
required state-of-readiness if flight conditions during the launch hadrequired vehicle destruct. Since no arm/cutoff or destruct commandswere required, all data except receiver signal strength remainedunchanged during the flight. Power to the S-IVB stage range safetycomnand systems was cutoff at 710.2 seconds by ground command fromBDA, thereby deactivating (safing) the systems.
15.6 COMMAND AND COMMUNICATION SYSTEM EVALUATION
The performance of the CCS was excellent. No onboard equipment mal-functions occurred. Ground stations were able to acquire and maintaintwo-way lock with the CCS until S-IVB/IU lunar impact.
The RF portion of the CCS performed satisfactorily during boost, earthorbit, and translunar coast, with minor exceptions. Downlink datadropouts occurred during S-IC/S-II staging and at S-II second planeseparation. Other downlink dropouts were caused by vehicle antennanulls, multipath effects and station handover. None of these dropoutscaused any significant loss of data.
Uplink dropouts during the flight are unknown due to the loss of theuplink CCS AGC measurement, 50076-603, caused by the DPl-A0 telemetrysystem problem.
The last CCS telemetry data were received at 53,039 seconds (14:43:59)when the telemetry subcarrier was inhibited by a scheduled switchselector comnalld. CRO, GDS, HAW, HSK and MILA indicated LOS at S-IVB/IU
lunar impact at 297,473.4 seconds (82:37:53.4). A sumnary of CCScoverage giving AOS and LOS for each station is shown in Figure 15-6.
The performance of the command sectfan of the CCS was satisfactory.All ground comMnds transmitted with valid command subcarrier lockwere accepted by the onboard equipment on the first transmission.One command was attempted when the subcarrier was not in-lock andwas, therefore, not accepted. Seven commands were retransmitted. How-ever, the repetition of thes e cormnands were caused by ground stationproblems. The most significant ground station problem occurred at HSKbeginning at 40,961 seconds (11:22:41). Fiv% HSK commands were repeatedbecause the Message Acceptance Pulse (MAP) waiting period of 750 milli-seconds was too short for the transmission range at that time. Onfuture flights a change in the MAP waiting period to 1 second afterTLI +6 hours should resolve this problem. The CCS command history isshown in Table 15-6.
15.7 GROUND ENGINEERING CAMEPAS
In general, ground camera coverage was good. Sixty-five items werereceived ;rom KSC and evaluated. Two camras jamd before acquiringrequested data. Three cameras had bad timing, one camera was out of
15-15

8/7/2019 Saturn V Launch Vehicle Flight Evaluation Report - AS-509 Apollo 14 Mission
http://slidepdf.com/reader/full/saturn-v-launch-vehicle-flight-evaluation-report-as-509-apollo-14-mission 204/254

8/7/2019 Saturn V Launch Vehicle Flight Evaluation Report - AS-509 Apollo 14 Mission
http://slidepdf.com/reader/full/saturn-v-launch-vehicle-flight-evaluation-report-as-509-apollo-14-mission 205/254
Table 15-6. ComMnd and Communication System Corrmand History, AS-509
RANGE TIME TRANSMITTING NUM8ER OF UORDSSECONDS HRS:MiNS:SEC STATION COMIAND TRANSM ITTED REMARKS
21.277 05:54:37 GOS Terminate 1 Accepted
21.330 05:55:30 GDS Execute Maneuver B 1 Accepted
21.839 06:03:59 GDS Initiate Timeb ase 8 1 Accepted
23,443 06:30:43 CDS Switch to Low Gain 2 Accepted+
31.421 08:43:41 GDS Lunar Inpact Attitude 7 AcceptedCorrection
40.961 11:22:41 HSK Switch to Onnf 4 Accepted ***
41.114 11:25:14 HSK Wtch to Law Gain 4 Accepted***
41.7% 11:36:36 HSK LV Spin Up 4 Accepte@*'
41,855 11:37:35 HSK Terwdnate 4 Not Accepteff*
41.902 11:38:22 HSK Term1 nate 4 Accepted*-
41.966 li:39:26 HSK Terminate 4 Accepted***
42.082 11:41:22 HSK LV Spin Up 7 Accepted*-
42.100 11:41:40 HSK FCC Power Off A 3 Accepted**-
42.114 11:41:54 HSK FCC Parer Off 8 3 Accepted*-
4.151 11:42:31 HSK Sultch to Omi 1 Accepted-•
Wnd was transmitted twice because the groti station failed to capture themuter Reset Pulse (CRP).
"Conrand was retransmitted due to lackof verification pulses after first trans-
mission . Cmnd was not accepted since the cmnd subcarricr was not in lockat this time.
-Cmnds were accepted by the IU on the flnt transmission. Mwever. all therecwnds were retransmitted because the l&sage Acceptance Pulse (MAP) waitingperiod was too short.
-mnds were sent in the lyIP overrfde ndc (cormd words am sqwantlallytransmitted without waiting for a MAP).MAP waiting period problem.
lhts was done to get around the short
focus, one camera had fogged film, and one camera had a short run. Asa result of these eight failures, system efficiency was 88 percent,Only one tracking item (Melbourne Beach) was included in the 65 itemsbecause of low cloud coverage.
15-17/15-18

8/7/2019 Saturn V Launch Vehicle Flight Evaluation Report - AS-509 Apollo 14 Mission
http://slidepdf.com/reader/full/saturn-v-launch-vehicle-flight-evaluation-report-as-509-apollo-14-mission 206/254
SECTION 16
MASS CHARACTERISTICS
16.1 SUWARY
Total vehicle mass, determined from postflight analysis, was within0.80 percent of prediction from ground ignition through S-IVB stagefinal shutdown. This small variation indicates that hardware weights,
propellant loads, and propellant utilization were close to predictedvalues during flight.
16.2 MASS EVALUATION
Postflight mass characteristics are compared with final predicted masscharacteristics (MSFC Memorandum S&E-ASTN-SAE-70-83) and theoperational trajectory (MSFC Memorandum S&E-AERO-MFT-26-71).
The postflight mass characteristics were determined from an analysis ofall available actual and reconstructed data from S-IC ignition throughS-IVB second burn cutoff. Dry weights of the launch vehicle are basedon actual stage weighings and evaluation of the weight and balance logbooks (MSFC Form 998). Propellant loading and utilization was evaluatedfrom propulsion system performance reconstructions. Spacecraft datawere obtained from the Manned Spacecraft Center (MSC).
Differences in dry weights of the inert stages and the loaded spacecraftwere all within 0.4.7 percent of predicted, which was well within acceptablelimits.
During S-IC burn phase, the total vehicle mass was less than predictedby 1313.6 kilograms (2896 lbm) (0.03 percent) at ignition, and greater
than predicted by 574.2 kilograms (1266 lbm) (0.07 percent) at S-IC/S-IIseparation. These differences are attributed to: (1) less than pre-dicted S-IC dry weight and propellant loading at ignition; (2) greaterthan predicted upper stage mass; (3) shorter than predicted S-IC burnresulting in higher residuals. S-IC burn phase total vehicle mass isshown in Tables 16-1 and 16-2.
During S-II burn phase, the total vehicle mass was greater than pre-dicted by 214.5 kilograms (473 lbm) (0.03 percent) at ignition, and lessthan predicted by 208.2 kilograms (459 lbm) (0.09 percent) at S-II/S-IVBseparation. These differences are due primarily to a greater than
16-l

8/7/2019 Saturn V Launch Vehicle Flight Evaluation Report - AS-509 Apollo 14 Mission
http://slidepdf.com/reader/full/saturn-v-launch-vehicle-flight-evaluation-report-as-509-apollo-14-mission 207/254
predicted upper stage mass and a longer than expected S-II burn. Totalvehicle mass for the S-II burn phase is shown in Tables 16-3 and 16-4.
Tota: vehicle mass during both S-IVB burn phases, as shown in Tables 16-5through 16-8, was within 0.8 percent of the predicted values. A dif-
ference of 244 kilograms (538 lbm) (Q.15 percent) from predicted at firstburn ignit ion was due largely to a greater than predicted propellantloading. The difference at completion of second burn was 509 kilograms(1122 lbm) (3.80 percent) resulting from a shorter than expected burn.
A summary of mass utilizat-ion and loss, both actual and predicted, fromS-IC stage ignition through spacecraft separation is presented inTable 16-9. A comparison of actual and predicted mass, center ofgravity., and moment of inertia is shown in Table 16-10.
16-2

8/7/2019 Saturn V Launch Vehicle Flight Evaluation Report - AS-509 Apollo 14 Mission
http://slidepdf.com/reader/full/saturn-v-launch-vehicle-flight-evaluation-report-as-509-apollo-14-mission 208/254
Table 16-1. Total Vehicle Mass--; IC Burn Phase--Kilograms
-” ._____________._______________-_--------------------------------------------------------------------------
WOUND IGNI 7 ION HOLKJOYh CENTE R 0Yrsomu S-ICIS-I I
wars LR” (IELv.SE ErGlY E curorr EhDl YE CUrOff bEF.“AI,ONm-m--m---- _____-__________--__---_-_------------------------------...------_---------_
P-ED L‘! PllED .‘I WED AC1 PUEL) 4Cl mlEO ICI
________________________________________--------------------------.- ___________---_-__-----------------------RA.*GE T I”E--SEC
130607. 13U321.,165,3. ,.B,*Pu.
,,0*01. 1?0321. ,,O.“I.,.‘lll~ ,..PbO.. 2ib113.
21855. IIPLb. 2,l.D.
2lb. 24.. 27.11.
b31909 6312bB. 102blU.5Y96. b”C ‘. 5\Yb.
32. 77. ZL’I.
35. 36. .9.
288. 21‘. 112.635. b35. 3.3.
,ilZb. ldlb. 1026.
239. 10.. 239..--------. _ - - - - - - _ - _ _----- -__
21.b.2i. 22.3539. Lt.,,?.
IdU32,.71,300.
1,83Y.19,7.
100011,.
0000.2b3.
19.
98.3.0.
,,O.“i.11ba.
,800..,318.P3I8.
5958.2.l.
!Y.79.
>.a.
l”2‘.
2,“.- - - - - _ - - -
,b9 188.
130321.79.
18329.35dO.
),OPb. 2,151.IRP. 19,.
6.80,8. b‘3bbl.*311* “317.
32. 72.
36. ,b.
218. 21)d.635. b35.
:026. !J/b.
219. I”..._________ - ------ -.
r8.831. 22F,,OP.
269..
‘Yb2.
302.
IP.59.
3.0.rELl”Y IN ECTrLE
C*OSTWrSCrlocCET PSU? 1OZbi
IO..
lU2b.
IO..
1026. lU1b.
219. ,“..OTHER- --_.- -____-__-___-_.
rorhL SAKE
.___-_-_______m-em .--------
,bPbW. lb5901. ,bbdbl.
51e9. 5170. 5156. 5137..B ‘Pm.. .81,93. bY79OC. 481/V,.
,b,b. 3b55 . 36-C. 3055.
Till& L s-;a srrGE 117991. 118268. 117991. llB2 bB. ll‘90” . 118178. 1,790”. 118118. 1179’!0. 118116.rora INSTI (U U.,T 2337. ZO.,. 1037. 20.3. 1097. 1043. 2037. dU.3. 2 031. 2U.d.
TOTAL SPACECQAFT
7orAL tJPPE. ?STAG E bb73.3. bb 155LI” bb13.3. bbT55.9. bblU31. bbl2.b. bb1031. bbl2.b. bbC99 B. bb7dAd.____________________-----------------------------------------------..-----------------------------------------
TOlLI. vF*ICLE 295218‘. 29598bb. 2C17765. 29,IU\?._____________-______------------------------------------
Table 16-2. Total Vehicle Mass--S-IC Burn Phase--Poll&k Mass
----------------------------------------------------------------------------------------------~------------ __
CROUYO I‘~lT,ON *OLoDO*h LEYlER oureaR s-ICIS-II
EVENTS l 9* RELELSE EY‘lNE CUlOFF E*LIINt WT;FF SEPAY*TIO N_________-__.__-.__-----_---____---_-_--------_-------__--_-_--_-____-_-___________________
Pl‘D 4CT PRED 4C1 Pt?ED &Cl Pw7Ecl tcr PRED her________-____-______------------ --------------_----------_-_-_-_-_----____-___-__--------~------------------
l.NtE T;*E--S EC -b.bO -6.59 r.20 U.2” 135.2’ 135.1. lh5.0. lb..,” 165.80 ,b..80,-_________________-_------------------------------------
OS” ST&GE 2875Uil. 2.97310. 287500. 2.57310.LOX I* TINI: 3259657. 32bb,26. .,,Pl(lOi. 31956j1.101 BELO W TIW .65!39. CbbI3. .s,e.. .8,18.
LO” LJLLLIJE GaS I. 9. .2?. .17. 538.
fuEL ,Y rrv* ~‘2RbI9. l.190.3. l"Ob350. 13Yblbi.FUEL PELO Y TaYl. 9509. 9518. i3219. 13228.FUEL LLLIGE ‘IS 71. ,bO. ‘1. 173.
N2 WTI‘E 6bS 83. 80. 80. @O.
*ELI’J J* IV EOTTLE b30. b37. b3b. b27.CI(OST I.00. 1.00. 1.50. 1.00.
2Lll5W.
bObO.
d2623..,32,9.
‘59.
.3.
Z...150.
.--- --_---.
21II310.LL5037.
.e,.7.
b.75.2,tb.Z.
13118.5BO.
.S.
111.753.
28’50J.2563.
39b9..
7315.lS.9..
l,l,L.
532.“3.
175.750.
.-----w--.2b7310.
21&J.
“0.10.llbl.
19lbl.13l.S.
bbb..,.
131.
.---a----207500.
2291.15085.
7321).
16130.
9ErWRO ‘KET MOP 226.. 22b.. 22b.s ZZI.. Ilo.. Iab.. 2 ‘b.. 220;. 22i.i. 2:b”.OfME R 529. 230. 528. ill. ,1.. 230. 528. 230. 528. ‘3d.______-_____________-------------------------..----------_--_.--_- .----------_-__-________________________-~-
‘OTIL SIhGE 5‘3720.. 51133135. c,a525,.. .9Cbl5B. Lutzi),.. 1.e.57:>. 3’2Y97. 31.Y31. 3b5151. 3bb5...-----_-_--___-_-___-------------------------~--~-~--------------_-------------_-____________________________-
ToTaL s-IC/S-I, IS 11w.l. 11.00. JILLI. i i.UO. ii*.,. I i.0”. llrbl. I,.JU.,llbB. 11421.TOT&L S-Ii STIGE 107591,. 1915889. iJI5917. ,075LLB”. l”75.29. ,bl,.dl. Id15.29. ld,,.‘,,. ,d,5.29. ,ui5.>,.
701 s-,I/s-,“B IS IOb1. dub”. 8.1bl. OJbO. El&b,. CUb”. @.JLl. 8Obd. 8061. 80611..OTAL S-l”8 STAG E .60126. 2bU73lJ . 2bOl26. 2bO7 38. 159”db. ZbJSJB. 1>9lb. 265,38. I’ r92b. 2bO5rl.TOiAL IYSIW v*i!r “L92. .505. L.94. ‘JO,. ..12. .5‘5. ..*2. ‘SJ,. ..Yi. *5*5.
TOT&,, SP.CE‘Q&fi llriO3. Ilil22, 111203. 111122. *iAlb *. Irilzd. lirdu,. 11,122. lil203. 111122.__-_________________------------------------.----------.------ -_-----__---------_---------------.-----------
TOTNL “PPERS TLGE l.ll2.0. 1..717,.. 1012.0. 16lllA.. 1.70552. a.71u2*. 1.70551. ,.llU2b. I.lJ.79. ,.7”953.-----..-_----_-______-----------------------------------------------------------------------------------------
TO1A.L VEVI CLE b5S8L.C. b5055.E.. 6.23 5.. b.l?(lll. 2532590. 2510,.9. iB.35.i. 1B.,i,b3. 11130230. 183,.9,.r-----__________________________________--.----------------------------------------------------___
16-3

8/7/2019 Saturn V Launch Vehicle Flight Evaluation Report - AS-509 Apollo 14 Mission
http://slidepdf.com/reader/full/saturn-v-launch-vehicle-flight-evaluation-report-as-509-apollo-14-mission 209/254
Table 16-3. Total Vehicle Mass--S-II Burn Phase--Kilograms
s-I‘,s-II SW.LL 1s 615. LA‘. 0. 0. 0. 0.s-ICIS-II LARGE s 3957. 39.5. 3957. 39.5. 3957. 39.5.s-,c,s-II PRODEc. LYT blb. .A,. 312. 309. 0. 0.________________________“_---“----”--------”---------“-----------“-----------------------------------.----
TOT&L s-,c,s-I, IS 5ie9. 5:io. a270. 4255. 3Y57. 39.5.~________~__________“~~~~~~~~~~~””___.__~_”__~_____““__~~_-~~~~~““.---~“~---_~_~_______~~~~~~~~”~~~~~~~~~~~~~
DRY S1.W 35-02. 35.3.. 35‘02. 35.36. 35*02. ,5.,.. 35.02. 35.,.. 35.02. 35*,*.
LO” IN T.W. 3’6P90 . ,?9,30. 378990. 379139. 378536. ~78b83. 811. 550. LIP. -13.
LOI BELO W :fim 731. 737. 73b. 731. BOO. OUU. ,I,. 781. 7C I. 781.LO. “LLLGL 6.5 1.9. ..9. 1.9. 1.9. 151. 151. 21.7. 22.7. 2.?5*. 2d5..FUEL IN T.W 7231.. ?2!21. 72309. 72115. 720941. 719”“. 1,bU. 13.2. 15D5. Idab.
fUEL RELOw Tt.yR AD.. 10.. 110. 111. 121. 127. 12,. 123. 113.FULL ULLaGE C&S 51. 511. 51. 59. 58. 59.
12’.2.91. 59,. 599. 59s.
IYSULblI O* PUR GE GLS 17. 17. 0. DC 3. 9.l I)OST
srar
20..
-is.
20..
-i3.
cl. 0.
I.YI 13. 1;.
0. 0.
2. 1. 2. 2. 2. 2.O’MER 3.. ?*. SC. 3.. 3.. 3.. 3.. 3‘. 34. 3..-_-___________________________________-”-__---_-_-_-___-----~”---------------------------------------------
TOTLL s-11 Sl4GE .9”02?. .9801.. .e7e.0.. LLI??P,. .1123b. re1193. 4,572. .lAle. b13@9. l O*,b.-_-I_-__-________“__“-------~----______-___”_-_____1_“-_-----_-_------------~------~---~------------ -___-
TOT S-II/S-I”73 IS 3b5b. 3555. 3b5b. 3b55. Sb5b. 3655. 365b. 3b55. 3b5b. 3b55.
TOTAL s-Iv9 SlA I’L 117991. 1 r82b8. ~179DD. 11e11e. 117900. ue17e. lllY0 0. 11e11e. 117190. 116115.TOTfL IU 2937. 2D.s. 2037. 2iH3. 2U37. ;u.s. 2U31. INS. 2037. IlB.3.TOT&L ‘PLCECPIFT_,,,,J,__.____,,___,__1~~“1___~~~~~~---~~~~~~---~~~~~~---~~~~~~-“-~~~:---~!~:---~!~~~---~~~~~---~~~~
TOTa&. UPP ES SfaGE 176125. llC372. 17CD?,. l?bZBl. 1’4935. 17.ZI. 1699.1. l?Dl#b. lbV939. 1 IOlU..----------_---_-_______-_---_-_---____-_-_----------_-----------------------_-_-_----------------------------
?OTLL VEUI CLE bb’1365. bb7558. bbblll. bbb,,D. Cb519P. LOS-IL. 1115lB. 111305. Zl329. ZllAPI.-_-------------------------------_--------_---_----------------------.---------------_------
Table 16-4. Total Vehicle Mass--S-I I Burn Phase--Pounds Mass
-------_-__~--____---“------“-___”_”_----_--------“-“-““-~-”--”-“-“---““-~-----------------”---------------
s-IC IG*lTlo* 0-I I s-11 5-11 S-l 1 Ib-,“B
Eb’EVfS IGYlTlOri -blNSfLGt ENGINE CUTOFF SEPWMT ,ON--_----_-_____-----------“-------””------------“---“--------------------------------------
Pr(ED LCT PSED 4CT PPE” Kl POEL: LCI WtLU Act-_---““_------“-_---------.----------------------------------”-----“---------------------------------------
“..WGE 7 I WE--SC‘ -...0 -..50 lb?.5U lbb.50 ,.*.5u lb8.5U 55b.9lJ 559.05 557.90 ,b‘.Y”------_-____-____-----------------_------ ---------------“-_----------“--------------------------------
s-IC/S-II S”.LL IS 1356. 135.. “. 0. 0. “.I-ICIS-II L.IGE IS 1725. ICPP. 8125. Bb9Y. 8725. e.*0.s-IC/5-I 1 PnOPCLLaYI 1ZrO. 13.7. b01). b13. a. 0.-~-----_________-_--------“---~“--”””---------.__“_-_“_““_-___--__.__“___-““_----_-____--~----------------
101w s-,c/s-I, IS Al..,. 1,400. 9.1.. 9382. 8725. e.99.-------_-_“__-__._---_“-_---_-__---__--”--”----------“------------“---“------“-“-“““---“----------~-------
WV STLGf 79u50. 7S)12lJ. 7UO5U. ?SlZO. ?SJ,“. 7812U. 71.J5”. ?@,a". 79050. ?1)120.LOI I* 1.m 1135531. 835959. c135531. 835859. 83.525. O, LBS, . l(1l.u. 121$. ,.99. 911.LOI BELOW r*w lb25. 1625. lb2.. 1626. 17b.. 1 lb.. 173b. 1?3b. ,730. 173..LOI “LL.GE Ga5 329. 329. 329. ,29. 333. 333. L955. .955. 4971. l YIl.FUEL ,* TLU’: 159.27. 159Or). 159*1,. 1580Cb. 1589.1. 151516. ,..l. 2%0. ,318. 293).CUCL BELO W Tam% 231. 231. 2L.. 2.5. .?I,!. 2w. 272. %?Z. 2?d. 112.CUCL “LLLGE G.5 129. 129. 119. 129. 130. 130 . 1313. 1313. 13a1. ,,,A.I~SUL~flON WQGE GLS 31. 38. 0. 0. 0. 0.Fr)OST LSO. 450. 0. 0. 0. 0.STLIT TLIW 30. 30. so. 30. 5. 5. 5. 5. 5. 5,.D-MEW 7b. 7b. 7.. IL. 7.. 7b. 7.. ?b. Ib. Ib.---------.-----“_-------------------------------------------”---“---------------“““---------------------
TOTAL 5-11 SlfiGE_________________ ‘“Z” :_‘“ ~“fr_‘“I~~~~. 10?5*01. lO?*lOl. 107407B. 9lb51. 9Ob5Do 912.9.PO1.S._----___-__-___--“-_------““-_“-------__-------------------~
TOT s-1IIs-IvB IS OObl. eOb0. ea.,. 80bO. 8Ubl. El”.“. ev.1. e*)bu. 8011. elao.TOT&L L-a ST&GE 210126. 2 C‘O? ,S. 25992b. 2 bD53S. 25992b. 2bD 538. 259920. 2bD53.. 259921. 2b053,.TOT4L IU r-92. 6505. .*92. 6505. L.92. 4.505. .*92. .,D5. L.92. 6505.tD7.1. SPLCEC ”.CI 11’20,. 111122. 11120,. 111122. lll203. 111122. 1”21?8. 102O95. 10.?170.---------------------------------”------------------“““-------”-“.“-“---------------“----------------!~~~~~
TOI..L ULP EP ST&G E 3SY112. 39e.25. 303bO2. 3S.225. 383bbd. 3@,*2d 5. 37.057. 375199. 3 I.b52. 3 ?5lY3.-----~--------_------------------------------------------”---”-----“-----------------------”------------
TOT&L “EWICLE
16-4

8/7/2019 Saturn V Launch Vehicle Flight Evaluation Report - AS-509 Apollo 14 Mission
http://slidepdf.com/reader/full/saturn-v-launch-vehicle-flight-evaluation-report-as-509-apollo-14-mission 210/254
Table 16-5. Total Vehicle Mass--S-IVB First Burn Phase--Kilograms
-------__-------_-------------------------------------------------------------------------- -----_____-___
s-IC IGNlTlOl. s-Iv9 PI"3 S-IV@ s-Iv3EVENT I IG-.lllOh *.INST.‘t thbiht CUTOFF tYu Dt‘..
------___-----____-------------------------------------------------------------------------
WED 1‘7 WED ACT PRED ACT PRLY A&f PYtD &CT-----_-_-------___--------------------------------------------------------------------------------------------
RbNGF TI*t--SEC -b.bD -b.5d 561.00 ,bl..C i 5b3.50 bb5. YD 7”Z.iP 731.,* 102.:il 7OJ.lO-----------------------------------------------------------------------------------------~--------------------
OR* STAGE 11*01. 1,333. ll33.. 1,330. 11386. 11330. 11329. i izoc.LO” 1N 1a-a
1,623. 1,‘bS.(15912. Sb23O. et.939. 86230. 85114. s.101. bI3iD. b, lb. b1292. bla,O.
Lo* SELO. IAN. lbb. 1bbI lbb. 1bb. 110. 100. 1eu. A:‘. ill:. 130.LO” ULLLGE GLS 23. 20. 23. 23. 26.FUEL IN ,.?a
101. ‘1. 135. 17.19733. IP154. 19726. 19b57. l9b7.. 1hb-f). 1~703. 1.015.
GEL BELO. TAYIC1.756.
21. 21. 2b. 2b. .?b. Zb. 20.FUEL ULLL‘E G.S
26. 2b. 2b.
20. 14. 2u. 19. 20. zr). bl. oi. b.. bi.“LLLGE SOCKET WOP 33. 53. 9. I.N’S ~SOPELLLNT 235. 299. 295. 299. 21,. 299. 2e9. 2wa.“ELlUV IN BOTTLES
283. 2Y3.201. 206. 2Oia 20b. 200.FROST 205. 1.J.13b. ia2. 179. 182.
136. *5. .5. ‘5. .5.aI&PT T&WC 6.5
.!J. -5. 65. 05.2. 2. 2. 2. 0.
OTMER3. 3. 2. 3. 2.
TOiLL S-I”8 ST&GE 117991. 11e291. 11703. 11a1oe. 1,7bbb. 117Y33. ae233. (IUL(“.. 9e 195. U(17 7U.------___-----____-_OfLL I” ---;o;;---------------------------------------------------------------------------------
. 20*3. 2037. 2063. 2037. dW3.TOT4L SP.CECP.CT
2Li37.
-----____-~____-----------------------------------------------------------------~--~~~~~----~~~~--
23.:..b3.7. bb309. Lb367. .b309. *63L7. c‘lD9. .b3.1. LblUY. bb367. .b,W.
e--w. e_TOTAL UPPEIST.GE L333.. 68352. *(133.. ‘BS’L. .333&. U35d. ‘838.. *a35r. rest.. re3>2.--------------------------------------------------------------------------------------____________ ________
TOTAL YEliCLE
Table 16-6. Total Vehicle Mass--S-IVB First Burn Phase--Pounds Mass
------------------_-_---------------------------_-----------------------_--------------------_-------
s-IC IGNITION s-IVB S-IV0 b-IV6 t-I”3
EVENTS IGklTIOh q LlhSfAGE EkGIhL CUTOFF LW 0EF.I----_--I_-___-_------_--_-------------------_---_-----_-------------------_-----_-
WED *C T PRED K T WED Ml PREO ACT WED LCT------------------------_----------------------------------------_----------
9hNGE Ti*P- SEC 4.60 -b.50 561.00 563.iLl 5b3.54, 5b5.90 702.2e 700.5b 101.50 700.90------------------------------------------_----------------------------------------------~-----
0.T CTL‘ E 25153. 25033. 25099. 2.979. 250YI. 2.079. 2LPbC . 2L#C4. 2.Ob.. 2.S.C..?)I IN TAN K IBVb7 0. 190101. 189‘b.. 1901Db. 1e91e9. I6ObZ l. 135180. llb41 1. 135iZb. 13b357.LO” BLLOY TaNI. lb,. 3b7. 3b7. 3b1. lP7. 39’. 3v7. 397. 39:. 1YI.
LOI UU4C.E G&L 39. 51. Lb. 51. 52. 53. 23a. 170. 232. 110.
CUE&. IN :.w 43*52. L3.M. .3** 1.. .,LB‘. L3331. l 3375. 32355. 32567. 32332. 32525.
CUE&. BELW TANK .I. 43. 50. 5B. 58. 58. 58. 59. 50. 50.
F~JEL U&AGE I*5 65. 62. L5. C.. -6. .b. 1.1. 135. Aal. 135.
ULLICIE KJCKET Pl)DD 110. 118. 22. 19.
LO5 PROPELLLN T b30. bbi. 5 30. 661. 630. bb1. 62b. b57. b2b. b51.
*EI.IW IN BOTTLES CL5. 635. .*.. s55. r.3. 653. SY?. CO,. SM. .0-.
C90Sf 300. 300. 100. :30. L OO. 100. 10”. 100. 100. 100.
5. 5. 5. 5. 1. 1. 7. 5. 7. 5.
56. 55. 5b. 55. 5b. 55. 5‘. 55. 5b. 3s.-------------------------------_---------------------------------------------_---_--_______--
TOT&L L-,“I) SllG E ZbOAZb. 2b0736. 259770. 2bOlBb. 259610. 259Y10. lVb52l. 1e51ro. IsUse. awma.--------------------------------------__----_---u------------------------------
TOT&L IL! 6.92. LSO,. s.92. 6505. c.92 . 6505. c.92. -505. UB2. 6505.TOT&L SPKEC(IICT
--
---.--.-.-------.--------------------------------------------------------------~~~TOT&L UPPEILTL tE aobblo. ,DbbOO. 1Dbb70. lObbOO. 1DbblO. 1 ObbOO. lDbb?J.lObbOO. IObb?C. IOCCDD.
TOTAL VEMICLE 3bb’I9b. 367s3b. 3bbb.L. 3bbWb. 1bb‘S”. lbb5YP. 3011Y1. 302399. 30~108. 302109.-----------------I-----------------------------------------------_-_-__----_-_-----___
16-5

8/7/2019 Saturn V Launch Vehicle Flight Evaluation Report - AS-509 Apollo 14 Mission
http://slidepdf.com/reader/full/saturn-v-launch-vehicle-flight-evaluation-report-as-509-apollo-14-mission 211/254
Table 16-7. Total Vehicle Mass--S-IVB Second Burn Phase--Kilograms
________________________________________-------------.~---------------------.----------------------------------
s-1 "I 5-l VU S-l"8 5-l YB WI‘E‘UIFT
LYC%TS ,G\lTlOX Y4, ,STAGL t:4lJ, .L CUTOFF tw "EC.. LtP.**TlOh____________________------------------------------------------------------------------------
WE" .CT DwEi ACT PUED 4c: PUE" ACT WED LCl___I_____________________________________________________--_---__------_-------------------------------------
SLNGE T I-T--SEC II9,,.*0 s9,2..3 dl),'.‘O u+,..*L, VdbU.2. 9.bJ.d. Wbb.43 YiOl.Sd I‘ULB.." 2"U5".DD
________-________________________̂ ______----------------------------------------------------------------------
Dar STIGE 1,323. 112t.9. 11323. 1,265. 113d3. AlLbY. 113.23. Al:CY . 1,323. liduP..C?. :4 7.w . 6,225. 6,772. 6,103. bl6SD. ,9*3. a.%.. ,PbS. z-.9. 11176. d1.0.
LO. BELO W T.NI 160. 166. 180. IV”. 180. IaL). ,bO. AdD. Ibb. ICb.LOX “LL.GE G.S 172. 12.l. 112. 12-a. 2011 2vc. dbl. a,. Zbl. dU,.
FUEL ,*i 1*n(* ,3bZ7. ,317,. 13519. ,113O. IO.0. 1185. ,031. 117‘. 90,. ,135.
FUEL UELO. T.:w 26. 26. 26. 26. d0. 26. d6. 20. 21. 2,.
FUEL ULL.GE GIS 159. ICY. 160. ,50. 21v. lU3. ‘IV. d(I). d79. db,..PS P90PELL.N~ 236. 2.6. 236. 2.6. Z?‘. i‘l. 13‘. 1.1. al*. ddl.
*ELlu * IY BC~TLES 163. 173. !.3. 110. 79. 1,‘. IV. 113. 1V. 113.CSOST ‘5. ‘5. ‘5. ‘5. .5. ‘5. ‘5. ‘5. ‘5. ‘,.
ST.9T 7.w G&S 2. 2. 0. 0. 3. Z. 3. 2. 2.OTWE P 25. 2‘. 25. a. 25. 2‘. d5. d‘. 2:: d‘.____-_-_____ -_____-___-______--_---------------------_--_-__---------------------------------------_---_----
1OTLL s-Iv0 STAG E 8715‘. 87160. 86991. 8761‘. 15.93. ,003‘. I,‘,.. ISPYI. ASZI‘. 15135.-_-_-_-______-______------------------------------------------------ .--------------------------------------_-
T0T.L IU 1037. 2”‘:. .!:37. dO63. 2U37. 2.8‘3. ZJ17. d0.3. d037. 24.3.TOtbL SPCE CSAC T 663.7. ‘6309. ‘63‘7. .6,09. w3*7. ‘1100. ‘b3.7. ‘6309. ‘2). t.25.____________________-----------------------------------------------------------------------------------------
ToTaL UPPEI STLGE .v,e.* ‘835.2. .9,R‘. ‘U,,2. .R ,V‘. ‘8152. ‘V,B‘. GUS51. 2663. ZbOV._-_-_-______-_______------------------------------------------------------------------------------------
7OlW V*ICLE_,____________________“1~111__1~”!1__!~~~~!~--!~~~~~~---~~!~~~---~~~~~~---~~~~!~---~~~~~---!~~~~:---!~~~~:
Table 16-8. Total Vehicle Mass--S-IVB Second Burn Phase--Pounds Mass
-_-I--_-_--___-___-_--------------------------------------------------------------------------------------
I-I”8 s-1 YE! S-IV8 s-1 VB SPaCEcIaFI
EVENT& AGhlfIOM ‘4.X NSTAGE ENGINE CUTOFF END DLCLV SEP~RLTIO*_-__--___-_-_-____----__-_-____--_---------.---------------_--_---------------.____________
WED ClCl WED LCT POE” LCT PliEY AC1 WE&J LCT--------------___-_-__I_________________------------------------------------------_____--------------------
I)a’.GE 1 IME-SEC v9*,.90 llY,3.‘0 VV,‘.‘O BI,‘.PO 1*2CU.1‘ YdS3.Z‘ %!~S.‘O9263.50 ,‘UC..‘O POU50.00-------------------_~--_----------------------------------------------------------------------------------
DPI ST&GE Z‘Vb‘. 2.U“. .?.Vb‘. /‘II“. 2.9.‘. Z‘V“. Z‘V.‘. Z‘V“. I‘Vb‘. 24.BL‘.LO” IN T.?w. 13.979. ,36,3‘. 13c’lD. 135916. ‘39‘. 5.15. ‘33‘. 5357. ‘13U. 515v.LO” BELO W 7.W 361. 3:57. 397. 397. 3Vl. 3Y7. 3v7. 3v7. 367. 361.LOI ULLLGE GaS 380. T65. 311. 266. 5%. ‘51. 5 76. ‘52. 576. ‘51.FUEL IN ,.NK ,“lJ‘3. 3L37”. 29917. 3P270. 12v5. Zbl‘. 1276. 2590. 2ae5. 250‘.
FUEL BLLM IAYC 51. 58. 58. 5u. 50. LU . 5”. 5s. ‘I. ‘V.FUEL “LL.GE G.S 352. 330. 5;3. 332. b16. 616. .I.. b2.. bib. 020.LPI PPOPELL~N T 521. 563. 521. 5‘3. 517. 533. 511. 533. ‘VS. 501.
WEEL IW’ IN BOTTLES 31b. 376. 3,b. 375. 17b. 152. 176. 25l. 176. d51.FROST 100. 100. 100. IOU. 1UJ. 100. 100. 100. ,OO. IOD.ST.CT 7.w GIL 5. 5. 1. I. 7. 5. 7. 5. 7. 5.OTWER 56. 5). 56. 55. 36. 35. ,C. 55. 56. 55.- - - - - - - - - - - - - - - - - - - _ - - - - - - - - - - - - - - - - - - - - - - - - - -- - - - - - - - - _ _ - - _ - - - - _- - - - _ - _ - _ - _ __ _ _ _ __ - _ _ _ - _- - _ _ - _ I - - - - - - - - -
TOtAL S-,“B IT&GE 1921‘3. 193691. 19,796. ,93157. 36157. ,53,0. 3.470. 35.?**. 33719. 3‘0,Z.-_-----~--------_--------------------------------------__-___-__________----__-__________-________----------
TOTAL IU ‘192. ‘5U3. “9‘. ‘505. “92. .,o>. “ii!. .SL1,. “92. ‘b&J>.tOtaL LPKLCRLFT 102,78. I”d”95. lOd17U. 13d”PS. AUlrlo. IdlJY’). ,“d,iD. ruru.5. i3.3. b 00.-------------_-__--------------------------------------------------------.----------------------.--------- __
tot&L UPPEIISl.GE-_--_-________________“““I”1__ 4n92”:__~~~~~~~--~~~~~~:--~~~~~~~--!~~~~~~--~~~~~~~--~~~~~~~--. 5u72-
,*(I>.------_-----_
TOTfL VuICLE 298813. 300097. 2VB‘bb. iYY757. 1.0017. I‘lPSO . ,‘U7*6. ,‘,BbU. 3YScrl. ‘,l7Y7.I-.------------_----------------.-------------_---------_--_----_----___-----------------------------------
16-6

8/7/2019 Saturn V Launch Vehicle Flight Evaluation Report - AS-509 Apollo 14 Mission
http://slidepdf.com/reader/full/saturn-v-launch-vehicle-flight-evaluation-report-as-509-apollo-14-mission 212/254
Table 16-9 Flight Sequence Mass Summary
YASS HISTORY
S-IC STAGE. TdTALs-IC/S-II IS* TOsALS-I! STAGE. TOTALS-I I IS-1ve IS9 TO TALS-IVB STAGE, TOTALINSTRUPENT UNITSPACECRAFT, TOTAL
2284836. 5937204. 2283308* 5033635.5189. 11441. 5170. 11400.488027. 1075917. 408014. 1075YB9.
3656. 8061. 365Sa 8060.117991. 260126. 118260. 260738.
151 FLT STG AT IGNTHRUST WI LDUP
1S T FLT STG A T HDARFRdSTMAINSTAGEN2 PURGE GASTHRUST DECAY-IEENG EKPENDED PROPS-11 INSUL PURGES-II FROSTS-IVB FROSTTHRUST DECAY-OE
2037. *492. 2043e 4505.50440. 111203. 50404. 111122.
2052179. 6508444. 29SOLlbL. b505548.-38414. -84690. -397b9. -81677.
2913765, 6423754. 2911096. 6417871.-294. -650. -294. -650.
-20759100 -4576601. -2072527.C4569142.-16. -37. -l6* -37.
-821. -1811. -849. -11173.-189. -410* -1890 -416.
-17. -38. -17. -38.-204. -450. -204. -450.
-90. -200. -90. -200.0. 0. 0. 0.
1S T FLT STG AT OECO 8362190 1843549. 836906. 1845063.TnRUS T DECAY-OE -3206. -7245. -3398. -7493.S-IC/S-II ULL RKT -33. -73. -33. -73.
1ST FLT STG AT SEPSIG AT SEPARATION - -S-It/S-11 SMALL ISS-IC/S-!I uLL RI(T
832899s 1836230.-165901. -365751.
-615e -135ba-83" -184.
e-3474. 1837497.-166261. -366644.
-614. -1354.-113. -1es.
?ND F LT STG AT SSCFUEL LEADS-It/S-II ULL RKT
2ND FL? STG AT IGNTHRU5T BUILDUPSTART TANKS-IC/S-II ULL RUT
2NL FLT 3 mG AT MS%A:?;STCGf
LESS-IC/S-II LARGE ISfD t ENG PROP
2ND FLT STG AT COSTnRuSf DECAYS-IV8 ULL RUT PROP
2ND FLT STG AT SEP 211329. 465902. 211121. 465442.
STG AT SEPARATION -41389. -91249. -409936. -90249.
S-IIeS-IVB IS DRY -3175. -7001. -3172. -6995.
S-II/S-IVB PROP -480. -1060. -483. -1065.
S-IV8 AFT FRAME -21. -48. -21. -4O.
S-1 VR ULL RKT PROP -1. -3. -1. -3.
S-IVB DET PKG -1. -3. -1. -3.
3RD FLT STG A T SSC
PREDICTEDCC LBW
ACTUALUG LBM
666299. 1468939. 666515~ 1469415.0. 0. 0. 0.
-187. -414. -184. -407.
6tdllle 1460525.-587m -1296.
-11. -25*-312. -689.
666330. 1469DOY.-588* -1297.
-11. -25.-309. 483.
665199. 1466514. 665420. 14b7002.-445571. -982317. -446012. -963289.
-4093. -9025. -4094. -9027.-3957. -0725. -3945a -L)699.
-62. -138. -62. - -13a.
211513. 46b308.-181. -401.
-2. -5.
211305a cbSU4a.-lUl* -401.
-2. -5.
166258. 366537. 1.66504. 3b7079.
16-7

8/7/2019 Saturn V Launch Vehicle Flight Evaluation Report - AS-509 Apollo 14 Mission
http://slidepdf.com/reader/full/saturn-v-launch-vehicle-flight-evaluation-report-as-509-apollo-14-mission 213/254

8/7/2019 Saturn V Launch Vehicle Flight Evaluation Report - AS-509 Apollo 14 Mission
http://slidepdf.com/reader/full/saturn-v-launch-vehicle-flight-evaluation-report-as-509-apollo-14-mission 214/254
Table 16-10. Mass Characteristics Comparison
- - l - r- l - l - - - -- - - - - - I - - - - -- . - - I - - - - -- - - - - - - - -L- - -- - - - - - - - - -
MASS LONCI~UDI~AL RADl AL ROLL HOMtNlPITCH MO MENT YAW MOMENTC.G* II S1A.l C.Ci* OF INERT IA OFINERTIA OF INERTIA
EVENT _-___---------------_____LI__1_L________---------------------------------------------
KILO O/O YETE RS METER S KG-ML o/o KG-M2 o/u KG-M2 o/oPOulrtDS DEVa INCHES DELTA INCHES DELTA KAO-6 DEVeAAO-b DEV. I( ;U-6 iJtv*
-----_-_-_------_--_------------------------------------------------------------------------------------------
130408a 9m32b 0*0594WED 2075009 3b7et 2e3409 2.506 AL*508 Abe434
S-IC STAGE DRV ~-~~~~~-~~--~-- m--a-m ---m-m s--m- a--mm-w --s-m-a
130322r 9m32b u*uoo U*0594 UaOUU3ACTU AL 2873Ao. -0406 3b7e2 Urn00 2a3409 OaObbO 2a504 -0.06 16,498 -0.06 lb9423 -ogOb
---------____------_--------------------------------------------------------- -----------_--------___________I
51YO* 41.628 0*1501PRED 1144A* 163Oa9 5e939b 0.132 oe319 O*U79
sl~c,se~l ]NTERI -I~~~~ -.~-~~~ -- -----a m-w -m- ---a- ---m--s ----w-s
STAGE e TOTA L 517A* 41 .b2b JaWI) Vel5OU U.bJUUACTUAL 114UU~ -u.35 lb38a9 UaUiJ 5.9396 U.ULJUU u.L31 -il.35 J.U70 -J.35 3*u79 -u.r5
35403m 47*894 OeA772PM0 780SOa 1885.6 6.9778 0.577 1*94* A.956
S-11 S~AGE,DRY e-a------------ --m-me -w--m m s-ma- ------- --B--B-
35435* 47*894 UeuOu JmA772 b*JUuUACtUAL 78120a OaU Y Aeeba6 OeOU b.9778 JeOJUU 0*577 0909 la94b 0.09 A.938 J.09
-------------------------------I--------------------------------------------------------------------------------
365ba a*471 O.Ob41PRED IObAr 2bA7aJ 2m5495 UmDb5 J*U44 0*344
+(,,+,“I INTER- --ma--e-------- m----- 11-B-- mm -m- ---s&-m B-m----
SIACEctOtAL 365ba 66r471 U~UOU UaUb41 J.JUJG
ACTUAL 8UbUe -UaU3 2617.0 0.09 2.5499 OaOOOU OaObS -O*UU oa944 -0moo 0*044 -ueoo___--_-_-_---------_-------------------- ----------------------------------------------------------------------
11401* 72.594 0.22b5PRED 2515~4. 2055e7 809A96 0*082 Cl*301 O-299
SI,V” S,AGE ,DRy ----I---------- s-mm-.. -m-B-- m---- ----m-m s-----m
11353* 72a534 G.004 Om2265 U*UYVJ
ACTUAL 25039. -Ua47 2155m7 u*urJ Da9196 i)~OU UO 090112 -oar7 08L99 -0.4 I O*Z YB-0a41
--------------------------------------------------------------------------------------------------------------2038m 82.407 0.4721
PRED 4492 l 3244e4 18.5084 0.019 O *OAO O*UO9VEHICLE INSTRUMENT--------------- m-mm-w mm---- w-m-- w--am-w mm--m-m
UNIT 2043e bZe407 OaDO O 0.472A U*OUUJACTUAL 4505a 0.29 3244a4 o.o015*5a84 uauuuu Urn019 Ua29 OaOAU 3a29 O~UUU-W ~8b
--------------------------------------------------------------------------------------------------------------
50441* 91*544 oa1093PALO 111203* 3bD4m 1 4a304b Ue092 lab03 A#606
5PACECRAtteTOtAL --------------- ---we- ma-m-- --me- --w---m ----ma-
50404. 91*541 -0aOD2 O.ilOb Ua0013ACTUAL 111A22* -0aOb 3604eO -0a09 4.35bb 0.0519 UeO92 -0m44 A.605 O al lab08 Uel
--___--___--_-_-__-_----------------------------------------------------------- -------------------------------

8/7/2019 Saturn V Launch Vehicle Flight Evaluation Report - AS-509 Apollo 14 Mission
http://slidepdf.com/reader/full/saturn-v-launch-vehicle-flight-evaluation-report-as-509-apollo-14-mission 215/254
Table 16-10. Mass Characteristics Comparison (Continued)
_I__________________*******************************************-~-~~*-*****-**--------*---*--*--**-----------*VIASS LONG I IUD I '(AL RADIAL ROLL *o”;“rl PITCH b((ivt.LT YA,, cl’,! t 1, 1
C.Ga IA SfA.) C.Ll. c)F I’ltHflA UF Iiut~tTlA Jf I\tL!iTIA
EVENT ***************-*********-------- **_*****_******_*___~~~~~~~~*~~~**~*~~~**~~*~~*~-~*~
KILO LI/o YETEdS ‘4 E T E R 5 q;- ,:2 3 / 3 SC!-‘, 2 J/U ‘( I, - L’ i L/d
POUNDS OEV. INCHtS CELTA lNCHE5 JELTA AA:-6 >tV* AlJ-b JEV. 7 1 J-t Jtv.***********-- ***************************-****--*-- ____.__*_*_______--_-~---*-----*-*----*--*-*-*-------*---***-
2952181 l 33.347 0.0039
PRED 6930444. 1194.7 Ua565 3.5d.2 5;w.s39 33 :.*dv1st FLIGHT STAGE --------------- ****** ****** ***** _****** me*--**
AT IGNITION L95OR61. 311837L J.u25 u.4342 d.dJ”ZACTUAL 6535553. -0aiij llY5.7 a.9d d.1655 d,d,9~ 3.531 -U.ll jlJ.57/ -r.r7 313.413 -r.r~
________~,__________*******************************************~---~~--~~~**-~-*-~-*------**--**-~*~----*----**
2913766s 33.294 3.;;)r21ST FLIGH T STAG E PRED 6423754. 1192.6 U.b55 3.oi7 dd;.e 1. :,a..372
AT n(,LDDOr,,j f,qM ---W-Y---------****** ****** ***** ******* *******
RELEASE L911JYY. 3J.318 J.J24 J.VJ4L “.JJVd4CtUAL 64179 13e -J.Jd 1193eb u.95 J.1555 ,.IVJ~ 3.6;1 -...*.I- ddJ.>lu -w.i- <Yv.‘.>b -U.AJ
************* ____________________********************~~~**~~~**~-~~--~*~~-**~-~~~~*~-~~~~~*~~~~~~~~~*~-*-~-~~*
836225. 46.415 O.Jl*bAST FLIw T STAG E PRED 18435489 1827.7 d.5 Iuu 3.633 4-j. (41 *-j.oo>Af OufBOARD E\GIVE--------------- ****** ****** * **** **_**** *******
CUTOFF SIGhAL 836037a 46.4 13 -J..J15 d.0141 -J.J.lJJACTU AL 1845J63a J.38 1927.1 -LI.5* Li.5511 -u.v.ri 3,hJL -d.d: 4r*.ci95 J.i, +r*.L., J.iL
___________________***************~*********~********~*~*~~~*~~~~*~~~~*~~*~~**~~*~~~****~~*~*~**~~*~*****~~~**
9j790J* 46e3bY J.J14*DHED 1836229* 1933*4 J.57SJ 3.631 4>‘i.j4J 4JS.239
LST FLIGHT STAGE --------------- ****** ****** ***** ******* *******
Al SEPARATION 8334?5a 46a55d -J.kll J..J14 ) -“.rr ”dACT UIL ‘1837497. u*c)7 1833aJ -5.43 L .55b4 *veJdJb J-5 u*,aJi LJYe7bi :.JI oJ+.t,32 d.J,
*_*********___**_*_******************************~***~*****~~*---*~-- ~*---_-_*-*-***--*--**-****--*-**********
66633Ga 55e792 3.“17JZSD FLICrtT STAGE PRED 1468939e 2195a5 J.b,l ti\r eeY60 la6.>dd rJo.2.5AT START SEWENCE --------------- ****** ****** ***** ******* **-*-**
COWAN0 bb6516* 55m7’13 J.d.Jl u.ul77 ‘..“JdlACTU AL 1469415s W.J~ 2196.3 &I*03 J.lJ’dd ,.k299 v.j 6Y -u.u5 ~,6.>2 s 3.UA 1>6.~>U J.J.2
***************** **************************** *****************-*-----*-******----*****-***~-***-**************
bb521)0* 55e914 0.~172PRED 1466514. 2197.0 3.69C.1. .)*Y ,:, I ~Jb.Jb+ :>o.jY:,
2~0 FLIGHT STAGE *************-* ****** ****** ***** ******* *******
AT “AINSTAGE 665421. 55*8u5 3ec;DU J.1177 ri.r.er 5ACTUAL 14673U2. 2.~3 2197.U u*33 d.‘ltiJU u.d~bl u.,#5b -,.~ j A>b.*ir7~.JA .jh*-rr “.dL
******************* ****~*****************.~*********~.***~********~~_-~*~~**~~********~***~****__********_******
211514. 71a2*4 inai5ltPaED Cbb3Oda 2d34eY 2 a0406 C.¶5’, rrr.+iL -v.rij
2\rD FLIGHT STAG E --mm----------- ****** ***** * ***** ***** ** *******AT CUTOFF SIGv4L 2113J5e 71aZY5 JWJSU dec53d L.U)rLd
ACTUAL 463i?4U. -Jo09 28Jb.d A.93 La1203 3.J747 *.d55 -r.r .d 4C..7J -J . I”*~.AJY -1.63**************************************************************---*---*****************************************

8/7/2019 Saturn V Launch Vehicle Flight Evaluation Report - AS-509 Apollo 14 Mission
http://slidepdf.com/reader/full/saturn-v-launch-vehicle-flight-evaluation-report-as-509-apollo-14-mission 216/254
Table 16-10. Mass Characteristics Comparison (Contlnued)

8/7/2019 Saturn V Launch Vehicle Flight Evaluation Report - AS-509 Apollo 14 Mission
http://slidepdf.com/reader/full/saturn-v-launch-vehicle-flight-evaluation-report-as-509-apollo-14-mission 217/254
Table 16-10. Mass Characteristics CofWrlson (Contlnued)
***U*“**I~~*~~*~~~~~~*~*****~~I~.~*1~~~~~~~~*~***~***~~***~~*----l---L~LL-~~~-*II~~~~~~~l~~U~~~~~~I~~~~*~*~
MAUS LOF(GI TuOIMAL RADIAL ROLL MOMENT PITCH MOMENF VAY MOMENTC*C* i SlA.1 CoGa OF INLRtiA OfIMRTIA Of IFtERTlA
EVEYT ~~*~*~~*-----~--~~-I~-**~----~*~~**-~-~-~---~-~~~~-~-~---~~-~~~~~~~~~~~~~~~~~~~~~~~~~
KIL3 vfw METERS METERS KG-N2 o/o KGI1 o/3 KG-MI O/OPDWOS OEvm fNCnEC DELTA INCHES DELT A XAO-b UEva 110-6 DEV. X10-6 UEva
****~***I**L-~II-----~~*~-**~~~~~*~~*~*~*~*~~~***~-**~*****~~~--------~-~~--~~~-~~-~~~~~~~~~~~~”~~~~~~~~~~~~~~
A35539* 7.59AOA 010437PRED 298812r 3074re Ae7ZA0 ‘JaA99 12174A AZ*740
3RD fLtGHT STAGt I------------- ----*a **n-n- mm--w -----em ------a
AT 2MD tGNttION 136122a 78.074 -0eO27 OaOe35 -0aUOQAACTUAL 3000979 OeS3 3073.7 -1909 Aa7A43 -0mQO75 09A99 -0eAb Ate75A OaOY Ale750 0.01)
**~~**-**~*~~-~~~-1~~~~***~~~*~~~~**~~**~~~~~*~**~**-*-**~*~~~-"--------~-~-~~~-~-~~~~~~~~~~*~~~~~~~~~**~~*~~~A35302a 701aAO7 0.0*37
PRED 298465m 3075*0 A*7210 O*A99 A2e736 A2m7373RD fLfGnT CTAGE -----------r--r ***a** -n-n-- mm-e- ---ma-m m-a-m--
AT 2NO WAINSTAGE 135960~ 79ro79 -0aG27 0.5435 -0eOUi01ACTUAL 299757a 0143 3073r9 -A*09 Ar7A$3 -0aOO75 I)*199 -0aAb APalr7 OaOe A2#7*b 0*07
*-*L*l**l**I*ll)~-.--~*--**~***~~-----1*-I*-**-**-******-***------1----------------*--I-----I---------~-~~----------~b3578r 05a797 ObO907
3RO PLtGnT STAGE PRED AWO27a 3377r6 3.57AA OeA98 5a334 5.334AT 2~0 CuTOff --------I------ n-n*** *****I m-n*- --w---m ~~~*~*n
SIGNAL b4307a 05ebS9 -3*138 u.0904 -0*03(i2ACTUAL 141YSOe 00.0 3372rO -5.43 3.5623 -0.0017 OaA99 -Joi 5m4b9 2e5A 5r*60 L.51
*~***~1.**11*~~1~***~~~*~**~*~~~---****~*~~*~********~*****~~-~-------~~~~~~~~*~~-*~*~~~*~~~~~~~~*~~~~*~~~*~**6304Ae 05e79b 0.0907
3RD fLlCnT STAGt PRED 140746* 3377*8 3r57AA OaA98 5a31bAT 2kD EN0 tnRu)T ------------- -
5.314**I**~ *-*I* -a**- ma-- --m --I-**B
DECAY b6350. 85ebWl -O*A3. 010904 ~0~02ACTUAL lSI8b.r OIUO 3372*3 -5r43 3.5623 -0*4097 9a199 -01A5 5abbO 1.52 59650 Lo5L
***u****IIII~.-*~I~**I.*~~*****~**I*~~****I***~**********u*****~*~****~~**~*~~~~~~~*~*~~~~**~~~**~~****~~****
332/7a 78.806 OID799PREO 7323A. 3A02rb 3eA437 ObA42 A.091
CSlv SEPA RATE D --------------A*LU8
11111m *-**I m-n*- a-----m mm --**337049 fUrbl)9 -0ea37 O.UVPS -0eo0u3
AC7UAL 74482 l A*71 309792 -5e40 3.1224 -0eOA53 OaASf 0.30 Am736 2ab2 A*732 de60~**~*1**~~-1~1~~1-~-~~~-~~*~~~~~~~~~~~~~~~~~~~~~*~~~~~~*~~*~~~~~~~~~------~~~~--"~~~1~_~~~*~~*~*~*~~*~~~~~~~**b2508e 85e25b OoA252
PRED l37b3ba 335695 4.9309 O.AI9 4.747CSM DOCRED
be762-u*-**--*~*~-- ---a*- *-*** m-e** --*a--m ----II**
6301(1r 05.lA5 -0oIIO OollSl -0eOOAOACTUAL 13393um 0.02 3350.9 -5.53 be.292 -0r041b Oai89 -0913 *a069 2457 4eUb3 1.56
-*~~-~-~-------------~-*--~-**~---*---**~~~~~~**~~~~~*~~*~**~~~~~~~~~*~~~~n~~~~~~~~~~~~~~~*~~~~ ***~*~~*~****~A7958r 73dS7 O*h511
PRED 395911 2099a6 5.9526 OoAllSPACECRAfT SEP. ---I-no-nnnnnn-
Dab21 OebA7*n-n** O-O*- --*** *n---n -*****n
ARATED 1005 l 73.555 -0el02 O*L5OS -0mo007ACTUAL 40797. 3e05 2995.8 -**03 5.922a -0~9303 oalal -0~03 0eb32 I*&9 Deb17 A.65
-*-**~-.I--------I.1-.II----*----~~~-----*---*~~~~~~*-**~~~~**~~~~~~~~~~~-~~~~~~~~~~~*~~~~~_~ ~~~___~_uI~*~**~**~**

8/7/2019 Saturn V Launch Vehicle Flight Evaluation Report - AS-509 Apollo 14 Mission
http://slidepdf.com/reader/full/saturn-v-launch-vehicle-flight-evaluation-report-as-509-apollo-14-mission 218/254
SECTION 17
LUN&R IMPACT
17.1 SUMMARY
All aspects of the S-IVB/Instrument Unit (IU) Lunar Impact objective wereaccomplished successfully except the precise determination of the impactpoint. The final impact solution is expected to satisfy the mission
objective. At 297.472.17 seconds (82:37:52.17) (actual time of occur-rence at the moon), the S-IVB/IU impacted the lunar surface at approxi-mately 8.07 degrees south latitude and 26.04 de rees west longitude,which is approximately 294 kilometers (159 n mi3 from the target of1.596 degrees south latitude and 33.25 degrees west longitude. Impactvelocity was 2543 m!s (8343 ft/s). The mission objectives were to maneu-ver the S-IVB/IU such that it would have at least a 50 percent probabilityof impacting the lunar surface within 350 kilometers (189 n mi) of thetarget, and to determine the actual impact point within 5 kilometers(2.7 n mi), and the time of impact within 1 second.
17.2 TIME BASE 8 MANEUVERS
Following Command and Service Module (CSM)/Lunar Module (LM) ejection,the S-IVB/IU was maneuvered to an inertially fixed attitude as requiredfor the evasive burn. Time base 8 (T8) was initiated 6392 seconds laterthan nominal at 21,840 seconds (06:04:00) vehicle time. The delay ininitiating T8 was directly due to the problems experienced with the CSM/LM docking. The Auxiliary Propulsion System (APS) ullage engines were thenburned for 80 seconds to provide a near nominal sracecraft/launch vehicleseparation velocity. At 22,423 seconds (06:13:43, vehicle time, thestage maneuvered to the Continuous Vent System (CVS)/L'jX dump attitude.The initial lunar targeting velocity change was then accomplished bymeans of a 300-second duration CVS vent and a Q&second duration LOXdump. The velocity change resulting from the CVS vent was larger thannominal due to the increased pressure resulting from the delay in theT8 event. The velocity change resulting from the LOX dump was nearnominal.
The final lunar impact targeting maneuver was accomp?ished by a commanded252-second APS bum at a cumnanded local horizontal attitude of 222 de-grees pitch and -14 degrees yaw. This APS bum, premission planned for
17-1

8/7/2019 Saturn V Launch Vehicle Flight Evaluation Report - AS-509 Apollo 14 Mission
http://slidepdf.com/reader/full/saturn-v-launch-vehicle-flight-evaluation-report-as-509-apollo-14-mission 219/254
23.374.2 seconds (06:29:34.2). was initiated late at 32,399 seconds(08:59:53) vehicle time as a result of the delay in T8 init iation andto allow time for adequate ground tracking. The burn provided an actualvelocity change which was near the required value that was determined inreal time. The attitude and duration for this final APS burn were deter-mined in real time b the Lunar Impact Team at the Huntsville OperationsSupport Center (HOSCT based on the APS vector provided by the MissionControl Center (MCC). Loss of the IU DPl-A0 data and IU guidance com-puter data (See paragraph 15.3) created uncertainties as to actual IU sys-tems status and prevented real time use of telemetered attitude and deltavelocity data. However the remaining telemetered data available pluscrew observations were sufficient for conduct of the lunar impact opera-tions in an effective manner.
Table 17-l shows the actual and nominal maneuver duration times, velocityincrements along the S-IVB/IU longitudinal body axis, and maneuver atti-
tudes for the various lunar targeting events during T8. Figure 17-lshows the velocity change profile during T8.
Due to the late initiation of T8 the lunar impact commands were givenat a point further from earth than ever before. The communicationsaspect of the late cotnnands is discussed in paragraph 15.6.
17.3 iRAJECTORY EVALUATION
Figure 17-2 shows the radius and space-fixed velocity (earth centered)profiles from the APS lunar impact burn to lunar impact. Table 17-2shows the actual and nominal geocentric orbit parameters following thefinal impact maneuver. The orbit parameters are based on two-body cal-culations.
17.4 LUNAR IMPACT CONDITION
Figure 17-3 shows various impact points relative to the target andseismc.neter locations. The impact parameters and miss distances arepresented in Table 17-3. The distance from the impact point to thetarget is 294 kilometers (159 n mi) which is within the 350-kilometer(189 n mi) mission objectilre. The distance from the impact point to theseismometer is 175 kilometers (94 n mi).
A sumnary of impact times recorded by the various tracking sites isshown in Table 17-4. The average of the recorded times was used as thebest available time of impact, and is considered accurate to within0.05 second.
17-2

8/7/2019 Saturn V Launch Vehicle Flight Evaluation Report - AS-509 Apollo 14 Mission
http://slidepdf.com/reader/full/saturn-v-launch-vehicle-flight-evaluation-report-as-509-apollo-14-mission 220/254

8/7/2019 Saturn V Launch Vehicle Flight Evaluation Report - AS-509 Apollo 14 Mission
http://slidepdf.com/reader/full/saturn-v-launch-vehicle-flight-evaluation-report-as-509-apollo-14-mission 221/254
The final solution of the actual impact point is expected to be accurateto within 0.10 degree in latitude and 0.05 degree in longitude wnicll iswithin a region having dimensions of approximately 3.4 kilometers (1.8n mi).
Table 17-l. Lunar Targeting Maneuvers
PARAMETER IACTUAL
INOMINAL ACT-NOM
STAR? OF TIME EASE 8
Range lime hr:min:sec(se-)
I 06:OQ:OO(21.840)
APS EVASIVE BURN
04:17:26 01:46:32(15.448) (6.392)
Initiation. set from T g 1 1 0
Ocrdtion. set 80 80 0
Velocity Increment. m/s 2.90 2.98 -o.oe(ft/s) (9.51) (9.78) (-0.27)
Local Horirontrl Attitudepitch, deg 189 176 13yaw. deq 40 40 0
!nitirtion. set from T8
Duration. set
CVS VENT
1.000
300
Velocity Increment. m/s 2.30(e/s) (7.55)
Locrl Horizontrl Attitude
pitch, degYaw. WI
225-10
LOX DUMP
1.000
300
L.44
(1.44)
225-10
1.2er) 1.280
40 40
8.82 8.30(28.94) (27.23)
225 225-10 -10
II
nitlrtion. set from 18
Our4tion. see
Velocity Increment, m /s(ft/s)
Loc41 Horizontrl Attitudepitch. dcqyaw. deg
APS LUNAR IMPACT BURW*
Initirtion. set from 18 I 10.558
Ourrtion. set
Velocity Increment. m/s(ftls)
Locrl Horizontrl Attitudepitch. deqydr. deq
NOTE : R4nqe tiws used 4re tiWs of occurrence 4t the vehicle.reference Figure 2-1.
252
10.560
252
10.27 10.4203.69) (34.19)
222-14
222-14
0
0
:.86(6.11)
x
0
0
0.52(1.71
00
-2
0
-0.15(-0.50)
00
l Nainrlr for APS LUNAR IMPACT BURY crlculrted in rerl time
17-4

8/7/2019 Saturn V Launch Vehicle Flight Evaluation Report - AS-509 Apollo 14 Mission
http://slidepdf.com/reader/full/saturn-v-launch-vehicle-flight-evaluation-report-as-509-apollo-14-mission 222/254

8/7/2019 Saturn V Launch Vehicle Flight Evaluation Report - AS-509 Apollo 14 Mission
http://slidepdf.com/reader/full/saturn-v-launch-vehicle-flight-evaluation-report-as-509-apollo-14-mission 223/254

8/7/2019 Saturn V Launch Vehicle Flight Evaluation Report - AS-509 Apollo 14 Mission
http://slidepdf.com/reader/full/saturn-v-launch-vehicle-flight-evaluation-report-as-509-apollo-14-mission 224/254

8/7/2019 Saturn V Launch Vehicle Flight Evaluation Report - AS-509 Apollo 14 Mission
http://slidepdf.com/reader/full/saturn-v-launch-vehicle-flight-evaluation-report-as-509-apollo-14-mission 225/254
I=! 2-WAY- . . . . . *DUAL MODESTATION - ,-WA,
/
0 20 40 60 80 100 120 140 160 180 260 220 2i0260 280 300
RANGE TIME, 1000 SECONDS. * * l * *. . . a. . l a n 1 I a 11 . (
0 4 8 12 16 20 24 28 32 36 40 44 48 52 5G 60 64 68 72 76 80 84
RANGE TIME, YOURS
Figure 17-4. Summary of CCS Tracking Data Usedfor Post TLI Orbit
Table 17-5. S-IV8/IU CCS Tracking Network
STATIONLOCATION
Madrid. Spain
Madrid. Spain
Canberra, Australia
Tidbinbilla. Australia
Goldstone. California
Goldstone, California
Merritt Island, Florida
Ascecsion Island
Carnarvon. Australia
Kauai. Hawaii
Goddard ExperimentalTest CenterGreenbelt, Maryland
CONFIGURATION ABBREVIATION
9lain Site - 85 Ft. Dish MAD8
Wing Site - 85 Ft. Dish MAOY
Main Site - 85 Ft. Dish HSK8
Wing Site - 85 Ft. Dish HSKY
Main Site - 85 Ft. Dish GDS8
Wing Site - 85 Ft. Dish GDSY
30 Ft. Dish MIL3
30 Ft. Dish ACN3
30 Ft. Dish CR03
30 Ft. Dish HAW3
30 Ft. Dish ETC3
17-8

8/7/2019 Saturn V Launch Vehicle Flight Evaluation Report - AS-509 Apollo 14 Mission
http://slidepdf.com/reader/full/saturn-v-launch-vehicle-flight-evaluation-report-as-509-apollo-14-mission 226/254

8/7/2019 Saturn V Launch Vehicle Flight Evaluation Report - AS-509 Apollo 14 Mission
http://slidepdf.com/reader/full/saturn-v-launch-vehicle-flight-evaluation-report-as-509-apollo-14-mission 227/254

8/7/2019 Saturn V Launch Vehicle Flight Evaluation Report - AS-509 Apollo 14 Mission
http://slidepdf.com/reader/full/saturn-v-launch-vehicle-flight-evaluation-report-as-509-apollo-14-mission 228/254
SECTION 19APOLLO 14 INFLIGHT DEMONSTRATIONS
19.1 SUMMARY
Three inflight demonstrations designed to demonstrate the effects of azero g environment were proposed by Marshall Space Flight Center (MSFC)and flown on Apollo 14. These were an Electrophoretic Separation Demon-stration, a Composites Casting Demonstration and a Heat Flow and Convec-tion Demonstration. Preliminary assessment of the data indicate that allthree demonstrations were successful. The degree of success will bedetermined when final data are received and evaluated.
19.2 ELECTROPHORETIC SEPARATION DEMONSTRATION
The Electrophoretic Separation Demonstration , a chemical separation processbased on the motion of particles in a fluid due to the force of an electricfield, was flown on Apollo 14 to show the advantages of the almost weight-less environment. On earth, electrophoresis has to contend with sedimenta-
tion and thermal convective mixing which limits its usefulness for highmolecular weignt materials and large volume samples. This demonstrationis expected to show that electrophoresis in space will not be limited bymolecular weight and volume.
The instrwnent is a 4 by 5 by 6-inch box, weighing 5 pounds and requiring27 watts of 115 volt, 400 cycle power for one hour. A viewing windowis provided so that the action in the test tubes can be photographedemploying a series of twelve 7Omn Haselblad shots spaced 5 to 10 minutesapart. The electrical system includes white and ultraviolet fluorescentlights, pump motor, and 320 vdc rectified power for the electrophoresis
electrodes in the ends of the tubes. The fluid system includes a peristal-tic punp, filter, gas phase separator and tubing to flush the electrodes.The flowing fluid is separated from the passive fluid in the test tubes bydialysis membranes, although a dilute boric acid solution is used through-out.
The samples include: (1) a Ed and blue mixed dye which is easy to seeand measure; (2) hemoglobin, a component of red blood cells with amolecular weight of 64,500; and (3) Deoxyribonucleic Acid (DNA), thecarrier of genetic information in chmmoscnnes, with a molecular weightseveral hundred times that of hemoglobin. The latter two samples are ofcurrent interest in biological research.
19-l

8/7/2019 Saturn V Launch Vehicle Flight Evaluation Report - AS-509 Apollo 14 Mission
http://slidepdf.com/reader/full/saturn-v-launch-vehicle-flight-evaluation-report-as-509-apollo-14-mission 229/254
The objectives of the demonstration are to prove the gas phase purgesystem, the reduction in settling of high molecular weight material, andthe sharper resolution of boundaries due to the lack of convective mixing.The unit was shown on the televised broadcast from space with the powerand white light on. It was not activated at that time because it could
be used only once, but it was operated later as planned. Detailed measure-ments will be made from the photographs. The primary assessment of theabove experiment so far indicates the following:
a. The red-blue dye separation on Apollo 14 was better than that seen onearth. Development of the high-red contrast film will quantify thereSUl'&. There were good measurements of mobility and resolution, andan indication of the lack of convective mixing.
b. The apparatus worked well, and the MSFC contributed phase separatorsche,.o to keep the hubbies off the electrode did well.
C. So far, no conclusions can be drawn regarding sedimentation or otheraction of the high molecular weight materials, hemoglobin, and DNA.The reprint photos will help answer this, and when the apparatus isreturned, analysis of the residues will give the final answer.
In conclusion, enough data have been analyzed to consider the effortworthwhile, but the final results are not yet known. Some film coloradjustment techniques will have to be used to allow extracting all thedata which will finally be needed.
lg.3 COMPOSITES CASTING DEMONSTRATION
The objective of the Composites Casting Demonstration is to demonstratethe potential for preparing unique metal-matrix composites in a weight-less environment. The absence of buoyancy and thermal convection per-mits processing with a liquid matrix and should result in more uniformdispersions of the reinforcing particles or fibers thus yielding aunique composite material superior to those produced on earth usingsolid state processes.
The demonstration was performed using a low melting point (162°F)indium-bismuth eutectic alloy, paraffin, and sodium acetate as modelmatrices. Dispersants included copper coated tungsten and boroncarbide spheres, beryllium copper fibers, tungsten microspheres,and combinations of these with argon gas bubbles.
Composites formed by combinations of these materials do not representpractical systems, but will serve to demonstrate the effects of processingin a negligible gravity environment. The composites casting demonstrationrepresents a variety of combinations including particle and fiberreinforced composites, liquid phase sintering of powder metal compacts,reinforced foams, irmniscible mixtures, and solidification experiments.
19-2
8/7/2019 Saturn V Launch Vehicle Flight Evaluation Report - AS-509 Apollo 14 Mission
http://slidepdf.com/reader/full/saturn-v-launch-vehicle-flight-evaluation-report-as-509-apollo-14-mission 230/254
The demonstration apparatus consists of 18 hermetically sealed capsulescontaining the ingredients for preparing the composite material, aheater, and a storage box, which is also used for cooling the specimens.
See Table 19-1 for specimen list and abbreviated procedures.Primary data will be obtained from postflight evaluation of the specimens.TV coverage or photography during demonstration was optional. Voice re-cording of specimen numbers and start and stop times for heating andcooling was required so that telemetry data from the Command Module (CM)could be evaluated postflight to determine g levels, temperatures, etc.,during time of demonstration.
Specimens No. 1 through 12 with the exception of No. 3 were processedduring the translunar and the transearth coasting phases of the mission.The remaining seven specimens were not processed because there wasinsufficient time. There were no problems with the equipment or theprocedures.
Evaluation of the flight specimens will cotmnence after they have beenreleased from quarantine. Meanwhile evaluation procedures are beingfinalized and the control samples are being prepared for evaluation.
Primary indications are that the demonstration was successful.
19.4 HEAT FLOW AND CONVECTION DEMONSTRATION
The Heat Flow and Convection Demonstration that was performed for theSpace Manufacturing Program on Apollo 14 is designed to obtain data onthe types and amounts of convection that occur in the near weightlessenvironment of space flight. Although normal convection will be mostlysuppressed in near weightlessness, convective fluid flows can occur inspace by mechanisms other than gravity, such as by surface tensiongradients, and, in some cases, the residual accelerations presentduring space flight cause low level fluid flow. The demonstration con-tains four independent cells of special design that detect convectiondirectly or detect convective effects through measurement of heat flow-rates in the fluids. The data are recorded on the onboard 16nm1 dataacquisition camera. The temperatures are visibly displayed (and recordedon the camera) by the use of color sensitive, liquid-crystal thermalstrips.
The crew reported that the demonstration was completed and also the unitwas operated during a TV transmission on February 7, 1971. The radialcell and the bso zone cells were successfully illustrated during thetransmission. The Flm Patt cell was operated and Benard cells (causedby surface tension gradients) were clearly visible in the thin layer.Som~t difficulty was encountered by the astronauts in getting the fluid(Krytox) to spread properly across the cell bottom.
19-3

8/7/2019 Saturn V Launch Vehicle Flight Evaluation Report - AS-509 Apollo 14 Mission
http://slidepdf.com/reader/full/saturn-v-launch-vehicle-flight-evaluation-report-as-509-apollo-14-mission 231/254

8/7/2019 Saturn V Launch Vehicle Flight Evaluation Report - AS-509 Apollo 14 Mission
http://slidepdf.com/reader/full/saturn-v-launch-vehicle-flight-evaluation-report-as-509-apollo-14-mission 232/254
Table 19-1. Specimen List and Abbreviated Procedure
iPEC IHENNO. CONTENTS PROCEDURE
1 30% W Spheres - 70% InBi Heat 10 minutes.2 30% BqC - 65% InEi -’ 5%Argon
Do not shake.Cool 30 minutes minimun.
3 30% B4C - 70% InBi
4 Sic Whiskers - InBi - Argon Gas Heat 10 minutes.
5 BeCu Fibers - InBi - Argon GasShake 60 seconds minimua.Cool 30 minutes minimum
6 50% Paraffin - 50% Sodium Acetate
7 75% InBi - 25% Argon Gas
B W Spheres - InBi - Argon Gas
9 40% Paraffin - 402 Sodium Acetate -20% Argon
10I
W Spheres - InBi
11 BeCu Fibers - Paraffin - Argon Gas
12 ;;; Effin - 4OZ Sodium Acetate -
13 BeCu Fibers - InBi
14 BeCu Fibers - Paraffin
15 InBi Controlled Eutectic Heat 13 minutes minim.
16 InBi Remelt - Heat B minutesDo not shake.Cool 30 minutes mini-.
17 InBi Solidification
18 InBi Spherical Casting Heat 13 minutes minimu.Do not remove heater frumbox for 120 minutes mininu
InBi = Indium Bismuth Eutectic Alloy
W Spheres = Cqpr Coated Tungsten Spheres
B4C = Copper Coated Boron Carbide Spheres
BeCu = Berylliun Copper Wires
Sic = Copper Coated Silicon Carbide Whiskers
bs = Tungsten Nicrospheres
19-5/19-6

8/7/2019 Saturn V Launch Vehicle Flight Evaluation Report - AS-509 Apollo 14 Mission
http://slidepdf.com/reader/full/saturn-v-launch-vehicle-flight-evaluation-report-as-509-apollo-14-mission 233/254

8/7/2019 Saturn V Launch Vehicle Flight Evaluation Report - AS-509 Apollo 14 Mission
http://slidepdf.com/reader/full/saturn-v-launch-vehicle-flight-evaluation-report-as-509-apollo-14-mission 234/254
JANUARFF!DNI
SURFACE YEATH ER UAP‘Af 12c02!V 31.1971-ISOBARIC,
TAl. AND PREC:PIlATIDNPATTERNS ARE SHDUN IN ST&DAR0SVrnOLIC FORM. 105"
Figure A-l. Surface Weather Map Approximately 9 Hours BeforeLaunch of AS-509
Table A-l. Surface Observations at AS-509 Launch Time--
: IIs RES- YINC
LDUTIOIIHEIGHT ,OFBASE SPEED
(*IN) (Pm)METERS M/S DIQ(FEET) (KmofS) (MG)
WLI (x6) 0 10.102Kennedy Spice
294.8 292.6(71.3) (67.0) Cl:;
i(14.65)
CurUlr;S
I1219.9 2.6 26G
Center, Florida(4.00-)*' (5.0,
2 2436(8.000)
cape Kmedy 11 --Rarinsondc 10.095 290.7 284.0 -- -- 7.0 240nersu-ts
(i4.64) Ci7.9) (51.6) (13.6)
Pad 394 Lightpole 0 em -- -- __NY 16.3 m
-- __ __ 5.0'+* 255"'
(60.0 ft)' (9.7)***
LUT Pad 394 9 -- -- __ _- __161.h (530 ft)’
__8.5-. 275-
(16.5)***
l Above rnturr1 grade.* Estimtcd.m 1 minute average about T-D.
A-2

8/7/2019 Saturn V Launch Vehicle Flight Evaluation Report - AS-509 Apollo 14 Mission
http://slidepdf.com/reader/full/saturn-v-launch-vehicle-flight-evaluation-report-as-509-apollo-14-mission 235/254
a
15.
CONTINUOUS LINES INDICATE HEIGHT CONTOURSINFEET ABOVE SEA LEVEL. DASHED LINES ARE ISO-THERMS IN DEGREES CENTIGRADE. ARROWS SHOWWIND DIRECTION AND SPEED AT THE 500mb LEVEL.(ARROWS sm4E S 0~ SURFACE MAP).
Figure A-2. 500 Millibar Map Approximately 9 Hours BeforeLaunch of AS-509
A.4 UPPER AIR MEASUREMENTS
Data were used from three of the upper air wind systems to compile thefinal meteorological tape. Table A-3 ;unrnarites the wind data systemsused. Only the Rawinsonde and the Loki Dart meteorolcgical rocket datawere used in the uppet- level atmospheric thermodynamic analyses.
.1-3

8/7/2019 Saturn V Launch Vehicle Flight Evaluation Report - AS-509 Apollo 14 Mission
http://slidepdf.com/reader/full/saturn-v-launch-vehicle-flight-evaluation-report-as-509-apollo-14-mission 236/254
Table A-Z. Solar Radiation at AS-509 Launch Time, Launch Pad 39A
DATE
January 31, 197 07.00 0.00 0.00 0.0008.00 0.05 0.03 0.0509.00 0.19 0.11 0.15IO.70 0.31 0.08 0.2711.63 0.64 0.35 0.4212.00 0.76 0.85 0.1813.00 0.73 o.bd 0.2914.00 0.86 1.06 0.19
15.00 0.57 0.41 0.3516.00 0.10 0.01 0.1017.00 0.08 0.00 0.0818.00 0.04 0.00 0.0419.00 0.00 0.00 0.00
I
NORMALINCIDENT
G-CAL/CM2 MII
DIFFUSESKY
;-CAL[CM2 MI
Table A-3. Systems Used to Measure Upper Air Wind Data for AS-509
RELEASE TIME PORTION OF DATA USED
TYPE OF DATA
FPS-16 Jimsphere 2121 18
Rawinsonde 2114 11
Loki Dart 2309 126I
TIME(UT)
TIME START
AFTER
t-
ALTITUDE
:x,
17s(574)'
15,250(50,033)
I END%&qMINI
18 I 15,000 69(49,213)
61 24,000(78,740)
-L
9c
126 25,000 150(82,021)
IA-4

8/7/2019 Saturn V Launch Vehicle Flight Evaluation Report - AS-509 Apollo 14 Mission
http://slidepdf.com/reader/full/saturn-v-launch-vehicle-flight-evaluation-report-as-509-apollo-14-mission 237/254

8/7/2019 Saturn V Launch Vehicle Flight Evaluation Report - AS-509 Apollo 14 Mission
http://slidepdf.com/reader/full/saturn-v-launch-vehicle-flight-evaluation-report-as-509-apollo-14-mission 238/254
4i
10
6
0 10 20 30 40 50 60 70 En 90 loo
YIN0 SPEED. m/s
- 150
- 140
-1B.l
- 120
iz
J
-110 i
-100
-90
-00
- ro
-60
-50
-40-30- 20
Figure A-3. Scalar Wind Speed at Launch Time cf AS-509
A-6

8/7/2019 Saturn V Launch Vehicle Flight Evaluation Report - AS-509 Apollo 14 Mission
http://slidepdf.com/reader/full/saturn-v-launch-vehicle-flight-evaluation-report-as-509-apollo-14-mission 239/254

8/7/2019 Saturn V Launch Vehicle Flight Evaluation Report - AS-509 Apollo 14 Mission
http://slidepdf.com/reader/full/saturn-v-launch-vehicle-flight-evaluation-report-as-509-apollo-14-mission 240/254
60
56
46
34
26
24
16
6
0-60 -40 -20 0 20 40 60 80 lrn
YIN0 SPEED. W/5
-140
-130
-110 i
-im
-90
-0
-70
-60
- i*‘
-40
-30-20
Figure A-5. Pitch Wind Velocity Component (U,) at Launch Time of AS-509
A-8
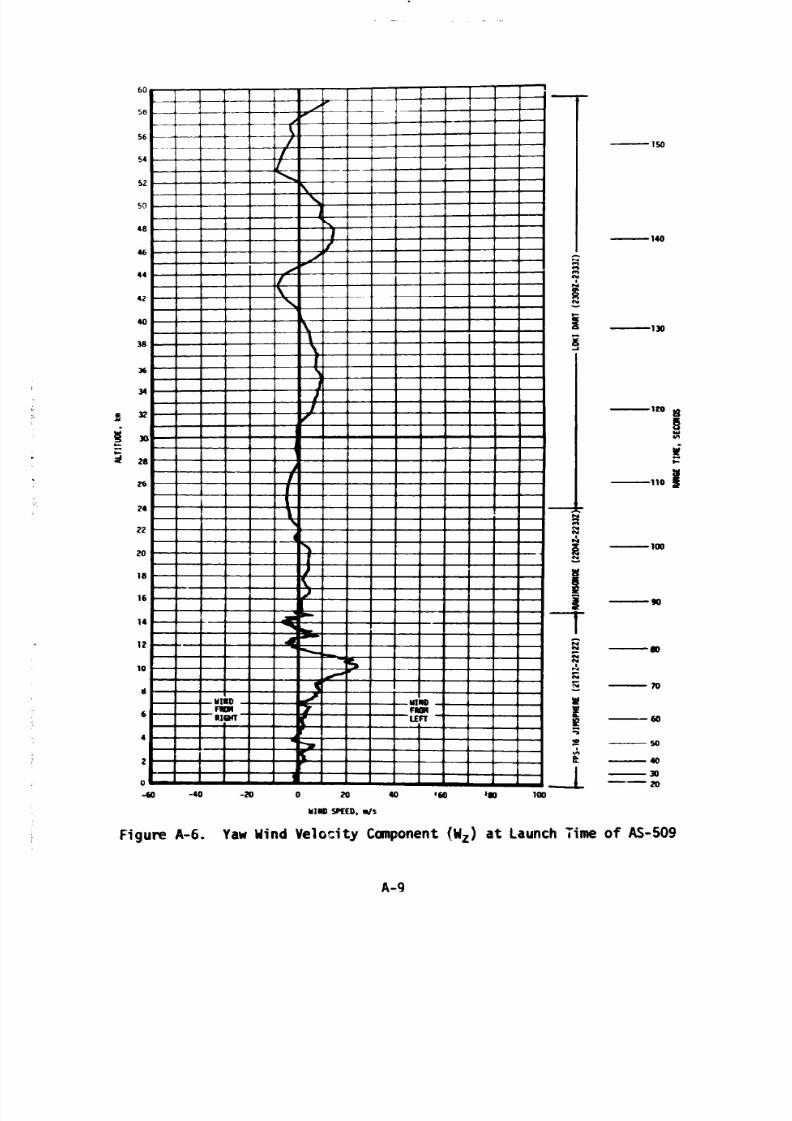
8/7/2019 Saturn V Launch Vehicle Flight Evaluation Report - AS-509 Apollo 14 Mission
http://slidepdf.com/reader/full/saturn-v-launch-vehicle-flight-evaluation-report-as-509-apollo-14-mission 241/254

8/7/2019 Saturn V Launch Vehicle Flight Evaluation Report - AS-509 Apollo 14 Mission
http://slidepdf.com/reader/full/saturn-v-launch-vehicle-flight-evaluation-report-as-509-apollo-14-mission 242/254
0 0.006 Kale 0.012 0.016 0.020
Figure A-7. Pitch (S,)
,016 O.OM 0.024
-60
- ,o
-60
- 50
- 40-30- 20
and Yaw (S,) Component Wind Shears atLaunch Time of As-509
A-10

8/7/2019 Saturn V Launch Vehicle Flight Evaluation Report - AS-509 Apollo 14 Mission
http://slidepdf.com/reader/full/saturn-v-launch-vehicle-flight-evaluation-report-as-509-apollo-14-mission 243/254
Table A-4. Maximum Wind Speed in High Dynamic Pressure Region forApollo/Saturn 501 through Apollo/Saturn 509 Vehicles
MAXIMUM WIND MAXIMUM WIND COMPONENTS
VEHICLENUMBER SPEED
M/SDIR
ALT PITCH (W,) ALT YA;/lu, 1 ALT
(KNOTS) (DEG) (YT)M/S KM
(KNOTS) (f-r) (KNOTS) (:I
is-501 26.0 273 11.50 24.3 11.50 12.9 9.00(50.5) (37,700) (47.2) (37,700) (25.1) (29,500)
G-502 27.1 255 12.00 27.1 12.00 12.9 15.75(52.7) (42,600) (52.7) (42,600) (25.1) (51,700)
IS-503 34.8 284 15.22 31.2 15.10 22.6 15.80(C7.6) (49,900) (60.6) (49.500) (43.9) (51,800)
s-504 76.2 264 11.73 74.5 11.70 21.7 11.43(148.1) (38,480) (144.8) (38,390) (42.2) (37,500)
G-505 42.5 270 14.18 40.8 13.80 18.7 14.85(92.6) (46,520) (79.3) (45,280) (36.3) (48,720)
is-506 (l89if 297 11.40(37,400)
(147$ 11.18(36,680)
(137i1) 12.05(39,530)
S-507 47.6 245 14.23 47.2 14.23 19.5 13.65(92.5) (46.670) (91.7) (46.670) (37.9) (44,780)
is-508 55.6 252 13.58 55.6 13.58 15.0 12.98(108.1) (44,540) (108.1) (44,540) (29.1) (42,570)
is-509 52.8 255 13.33 52.8 13.33 24.9 10.20(102.6) (43,720) (102.6) (43,720) (48.5) (33.460)
A-11

8/7/2019 Saturn V Launch Vehicle Flight Evaluation Report - AS-509 Apollo 14 Mission
http://slidepdf.com/reader/full/saturn-v-launch-vehicle-flight-evaluation-report-as-509-apollo-14-mission 244/254
Table A-5. Extreme Wind Shear Values in the High Dynamic PressureRegion for Apollo/Saturn 501 through Apollo/Saturn 509 Vehicles
(Ah = 1000 m)
PITCH PLANE YAW PLANE
VEHICLE 'NUMBER SHEAR ALTITUDE SHEAR ALTITUDE
(SEC-l)(E)
(SEC-l)6
AS-501 0.0066 10.00 o.oD67 10.00(ALTO) oww
AS-502 0.0125 14.90 0.0084 13.28(48,900) (43,500)
AS-503 0.0103 16.00 0.0157 15.78(52,500) (51 mw
AS-504 0.0248 15.15 0.0254 14.68(49JW (48.1~)
AS-505 0.0203 15.3Q 0.0125 15.53(50 lw (50.9W
AS-506 0.0077 14.78 0.0056 10.30(48,490) (33.790)
AS-507 0.0183 14.25 0.0178 14.58(46.750) (47,820)
AS-508 0.0166 15.43 0.0178 13.986WW (45,850)
As-509 0.0201 13.33 0.0251 11.85(43,720) o&m
A-12

8/7/2019 Saturn V Launch Vehicle Flight Evaluation Report - AS-509 Apollo 14 Mission
http://slidepdf.com/reader/full/saturn-v-launch-vehicle-flight-evaluation-report-as-509-apollo-14-mission 245/254

8/7/2019 Saturn V Launch Vehicle Flight Evaluation Report - AS-509 Apollo 14 Mission
http://slidepdf.com/reader/full/saturn-v-launch-vehicle-flight-evaluation-report-as-509-apollo-14-mission 246/254
+-4
t----
- .
-- m
-70
Figure A-8. Relative Deviation of Temperature and Pressure fromthe rRA-63 Reference Atmosphere, As-509
A-14

8/7/2019 Saturn V Launch Vehicle Flight Evaluation Report - AS-509 Apollo 14 Mission
http://slidepdf.com/reader/full/saturn-v-launch-vehicle-flight-evaluation-report-as-509-apollo-14-mission 247/254
-12 -10 -6 -6 -A -2 0 : A 6 6 ic
U)SOlUlL MYllllON OF TN OF’lIcIIL IloCI Ot RCF PICT IO*. lo-6
- 150
- 110
-110 Ia
- 60
- SO
-A0-30- *v
Figure A-g. Relative Deviation of Density and Absolute Deviationof the Index of Refraction from the PRA-63 Refemnce Atmosphere, AS-509
A-15

8/7/2019 Saturn V Launch Vehicle Flight Evaluation Report - AS-509 Apollo 14 Mission
http://slidepdf.com/reader/full/saturn-v-launch-vehicle-flight-evaluation-report-as-509-apollo-14-mission 248/254

8/7/2019 Saturn V Launch Vehicle Flight Evaluation Report - AS-509 Apollo 14 Mission
http://slidepdf.com/reader/full/saturn-v-launch-vehicle-flight-evaluation-report-as-509-apollo-14-mission 249/254

8/7/2019 Saturn V Launch Vehicle Flight Evaluation Report - AS-509 Apollo 14 Mission
http://slidepdf.com/reader/full/saturn-v-launch-vehicle-flight-evaluation-report-as-509-apollo-14-mission 250/254
Table 0-2. S-II Significant Configuration Changes
CMNGT.
Aniitlon of a PT A suppression Syste mrr’\lit:na of a hel!um f!lled accumulator.n the :Ot *rrdl~nr of the rcntcr engine.
. Inyinr servo-Orlven Pv valve reflacedurlh an l lcctronncunatrr-nperdted. twoposrtron Pl! valve
1IEAsoN
To prevent the POG O osclllatlonsthat have occurred on previousflights.
To improve valve positioningreliability.
str*ucture
:dded 2. 3 rrcnvd trm delay to LII,Irrlet1on c.8toff Sensor.
!nstal!d !!nn of a systetr. !C, liml:shltch) to mc mrto r center enqinc Iwanvrhrdtlon (PO M) levels and rnrtrrtccenter eng jne cutcff wheneverdangerws levelr occur.
Reduce propellant residualsand increase payload capability.
To provide d backup to thePO GO suppression syste m andlimit the dy.ldm iC load on thecenter engine beam.
I"SUldtlCl7 %d.ficdtion of insulation in Ih,. T O SUpF Ort a 24 hour "scrub"LH2 fredline areas to minim ize cork dnd "turn-around" Capabilityrnrulation debonding and we t layur
blistering.on irsulation inspection dndrepa1r.
GE
-
The CHZ level control syste m rn the17-71 heat exchan ger hdS beensimplified.
To reduce the rrobdbilitynf d failure during launchcountdown.
Table B-3. S-IVB Significant Configuration Changes
S Y S T E M CHANGEPropellant Utilization ' Variable posltion PU valve replaced
Iwth two position (4.5 dnd 5.0 E?!R)valve.
Elimination of the LOX depletioncutoff functior,.
REASON
Increased flipht relidbl!lty Eyremoving PU Electronics Assemb lycontrcl over EMP valve.
Eliminate s single oointfcilure which could cduseoremature engine shutdown.
Pneumatic iontrol
1nstrurentat:on
Utilize rely designed pneumaticpower control module.
Modification of oxidizer dnd fuelflowmetex.
Provide regulator withimprOVed reaulation characterlstrcs.
Rework flowme ter coilsto insure czmwa tability withturbines.
ETeCtriCdl Add redundant battery heatercontrol the?WXtdt to switc hheater pcwer "on" at SO OF , and"off" a* 70°F.
Failure of heater controlsensor could cdtise launch delayor loss cf secondary rissior!i L batteries should exceedredlIne reouire+wents.
Parallel relay modu les for switc hselector compatibility.
Reduce output loads of swatchselector to confor- to ICDrequirement.
Sequence change which positions therepressurization system mode select"on" (ambient mode) until TinaBase 6 plus 5 seconds .
Eliminate s sirgle p01rt failurewhich could cause rhe cold
B-2

8/7/2019 Saturn V Launch Vehicle Flight Evaluation Report - AS-509 Apollo 14 Mission
http://slidepdf.com/reader/full/saturn-v-launch-vehicle-flight-evaluation-report-as-509-apollo-14-mission 251/254
Table B-4. IU Significant Configuration Changes
Environmental Controlsystem
nctworlrs
ImtMcntstion andCanunicaticmr
night PrQgram
CnmGE
Material used for thenwl radiationshroud has been modified to incorpo-rate a stronger nylbn core and anew Tedlar back-up film.
The Methanol/Uater (M/U) coolant usedin the Enviromntal Control Systemhas been changed to Oronite flo-Cool 100.
Added capability to inhibit Cornnsndand Communication System (CCS) 1.024MHZ.
Added capability to turn the FlightControl Computer (FCC) off beforeloss of the second IV battery.
Add redundant power to IU switchselector. mission critical discretesto LVDA, FCC Switch Points, Space-craft control of Saturn and FCCS-11 burn mode . Provide votingcircuit for FCC S-11 burn ani&.
Three platform sccelermtcrmeasurements yere added to the DF-1te1cnrtry link:H17-603 2 accelerometerW-603 X lccelefweterHZS-603 I accelerater
fir Base 6c (TB6c) can na kinitiated by the detectloh of anybra of the four no thrust indicationsas well as tba TL I Inhibit discrete.
Tllrr Ikse 6d added. (Initfrtedby DCS commnd.)
Increased reliability ofshroud.
Oronik flo-Cool 100 elimi-nates operational problemsassociated with M/U coolant.
Signal interference on AS-506resulted from TU/CCS andLtl/USB having same nominalcenter frequencies.
Unexpected velocity changeon AS-508 which resulted franTU battery decay which caused
erroneous control systemresponse .
ha-ease probability ofcapleting the prim missionin cast of 6010 or 6330battery failure.
Acc~atton for thesema t-ts bun auaflableuhm tk following S-MImearu srrrntt were deletedfrmthe lx-1 link:AlS-424rJ1-w
XD3-403E99-411f100-411
To l llou tFw program to returnto TBS fmm fB6 if S-IV9mainstage thrust fsnotachieved.
Eliminates issuance of highdensity getwalized switchselector cwaands in an S-IVBchilldam sequence failurecm t i ngency .
8-3

8/7/2019 Saturn V Launch Vehicle Flight Evaluation Report - AS-509 Apollo 14 Mission
http://slidepdf.com/reader/full/saturn-v-launch-vehicle-flight-evaluation-report-as-509-apollo-14-mission 252/254
Table B-5. Spacecraft Significant Configuration Changes
Eicctric PowerSYStcmr
511 cqogenicDuygcn Tanks
A third cyqenic oyrgen storage t4nkwas installed in sector 1 of theService Module (SM) to k u5edri7~1ltaneously with tanks 1 end 2located in sector 4.
An isolation wlvc uas installed betmnSI4 cyogcnlc oaygen tnnks 2 md 3.
Au~~illrry 400 h-n!-hour brtteyinstrlled on the SMaft bulkheadIn sector 4.
1. Destretlflcrtion fansl liminrted.
2. Qumtfty grugln g probe rateriechmged fm m alrmincm to stainlesssteel.
3. Neater changed frun t*o pwallel-connectedelements LO threeparallel-connected l 1Rnmts withseparate control of one cl-t.
4. Filter miocrted fnn the tankditchrrpl to anl rtemal IIn.
5. Hertlrthenvlsu1t&esaenrerplvcd.
6. Intlmel uiting imu1rW ulth-1uoridc Hldsherthcdwith staInless steel.
TO provide an rdditlonrl oxygens*ply for the fuel cells.
Pmrcnts oxygen flowing fm m tank 3to the fuel cells in the cent oflleak in any of the cells, but allowsflor to the Envirann*ntal Controlsystem.
To pruvidc source of electricalpwer In the event of a cyogenics&system failure.
To reduce potential ignitionsources in the high pressuresystem.
B-4

8/7/2019 Saturn V Launch Vehicle Flight Evaluation Report - AS-509 Apollo 14 Mission
http://slidepdf.com/reader/full/saturn-v-launch-vehicle-flight-evaluation-report-as-509-apollo-14-mission 253/254
MPR-SAT-FE-71-1
APPROVAL
SATURN V LAUNCH VEHICLE FLIGHT EVALUATION REPORT
AS-509, APOLLO 14 MISSION
By Saturn Flight Evaluation Working Group
The information in this report has been reviewed for security classifi-
cation. Review of any information concerning Department of Defense orAtomic Energy Comnission programs has been made by the MSFC SecurityClassification Officer. The highest classification has been determinedto be unclassified.
Security Classification Officer
been reviewed and approved for technical accuracy.
Evaluation Worhing Group
Richard &SmithSaturn Program Manager

8/7/2019 Saturn V Launch Vehicle Flight Evaluation Report - AS-509 Apollo 14 Mission
http://slidepdf.com/reader/full/saturn-v-launch-vehicle-flight-evaluation-report-as-509-apollo-14-mission 254/254
l