Embed Size (px)
Citation preview

Original article
SATISFACTION OF THE ELDERLY AFTER COMPLETE DENTURES INSERTION ON UPPER AND LOWER ARCH AT
JATURAPAKPIMAN DISTRICT, ROI ET PROVINCE, THAILAND Jarinya Chomjai* and Robert S. Chapman
College of Public Health Sciences, Chulalongkorn University, Bangkok 10330, Thailand
AB!3TRACT: A cross-sectional study was conducted among 270 elderly patients who got complete dentures h m Jatumpkpiman district hospital, Roi Et province, Thailand. The study had 3 objectives: (1) To determine satisfaction of the elderly after complete denture insertion related to oral health impact profile ( O m and questions related to satisfaction of upper and lower denture; (2) To assess the oral hygiene behavior and denture care after the oomplete denture insertion; (3) To idenbfy the hctom asxchted with satisfaction and oral health impact after denture insertion. Dental nurses and interviewers were 'mined to administer the stan* questionnaire, Intaviews were conducted February and March 2010. Frquencies, percentags, means and standard deviations were used to desaibe demographic data, oral hygienic behaviors and denture care. To assess assxiations between dependent and independent variables, Spearman correlation, Mann-Whitney U tests, and Kruskal-Walhs tests were used. The average age was 7 1.55 years, 140 persons were male (51.9?/). Married patients were 157 persons (58.1%). The majority (69.3 YO) of study population were primary education. 80.00/0 of patients were in agriculture and their W y income were less than 1,000 bahtlmonth (64.8%), Sources of information, they knew the information to get dentures fian friends 35.2 vt, hospital 31.2 vt. Oral hygienic behavior, most of them showed they had coffee and tea drinking 76.3 percent, carbonic drinking 68.1 percent. Patents who used water and chemical tablets to clean dentures had siptican@ higher OHIP and satisfaction with lower and uppa dentures (P10.034). Bntshing teeth was not consistently d t e d with OHIP or satisfaction with dentures. Not removing dentures at bedtime was asmhted with lower OHIP and satisfaction. Keywords: Satisfaction/ Oral health Impact profile(O~/Complete Denture
INTRODUCTION: The 6th dental national health normal happy life with adequate confidence.
status survey, Ministry of Public health (MoPH), Complete dentures are the most common pmaqhm . .
2008 show that the elderly from 60 - 74 years of offered to edentulous patients3.43.
age has dental caries 95%, periodontitis 85% , In the year 2006, Dental Health Division,
root caries 20% and have natural teeth less than Ministry of Public Health (MoPH) has started the
20 teeth for function is 47.7%, There is tooth loss project of prosthesis denture for the elderly to
92%'). These statistics indicate that tooth loss is a celebrate the 80th anniversary of His Majesty the
very important and widespread problem in the Kmg. This project is planned for three years and
elderly in Thailand. l k s can affect quahty of Me, has a target to gwe denture therapy to 80,000
body and mind, loss of dental function for eating, people fi-om which 50% of the elderly will get
can not speak clearly and smoothly, physical arhficial teeth which are suitable for eating.
appearance (cosmetics), change of face shape, Jaturapakpiman hospital had the project of
short and thin, can not hear from mandibular prosthesis denture for the elderly to celebrate 80th
hm c3qxskx-P. b can a b b rnenfal/emotional anniversary of His Majesty the King. Therefore the
effects, because of which elderly will lose their researcher investigated the effect and quality of
confidence in their hfestyle and keep themselves denture, The researcher would like to k m the
away from the community. Denture therapy can satisfaction of the elderly after they get complete
help these elderly and bring them back to their denture insertion, and to investigate the factors
'To whom correspondence should be addressed. E-mail: [email protected]
J Health Res 20 10, 24(szippl2): 163-168

Original article
associated with satisfaction and oral health impact
after denture insertion@.
MATEFUAL.S AND METHODS: The population of
this study was the elderly patients who got
complete dentures from the project of prosthesis
denture for oral health the elderly to celebrate
80th anniversary of His Majesty the King, in the
year 2006-2009 fi-om Jaturapakpiman hospital,
Jaturapakpman district, Roiet pmince, 'lkdand.
Both male and female of the elderly aged 60 years
and over, amount 270 cases.
Questionmk was used far measurement, it was
created by reviewing of literature and guide lines
fYom Oral Health Impact Profile (OHIP-14) and
questions related to satisfaction of upper and
lower de11ture7~8~9JO). Data was collected by face to
face interview to the elderly from this
questionnaire. Data was coded and entered by
using Microsoft Excel 2003 software. Then data
analysis was done by using SPSS version 17
software. Descriptive statistics: frequency,
percentage, mean, standard deviation, median
and range are calculated for the socio-
demographic characteristics, Denture care and
Oral Health Impact F'rofile (OHIP). OHIP score and
satisfaction score were not normally distributed.
Thus, relationships between the independent
variables and dependent variables were assessed
with non-parametric Spearman correlation,
Mann-Whitney U tests, and Kruskal-Wallis tests.
RESULTS: Socio-demographic characteristics
of study population.
Among 270 patients, The average age was
7 1.55 years old, minimum age was 6 1 years old,
maximum was 87 years old. 140persons were
male (51.9%), 130 persons were female (48.1%)).
This study showed manied patients were 157
persons (58.1%). Widowed patients were 113
persons (4 1.9%). Education level, the majority 187
persons (69.3%) were primary education. No
education 48 persons (17.8%). Almost all of them
(80.0%) were agriculture and their family monthly
income in average was 2,383.33 bahtlmonth,
minimum fkmdy monthly income was 500
bathlmonth, maximum farmly income was
30,000 bathlmonth. There were 124 persons
(45.9%) used to have dentures before they would
get this denture from this study, Sources of
information, they knew the information to get
dentures h m fiends (35.2%), hospital (31.2%),
primary public health office (24.1%). Almost of
patients from this study, they came to hospital by
motorcycle (56.3%), bus (32.6%).
Distribution of dentures care of study population
This study showed many methods for dentures
care and cleaning, brushed their dentures one
time per day (18.5%), brushed their dentures more
than one time per day (66.7%), used detergent to
clean dentures (5 1.9%), cleaned their dentures by
rinsing with water (41. I%), &d not clean their
dentures (8.1%) And the patients who used
chemical tablets for clean their dentures (1 l.lO/o).
Summary of Oral Health Impact Profile and
questions related to satisfaction of the upper
and lower denture
Among 14 questions of Oral health impact
profile (OHIP), use a record in one of five categories
of a Likert scale, with a score of 0 representing to
never response, a score of 1 representing to hardly
ever response, a score of 2 representing to
occasionally, a score of 3 representing to fairly
often and a score of 4 representing to very often
response. Almost patients answered to never
response (score of 0).
Among 14 questions of questions related to
satisfaction of the upper and lower denture, use a
record in one of five categories of a Likert scale
same with OHIP 14 questions, with a score of 0
representing the most favourable response, a score
of 1 qmsmting to more hvoutable respm, a score
of 2 representing to favourable response, a score of
3 representing to less favourable response and
J Health Res 20 10, 24(~t@p12): 163- 168
Original article
a score of 4 representing to least favoutable
response. Almost all patients answered to
favourable response (score of 0). This study
showed the summary of questions related to
satisfaction of the upper and lower denture. Total
OHIP and satisfaction scores were calculated by
adding the total points f7om all questions in these
respecbve scales. Lower OHIP score kflected
better oral health than did higher OHTP score.
Smilarly, lower satisfaction score represented
better sati&ction than did hlgher satiskction score.
Associations of independent variables with OHIP
smeq overall sa l i&&b scmes, and sa-
scores for upper and lower dentures.
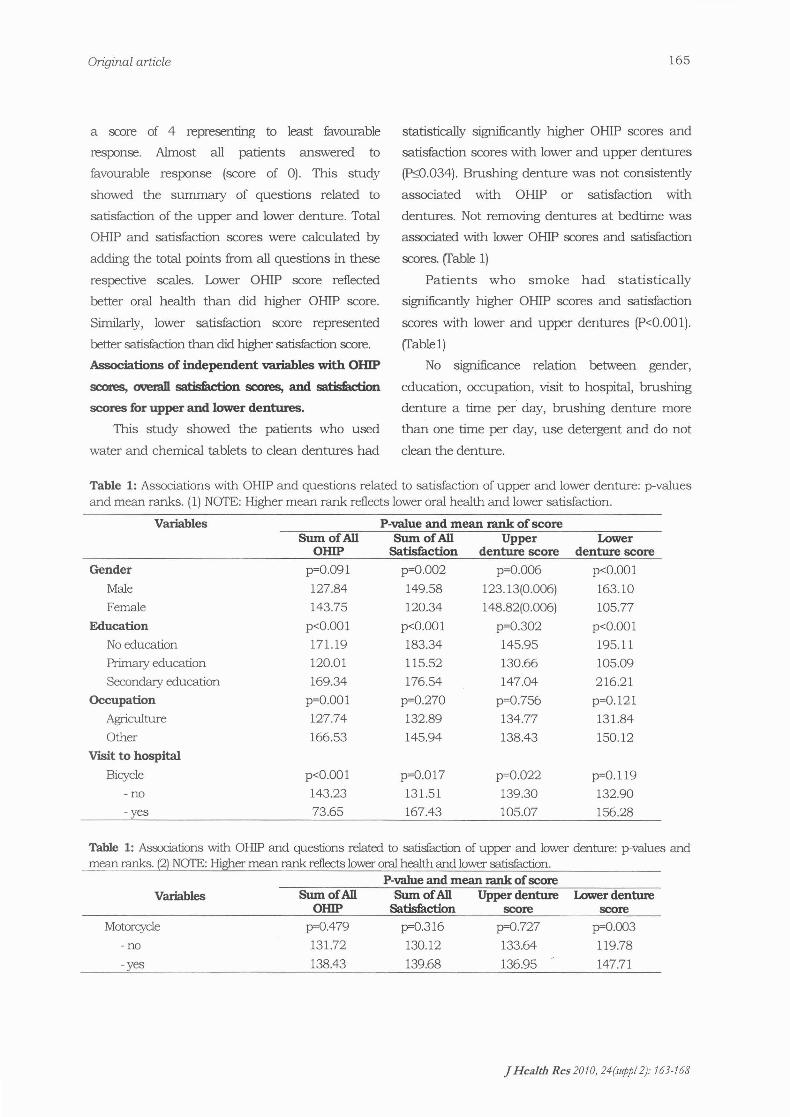
This study showed the patients who used
water and chemical tablets to clean dentures had
statistically sigmficantly higher OHIP scores and
satisfaction scores with lower and upper dentures
w0.034). Brushing denture was not consistently
associated with OHIP or satisfaction with
dentures. Not removing dentures at bedtime was
asmiated with lower OHIP scores and satisfaction
scores. (Table 1)
Patients who smoke had statistically
sigmficantly higher OHIP scores and satisfaction
scores with lower and upper dentures (P<0.001).
(Table 1)
No significance relation between gender,
education, occupation, visit to hospital, brushing
denture a time per' day, brushmg denture more
than one time per day, use detergent and do not
clean the denture.
Table 1: Associations with OHIP and questions related to satisfaction of upper and lower denture: p-values and mean ranks. (1) NOTE: Higher mean rank reflects lower oral health and lower satisfaction.
Variables
Gender Male Female
Education No education Primary education Secondary education
Occupation Agriculture Other
Visit to hospital
P-value and mean rank of score SumofAU Sum of AU Upper Lower
OHIP Satisfaction denture score denture score p=0.09 1 p=0.002 p=0.006 p<O.OO 1
127.84 149.58 123.13(0.006) 163.10 143.75 120.34 148.82(0.006) 105.77
p<O.OOl p<O.OOl p=0.302 p<O.OOl 171.19 183.34 145.95 195.11 120.01 115.52 130.66 105.09 169.34 176.54 147.04 216.21
p=O.OOl p=0.270 p=0.756 p=O. 121 127.74 132.89 134.77 131.84 166.53 145.94 138.43 150.12
Bicycle p<O.OO 1 p=O.O 17 p=0.022 p=O. 119 - no 143.23 131.51 139.30 132.90 -yes 73.65 167.43 105.07 156.28
'hble 1: Asxiations with OHIP and questions related to satisfaction of uppes and lower denture: pvalues and mean ranks. (2) NOTE: Higher mean rank dects lower d health and lower satisfaction.
Variables P-value and mean rank of sane
Sum ofAll Sum of All Upper denture Lcrwer denture
Motorcycle ~ 0 . 4 7 9 ~ 0 . 3 1 6 ~ 0 . 7 2 7 p=O.003
- no 131.72 130.12 133.64 119.78
- Y e s 138.43 139.68 136.95 147.71
j Health Res 2010,24(srppI 2): 163-1 68

166 Original article
P-value and mean rank of score Variables SumofAn Sum of AU Upper denture Lower denture
OHIP SaIisEaction score score Oral hygienic behavior
Mee/tea drinking p0.925 p=O.001 ~0.495 p0.448 - no 134.70 162.65 141.25 141.92 - Yes 135.75 127.07 133.71 133.50
Whisky drinking p=0.007 ~0.006 PO. 130 ~0.397 - no 123.97 123.74 129.04 131.87 - Yes 149.48 149.77 143.34 139.90
Carbonic drinking p<O.001 pQ.001 p<O.001 p0.2 18 - no 177.09 159.31 166.73 143.99 - Yes 116.06 124.37 120.90 131.53
Smoking p<O.001 p<O.001 p<O.001 p<O.001 - no 121.90 113.93 124.76 117.41
- Y e 172.21 193.70 164.47 184.33 Arem nut chewing ~0.152 po. 159 p o . ~ 1 ~0.001
- no 129.69 141.25 117.36 154.42 - Ye 143.33 127.76 159.95 111.35
Denture care Brushing denture a time per day ~0.031 p0.031 p0. 169 ~0.769
- no 140.34 130.63 138.58 134.84
- Y e 114.22 156.92 121 -93 138.40 Brum denture
one time per day - no
- Yes 129.55 130.21 137.87 141.05 No brushing p<O.001 p0.793 ~0.576 p0.011
- no 188.88 132.52 141.80 106.90 - Yes 126.22 136.02 134.40 140.47
Use detergent pQ.26 1 ~0.001 ~0.829 p<O.001 - no 140.99 106.40 136.55 98.20 - Yes 130.40 162.52 134.52 170.14
use water pa.001 pa.001 pa.001 pa.001 - no 97.45 111.89 98.28 119.98 - Yes 190.01 169.32 188.82 157.73
Do not clean ~0.058 p<0.001 ~0.001 pO.001 - no 132.84 142.88 141.89 142.58 -yes 165.45 52.36 63.50 55.68
Thble 1: Assxiations with OHIP and questions related to satisfaction of upper and lower denture: p-values and mean A s . (3) NOTE: Higher mean rank reflects lower oral health and lower satisfaction.
Variables P-value and mean rank of score Sum of All Sum of All Upper denture Lower d e n k
OHCP Satk&ction score SCOW
Use chemical tablets p0.034 ~ 4 . 0 0 1 pa.001 p=0.001 - no 13 1.97 128.85 127.76 130.18 - Yes 163.75 188.68 197.43 178.10
~ e t denture out and keep in water p<0.001 p0.007 p0.048 p<O.OOl
mayday - no 159.94 121.54 145.66 109.07 - Yes 115.05 147.18 127.00 1157.62
Not moving denture at bedtime p0.202 p4.001 p=0.001 p4.001 - no 139.36 160.53 145.64 165.47 - V ~ S 126.17 74.97 110.99 63.04
JHealth Res 2010,24(supp12): 763-168

Original article
DISCUSSION. Many literatures showed about
satisfaction and oral health impact profde (OHIP).
OHIP used to measure the elderly who get
complete dentures in England and Scotland (H.
Forgie, 2005). In this study among 14 questions
of Oral health impact profile (OHIP), use a
record in one of five categories of a Likert scale,
with a score of 0 representing to never response
and a score of 4 representing the very often
response. Almost patients in this study choose
0 and 1 for all OHIP questions. Among 14
questions of questions related to satisfaction of the
upper and lower denture, use a record in one of
five categories of a Likert scale with a score of 0
representing the most favourable response and
a score of 4 representing the least favourable
response. Almost patients choose 0 and 1 same
with OHIP questions.
Almost the studies in Thailand use questionnak
from dental public health division, Ministry of
Public Health (MoPH) for assess the satisfaction
after denture insertion of the elderly and these
studies showed about 80% satisfaction of the
elderly after denture insertion (Ministry of
Public Health, 2007).
In this study used OHIP-14 questions and
questions related to satisfaction of upper and
lower denture showed the association between
demographic characteristics (gender, visit to
hospital, oral hygienic behavior, denture care)
by Spearman correlation, Mann-Whitney U
tests, and Kruskal-Wallis tests were used,
showed patients who used water and chemical
tablets to clean dentures had sigrvficantly
higher OHIP and satisfaction with lower and
upper dentures (P<0.034), this means lower oral
health level and lower satisfaction level. Brushing
teeth was not consistently associated with OHIP
or satisfaction with dentures. Not removing
dentures at bedtime was associated with lower
OHIP and satisfaction. This means better oral
health level and higher satisfaction level.
RECCOMENDATIONS:
Tooth loss protection
As for other age groups, use of fluoride is
effective in prevention of dental caries in elderly.
Topical application and mouthrinsing with
fluorides are shown to reduce the number of
root surface caries lesions, both in active old-
age people. Rinsing with a chlorhexidine
solution tends to reduce gingival inflammation,
pocket depth, and incidence of denture
stomatitis. Clinical studies suggest that oral
health education for elderly patients is effective.
Denture care
Proper denture care is important for both
the health of dentures and mouth. Brush and
rinse dentures daily. Like natural teeth, dentures
must be brushed daily to remove food and plaque.
Brushing also helps. prevent the development of
permanent stains on the dentures. Use a brush
with soft bristles that is specifically designed for
cleaning dentures. Avoid using a hard-bristled
brush as it can damage or wear down dentures.
Gently brush all surfaces of the denture and be
careful not to damage the plastic or bend
attachments. In between brushings, rinse
dentures by water after every meal.
REFERENCES:
1. Miistry of Public Health. Department of Health.
Dental Health Division. (2007). The 6th National
Oral Health Survey in Thailand. Bangkok: The
War Veterans Organization Printing Office.
2. Heydecke G, Locker D, Awad MA, Lund JP,
Feine JC. (2003). Oral and gened health related
quality of life with conventional and implant
dentures. Community Dent Oral Epiderniol. 3 1 :
161-168.
J Health Res 2010,24(~1@jp12): 763-1 68

Original article
3. Allen PF, McMillan AS. (2003). A longtudinal
study of quality of quality of life outcomes in
older requesting implant prostheses and complete
removable dentures. Clin oral implants Res. 14:
173-179.
4. Asja Celebic, Dubravka Knezovic, Milan Papic
Vlado Carek, and Jasmina Stqxtic. (2003). Factors
related to patient satisfaction with amplete denture
therapy. Journal of Gerontology. 58A: 948-953.
5. Dubravka Knezovic, Milan Papic Vlado Carek,
and Jasmina Stipetic. (2003) Factors related to
patient satisfaction with complete denture therapy.
Journal of Gerontology. 58A: 948-953.
6. Suchada Teekayupan. (2008). Satisfaction in
Prosthesis denture campaign for the elderly to
celebrate 80th anniversary His Majesty's the
King in Roi-et Province. Journal of dental public
health. 13: 88-95.
7. Andrew H. Forgie, Brendan J.J. Scott and
David M. Davis. (2005). A study to compare the
oral health impact profrle ans satisfaction before
and after having replacement complere dentures in
England and Scotland. Gerodontology. 22: 137-
142.
8. E.B. Ozhayat, K. Stoltze, B. Elverdam B. Owall.
(2007). A method for Assessment of quality of life
in relation to prosthodontics. Partial edentulism
and removable partial dentures. Journal of Oral
Rehabilitation. 34: 336-344.
9. Fenlon MR, Sherriff M, Walter JD. (2002).
Agreement between clinical measures of quality
and patients rating of fit of existing and new
complete dentures. J Dent. 30: 135- 139.
10. Fenlon MR, Sheniff M. (2004). Investigation
of new complete denture quality and patients
satisfaction with and use of dentures after two
years. J Dent. 32: 327-333.
J Health Res 20 10,24 (r~pp12): 163-1 68


![Measuring Adult Student Gains and Satisfaction After Earning an Undergraduate Continuing Education Degree [Presentation Slides]](https://img.pdfslide.us/doc/110x75/55a7b6641a28abd2168b491e/measuring-adult-student-gains-and-satisfaction-after-earning-an-undergraduate-continuing-education-degree-presentation-slides.jpg)