Embed Size (px)
Citation preview
Satisfaction & Motivation Study 2010
NEW ZEALAND
The Seek Employee Satisfaction & Motivation Survey
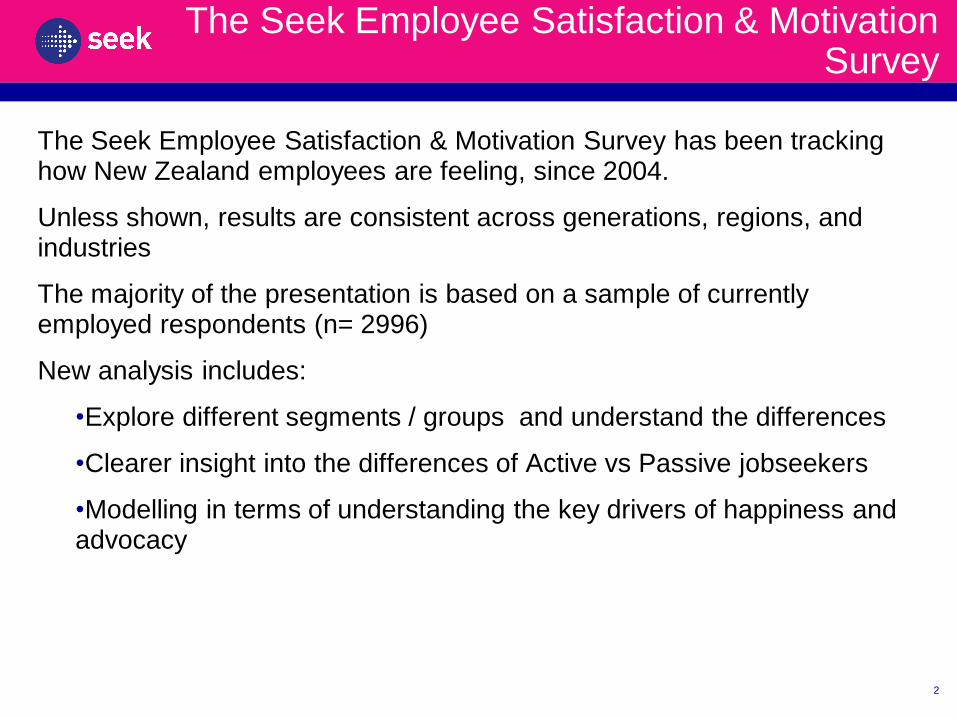
The Seek Employee Satisfaction & Motivation Survey has been tracking how New Zealand employees are feeling, since 2004.
Unless shown, results are consistent across generations, regions, and industries
The majority of the presentation is based on a sample of currently employed respondents (n= 2996)
New analysis includes:
•Explore different segments / groups and understand the differences
•Clearer insight into the differences of Active vs Passive jobseekers
•Modelling in terms of understanding the key drivers of happiness and advocacy
2
Employee Job Security
And Happiness
Job Security/ Employee Happiness
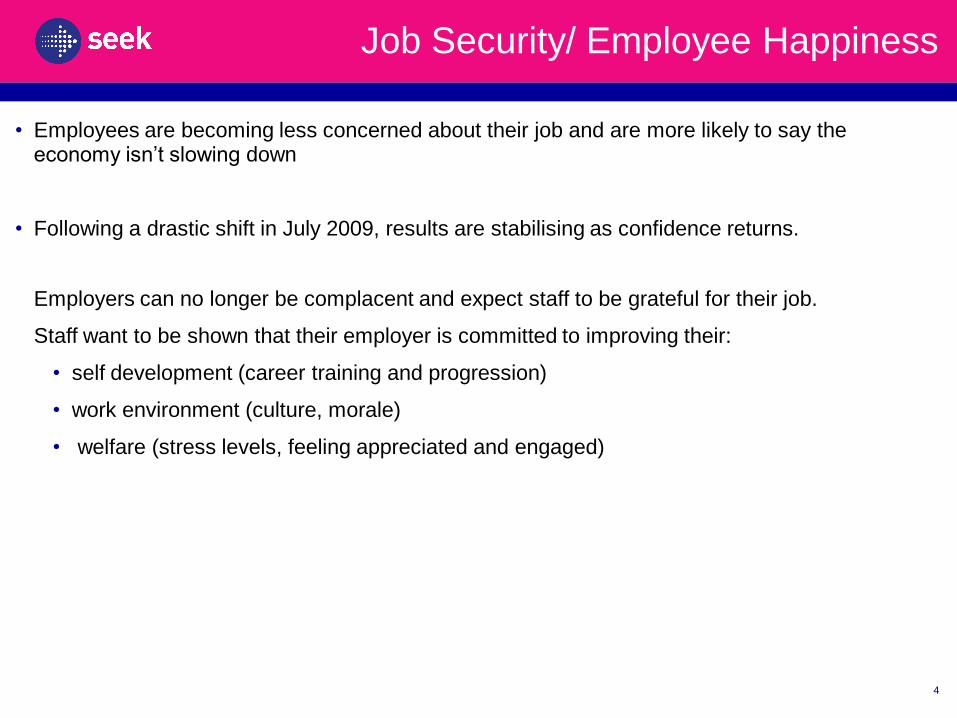
• Employees are becoming less concerned about their job and are more likely to say the economy isn’t slowing down
• Following a drastic shift in July 2009, results are stabilising as confidence returns.
Employers can no longer be complacent and expect staff to be grateful for their job.
Staff want to be shown that their employer is committed to improving their:
• self development (career training and progression)
• work environment (culture, morale)
• welfare (stress levels, feeling appreciated and engaged)
4
Employee Thoughts
About Their Organisation
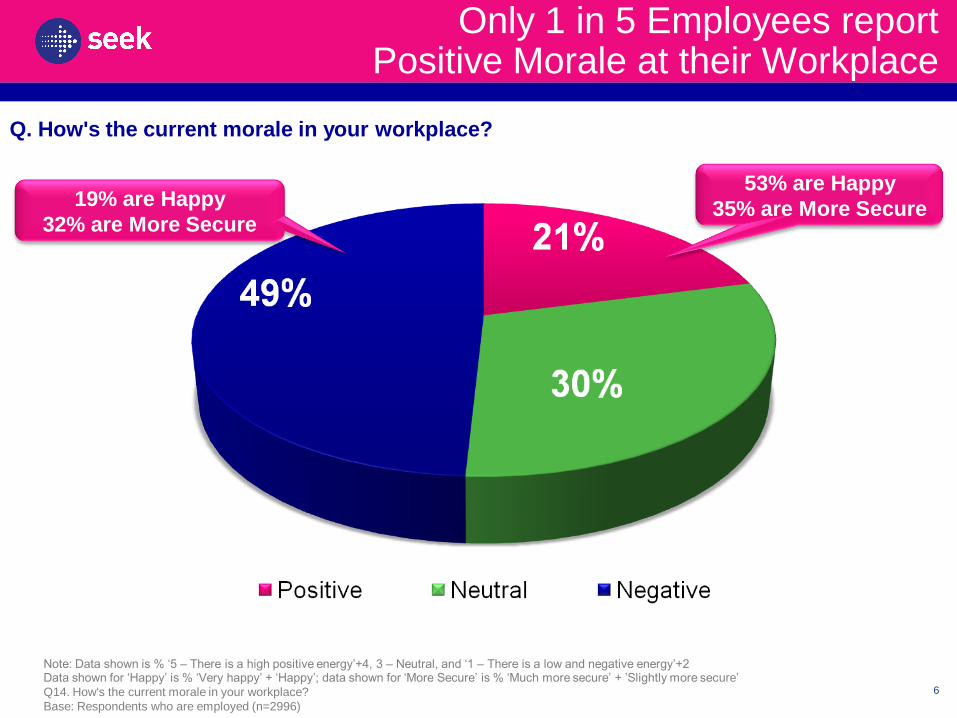
Only 1 in 5 Employees reportPositive Morale at their Workplace
6
Q. How's the current morale in your workplace?
Note: Data shown is % ‘5 – There is a high positive energy’+4, 3 – Neutral, and ‘1 – There is a low and negative energy’+2Data shown for ‘Happy’ is % ‘Very happy’ + ‘Happy’; data shown for ‘More Secure’ is % ‘Much more secure’ + ’Slightly more secure’
Q14. How's the current morale in your workplace?
Base: Respondents who are employed (n=2996)
53% are Happy
35% are More Secure19% are Happy
32% are More Secure
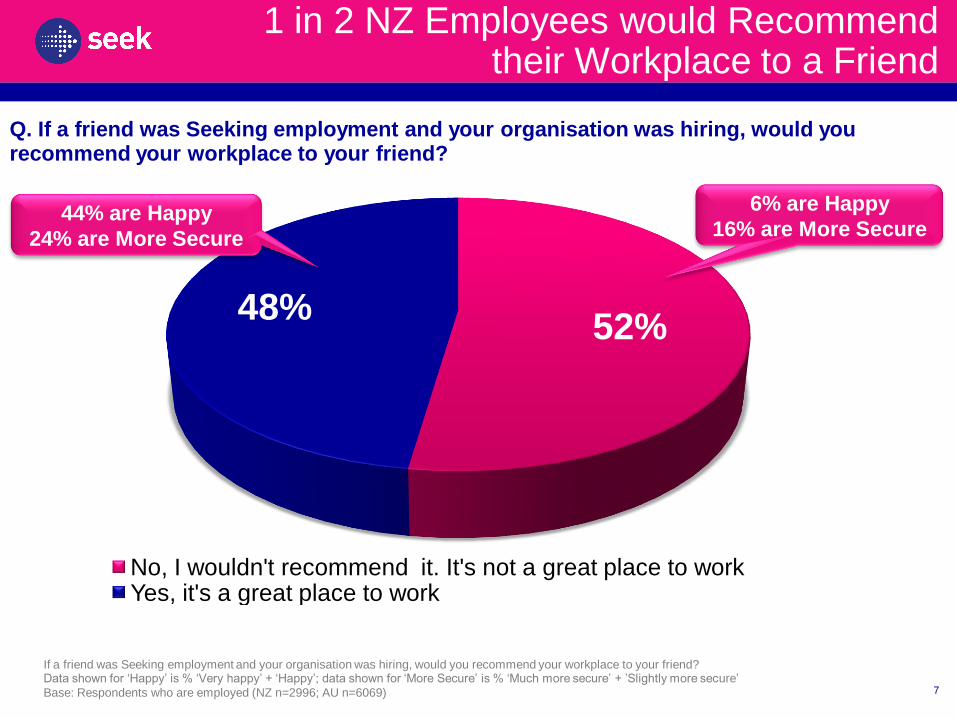
1 in 2 NZ Employees would Recommendtheir Workplace to a Friend
52%48%
No, I wouldn't recommend it. It's not a great place to workYes, it's a great place to work
If a friend was Seeking employment and your organisation was hiring, would you recommend your workplace to your friend?Data shown for ‘Happy’ is % ‘Very happy’ + ‘Happy’; data shown for ‘More Secure’ is % ‘Much more secure’ + ’Slightly more secure’
Base: Respondents who are employed (NZ n=2996; AU n=6069) 7
Q. If a friend was Seeking employment and your organisation was hiring, would you recommend your workplace to your friend?
6% are Happy
16% are More Secure44% are Happy
24% are More Secure
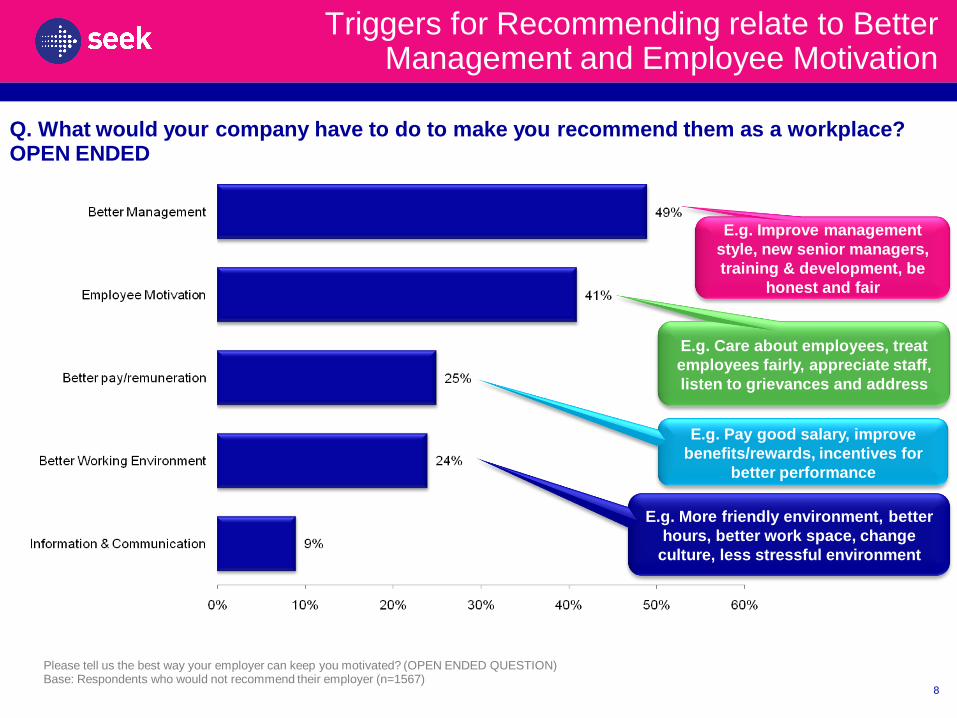
Triggers for Recommending relate to Better Management and Employee Motivation
Please tell us the best way your employer can keep you motivated? (OPEN ENDED QUESTION)Base: Respondents who would not recommend their employer (n=1567)
E.g. Improve management
style, new senior managers,
training & development, be
honest and fair
E.g. Care about employees, treat
employees fairly, appreciate staff,
listen to grievances and address
E.g. Pay good salary, improve
benefits/rewards, incentives for
better performance
8
Q. What would your company have to do to make you recommend them as a workplace? OPEN ENDED
E.g. More friendly environment, better
hours, better work space, change
culture, less stressful environment
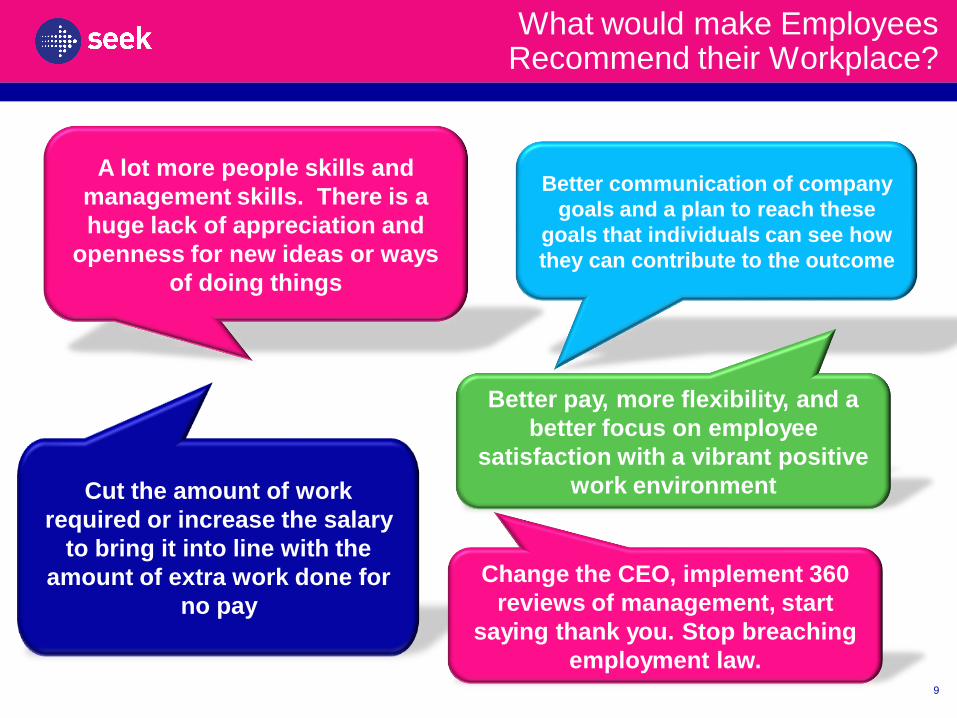
What would make EmployeesRecommend their Workplace?
Cut the amount of work
required or increase the salary
to bring it into line with the
amount of extra work done for
no pay
A lot more people skills and
management skills. There is a
huge lack of appreciation and
openness for new ideas or ways
of doing things
Better communication of company
goals and a plan to reach these
goals that individuals can see how
they can contribute to the outcome
Better pay, more flexibility, and a
better focus on employee
satisfaction with a vibrant positive
work environment
9
Change the CEO, implement 360
reviews of management, start
saying thank you. Stop breaching
employment law.
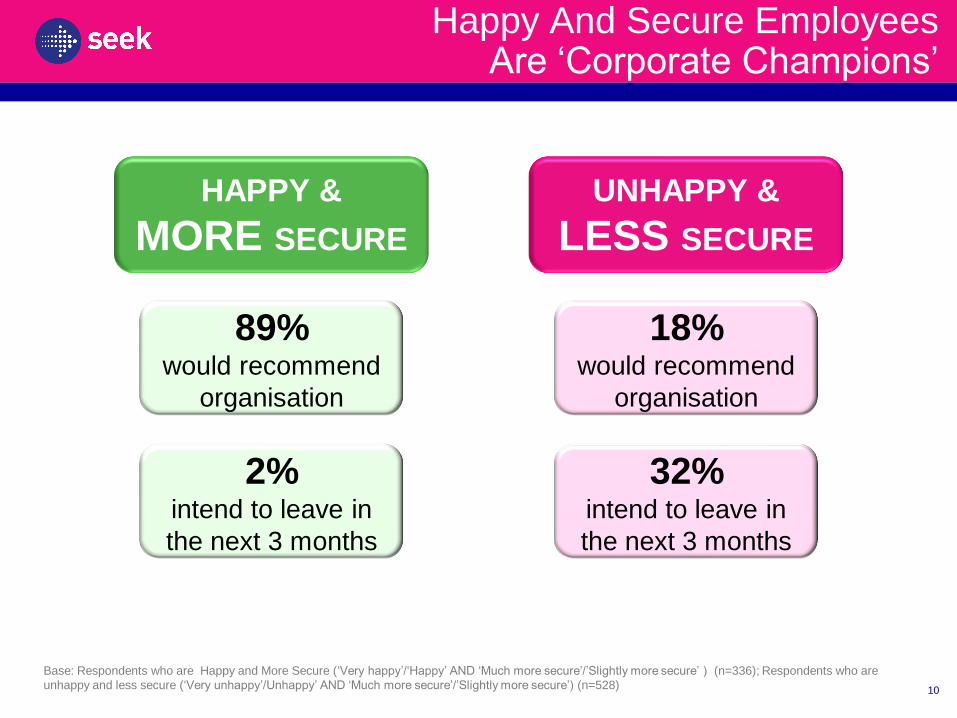
Happy And Secure Employees Are ‘Corporate Champions’
Base: Respondents who are Happy and More Secure (‘Very happy’/‘Happy’ AND ‘Much more secure’/’Slightly more secure’ ) (n=336); Respondents who are
unhappy and less secure (‘Very unhappy’/Unhappy’ AND ‘Much more secure’/’Slightly more secure’) (n=528)
HAPPY &
MORE SECURE
89% would recommend
organisation
UNHAPPY &
LESS SECURE
2% intend to leave in
the next 3 months
18% would recommend
organisation
32% intend to leave in
the next 3 months
10
Employee Retention
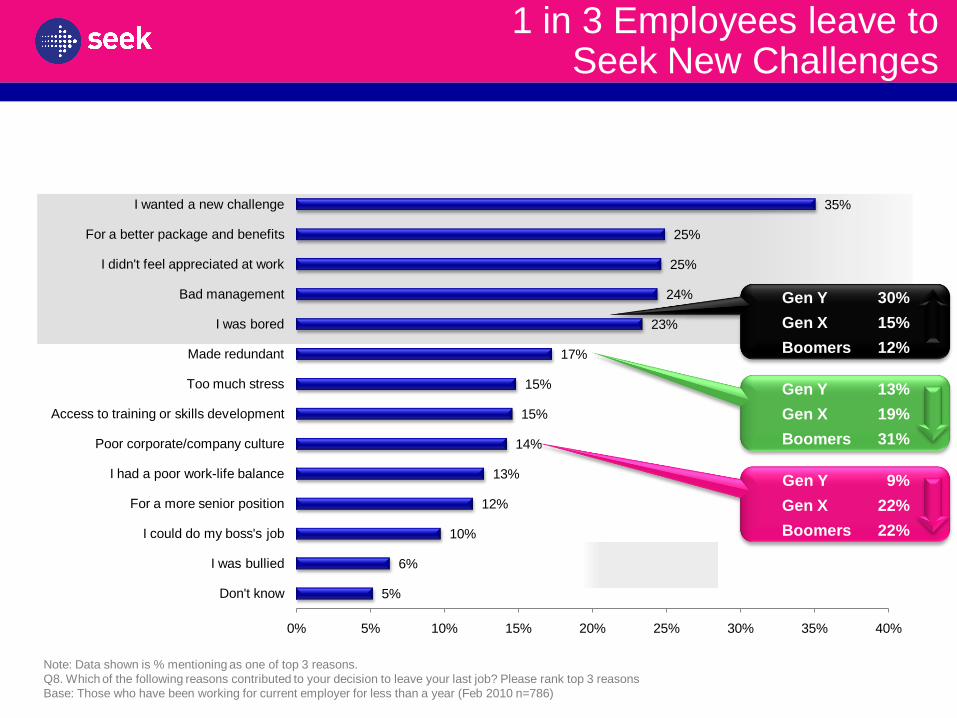
1 in 3 Employees leave toSeek New Challenges
Note: Data shown is % mentioning as one of top 3 reasons.
Q8. Which of the following reasons contributed to your decision to leave your last job? Please rank top 3 reasons
Base: Those who have been working for current employer for less than a year (Feb 2010 n=786) 12
Q. Which of the following reasons contributed to your decision to leave your last job? Please rank top 3 reasons.
Gen Y 30%
Gen X 15%
Boomers 12%
Gen Y 13%
Gen X 19%
Boomers 31%
Gen Y 9%
Gen X 22%
Boomers 22%
5%
6%
10%
12%
13%
14%
15%
15%
17%
23%
24%
25%
25%
35%
0% 5% 10% 15% 20% 25% 30% 35% 40%
Don't know
I was bullied
I could do my boss's job
For a more senior position
I had a poor work-life balance
Poor corporate/company culture
Access to training or skills development
Too much stress
Made redundant
I was bored
Bad management
I didn't feel appreciated at work
For a better package and benefits
I wanted a new challenge
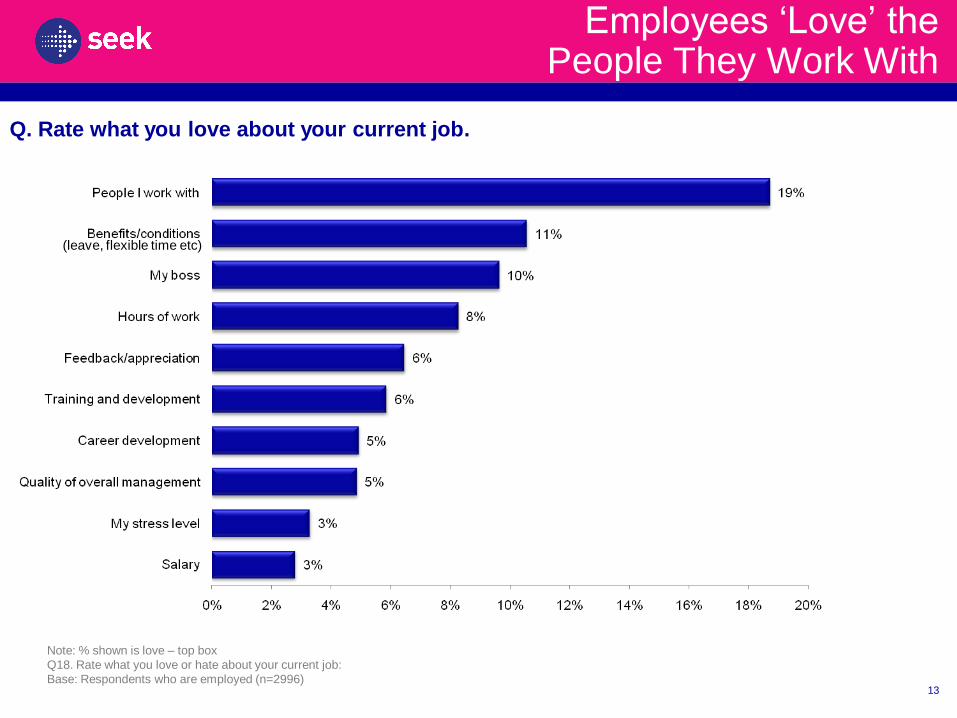
Employees ‘Love’ the People They Work With
Note: % shown is love – top box
Q18. Rate what you love or hate about your current job:
Base: Respondents who are employed (n=2996)
(leave, flexible time etc)
13
Q. Rate what you love about your current job.
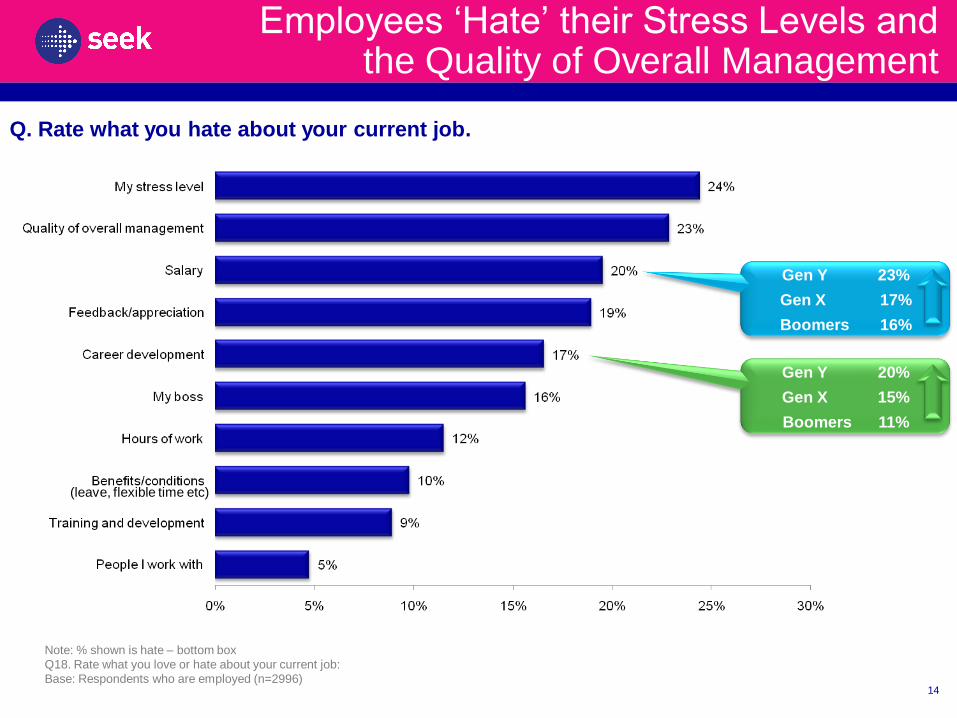
Employees ‘Hate’ their Stress Levels andthe Quality of Overall Management
Note: % shown is hate – bottom box
Q18. Rate what you love or hate about your current job:
Base: Respondents who are employed (n=2996)
(leave, flexible time etc)
14
Q. Rate what you hate about your current job.
Gen Y 20%
Gen X 15%
Boomers 11%
Gen Y 23%
Gen X 17%
Boomers 16%
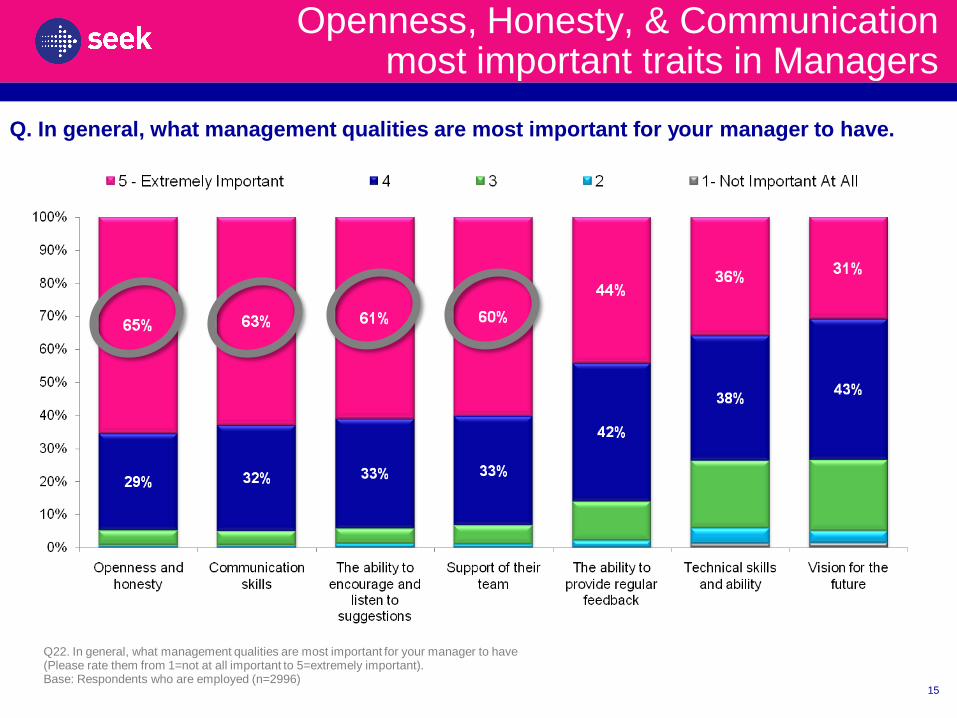
Openness, Honesty, & Communicationmost important traits in Managers
Q22. In general, what management qualities are most important for your manager to have (Please rate them from 1=not at all important to 5=extremely important).Base: Respondents who are employed (n=2996)
15
Q. In general, what management qualities are most important for your manager to have.
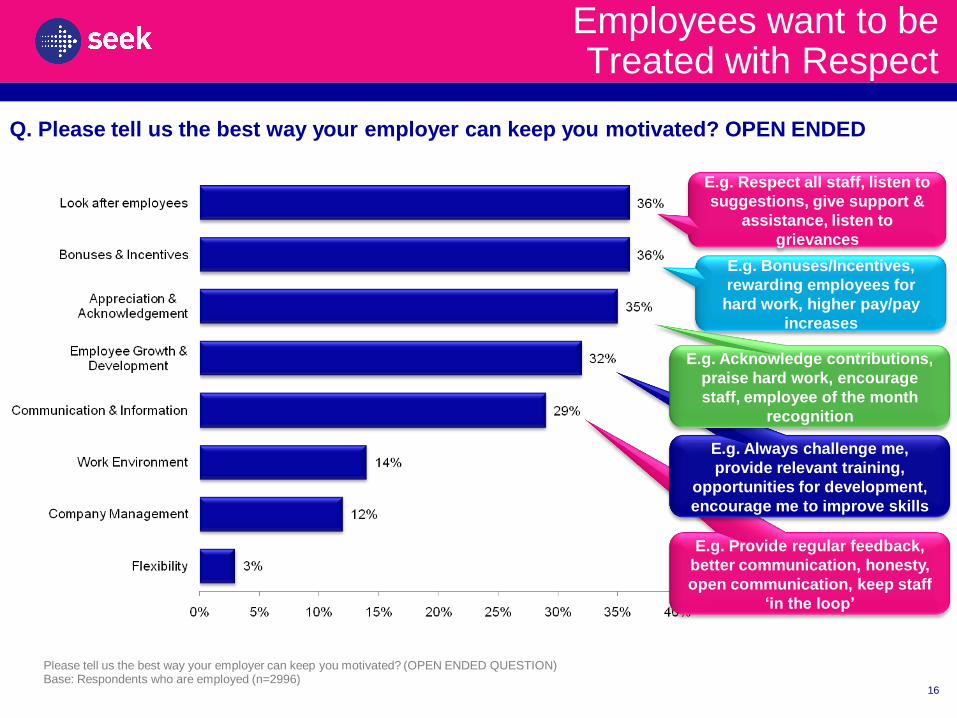
Employees want to beTreated with Respect
Please tell us the best way your employer can keep you motivated? (OPEN ENDED QUESTION)Base: Respondents who are employed (n=2996)
16
Q. Please tell us the best way your employer can keep you motivated? OPEN ENDED
E.g. Provide regular feedback,
better communication, honesty,
open communication, keep staff
‘in the loop’
E.g. Always challenge me,
provide relevant training,
opportunities for development,
encourage me to improve skills
E.g. Bonuses/Incentives,
rewarding employees for
hard work, higher pay/pay
increases
E.g. Acknowledge contributions,
praise hard work, encourage
staff, employee of the month
recognition
E.g. Respect all staff, listen to
suggestions, give support &
assistance, listen to
grievances

What Can Employers do to Motivate Employees?
The best way to motivate staff is
incentive. Give employees a goal to
work towards and turn it into a game.
First person to reach the set goal
gets something, ie. gift cards, store
credit or a bonus in their next pay.
Be really clear about where we
need to get to, write it down, send it
to everyone, bring everybody
together, make sure they
understand it - then get out of the
way and let people get it done.
By providing a culture of openness and
collaborative working, ensuring that
innovation and achievement is
rewarded, and staff are supported and
allowed to develop
17
By setting challenges. I am motivated
by the desire to exceed expectations.
Rewarding with responsibility should
be tempered with remuneration.
An employer needs to be
approachable, honest and
trustworthy. Benefits are great but
encouragement, support and
professional development are worth
more than a bonus here and there.
Feedback,
Challenge, and
Good Pay
Employee Thoughts
About The Future
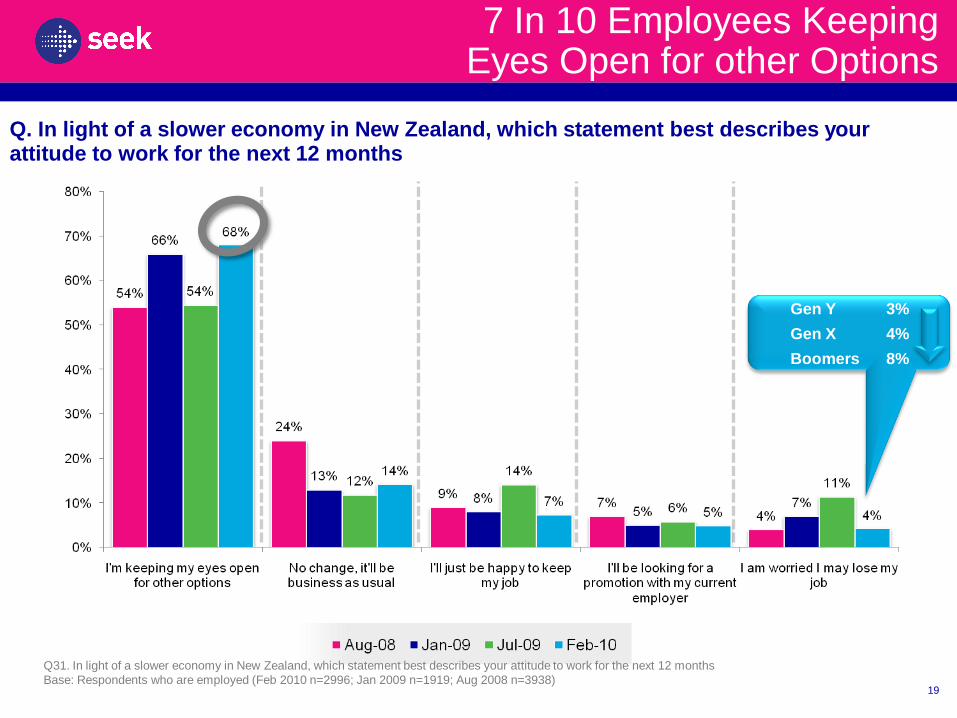
7 In 10 Employees Keeping Eyes Open for other Options
Q31. In light of a slower economy in New Zealand, which statement best describes your attitude to work for the next 12 months
Base: Respondents who are employed (Feb 2010 n=2996; Jan 2009 n=1919; Aug 2008 n=3938)19
Q. In light of a slower economy in New Zealand, which statement best describes your attitude to work for the next 12 months
Gen Y 3%
Gen X 4%
Boomers 8%
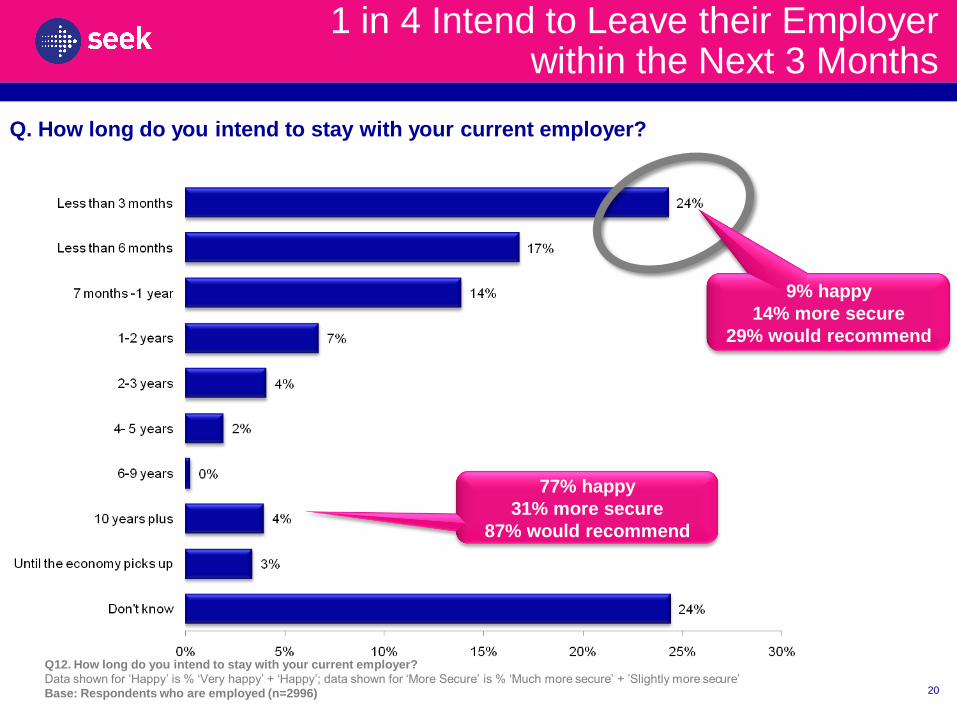
Q12. How long do you intend to stay with your current employer?
Data shown for ‘Happy’ is % ‘Very happy’ + ‘Happy’; data shown for ‘More Secure’ is % ‘Much more secure’ + ’Slightly more secure’
Base: Respondents who are employed (n=2996) 20
Q. How long do you intend to stay with your current employer?
9% happy
14% more secure
29% would recommend
77% happy
31% more secure
87% would recommend
1 in 4 Intend to Leave their Employerwithin the Next 3 Months
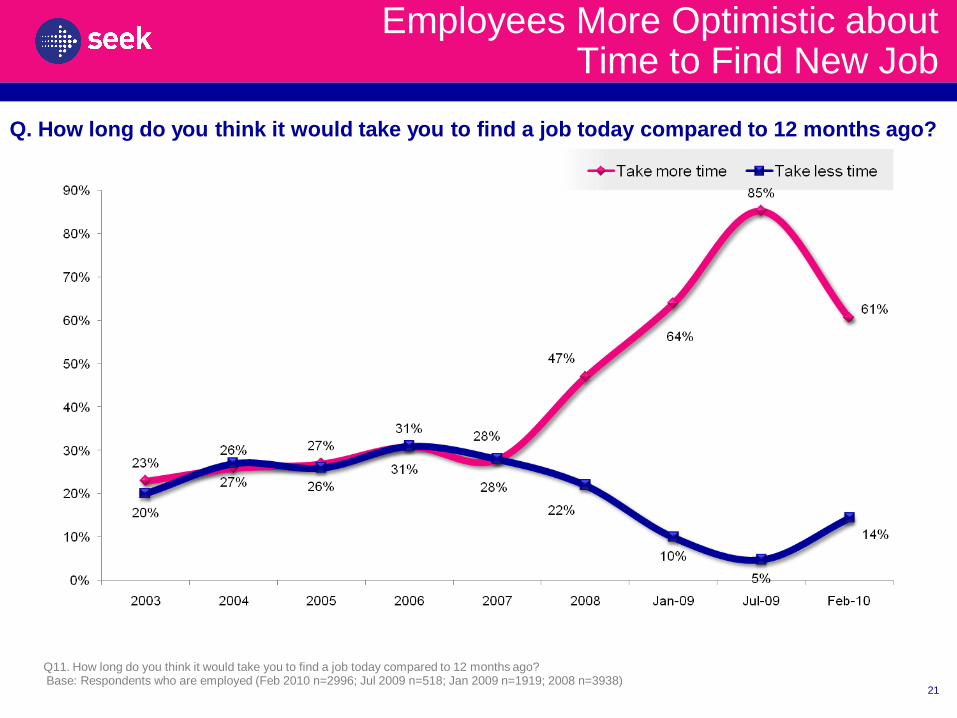
Employees More Optimistic aboutTime to Find New Job
Q11. How long do you think it would take you to find a job today compared to 12 months ago? Base: Respondents who are employed (Feb 2010 n=2996; Jul 2009 n=518; Jan 2009 n=1919; 2008 n=3938)
21
Q. How long do you think it would take you to find a job today compared to 12 months ago?
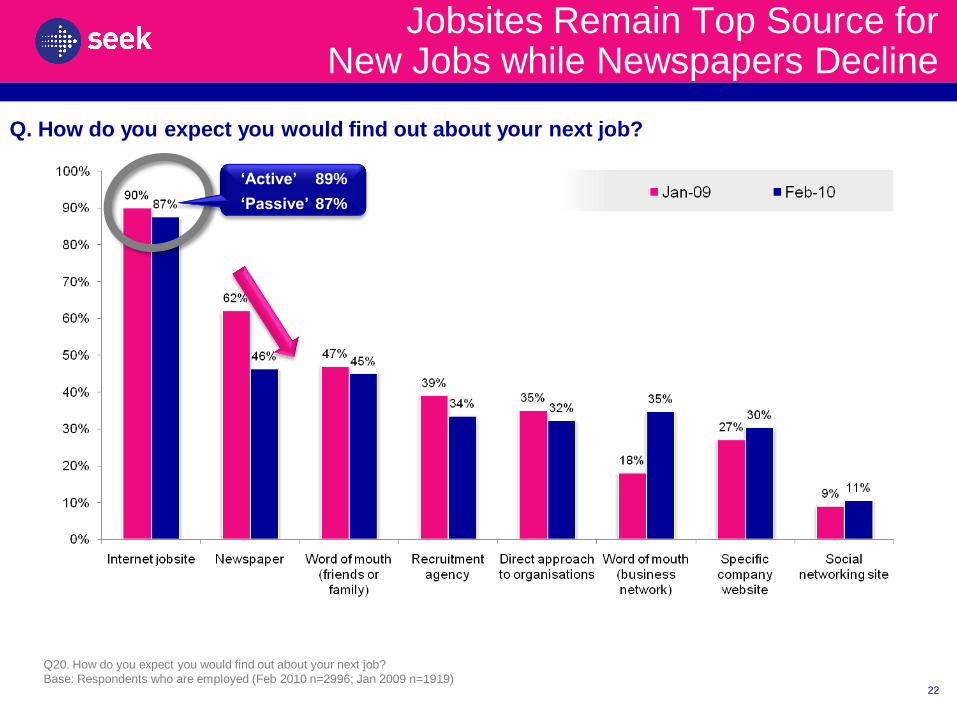
Jobsites Remain Top Source for New Jobs while Newspapers Decline
Q20. How do you expect you would find out about your next job?
Base: Respondents who are employed (Feb 2010 n=2996; Jan 2009 n=1919)22
Q. How do you expect you would find out about your next job?
‘Active’ 89%
‘Passive’ 87%
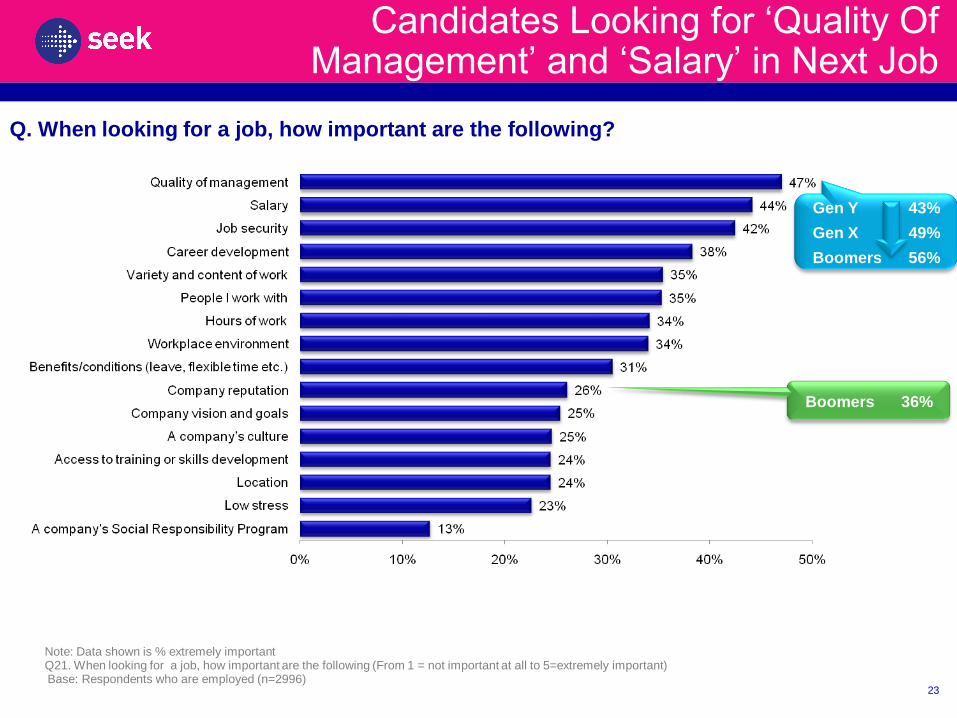
Candidates Looking for ‘Quality Of Management’ and ‘Salary’ in Next Job
Note: Data shown is % extremely importantQ21. When looking for a job, how important are the following (From 1 = not important at all to 5=extremely important)Base: Respondents who are employed (n=2996)
23
Gen Y 43%
Gen X 49%
Boomers 56%
Boomers 36%
Q. When looking for a job, how important are the following?
Group Differences
24
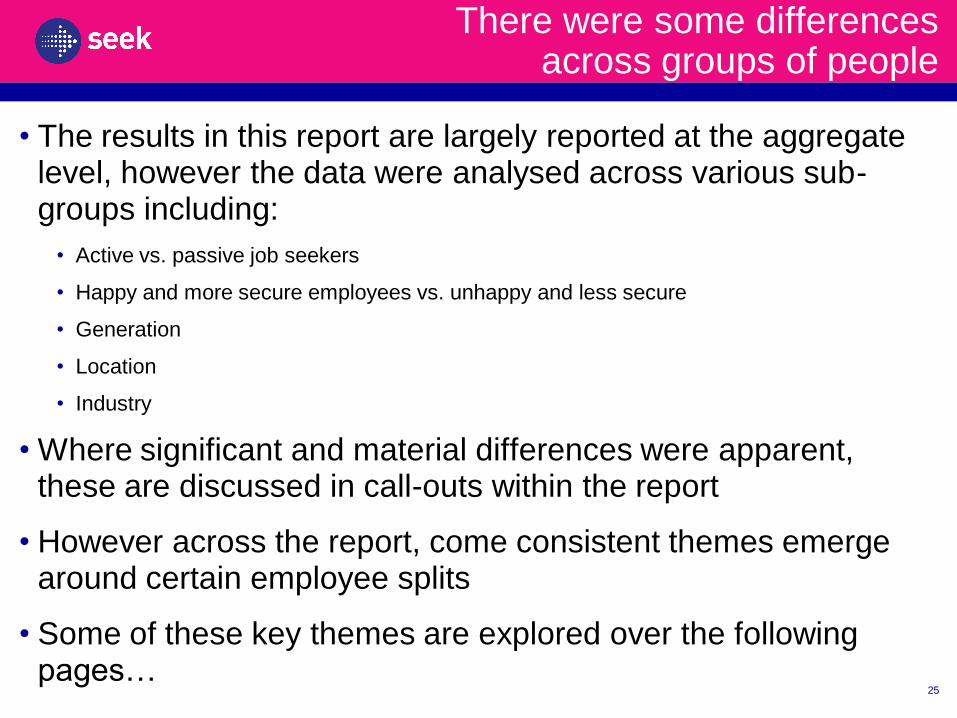
There were some differencesacross groups of people
• The results in this report are largely reported at the aggregate level, however the data were analysed across various sub-groups including:
• Active vs. passive job seekers
• Happy and more secure employees vs. unhappy and less secure
• Generation
• Location
• Industry
• Where significant and material differences were apparent, these are discussed in call-outs within the report
• However across the report, come consistent themes emerge around certain employee splits
• Some of these key themes are explored over the following pages…
25
Active vs. Passive
Passive
53%
Active
44%
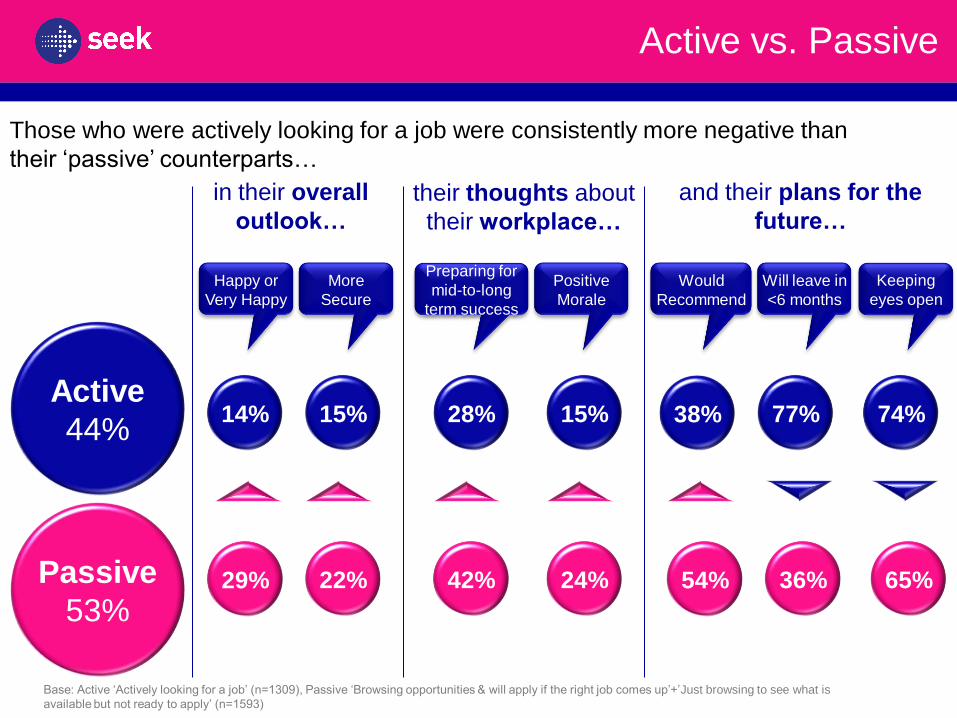
29% 22%
14% 15%
42%
28%
24%
15%
54%
38%
65%
74%
36%
77%
in their overall
outlook…their thoughts about
their workplace…
and their plans for the
future…
Those who were actively looking for a job were consistently more negative than
their ‘passive’ counterparts…
Happy or
Very Happy
More
Secure
Preparing for
mid-to-long
term success
Positive
Morale
Would
Recommend
Will leave in
<6 months
Keeping
eyes open
Base: Active ‘Actively looking for a job’ (n=1309), Passive ‘Browsing opportunities & will apply if the right job comes up’+’Just browsing to see what is
available but not ready to apply’ (n=1593)
27
Active vs. Passive
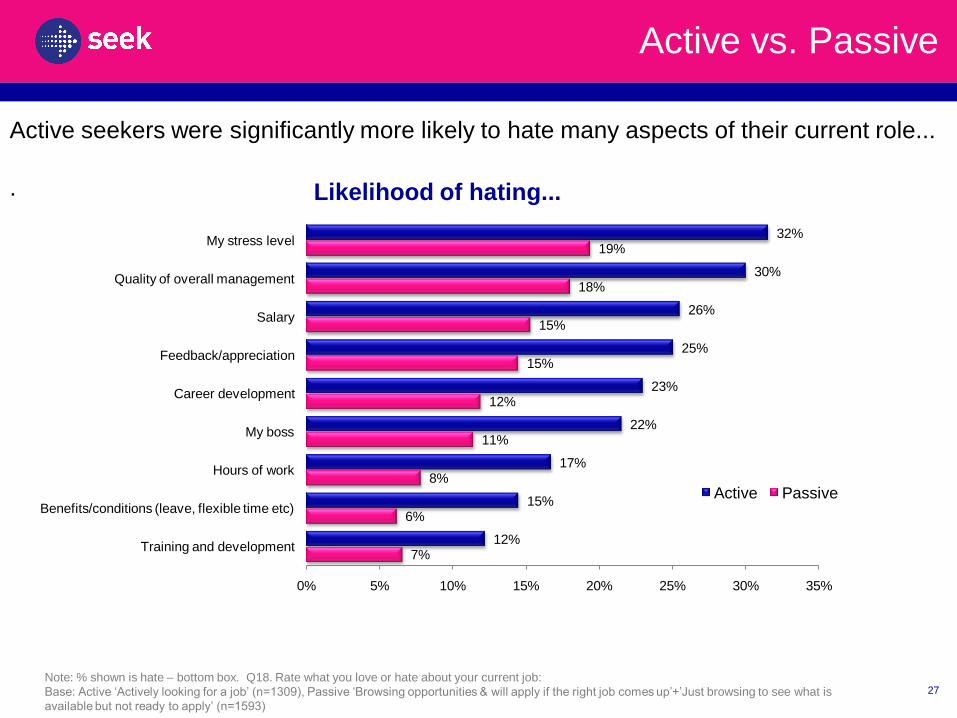
7%
6%
8%
11%
12%
15%
15%
18%
19%
12%
15%
17%
22%
23%
25%
26%
30%
32%
0% 5% 10% 15% 20% 25% 30% 35%
Training and development
Benefits/conditions (leave, flexible time etc)
Hours of work
My boss
Career development
Feedback/appreciation
Salary
Quality of overall management
My stress level
Active Passive
Active seekers were significantly more likely to hate many aspects of their current role...
. Likelihood of hating...
Note: % shown is hate – bottom box. Q18. Rate what you love or hate about your current job:
Base: Active ‘Actively looking for a job’ (n=1309), Passive ‘Browsing opportunities & will apply if the right job comes up’+’Just browsing to see what is
available but not ready to apply’ (n=1593)
Clear Themes across Key Industries
28
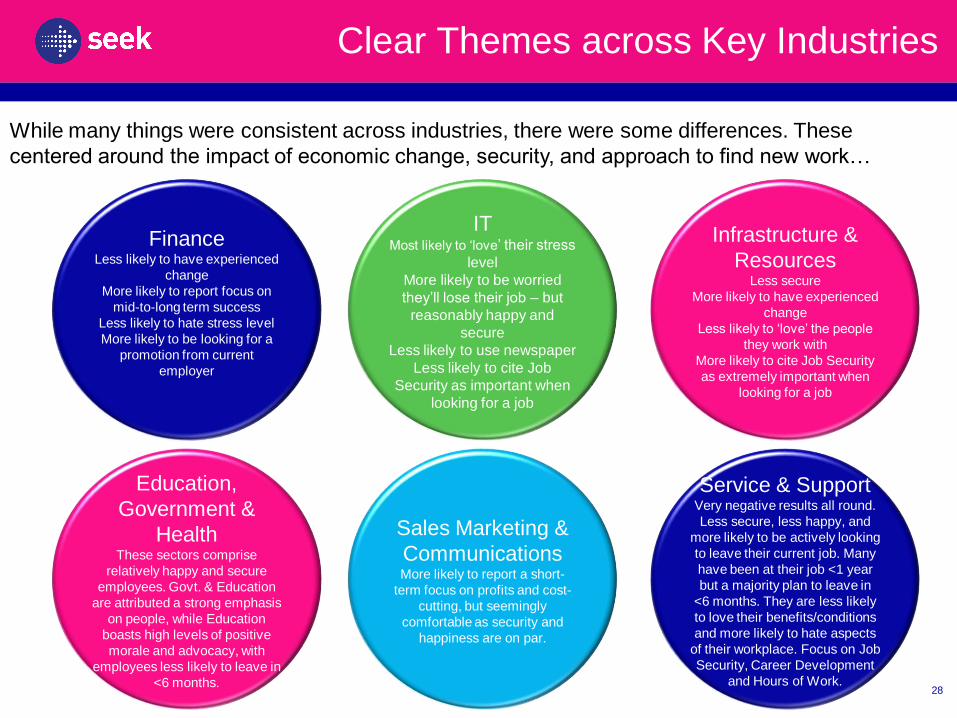
FinanceLess likely to have experienced
change
More likely to report focus on
mid-to-long term success
Less likely to hate stress level
More likely to be looking for a
promotion from current
employer
ITMost likely to ‘love’ their stress
level
More likely to be worried
they’ll lose their job – but
reasonably happy and
secure
Less likely to use newspaper
Less likely to cite Job
Security as important when
looking for a job
Infrastructure &
ResourcesLess secure
More likely to have experienced
change
Less likely to ‘love’ the people
they work with
More likely to cite Job Security
as extremely important when
looking for a job
Sales Marketing &
CommunicationsMore likely to report a short-
term focus on profits and cost-
cutting, but seemingly
comfortable as security and
happiness are on par.
Service & SupportVery negative results all round.
Less secure, less happy, and
more likely to be actively looking
to leave their current job. Many
have been at their job <1 year
but a majority plan to leave in
<6 months. They are less likely
to love their benefits/conditions
and more likely to hate aspects
of their workplace. Focus on Job
Security, Career Development
and Hours of Work.
Education,
Government &
HealthThese sectors comprise
relatively happy and secure
employees. Govt. & Education
are attributed a strong emphasis
on people, while Education
boasts high levels of positive
morale and advocacy, with
employees less likely to leave in
<6 months.
While many things were consistent across industries, there were some differences. These
centered around the impact of economic change, security, and approach to find new work…
And Some Differences across Regions
29
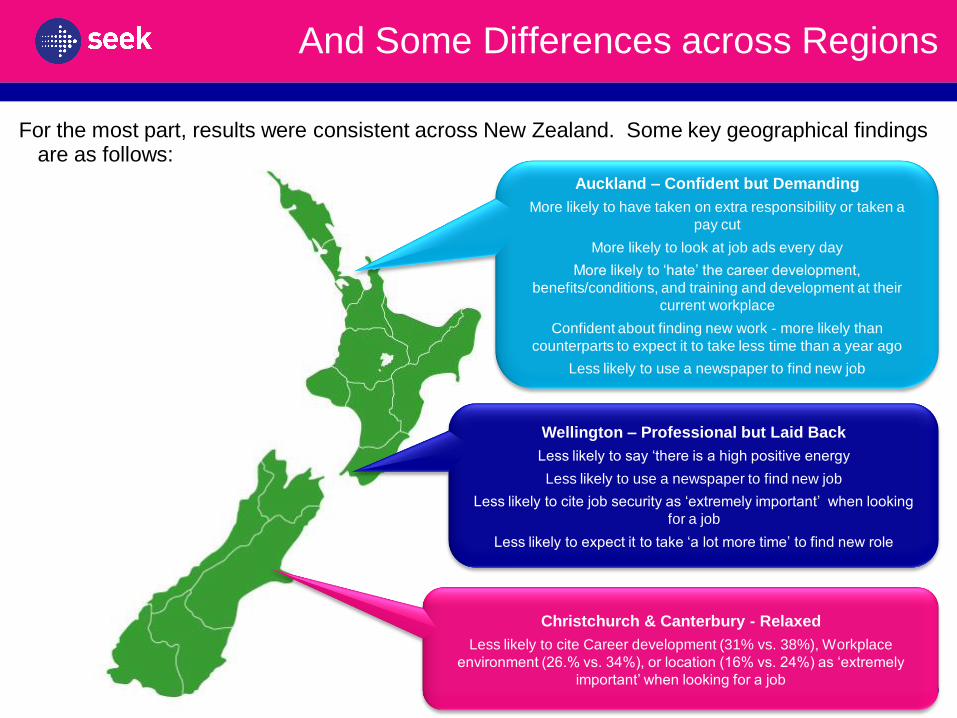
For the most part, results were consistent across New Zealand. Some key geographical findings are as follows:
Christchurch & Canterbury - Relaxed
Less likely to cite Career development (31% vs. 38%), Workplace
environment (26.% vs. 34%), or location (16% vs. 24%) as ‘extremely
important’ when looking for a job
Wellington – Professional but Laid Back
Less likely to say ‘there is a high positive energy
Less likely to use a newspaper to find new job
Less likely to cite job security as ‘extremely important’ when looking
for a job
Less likely to expect it to take ‘a lot more time’ to find new role
Auckland – Confident but Demanding
More likely to have taken on extra responsibility or taken a
pay cut
More likely to look at job ads every day
More likely to ‘hate’ the career development,
benefits/conditions, and training and development at their
current workplace
Confident about finding new work - more likely than
counterparts to expect it to take less time than a year ago
Less likely to use a newspaper to find new job
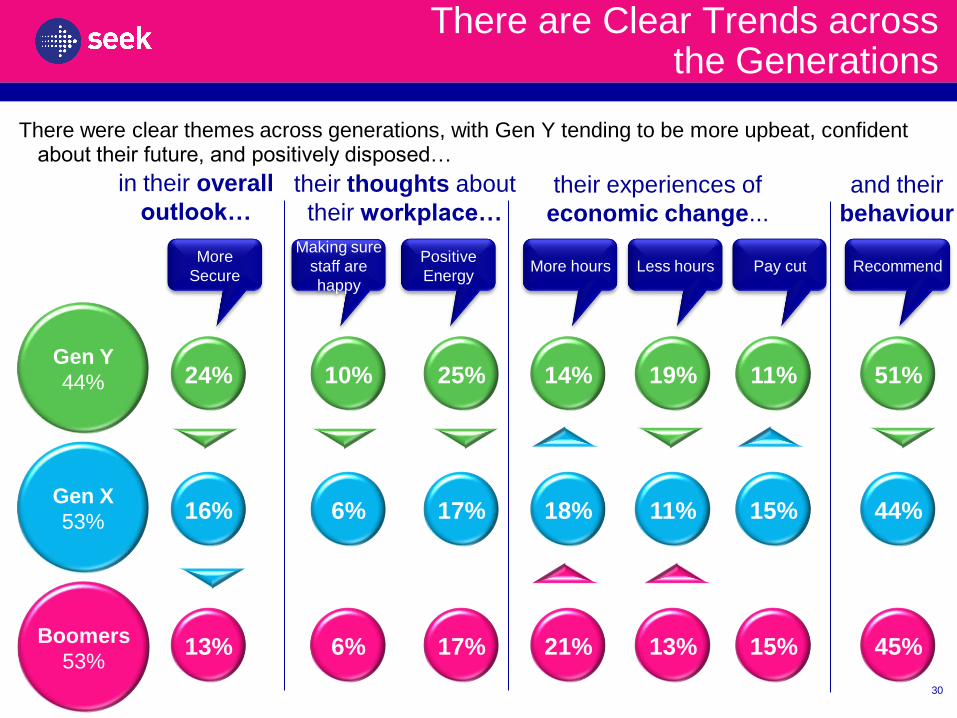
There are Clear Trends acrossthe Generations
There were clear themes across generations, with Gen Y tending to be more upbeat, confident about their future, and positively disposed…
30
Gen X
53%
Gen Y
44%
13%
16%
6%
6%
17%
17%
in their overall
outlook…their thoughts about
their workplace…
Boomers
53%
24% 10% 25%
More
Secure
their experiences of
economic change...
Making sure
staff are
happy
21%
18%
14%
More hours
13%
11%
19%
Less hours
15%
15%
11%
Pay cutPositive
Energy
45%
44%
51%
Recommend
and their
behaviour
Further Analysis
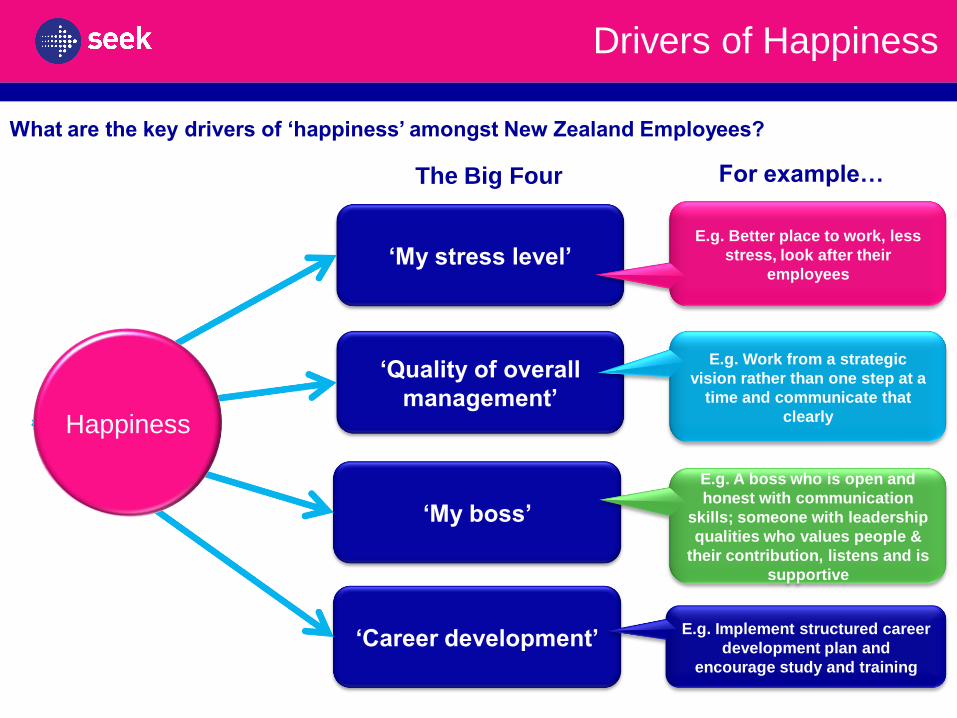
Drivers of Happiness
What are the key drivers of ‘happiness’ amongst New Zealand Employees?
‘My stress level’
‘Quality of overall
management’
‘My boss’
‘Career development’
Happiness
The Big Four For example…
E.g. Better place to work, less
stress, look after their
employees
E.g. Implement structured career
development plan and
encourage study and training
E.g. A boss who is open and
honest with communication
skills; someone with leadership
qualities who values people &
their contribution, listens and is
supportive
E.g. Work from a strategic
vision rather than one step at a
time and communicate that
clearly
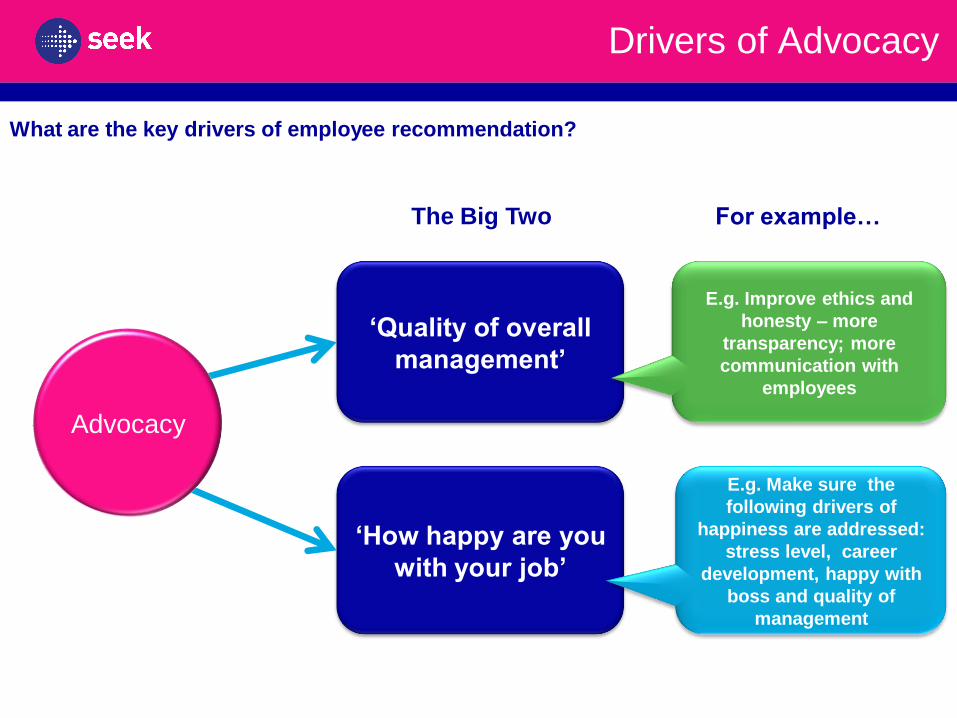
Drivers of Advocacy
What are the key drivers of employee recommendation?
‘Quality of overall
management’
‘How happy are you
with your job’
Advocacy
The Big Two For example…
E.g. Improve ethics and
honesty – more
transparency; more
communication with
employees
E.g. Make sure the
following drivers of
happiness are addressed:
stress level, career
development, happy with
boss and quality of
management
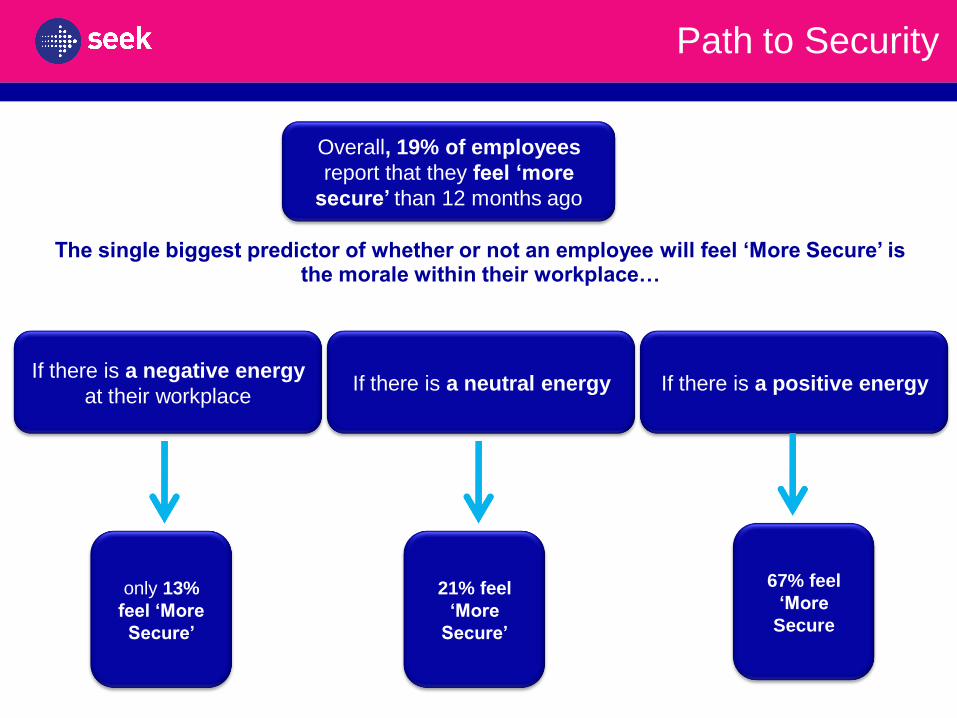
Path to Security
Overall, 19% of employees
report that they feel ‘more
secure’ than 12 months ago
The single biggest predictor of whether or not an employee will feel ‘More Secure’ is the morale within their workplace…
only 13%
feel ‘More
Secure’
If there is a negative energy
at their workplaceIf there is a neutral energy If there is a positive energy
21% feel
‘More
Secure’
67% feel
‘More
Secure
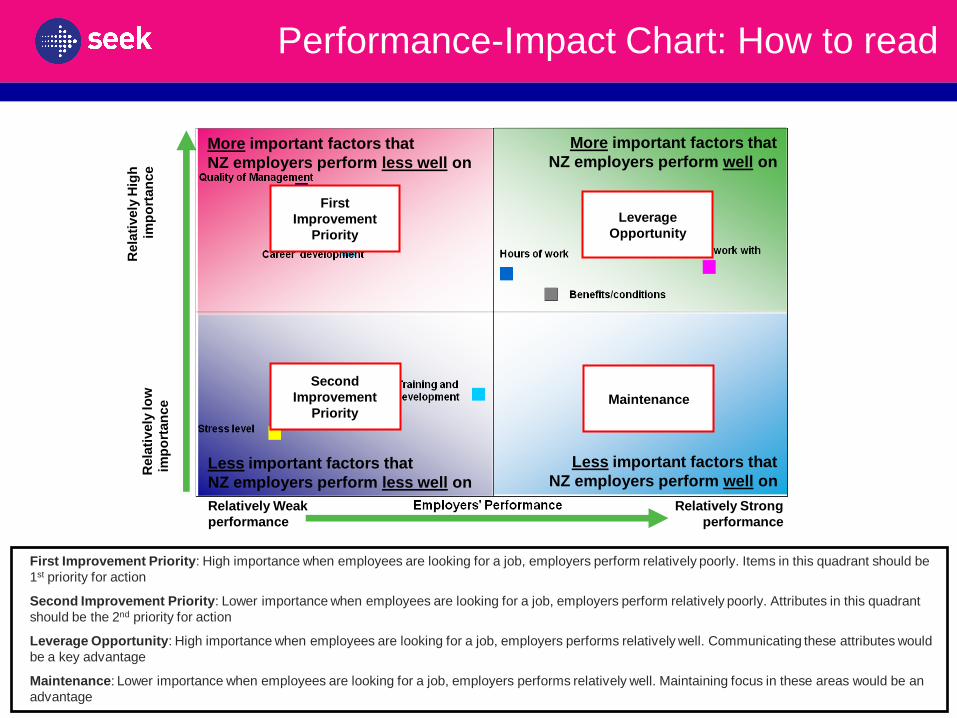
Performance-Impact Chart: How to read
Less important factors that
NZ employers perform well onLess important factors that
NZ employers perform less well on
More important factors that
NZ employers perform well onMore important factors that
NZ employers perform less well on
Rela
tively
Hig
h
imp
ort
an
ce
Rela
tively
lo
w
imp
ort
an
ce
Relatively Strong
performance
Relatively Weak
performance
Second
Improvement
Priority
First
Improvement
Priority
Leverage
Opportunity
Maintenance
First Improvement Priority: High importance when employees are looking for a job, employers perform relatively poorly. Items in this quadrant should be
1st priority for action
Second Improvement Priority: Lower importance when employees are looking for a job, employers perform relatively poorly. Attributes in this quadrant
should be the 2nd priority for action
Leverage Opportunity: High importance when employees are looking for a job, employers performs relatively well. Communicating these attributes would
be a key advantage
Maintenance: Lower importance when employees are looking for a job, employers performs relatively well. Maintaining focus in these areas would be an
advantage
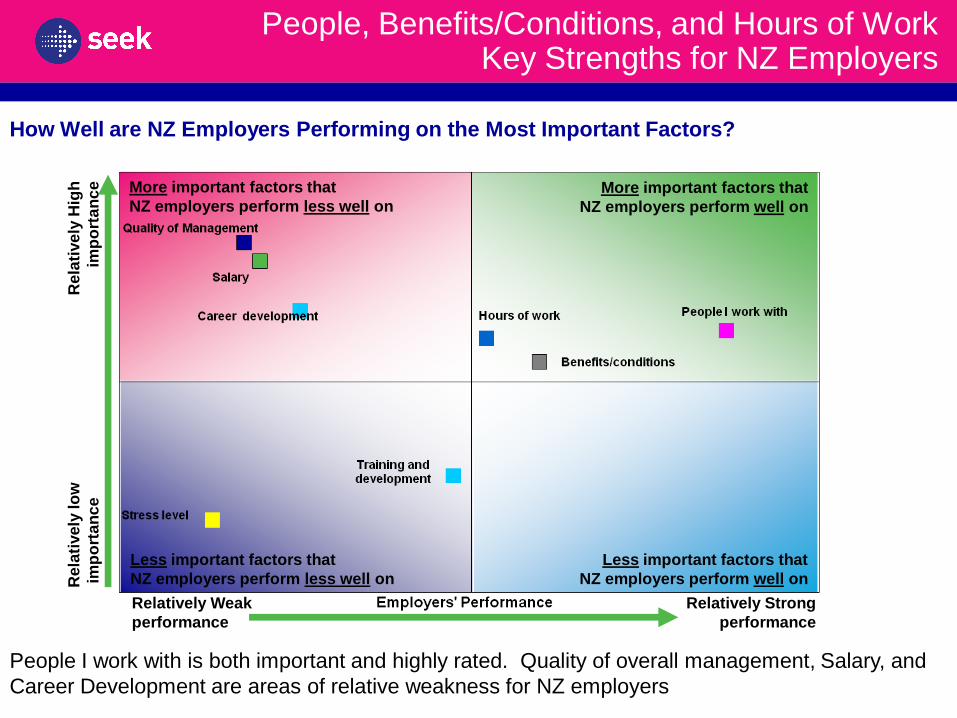
People, Benefits/Conditions, and Hours of WorkKey Strengths for NZ Employers
People I work with is both important and highly rated. Quality of overall management, Salary, and
Career Development are areas of relative weakness for NZ employers
Less important factors that
NZ employers perform well on
Less important factors that
NZ employers perform less well on
More important factors that
NZ employers perform well on
More important factors that
NZ employers perform less well on
Re
lati
ve
ly H
igh
imp
ort
an
ce
Re
lati
ve
ly lo
w
imp
ort
an
ce
Relatively Strong
performance
Relatively Weak
performance
How Well are NZ Employers Performing on the Most Important Factors?
Key Insights And
Recommendations
Key Insights & Recommendations
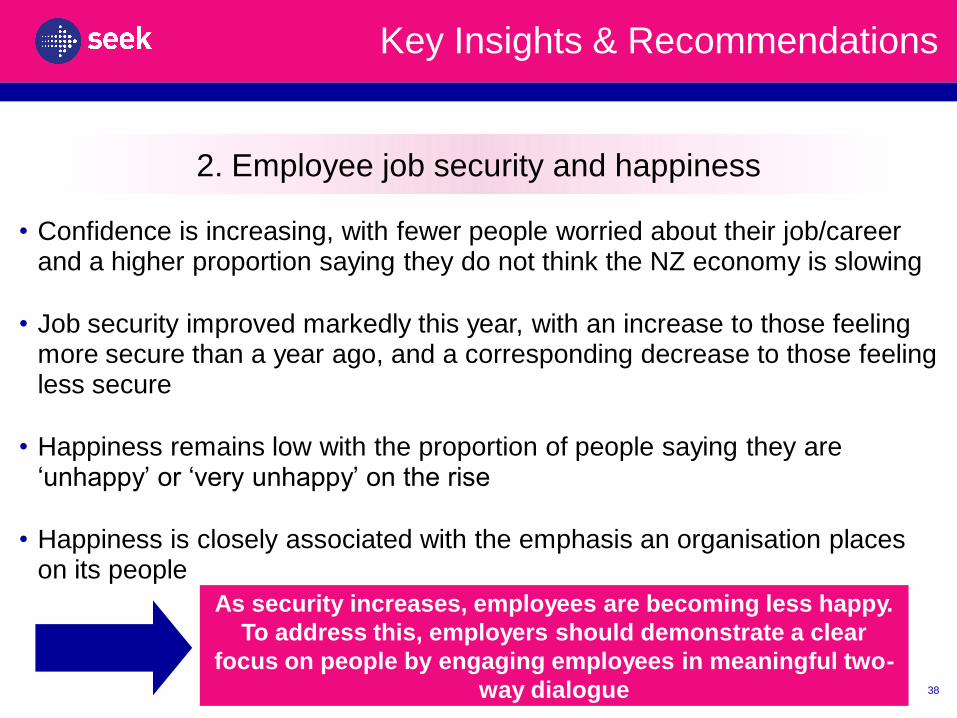
2. Employee job security and happiness
38
• Confidence is increasing, with fewer people worried about their job/career and a higher proportion saying they do not think the NZ economy is slowing
• Job security improved markedly this year, with an increase to those feeling more secure than a year ago, and a corresponding decrease to those feeling less secure
• Happiness remains low with the proportion of people saying they are ‘unhappy’ or ‘very unhappy’ on the rise
• Happiness is closely associated with the emphasis an organisation places on its people
As security increases, employees are becoming less happy.
To address this, employers should demonstrate a clear
focus on people by engaging employees in meaningful two-
way dialogue
Key Insights & Recommendations
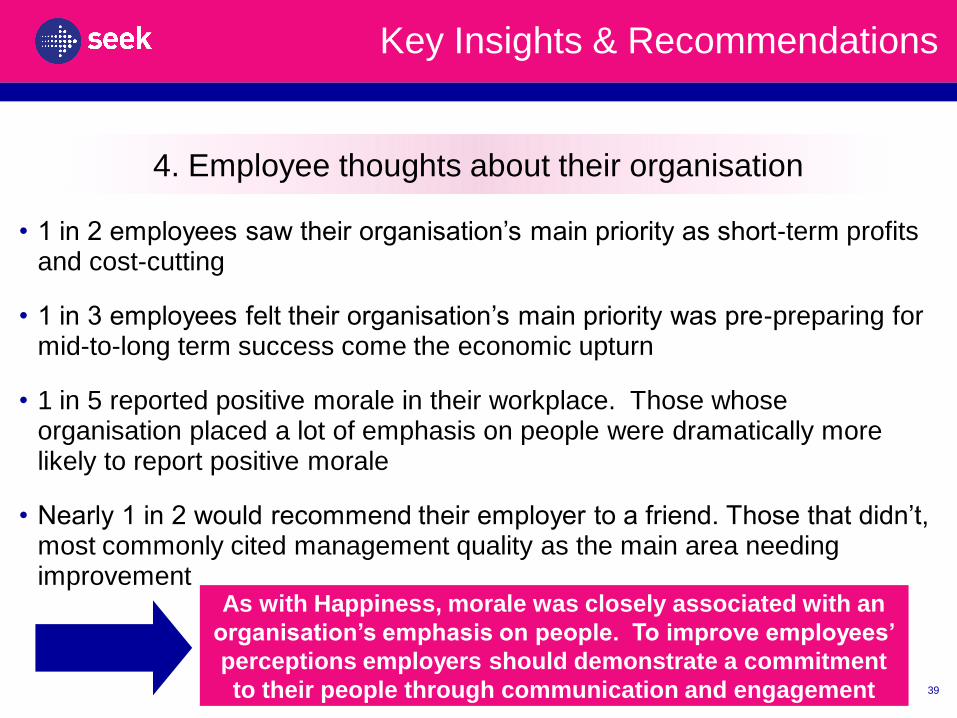
4. Employee thoughts about their organisation
39
• 1 in 2 employees saw their organisation’s main priority as short-term profits and cost-cutting
• 1 in 3 employees felt their organisation’s main priority was pre-preparing for mid-to-long term success come the economic upturn
• 1 in 5 reported positive morale in their workplace. Those whose organisation placed a lot of emphasis on people were dramatically more likely to report positive morale
• Nearly 1 in 2 would recommend their employer to a friend. Those that didn’t, most commonly cited management quality as the main area needing improvement
As with Happiness, morale was closely associated with an
organisation’s emphasis on people. To improve employees’
perceptions employers should demonstrate a commitment
to their people through communication and engagement
Key Insights & Recommendations
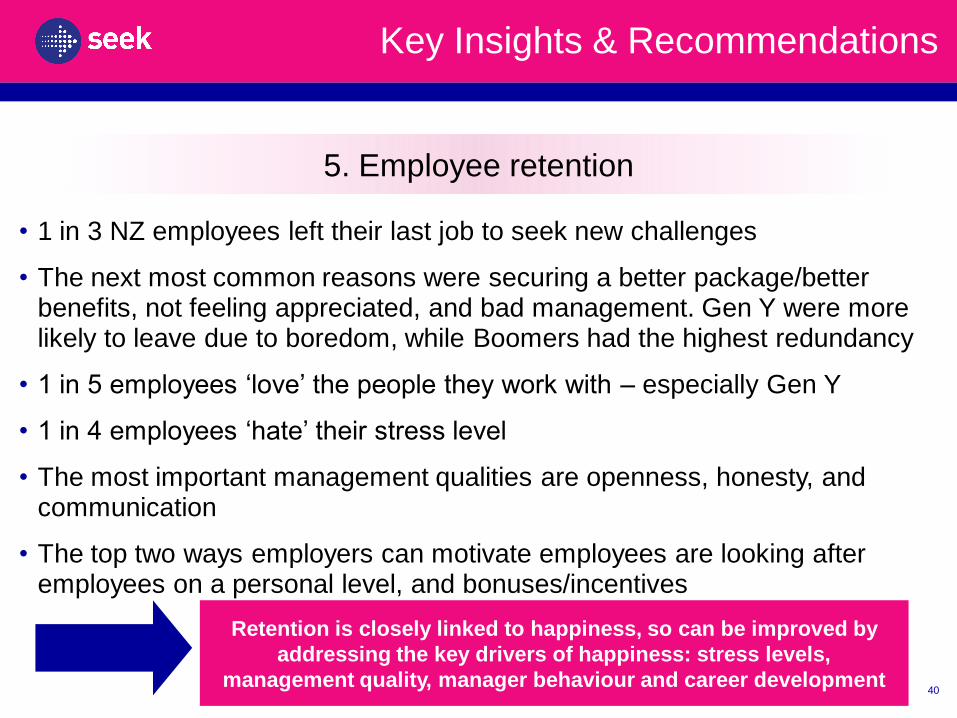
5. Employee retention
40
• 1 in 3 NZ employees left their last job to seek new challenges
• The next most common reasons were securing a better package/better benefits, not feeling appreciated, and bad management. Gen Y were more likely to leave due to boredom, while Boomers had the highest redundancy
• 1 in 5 employees ‘love’ the people they work with – especially Gen Y
• 1 in 4 employees ‘hate’ their stress level
• The most important management qualities are openness, honesty, and communication
• The top two ways employers can motivate employees are looking after employees on a personal level, and bonuses/incentives
Retention is closely linked to happiness, so can be improved by
addressing the key drivers of happiness: stress levels,
management quality, manager behaviour and career development
Key Insights & Recommendations
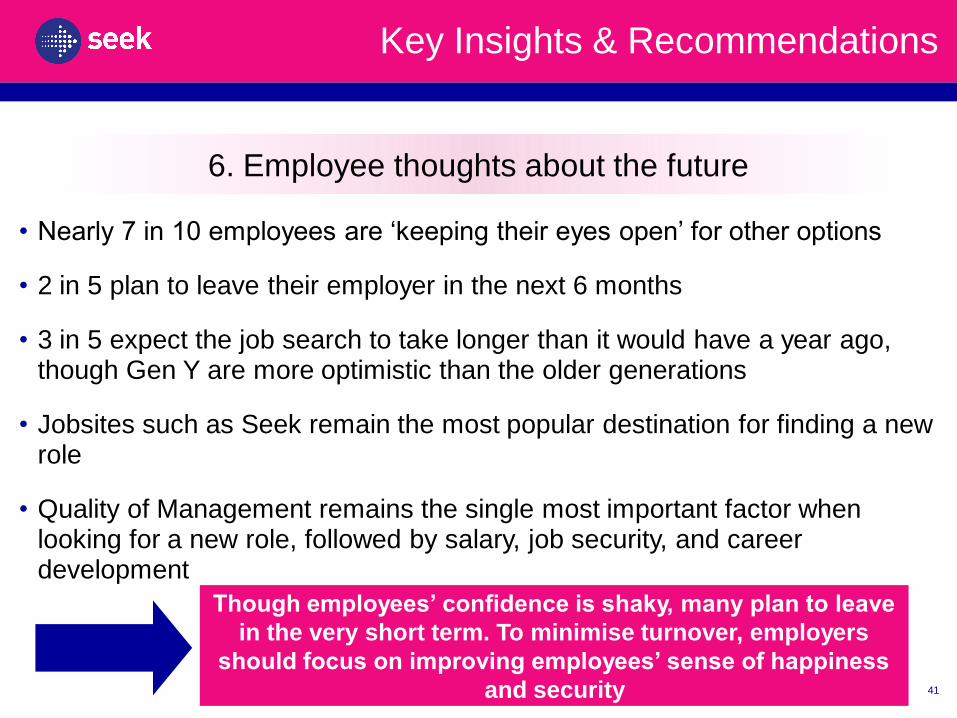
6. Employee thoughts about the future
41
• Nearly 7 in 10 employees are ‘keeping their eyes open’ for other options
• 2 in 5 plan to leave their employer in the next 6 months
• 3 in 5 expect the job search to take longer than it would have a year ago, though Gen Y are more optimistic than the older generations
• Jobsites such as Seek remain the most popular destination for finding a new role
• Quality of Management remains the single most important factor when looking for a new role, followed by salary, job security, and career development
Though employees’ confidence is shaky, many plan to leave
in the very short term. To minimise turnover, employers
should focus on improving employees’ sense of happiness
and security
Thank you!
Appendix
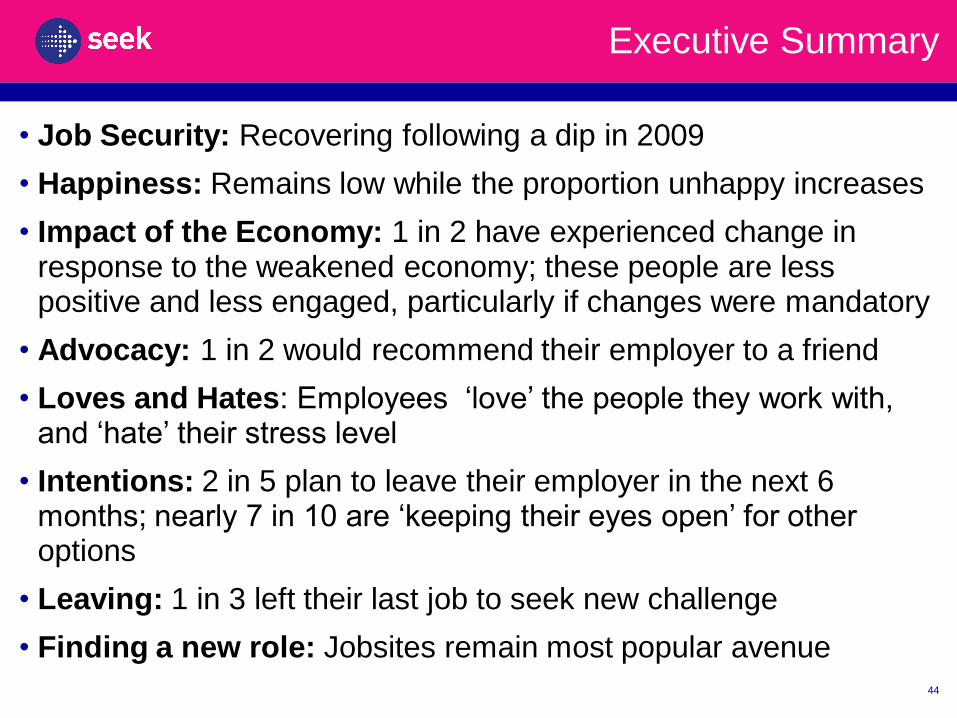
Executive Summary
44
• Job Security: Recovering following a dip in 2009
• Happiness: Remains low while the proportion unhappy increases
• Impact of the Economy: 1 in 2 have experienced change in response to the weakened economy; these people are less positive and less engaged, particularly if changes were mandatory
• Advocacy: 1 in 2 would recommend their employer to a friend
• Loves and Hates: Employees ‘love’ the people they work with, and ‘hate’ their stress level
• Intentions: 2 in 5 plan to leave their employer in the next 6 months; nearly 7 in 10 are ‘keeping their eyes open’ for other options
• Leaving: 1 in 3 left their last job to seek new challenge
• Finding a new role: Jobsites remain most popular avenue
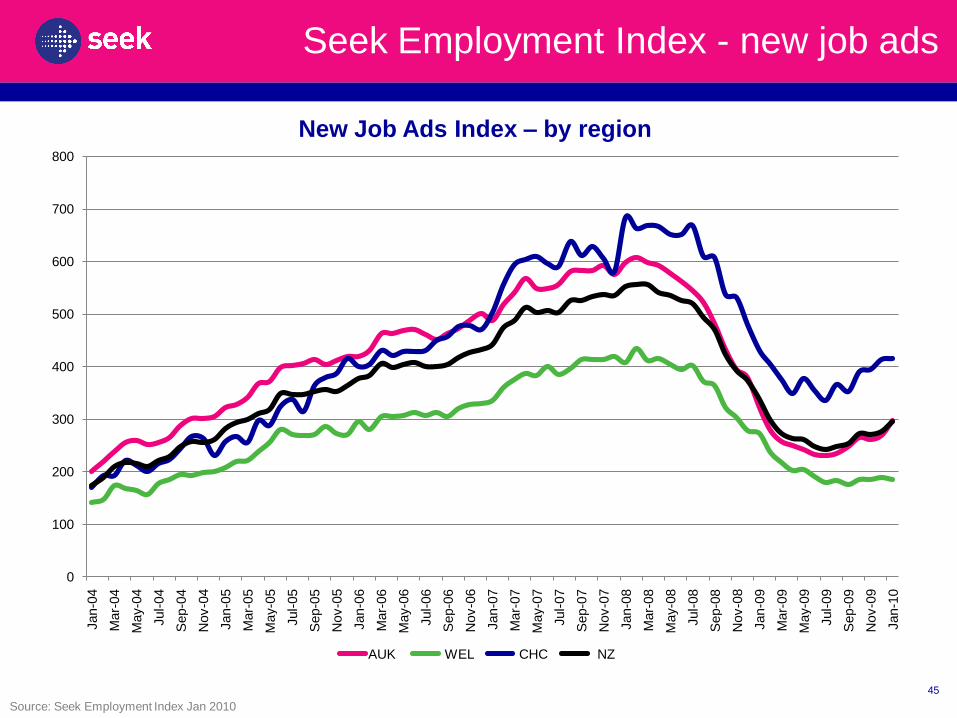
Seek Employment Index - new job ads
45
0
100
200
300
400
500
600
700
800
Jan-0
4
Mar-
04
May-0
4
Jul-
04
Sep-0
4
Nov-0
4
Jan-0
5
Mar-
05
May-0
5
Jul-
05
Sep-0
5
Nov-0
5
Jan-0
6
Mar-
06
May-0
6
Jul-
06
Sep-0
6
Nov-0
6
Jan-0
7
Mar-
07
May-0
7
Jul-
07
Sep-0
7
Nov-0
7
Jan-0
8
Mar-
08
May-0
8
Jul-
08
Sep-0
8
Nov-0
8
Jan-0
9
Mar-
09
May-0
9
Jul-
09
Sep-0
9
Nov-0
9
Jan-1
0
New Job Ads Index – by region
AUK WEL CHC NZ
Source: Seek Employment Index Jan 2010
Key Insights & Recommendations
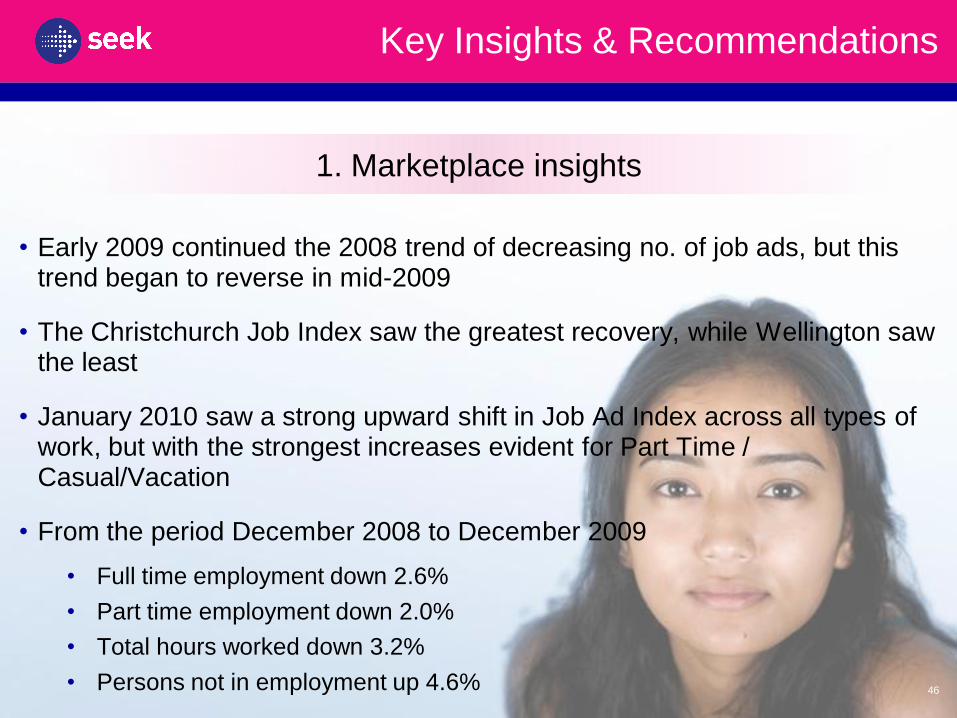
• Early 2009 continued the 2008 trend of decreasing no. of job ads, but this trend began to reverse in mid-2009
• The Christchurch Job Index saw the greatest recovery, while Wellington saw the least
• January 2010 saw a strong upward shift in Job Ad Index across all types of work, but with the strongest increases evident for Part Time / Casual/Vacation
• From the period December 2008 to December 2009
• Full time employment down 2.6%
• Part time employment down 2.0%
• Total hours worked down 3.2%
• Persons not in employment up 4.6%
1. Marketplace insights
46
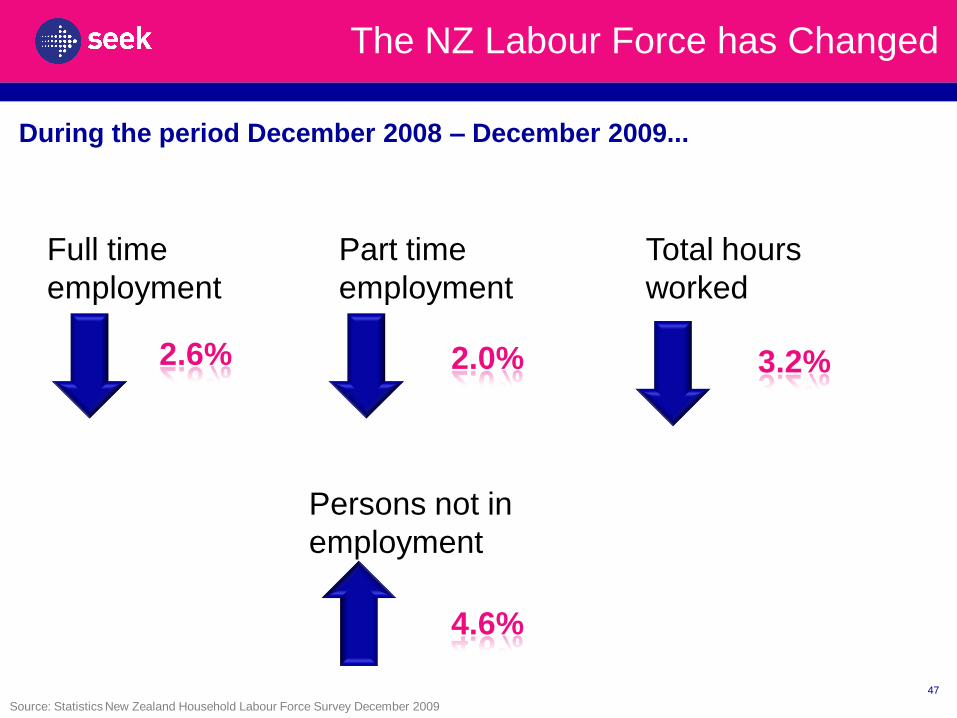
The NZ Labour Force has Changed
47
During the period December 2008 – December 2009...
Full time
employment
Part time
employment
Total hours
worked
Persons not in
employment
2.6% 3.2%2.0%
4.6%
Source: Statistics New Zealand Household Labour Force Survey December 2009
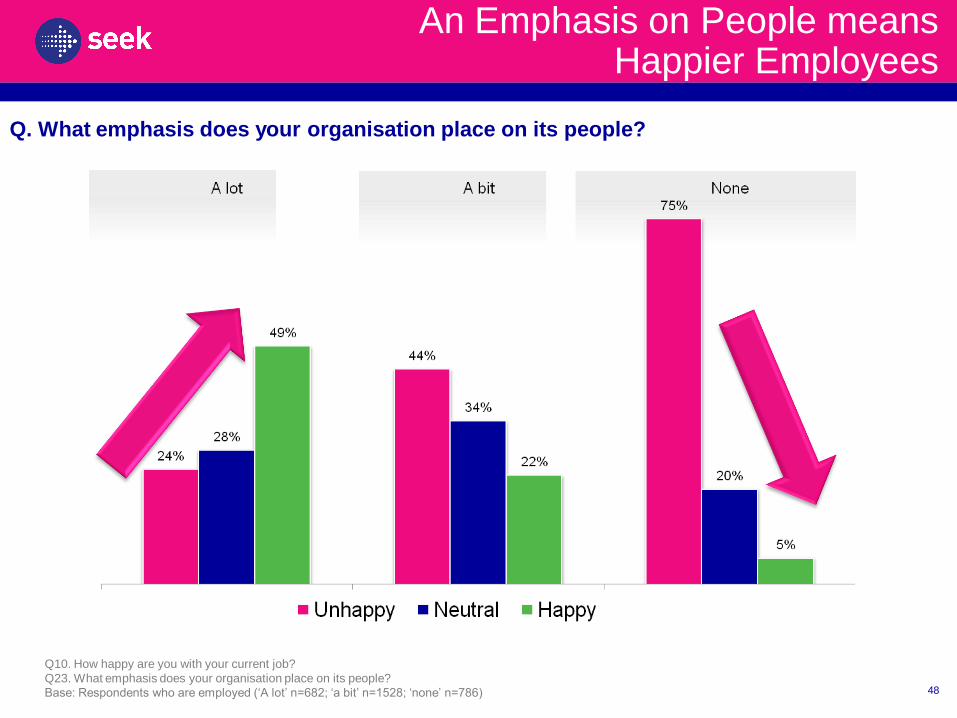
An Emphasis on People meansHappier Employees
Q10. How happy are you with your current job?
Q23. What emphasis does your organisation place on its people?
Base: Respondents who are employed (‘A lot’ n=682; ‘a bit’ n=1528; ‘none’ n=786) 48
Q. What emphasis does your organisation place on its people?
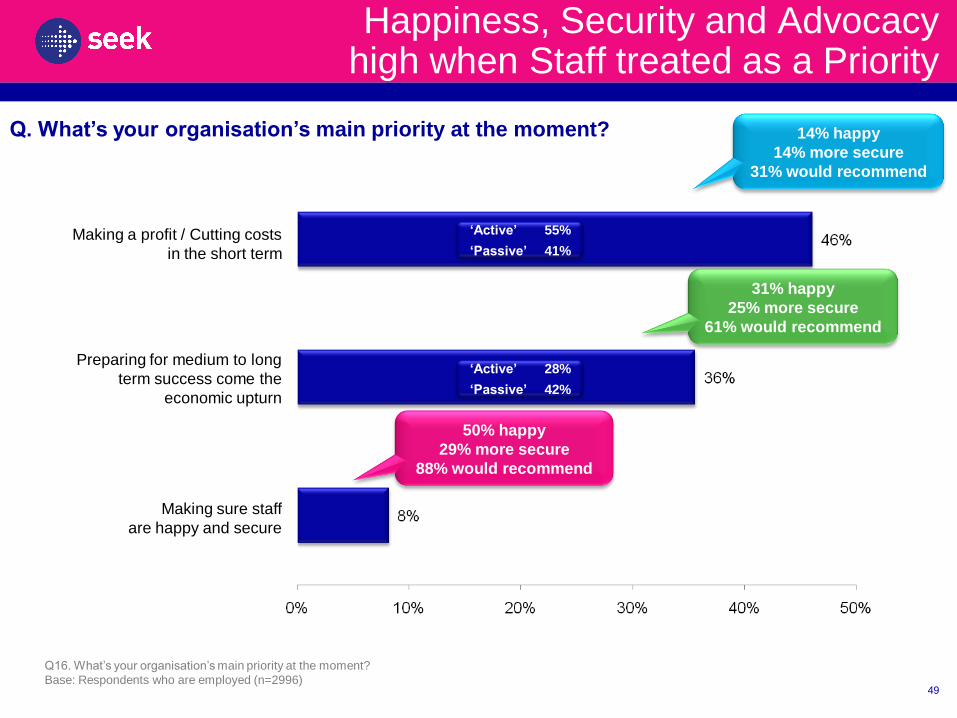
Happiness, Security and Advocacyhigh when Staff treated as a Priority
14% happy
14% more secure
31% would recommend
31% happy
25% more secure
61% would recommend
50% happy
29% more secure
88% would recommend
Q16. What’s your organisation’s main priority at the moment?
Base: Respondents who are employed (n=2996)
Making sure staff
are happy and secure
Preparing for medium to long
term success come the
economic upturn
Making a profit / Cutting costs
in the short term
49
Q. What’s your organisation’s main priority at the moment?
‘Active’ 55%
‘Passive’ 41%
‘Active’ 28%
‘Passive’ 42%
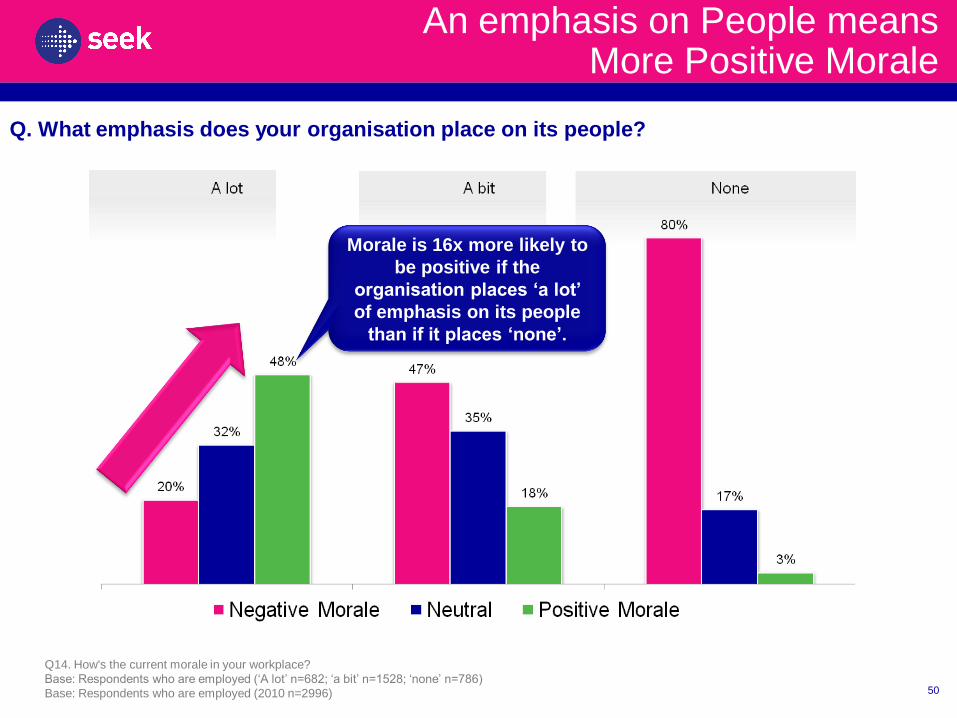
An emphasis on People meansMore Positive Morale
Q14. How's the current morale in your workplace?
Base: Respondents who are employed (‘A lot’ n=682; ‘a bit’ n=1528; ‘none’ n=786)
Base: Respondents who are employed (2010 n=2996) 50
Q. What emphasis does your organisation place on its people?
Morale is 16x more likely to
be positive if the
organisation places ‘a lot’
of emphasis on its people
than if it places ‘none’.
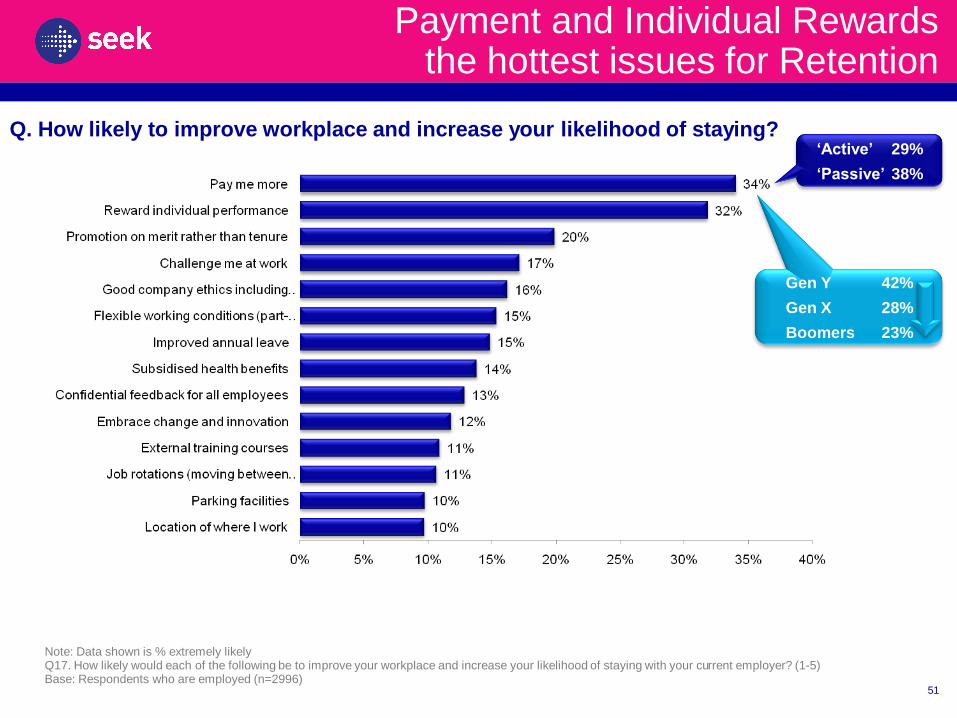
Payment and Individual Rewardsthe hottest issues for Retention
Note: Data shown is % extremely likelyQ17. How likely would each of the following be to improve your workplace and increase your likelihood of staying with your current employer? (1-5)Base: Respondents who are employed (n=2996)
51
Gen Y 42%
Gen X 28%
Boomers 23%
Q. How likely to improve workplace and increase your likelihood of staying?‘Active’ 29%
‘Passive’ 38%
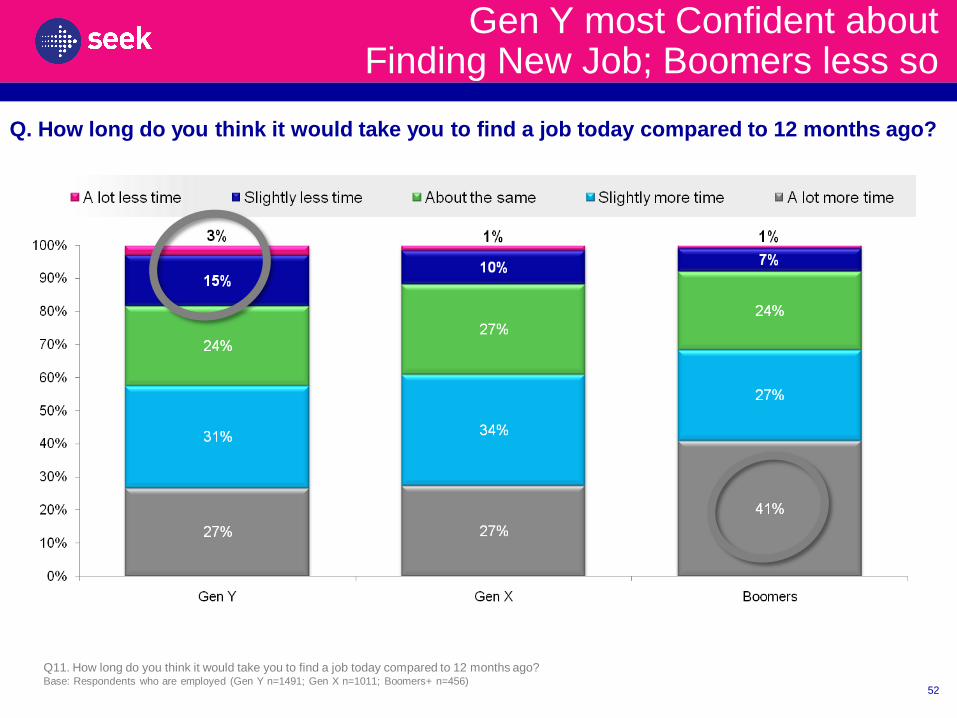
Gen Y most Confident about Finding New Job; Boomers less so
52
Q11. How long do you think it would take you to find a job today compared to 12 months ago? Base: Respondents who are employed (Gen Y n=1491; Gen X n=1011; Boomers+ n=456)
Q. How long do you think it would take you to find a job today compared to 12 months ago?
Economic Impact On Employees Over The Last 12 Months
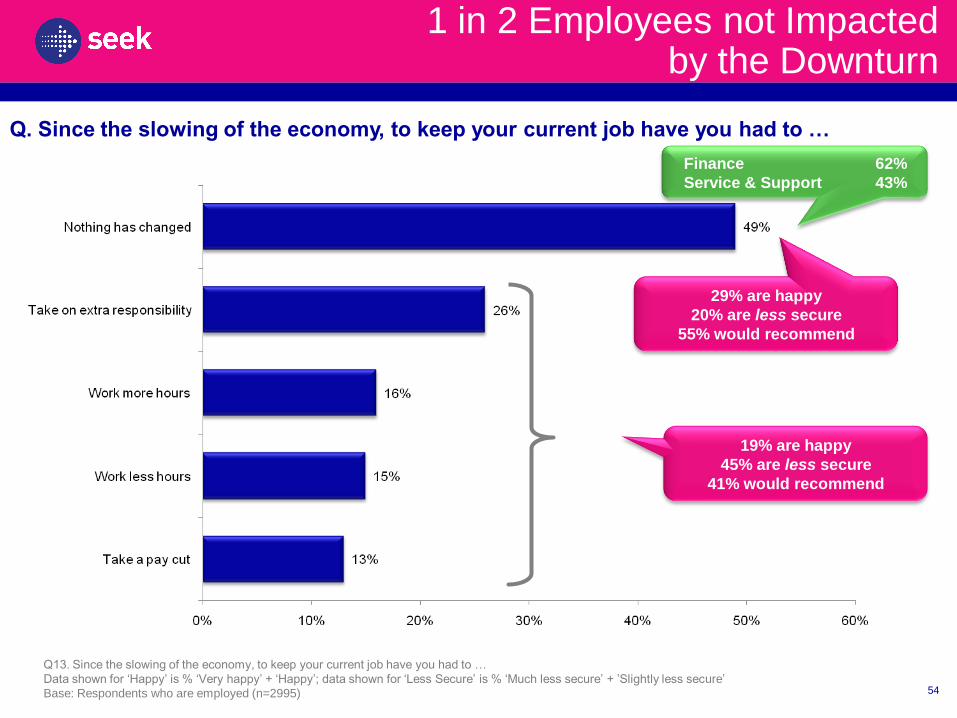
1 in 2 Employees not Impactedby the Downturn
Q13. Since the slowing of the economy, to keep your current job have you had to …
Data shown for ‘Happy’ is % ‘Very happy’ + ‘Happy’; data shown for ‘Less Secure’ is % ‘Much less secure’ + ’Slightly less secure’
Base: Respondents who are employed (n=2995)
29% are happy
20% are less secure
55% would recommend
54
19% are happy
45% are less secure
41% would recommend
Q. Since the slowing of the economy, to keep your current job have you had to …
Finance 62%
Service & Support 43%
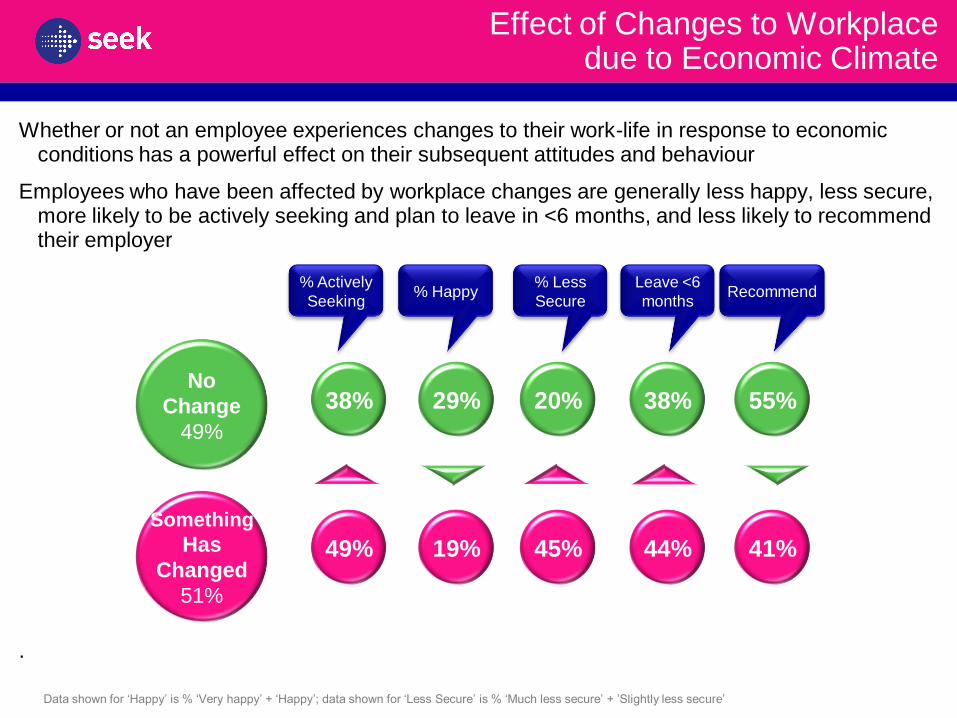
Effect of Changes to Workplace due to Economic Climate
Whether or not an employee experiences changes to their work-life in response to economic conditions has a powerful effect on their subsequent attitudes and behaviour
Employees who have been affected by workplace changes are generally less happy, less secure, more likely to be actively seeking and plan to leave in <6 months, and less likely to recommend their employer
49%
38%
19%
29%
% Happy
45%
20%
% Less
Secure
44%
38%
Leave <6
months
% Actively
Seeking
41%
55%
Recommend
Something
Has
Changed
51%
No
Change
49%
.
Data shown for ‘Happy’ is % ‘Very happy’ + ‘Happy’; data shown for ‘Less Secure’ is % ‘Much less secure’ + ’Slightly less secure’
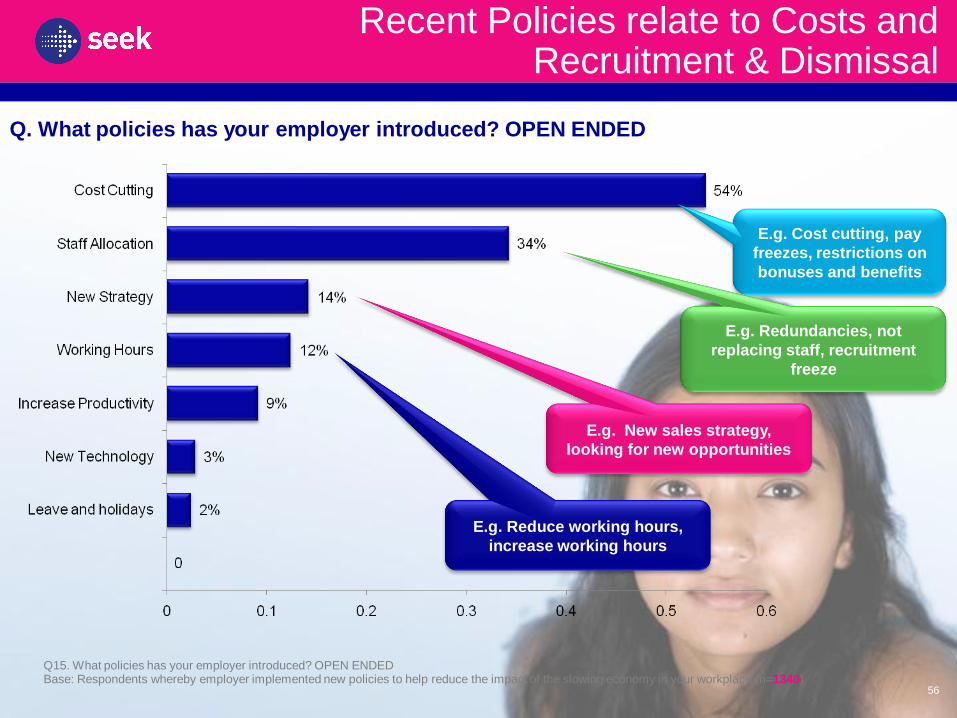
Recent Policies relate to Costs and Recruitment & Dismissal
Q15. What policies has your employer introduced? OPEN ENDEDBase: Respondents whereby employer implemented new policies to help reduce the impact of the slowing economy in your workplace (n=1340)
E.g. Cost cutting, pay
freezes, restrictions on
bonuses and benefits
E.g. Redundancies, not
replacing staff, recruitment
freeze
E.g. Reduce working hours,
increase working hours
56
Q. What policies has your employer introduced? OPEN ENDED
E.g. New sales strategy,
looking for new opportunities
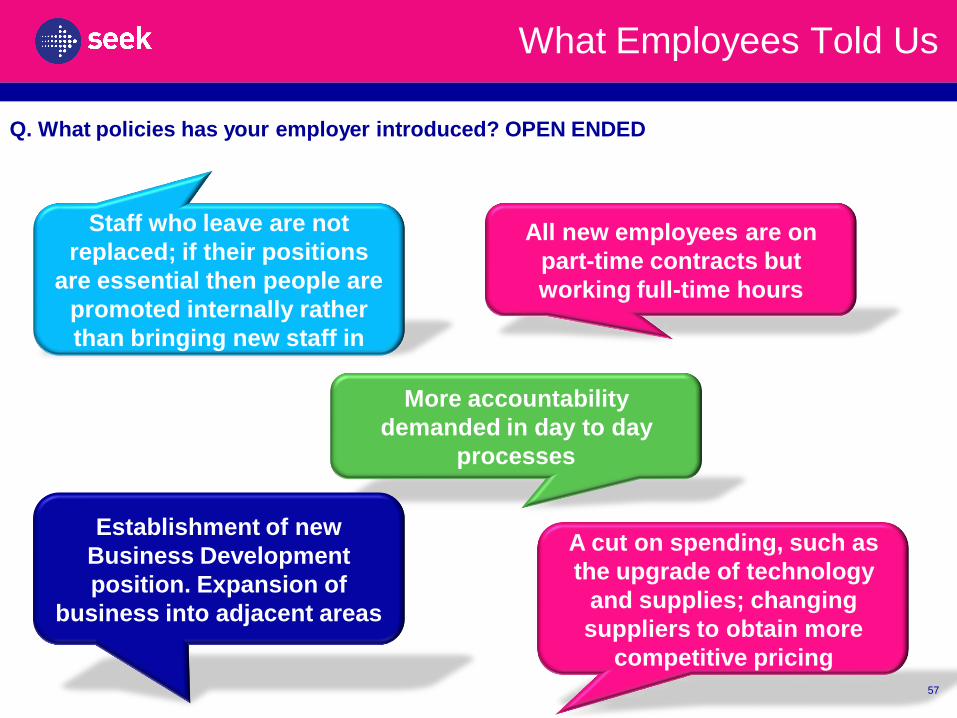
What Employees Told Us
All new employees are on
part-time contracts but
working full-time hours
Staff who leave are not
replaced; if their positions
are essential then people are
promoted internally rather
than bringing new staff in
More accountability
demanded in day to day
processes
Establishment of new
Business Development
position. Expansion of
business into adjacent areas
A cut on spending, such as
the upgrade of technology
and supplies; changing
suppliers to obtain more
competitive pricing
57
Q. What policies has your employer introduced? OPEN ENDED
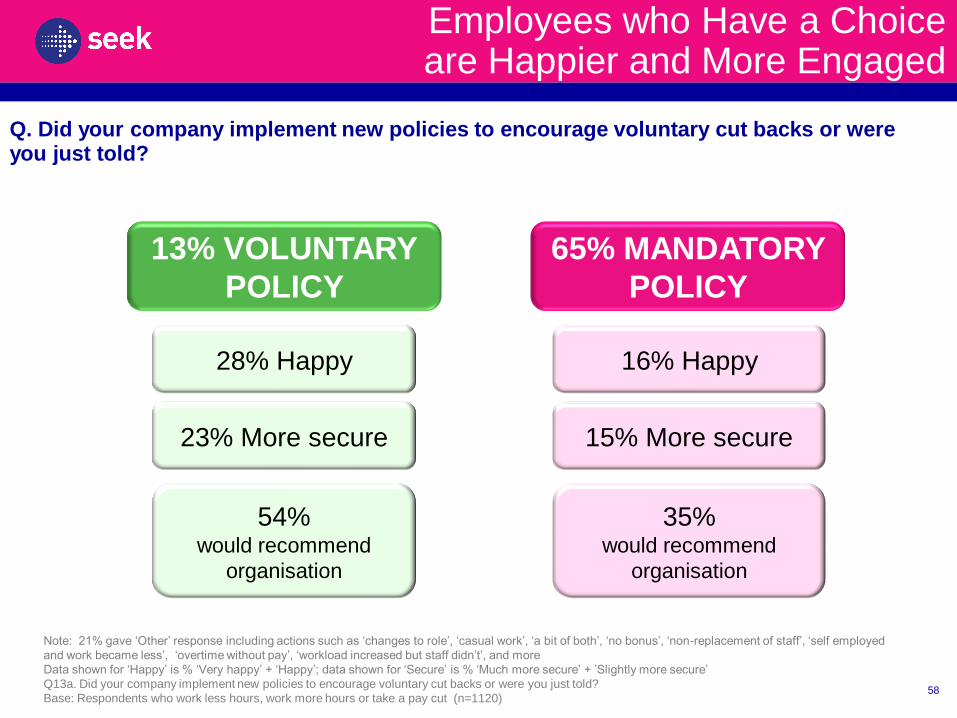
Employees who Have a Choice are Happier and More Engaged
Note: 21% gave ‘Other’ response including actions such as ‘changes to role’, ‘casual work’, ‘a bit of both’, ‘no bonus’, ‘non-replacement of staff’, ‘self employed
and work became less’, ‘overtime without pay’, ‘workload increased but staff didn’t’, and more
Data shown for ‘Happy’ is % ‘Very happy’ + ‘Happy’; data shown for ‘Secure’ is % ‘Much more secure’ + ’Slightly more secure’
Q13a. Did your company implement new policies to encourage voluntary cut backs or were you just told?
Base: Respondents who work less hours, work more hours or take a pay cut (n=1120)
13% VOLUNTARY
POLICY
28% Happy
23% More secure
54% would recommend
organisation
65% MANDATORY
POLICY
16% Happy
15% More secure
35% would recommend
organisation
58
Q. Did your company implement new policies to encourage voluntary cut backs or were you just told?
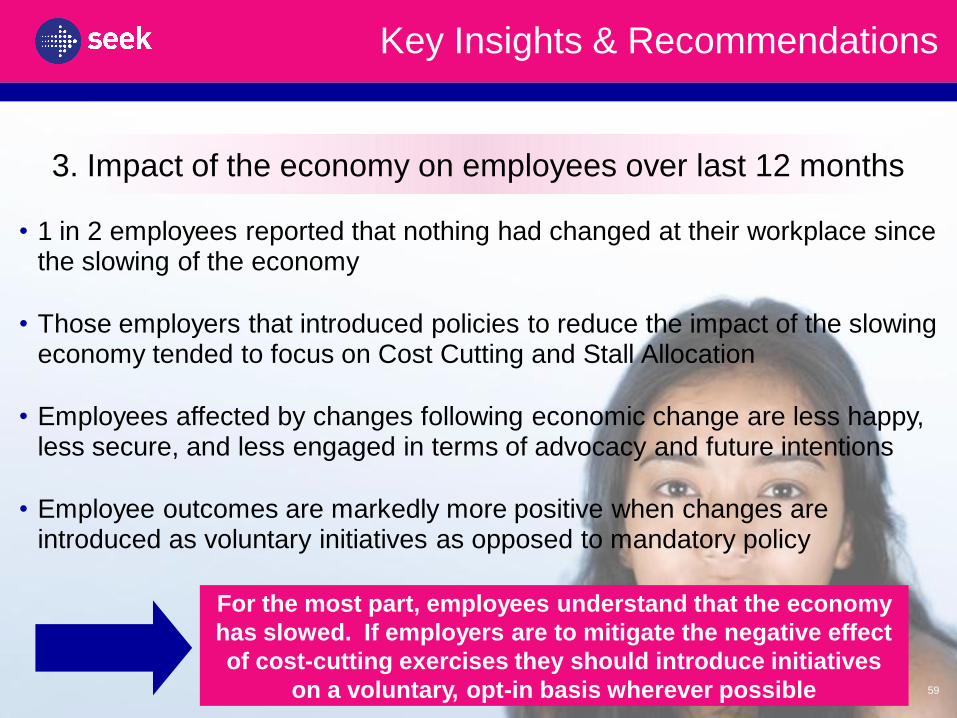
Key Insights & Recommendations
3. Impact of the economy on employees over last 12 months
59
• 1 in 2 employees reported that nothing had changed at their workplace since the slowing of the economy
• Those employers that introduced policies to reduce the impact of the slowing economy tended to focus on Cost Cutting and Stall Allocation
• Employees affected by changes following economic change are less happy, less secure, and less engaged in terms of advocacy and future intentions
• Employee outcomes are markedly more positive when changes are introduced as voluntary initiatives as opposed to mandatory policy
For the most part, employees understand that the economy
has slowed. If employers are to mitigate the negative effect
of cost-cutting exercises they should introduce initiatives
on a voluntary, opt-in basis wherever possible
Appendix
Sample and Methodology
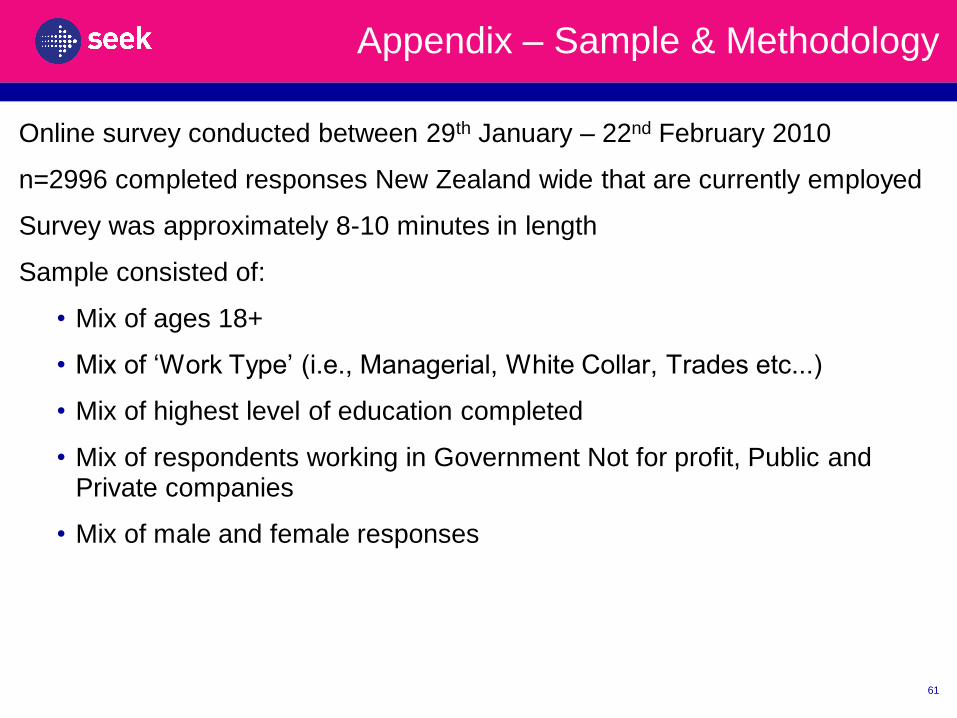
Appendix – Sample & Methodology
Online survey conducted between 29th January – 22nd February 2010
n=2996 completed responses New Zealand wide that are currently employed
Survey was approximately 8-10 minutes in length
Sample consisted of:
• Mix of ages 18+
• Mix of ‘Work Type’ (i.e., Managerial, White Collar, Trades etc...)
• Mix of highest level of education completed
• Mix of respondents working in Government Not for profit, Public and Private companies
• Mix of male and female responses
61
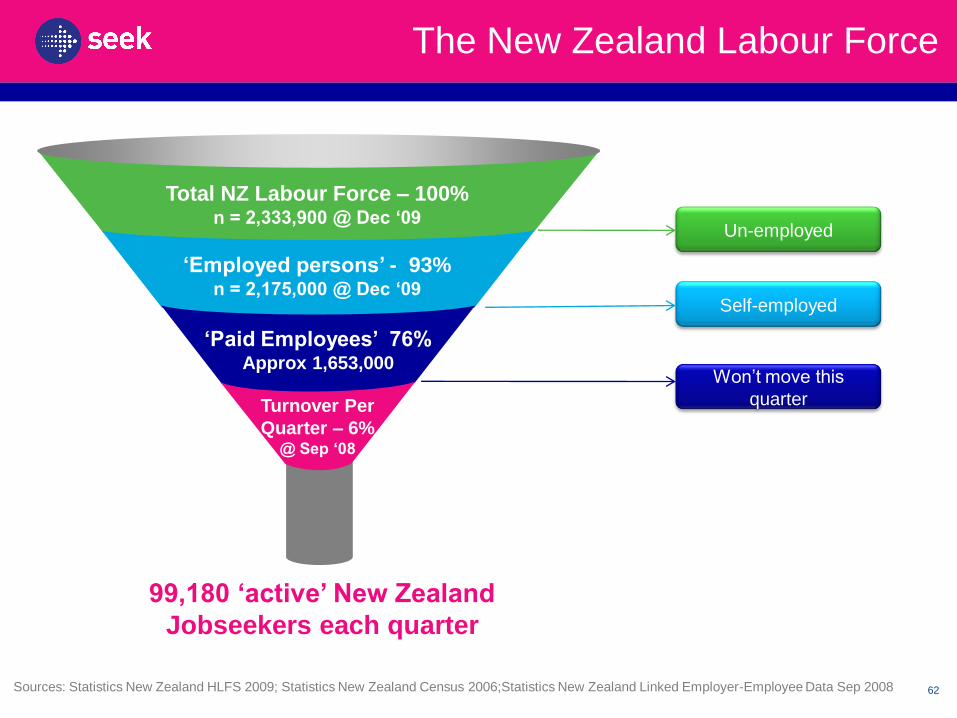
The New Zealand Labour Force
62
Total NZ Labour Force – 100%n = 2,333,900 @ Dec ‘09
Un-employed
Self-employed
Won’t move this
quarter
99,180 ‘active’ New Zealand
Jobseekers each quarter
Sources: Statistics New Zealand HLFS 2009; Statistics New Zealand Census 2006;Statistics New Zealand Linked Employer-Employee Data Sep 2008
Turnover Per
Quarter – 6%@ Sep ‘08
‘Employed persons’ - 93%n = 2,175,000 @ Dec ‘09
‘Paid Employees’ 76%Approx 1,653,000
Respondent Profile
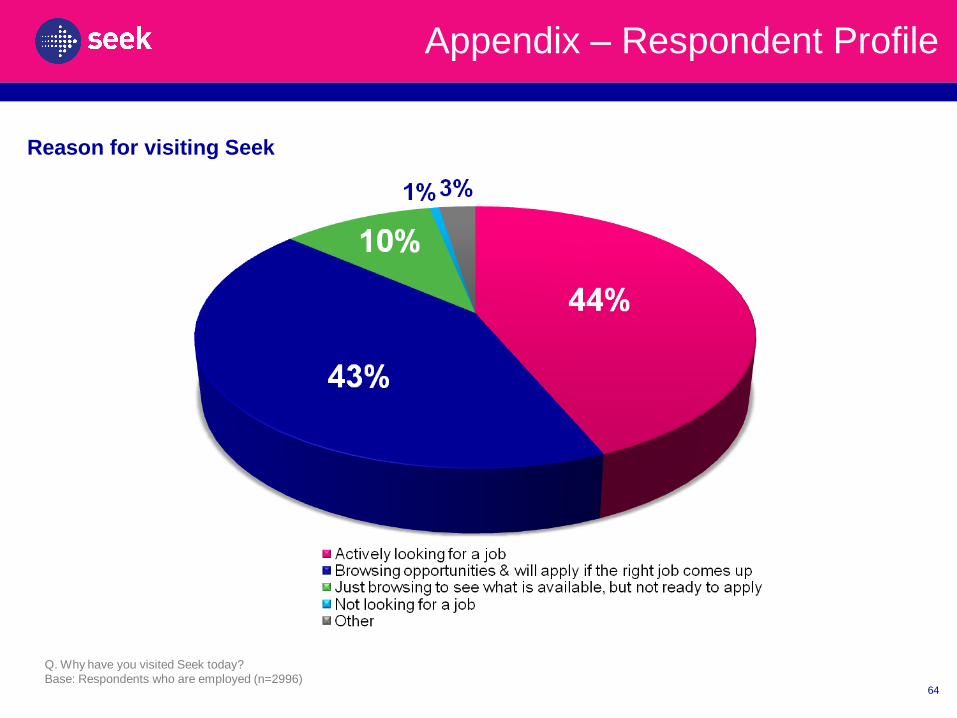
Appendix – Respondent Profile
Q. Why have you visited Seek today?
Base: Respondents who are employed (n=2996)64
Reason for visiting Seek
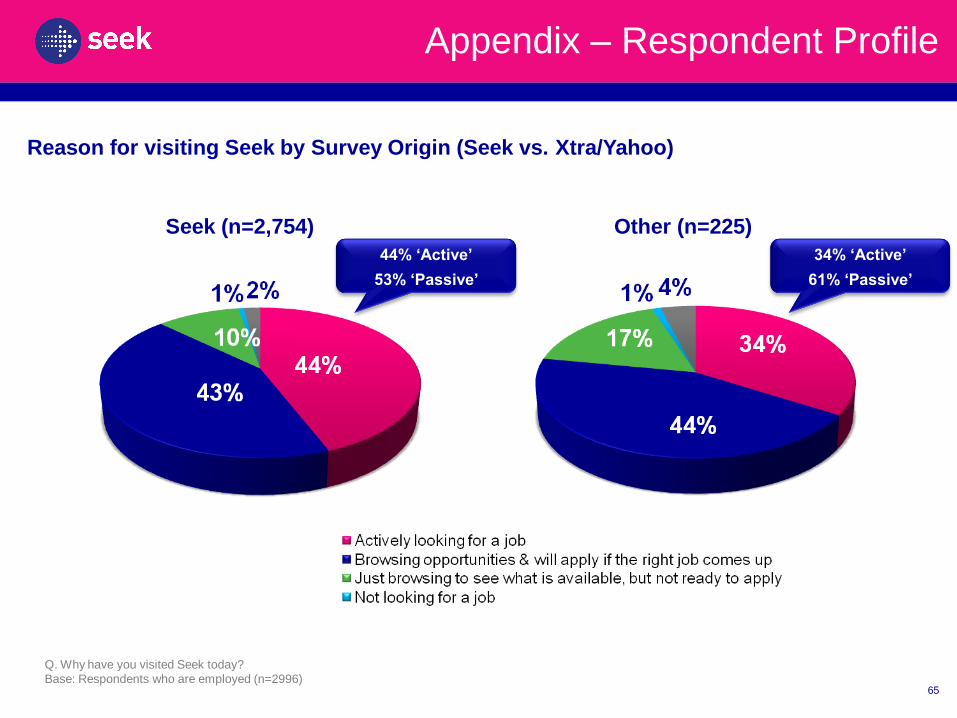
Appendix – Respondent Profile
Q. Why have you visited Seek today?
Base: Respondents who are employed (n=2996)65
Reason for visiting Seek by Survey Origin (Seek vs. Xtra/Yahoo)
Seek (n=2,754) Other (n=225)
44% ‘Active’
53% ‘Passive’
34% ‘Active’
61% ‘Passive’
Appendix – Respondent Profile
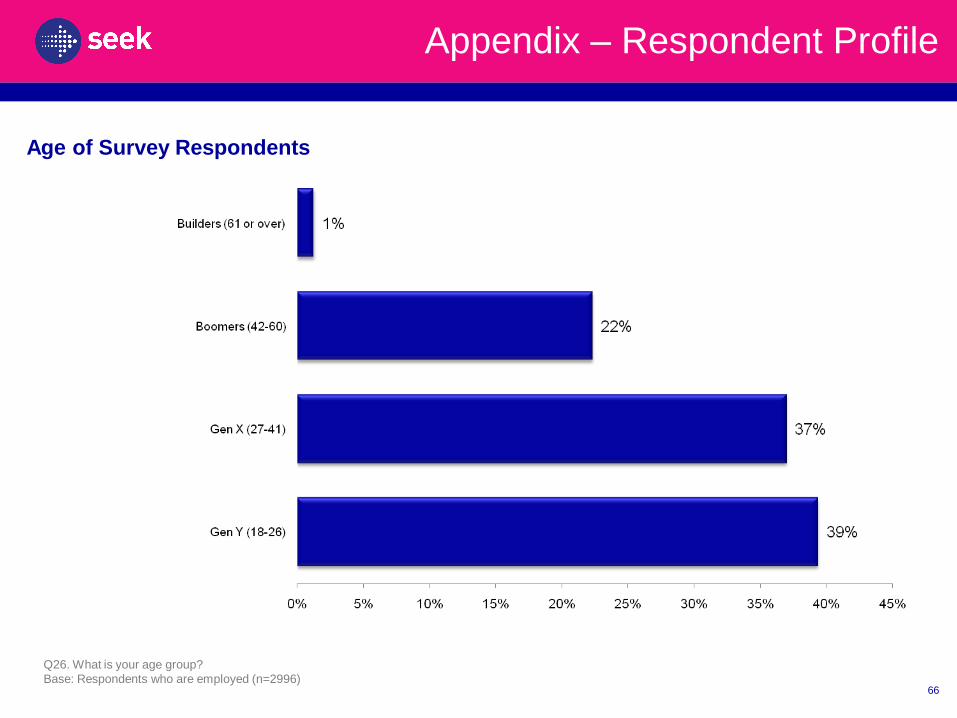
Q26. What is your age group?
Base: Respondents who are employed (n=2996)66
Age of Survey Respondents
Appendix – Respondent Profile
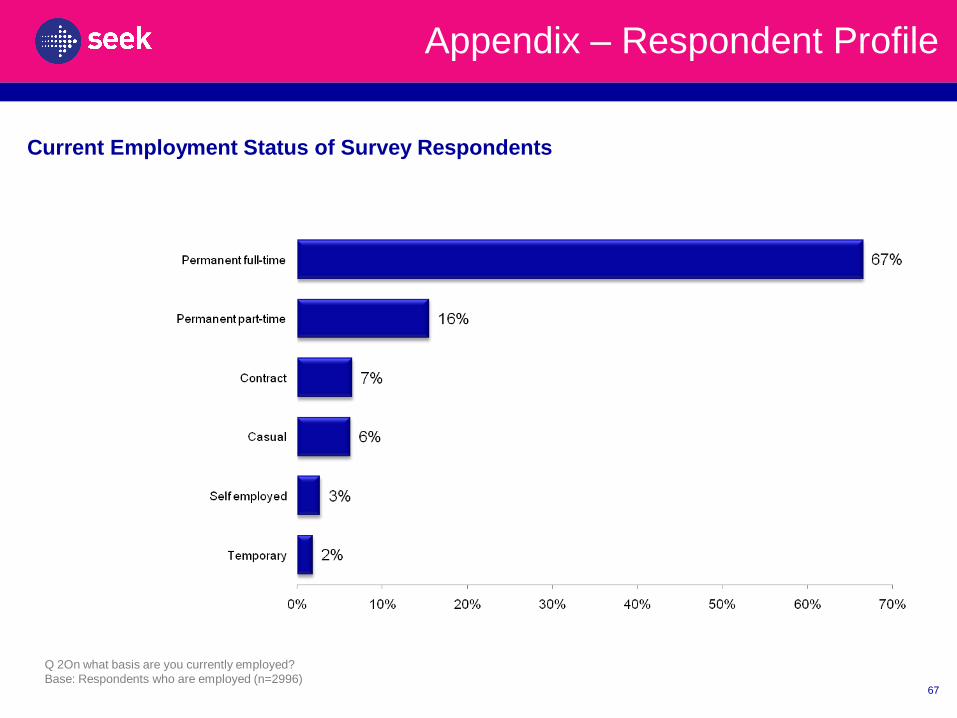
Q 2On what basis are you currently employed?
Base: Respondents who are employed (n=2996)67
Current Employment Status of Survey Respondents
Appendix – Respondent Profile
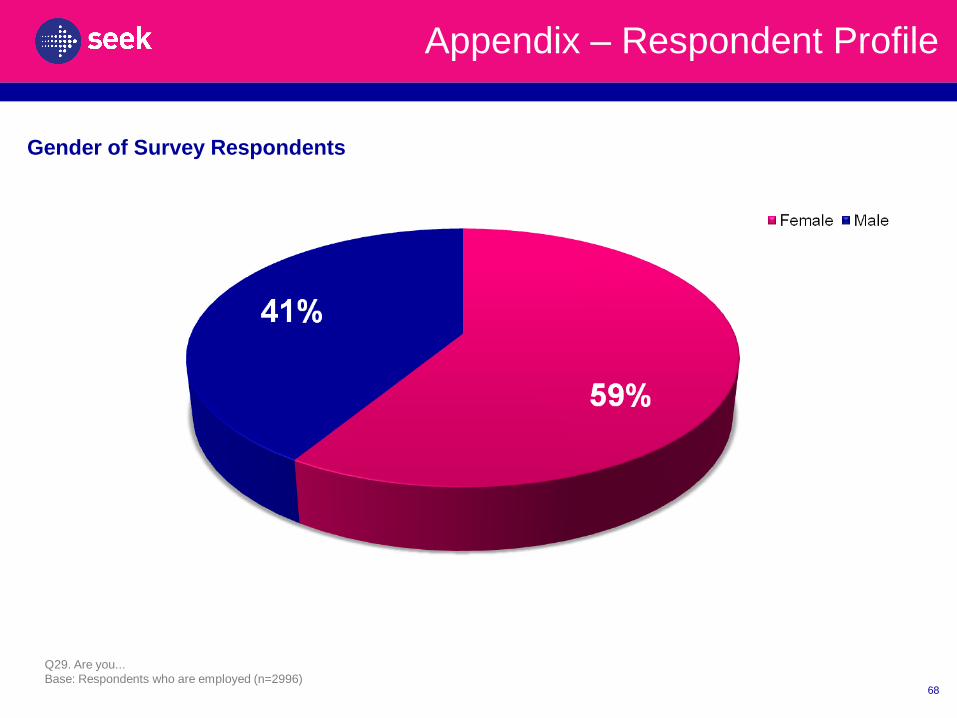
Q29. Are you...
Base: Respondents who are employed (n=2996)68
Gender of Survey Respondents
Appendix – Respondent Profile
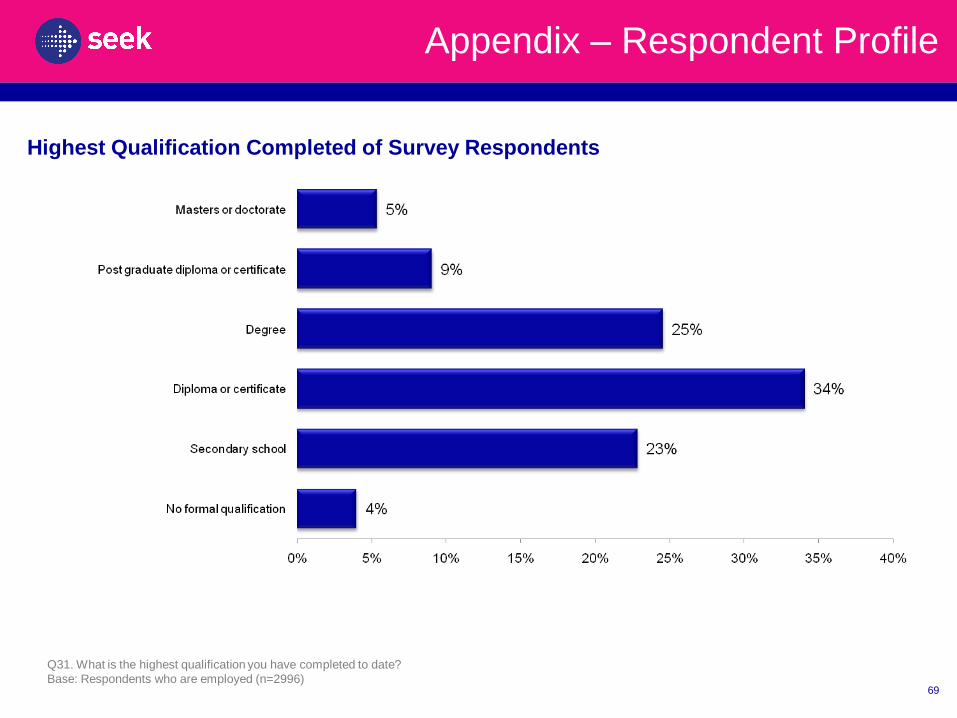
Q31. What is the highest qualification you have completed to date?
Base: Respondents who are employed (n=2996)69
Highest Qualification Completed of Survey Respondents
Appendix – Respondent Profile
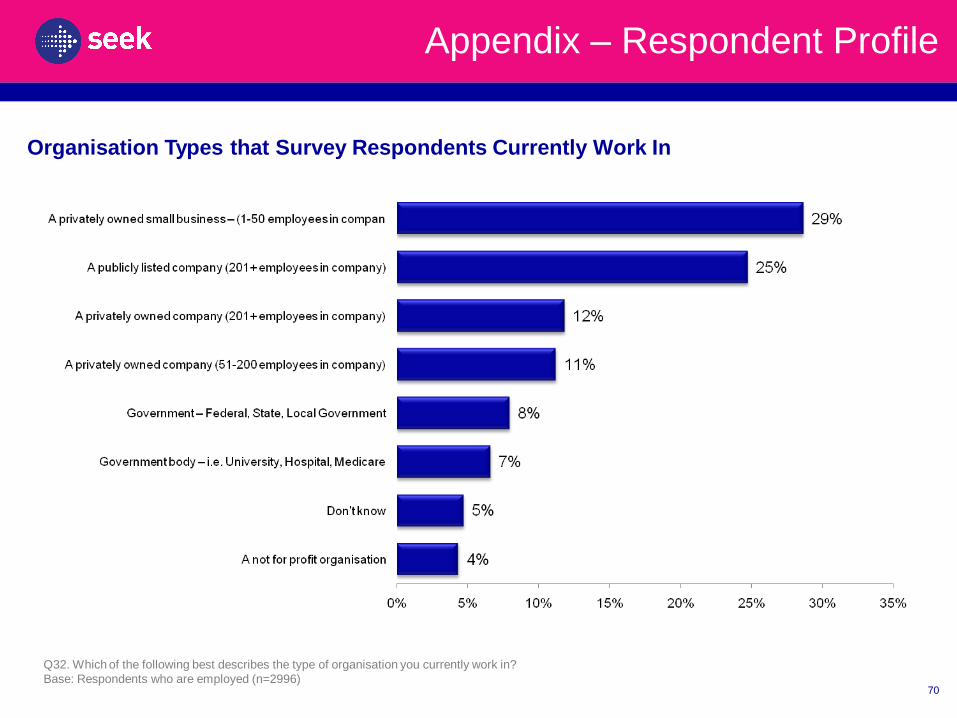
Q32. Which of the following best describes the type of organisation you currently work in?
Base: Respondents who are employed (n=2996)70
Organisation Types that Survey Respondents Currently Work In
Appendix – Respondent Profile
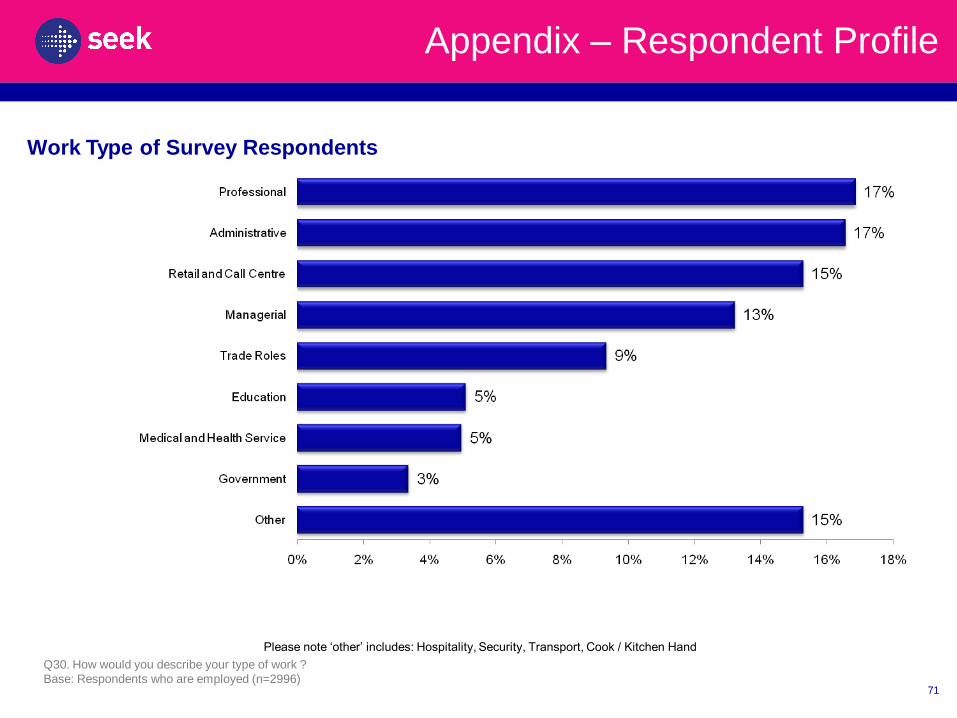
Please note ‘other’ includes: Hospitality, Security, Transport, Cook / Kitchen Hand
Q30. How would you describe your type of work ?
Base: Respondents who are employed (n=2996)71
Work Type of Survey Respondents
Appendix – Respondent Profile
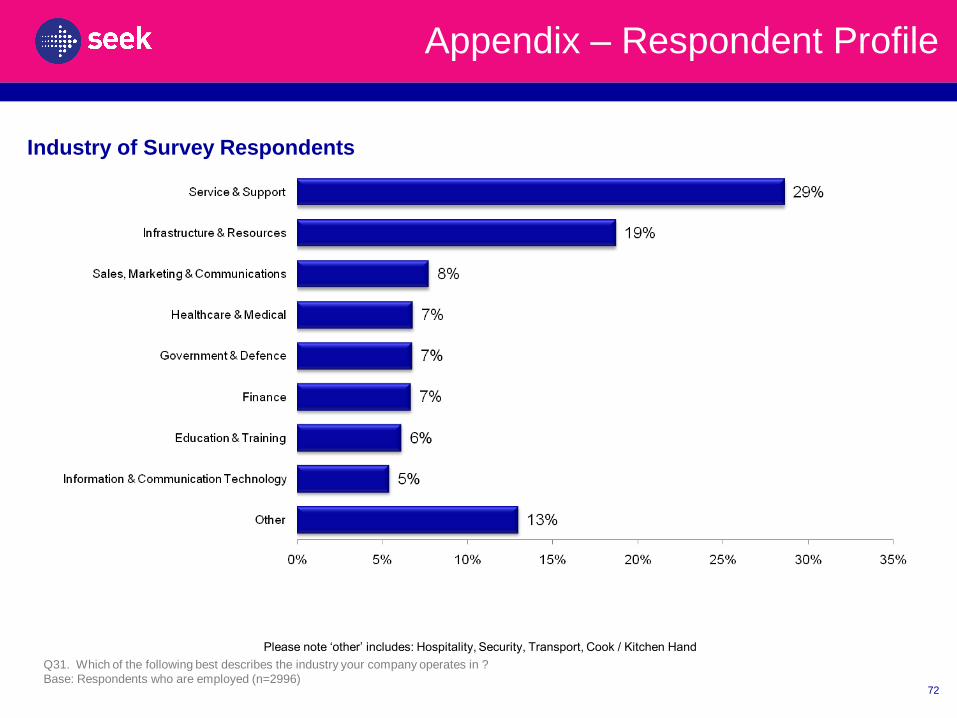
Please note ‘other’ includes: Hospitality, Security, Transport, Cook / Kitchen Hand
Q31. Which of the following best describes the industry your company operates in ?
Base: Respondents who are employed (n=2996)72
Industry of Survey Respondents
Appendix – Respondent Profile
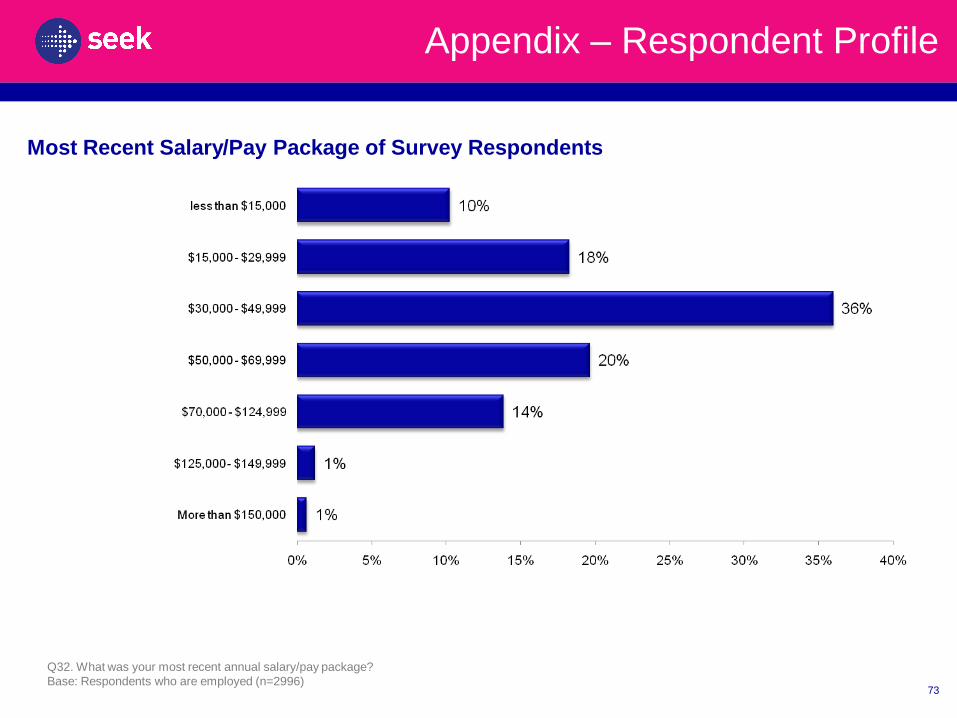
Q32. What was your most recent annual salary/pay package?
Base: Respondents who are employed (n=2996)73
Most Recent Salary/Pay Package of Survey Respondents
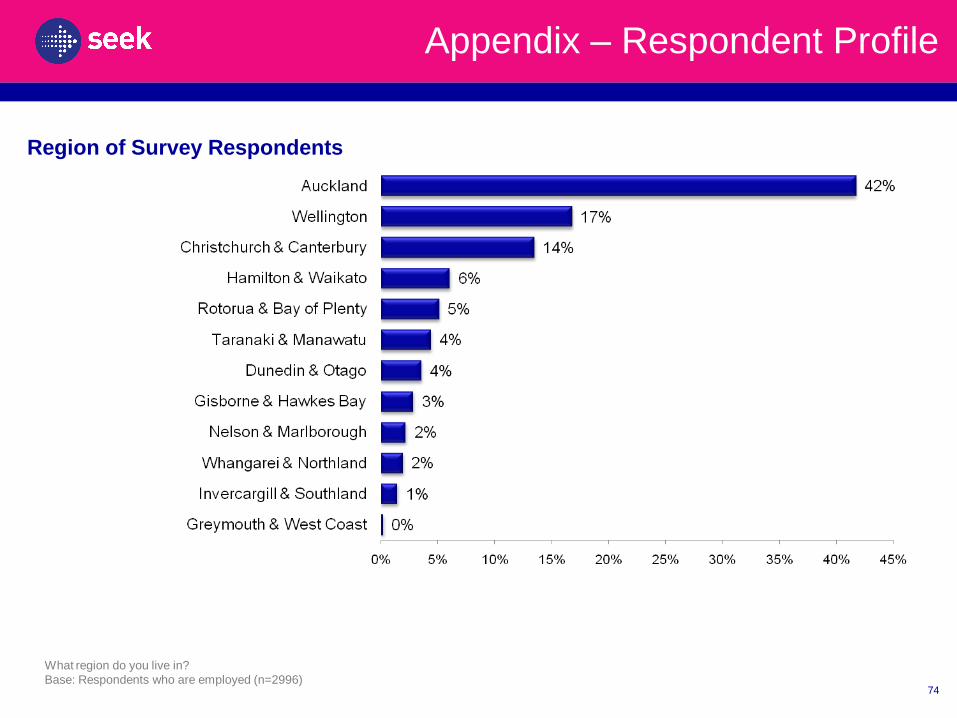
Appendix – Respondent Profile
What region do you live in?
Base: Respondents who are employed (n=2996)74
Region of Survey Respondents