Embed Size (px)
Citation preview

Retention_Study
Ministry of Health
Uganda Health Workforce Study:
Satisfaction and Intent to Stay
Among Current Health Workers
A study of facility-based health workers in Uganda conducted in July, 2006 and May, 2007 intended to measure health worker satisfaction, motivation, and intent to stay in
the health field to serve the country of Uganda.
With additional support from: Aga Khan University Makerere University
University of Washington

Retention_Study
2
TABLE OF CONTENTS Uganda Health Workforce Study: .................................................................................. 1 Satisfaction and Intent to Stay ....................................................................................... 1 Among Current Health Workers .................................................................................... 1 TABLE OF CONTENTS ............................................................................................... 2 ABSTRACT ................................................................................................................... 4 LIST OF ABBREVIATIONS ........................................................................................ 5 LIST OF TABLES ......................................................................................................... 6 LIST OF FIGURES ....................................................................................................... 7 ACKNOWLEDGEMENTS ........................................................................................... 8 EXECUTIVE SUMMARY ........................................................................................... 9
Introduction ................................................................................................................ 9 Study Sample ......................................................................................................... 9 Demographics and Location .................................................................................. 9
Findings .................................................................................................................... 10 Conclusions .............................................................................................................. 17 Recommendations .................................................... Error! Bookmark not defined.
SECTION I .................................................................................................................. 22 Introduction .................................................................................................................. 22
Objectives ................................................................................................................ 22 Study Questions ....................................................................................................... 22
Methods ........................................................................................................................ 23 Study Design ............................................................................................................ 23 Data Collection Methods ......................................................................................... 23
Questionnaires ..................................................................................................... 23 Focus Groups and Interviews .............................................................................. 24 Process ................................................................................................................. 25
Hard-to-Reach .......................................................................................................... 25 Data Entry and Analysis Procedures ........................................................................ 26 Qualitative Themes .................................................................................................. 27 Quantitative Variables ............................................................................................. 27
Findings ........................................................................................................................ 30 District and Facility Analysis ................................................................................... 30 Characteristics of the Sample ................................................................................... 30
Demographics ...................................................................................................... 30 Geographical Factors ........................................................................................... 31 Participant job characteristics and work histories ................................................ 32 Satisfaction ........................................................................................................... 33
Managers’ Views ..................................................................................................... 44 Satisfaction and Intent to Stay by Key Areas .......................................................... 46
Gender .................................................................................................................. 46 Age ....................................................................................................................... 47 Location ............................................................................................................... 47 Sector ................................................................................................................... 47 Cadre .................................................................................................................... 48
SECTION II ................................................................................................................. 52 Background .................................................................................................................. 52 Methodology ................................................................................................................ 52
Study Design ............................................................................................................ 52

Retention_Study
3
Data Collection Methods ......................................................................................... 52 The Study Process .................................................................................................... 53 Data Entry and Analysis Procedures ........................................................................ 53
Limitations of the Study ...................................................................................... 53 Findings ........................................................................................................................ 54
Characteristics of the Sample ................................................................................... 54 Demographics ...................................................................................................... 54 Job Characteristics and Work Histories ............................................................... 55 Satisfaction ........................................................................................................... 55 Intent to Leave ..................................................................................................... 57
COMPARATIVE ANALYSIS OF PUBLIC AND PNFP SECTORS ........................ 58 Demographics .......................................................................................................... 58 Geographical Factors ............................................................................................... 61 Employment Characteristics and Work Histories .................................................... 61
Cadre .................................................................................................................... 61 Work Experience Profile ..................................................................................... 62 Region of Work versus Region of Birth ........................................................... 63 Job Satisfaction and Morale ................................................................................. 64 Living and Working Conditions .......................................................................... 69 Job Security ........................................................................................................ 71 Compensation ...................................................................................................... 71 Intent to Leave ..................................................................................................... 72 Reasons for Leaving ............................................................................................ 72 Health Worker Migration Patterns ....................................................................... 73 Intent to Leave by Selected Categories ............................................................ 75
Conclusions .............................................................................................................. 78 Recommendations .................................................................................................... 80
APPENDIX I ............................................................................................................... 83 PHASE I REGRESSION ANALYSIS ................................................................ 83
APPENDIX II .............................................................................................................. 89 SELECTED TABLES FROM PHASE I ............................................................. 89
APPENDIX III ............................................................................................................. 95 SELECTED TABLES FROM PHASE I and II COMPARATIVE ANALYSIS 95
APPENDIX IV ........................................................................................................... 112 NUMBER OF RESPONDENTS WORKING IN THE REGION THEY WERE
BORN; BY FACILITY OWNERSHIP ............................................................. 112 APPENDIX V ............................................................................................................ 112
NUMBER OF FOCUS GROUP DISCUSSANTS BY FACILITY AND CADRE: PHASE II ........................................................................................... 112

Retention_Study
4
ABSTRACT
This report summarises the results of a study of health worker satisfaction, working conditions and intent to continue working in the health sector in Uganda. The findings point to the importance of a number of factors that contribute to satisfaction and intent to stay, including differences by cadre, gender, age, sector (public and private-not-for-profit) and location. The results suggest several policy strategies to strengthen human resources for health in Uganda. The study was carried out in two phases, with more than 800 health professionals surveyed in nine districts and 26 health facilities. Fifty-six focus groups were conducted in Phase I (one or more in each facility), with health workers separated by cadre (physicians, nurses and allied health). Another 27 focus groups were conducted in Phase II. Phase I of the study was conducted in July 2006 using a team of 20 Ugandan health professionals, most of them recent graduates of or current students at the universities in Kampala. The second phase was completed in May 2007. The Uganda Ministry of Health, with the support of the USAID-funded Capacity Project, conducted the study, with additional support from the US Health Resources and Services Administration and three universities (Makerere, Aga Khan and University of Washington). It was conducted under the oversight of the Uganda Health Workforce Advisory Board (HWAB), a group of Uganda health system stakeholders.

Retention_Study
5
LIST OF ABBREVIATIONS AMREF African Medical and Research Foundation
ARV Anti Retroviral
DDHS District Directors of Health Services
DHRH Developing Human Resources for Health
FBO Faith-Based Organization
FGD Focus Group Discussion
GoU Government of Uganda
HC Health Centre
HRH Human Resources for Health
HRSA Health Resources and Services Administration
HWAB Health Workforce Advisory Board
ISCO International Standard Classification of Occupations
LHP Licensed Health Professional
MISR Makerere Institute for Social Research
MoH Ministry of Health
NGO Non-governmental Organization
PHP Private Health Provider
PNFP Private Not-for-Profit
SMM Senior Management Meeting
UCMB Uganda Catholic Medical Bureau
UMMB Uganda Muslim Medical Bureau
UPMB Uganda Protestant Medical Bureau
USAID United States Agency for International Development
WHO World Health Organization

Retention_Study
6
LIST OF TABLES
Table 1: Health Worker Dimensions Phase I Table 2: Summary: Numbers Interviewed by Facility/Ownership Phase I Table 3: Health Worker Dimensions Phase II Table 4: Summary: Numbers Interviewed by Facility/Ownership Phase II Table 5: Amount of Time Spent by Health Workers (%) with the
Organisation Table 6: Amount of Time Spent by Health Workers (%) at the Facility Table 7: Overall Satisfaction and Morale Ratings by Organisation/Sector Table 8: Respect, Care and Recognition by Organisation and Sector Table 9: Compensation Factors Offered by Organisation, by Importance Table 10: Health Worker Intent to Leave by Organisation
Retention_Study
7
LIST OF FIGURES
Figure 1: Map of Uganda Figure 2: Age Distribution Curve by Sector Figure 3: Health Worker Age Groups by Facility Ownership Figure 4: Years Spent in the Workforce by Organisation/Sector Figure 5: Job Satisfaction by Cadre Figure 6: Job Satisfaction by Age Figure 7: Access to Drugs, Supplies and Equipment Figure 8: Uganda Health Worker Migration Patterns by Organisation Figure 9: Internal Migration Patterns by Organisation Figure 10: Intent to Leave by Cadre and Organisation Figure 11: Health Worker Intent to Leave by Age Group Figure 12: High Risk of External Migration by Age Group

Retention_Study
8
ACKNOWLEDGEMENTS
The Uganda Health Workforce Study was conducted and the data thereof provided by the Ministry of Health of the Republic of Uganda, with funding from the United States Agency for International Development (USAID)-supported Capacity Project/Uganda and the US Health Resources and Services Administration (HRSA). Recognition is also made of the contributions to data collection by Aga Khan University-Kampala Nursing School, Makerere University Medical School and the University of Washington School of Public Health. We appreciate the participation of each health worker who took time to fill out a questionnaire or attend a focus group discussion. Hospital administrators, nursing directors and medical superintendents were most gracious. We also appreciate the time of each of the District Directors of Health Services (DDHS1
) in the nine districts. Kibuli Muslim Hospital, in Kampala, offered valuable assistance by volunteering to host our teams and serve as the field worker-training site; we are grateful for that cooperation. The official list of Uganda health professional training schools (not including universities) was received from the European Union’s Developing Human Resources for Health programme, coordinated through the African Medical and Research Foundation (AMREF). Our thanks to Edward Walugembe, Carol Idusso and Deana Leadbeter for this list. Thanks also to the European Union for the list of National Classification of Health Occupations (based on the International Standard Classification of Occupations, or ISCO) codes adapted for use in health professions in Uganda.
Authorship Amy Hagopian, PhD and Paul Kiwanuka-Mukiibi, MD have authored this draft of the Executive Summary with support from the USAID-funded Capacity Project and the US HRSA. Dr. Hagopian analysed the Phase I quantitative data with statistical assistance from Bert Stover, PhD and Emily Bancroft, MPH. Quantitative data from Phase II of the study was analysed by Dr. Kiwanuka-Mukiibi, with the assistance of Arnold Mbigiti, MA. Jim McCaffery, PhD, Pamela McQuide, PhD, Anneke Zuyderduin, PhD, Fatu Yumkella, Msc, MPhil and others provided editing assistance at the Capacity Project. Stella Neema, PhD of the Makerere University conducted analysis of the qualitative data in both Phases I and II of the study for Makerere Institute of Social Research (MISR).
1 The title District Director of Health Services has since been changed to District Medical Officer (DMO).

Retention_Study
9
EXECUTIVE SUMMARY
Introduction The Uganda Health Workforce Study was conceived as part of a group of projects to be conducted by the Uganda Ministry of Health (MoH) with the support of, and in collaboration with, the United States Agency for International Development (USAID)-funded Capacity Project to further the goal of strengthening the nation’s health workforce. The study was conducted in two parts: Phase I was conducted in July 2006 with results reported to the MoH during the following October. Phase II was conducted in May 2007, at the request of the MoH, in order to capture data from facilities owned by organisations not studied during Phase I. This study was done in response to MoH (and other stakeholder) concerns about health workforce morale, satisfaction, motivation, intent to stay and out-migration. There is a growing consensus that the significant health status challenges facing sub-Saharan Africa cannot be addressed without strengthening health systems and the health professionals who work in those systems. There are many assumptions and speculations about which factors contribute to health worker satisfaction and intent to continue in their jobs, however very little data about specific motivators and disincentives exists. Such data are particularly scarce at the country level. Uganda’s commitment to health workforce policy reforms is real, but the success of those reforms will be significantly enhanced if they are based on current, accurate information.
Study Sample During Phase I of the study, 641 surveys were collected from health workers who had been in their current jobs at least a year (or were new to the profession). Thirty-eight surveys were collected from health workers who had changed jobs in the health sector in the last year and 61 surveys from health system managers (including District Directors of Health Services) were obtained. There were 56 focus groups conducted in Phase I to complement the survey data. A further 203 surveys were collected from those who had been in their current jobs at least a year (or were new to the profession) in Phase II, with an additional 27 focus group discussions conducted to complement this survey data.
Demographics and Location The average respondent was 39 years old, female (61%), married (62%) and had six dependents. Almost equal numbers of respondents worked in the PNFP sector and the public sector (49.2% and 48.6%, respectively). The largest number of respondents fell into the 31 – 40 age group and the Private Not-for-Profit (PNFP) workforce was younger than that of the public sector, with an average age of 35 compared to 42 years. In fact, 42% of PNFP health workers were aged 30 years and below compared to 14% in the public sector and almost 75% of PNFP health workers were 40 years and below whereas 50% of public sector workers were aged 41 years and above.

Retention_Study
10
Compared to PNFP sector workers, public sector workers were also more likely to be male (43% compared to 34%), married (70% compared to 54%) and have more dependents. Consequently, there were more female health workers in the PNFP sector (overall) than the public sector (66% compared to 57%). Nurses comprised the majority of the sample respondents (56%), the proportion employed in the PNFP sector higher than in the public sector (59% compared to 53%). Medical Officers (physicians) comprised the smallest group at 9% of the sample. Health workers in the North and Northwest regions of the country were much more likely to be working in the regions in which they were born (70%) as opposed to the Central region where only 25% of health workers had been born in the region. There were no significant differences among health care worker profiles in Hard-to-Reach areas compared to those working in “easier” to reach areas. Managers interviewed in Phase I tended to be male (64%), older (67% were over 41) and stable (48% had been in their positions for at least 10 years). Comment: Younger workers at the beginning of their careers may be less likely to have family/social ties, and more likely to focus on developing their careers. The implication of the study’s findings is that the much younger health workforce in the PNFP sector is more likely to move to another position within five years than are those in the public sector. Health workers in the northern part of the country, which was affected by 20 years of civil strife, clearly demonstrated a greater willingness to serve where they were born. This may be due to fewer opportunities to move to other parts of the country, or to a greater attachment to their communities and the need to serve/re-build the regions.
Findings Job Stability and Longevity Are High The study was designed so that samples in both phases were drawn from the health workers currently found on the job in hospitals and health centres (not people who had already left), giving a “survivor’s bias.” There were, however, no comparison numbers on longevity or turnover to help evaluate the significance of the study’s findings. Although findings indicate good overall stability in the health workforce, with almost 80% still in their first job, there were significant differences between the public and PNFP sectors. There was a greater degree of stability in the public sector, with the majority (55%) having worked for more than 10 years for their organisation, compared to 29% in the PNFP sector. Approximately 43% in the public sector had spent more than 10 years working in the same facility, compared to 23% in the PNFP sector. However, PNFP sector workers were slightly more likely to be in their first jobs (81%), compared to workers in the public sector (79%). Slightly more than half of health workers (51%) planned to stay in their jobs indefinitely (60% in the public sector; 47% in the PNFP sector); 20% said they would

Retention_Study
11
stay at least three years. The rest reported that they were eager to leave their jobs soon: 26% within the next two years and 8% s indicating the intent to leave “as soon as possible.” Of those intending to leave soon, the majority expressed the desire to migrate internally (leave their organisation but stay within the country); most were in the PNFP sector rather than the public sector (34% compared to 13%). Overall, almost 15% of the respondents expressed the desire to migrate externally (either leave the country - 10.4%; or leave the health sector – 4.3%), the greater number being in the public sector (18% compared to 13%). Older respondents (age 41 years and above) were far less likely to indicate an intent to leave their jobs within two years, leave Uganda or leave the health profession. The age groups at greatest risk of leaving Uganda or the health sector were: (i) 51 years and above in the PNFP sector and (ii) 30 years and below in the public sector. Physicians were the group most likely to say they were eager to leave their jobs within two years (43%), and most at risk for leaving Uganda or the health sector (31% said they would leave if they could). More physicians in the PNFP sector expressed the intent to leave than those in the public sector (63% compared to 46%) and 83% of physicians in UCMB facilities said they intended to leave within two years. Regression analysis helped us determine that even after controlling for gender, being a physician was highly predictive of a desire to leave one’s position. Nurses were the cadre least likely to report an interest in leaving Uganda or the health profession with 82% saying they intended to stay in their jobs at least three years. (As a point of reference, there is approximately a 20% turnover among nurses in the United States and United Kingdom annually2
• Active involvement in the facility.
.) Allied Health Workers and Clinical Officers also showed a high intent to stay, with 75% and 73% respectively indicating that they intended to stay in their jobs for at least three years. Overall, 21% of those who had less than five years of experience in the health workforce said they intended to leave within two years, the PNFP sector average being 24% compared to 10% in the public sector. More health workers in the public sector, with between 5 and 10 years experience, expressed the intent to leave (29% compared to 18% in the PNFP sector). A further 28% in the public sector were at risk of leaving Uganda or the health sector, compared to only 7% in the PNFP sector. Region was a significant predictor of intent to stay overall. The region where health workers expressed the least likelihood of leaving was the North whereas living in the Central region increased the odds of leaving. Salary was found to be an important factor in reducing the odds of leaving. Other factors being held equal, the following also reduced the odds of leaving (in order of importance):
• Manageable workload. • Flexibility to balance the demands of work and personal life.
2 International Council of Nurses. Global nursing shortage: priority areas for intervention. Geneva, Switzerland: International Council of Nurses, 2006, p. 42.

Retention_Study
12
• Better opportunities for promotion. Comment: Health sector jobs are relatively high status, stable and reasonably compensated in comparison to many alternatives for educated people in most countries, which may explain some of the job longevity found in this sample. However, lack of access to opportunities or new jobs may also account for the longevity seen. The international literature on health worker turnover, however, cautions us that there is a strong relationship between intent to leave and turnover, and that job satisfaction is predictive of turnover 3
Workers Are Divided as to Satisfaction and Morale Health worker job satisfaction and motivation is related to the worker’s ability, willingness and means to achieve high performance on the job. Only approximately half the health workers interviewed indicated overall satisfaction with their jobs, slightly more in the PNFP sector (the average being 54%), than in the public sector (49%). Morale was also better in the PNFP sector with an average of 63% reporting it was good, compared to 42% in the public sector. The least satisfied cadre was Medical Officers (physicians) with only 25% saying they were “very satisfied” with their job: 35% of physicians in the public sector expressed satisfaction, compared to 22% in the PNFP sector. The most satisfied cadres were Pharmacy (41% “very satisfied”) and Nursing (39% “very satisfied”). Overall, satisfaction was lower in the PNFP sector across all cadres than in the public sector. Older respondents were more satisfied than younger ones, and satisfaction was generally higher for each successively older group. Additionally, older respondents (age 41 and up) were far less likely to indicate an intent to leave their jobs within two years, leave Uganda or leave the health profession. Attachment to the facility and the community tended to be stronger with each older age group, and relationships with supervisors were better. Older respondents also reported receiving more recognition for good work.
. Although study findings indicate that there is there is no imminent danger of a broad-scale exodus of health workers from their jobs in Uganda, they do show a relatively high intent of movement within the PNFP sector, with the greater numbers intending to migrate internally. An explanation could be that job satisfaction in the public sector (related to remuneration, job security, opportunities for promotion and access to higher education) is higher than in the PNFP sector. Therefore, those in the PNFP sector may view their “greener pastures” as being in the government sector in Uganda, whereas those intending to leave the public sector may view theirs as being outside of the country or outside of the health sector.
This age correlation is consistent with other studies on worker (and even patient4
3 Hayes LJ, O”brien-Pallas L, Duffield C, et al. Nurse turnover: a literature review. International Journal of Nursing Studies. 2006;43:237-263. 4 Hagopian A, House P, Dyck S, et al. The use of community surveys for health planning: the experience of 56 northwest rural communities. The Journal of Rural Health. 2000;16(1):81-90.
) satisfaction, suggesting a universal aspect to this finding rather than something

Retention_Study
13
specific to Uganda.5,6
Previous African studies have identified the most important human resources tools to manage job satisfaction. In order of importance, these include materials, salary, training, working environment, supportive supervision, living conditions and recognition
The literature also suggests that older health workers may feel more commitment to the profession and more control over their jobs. A large majority of managers interviewed in Phase I (83%) said employee job satisfaction was “very important,” yet only 13% felt their organisations performed “very well” on this indicator. Areas where managers felt their organisations were performing better included placing people in suitable jobs (49%), taking measures to protect workers against disease (49%), training (37%), preventing harassment by supervisors (32%), creating flexibility for employees (32%) and valuing and respecting each worker (31%).
7
• Job was a good match with worker’s skills and experience.
. This was relatively consistent with study findings. The following were the most important significant contributors to overall satisfaction:
• Satisfaction with salary. • Satisfaction with supervisor. • Manageable workload. • Job is stimulating or fun. • Job security.
Comment: Job satisfaction matters to health system managers because it is an important factor in predicting system stability (reduced turnover) and worker motivation8. If motivation is defined as the willingness to exert and maintain efforts toward attaining organisational goals, then well-functioning systems seek to boost factors that predict motivation, such as morale and satisfaction,. A survey of ministries of health in 29 countries showed that low motivation is seen as the second most important health workforce problem after staff shortages9
The literature suggests that systems should identify facilities that are serving as “magnet hospitals,” or those that are more successful at recruiting and retaining health workers and seem especially adept at boosting motivation and performance, in order to identify the factors that can be replicated elsewhere in the system
.
10
Working and Living Conditions are Poor and Workload is High
. In Phase I of the study, health workers at Angal and Rubaga hospitals registered the highest overall job satisfaction among PNFP facilities. Among public facilities, the top performers were Apac, Kagadi and Itojo Hospitals. Further study of these facilities would be beneficial in determining if the difference in satisfaction is an artifact or an actual difference based on key factors of job satisfaction.
5 Pathman DE, Konrad TR, Williams ES, et al. Physician job satisfaction, dissatisfaction, and turnover. The Journal of Family Practice. 2002;51(7):593. 6 Ingersoll GL, Olsen T, Drew-Cates J, Devinney BC, Davies J. Nurses” job satisfaction, organisational commitment, and career intent. The Journal of Nursing Administration. 2002; 32(5):250-63. 7 Mathauer I, Imhoff I. Health worker motivation in Africa: the role of non-financial incentives and human resource management tools. Human Resources for Health. 2006;4:24. 8 Mathauer. 9 Mathauer, p. 2. 10 International Council of Nurses.

Retention_Study
14
There were significant problems noted with working conditions, in both the public and PNFP sectors. Working conditions were consistently rated higher by PNFP sector than public sector workers, with statistically significant differences noted for the availability of supplies, equipment and drugs, utilities, transportation and time to eat lunch. Physicians were the cadre most likely to report problems with access to supplies, equipment and medications. Only approximately half (52%) of respondents said they thought their workload was manageable. Additionally, access to equipment, supplies, drugs, electricity and water was reported to be seriously compromised. Overall, 66% said they had the supplies they needed to do their jobs well and safely (gloves, needles, bandages, etc.), yet only 36% in the public sector said so, compared to 77% overall in the PNFP sector. Even fewer respondents (55%) said they had the equipment they needed to do their jobs well, with only 27% of public sector workers saying so, compared to the PNFP average of 64%. Approximately the same number (57% overall) said they had good access to electricity at work, but access in the public sector was reported as good by only 37% of workers. However, slightly more workers in the public sector (64%) felt they had the flexibility to balance the demands of the workplace with their personal lives (compared to 60% in PNFP facilities). Relatively high levels of abuse were reported in both the public sector (21% of respondents reported abuse) and the PNFP sector (16%). The most common type of abuse reported within the public sector was abuse by supervisors (24%), compared to 17% in PNFP facilities. Women were significantly more likely to say that a supervisor had abused them or that patients or friends/family members of patients had abused them; nurses were most likely to report abuse by a supervisor or peers. The literature on health worker abuse tends to focus on nurses, and much of it discusses physicians’ abuse of nurses. A review of the literature shows that verbal abuse by physicians accounts for the highest incidence of aggression toward nurses in health care and that it relates strongly to turnover rates, patient care, work productivity, morale and job satisfaction11. In one South African study, 79% of the nurses reported verbal abuse. In a Turkish study, 87% of nurses reported such abuse12
11 Joubert E, du Rand A, van Wyk N. Verbal abuse of nurses by physicians in a private sector setting. Curationis. 2005;28(3):39-46. 12 Uzun O. Perceptions and experiences of nurses in Turkey about verbal abuse in clinical settings. Journal of Nursing Scholarship. 2003;35(1):81-5.
. While this study used different methods and measures, the numbers reporting abuse were significantly lower than in these studies. Approximately one in four (27%) nurses in our study reported being abused by a supervisor, 26% by patients or patients’ family members and 18% by peers. Living conditions were also poor. Although the majority of respondents said access to safe and clean water was good, large numbers said they didn’t have good access to transportation to work (66%), access to good schooling for their children (61%), access to shopping or entertainment in their communities (62%) or reliable electricity at home (72%).

Retention_Study
15
Comment: When working conditions are poor and workload is high, health workers become “de-motivated” and frustrated. They are unable to satisfy their “professional conscience13
Poor Compensation Adversely Affects Satisfaction
” and distance themselves emotionally from their work, reducing their commitment and motivation. Lack of supplies or equipment is often viewed as being beyond anyone’s means of control and when poor management is perceived to be at the root of the problem, health workers say it is especially frustrating to them. While the report of abuse among health care workers is disturbing, at more than one in four, it does not seem to be more prevalent in Uganda than in other countries. This suggests a more generic problem in the health profession rather than a specific problem in Uganda.
Early theory in worker satisfaction and motivation identified compensation as a “hygiene factor” rather than a motivation factor14. This means that basic salary satisfaction must be present to maintain ongoing job satisfaction, but this by itself will not provide satisfaction, and increasing amounts of salary will not contribute to increasing levels of job satisfaction. However, recent research in Africa suggests that salary increases and other improvements in compensation, in the context of highly inadequate pay and benefits, may indeed contribute to workforce retention15
Comment: Given the gap between salaries in the public and PNFP sectors in Uganda, as well as the gap between salaries in some neighbouring countries and abroad, it seems critically important to begin addressing compensation factors in order to avoid turnover and reduce incentives to leave the health sector or the country. The UCMB Catholic hospitals’ database on turnover revealed that the primary reason for health workers leaving jobs in 2005 was low salary. The finding that health care coverage for dependents may be even more important than salary itself may suggest an
. Only 14% of respondents believed their salary packages to be fair, with a large majority feeling compensation packages should include health care for dependents (87%), food allowance (80%), housing allowance (74%), terminal benefits such as retirement (72%) and transportation (56%). It is notable that respondents said that health care for dependents was even more important to them than salary itself (85%), but that managers, when asked in their own survey, significantly underestimated the importance of health care benefits to employees. Approximately three in four (74%) managers predicted that this would be important to workers, compared to 90% of workers. Health workers repeatedly spoke of many years of service without salary or position upgrades. They also complained of the fact that sometimes new graduates were paid more than 20-year veterans and that selection for further training also seemed arbitrary and unfair; yet respondents considered further training as a significant reward and motivator. Both focus groups and surveys confirmed the perception that the public sector offers significantly better compensation and job security than the PNFP sector, but significantly poorer working conditions.
13 Mathauer, p. 3. 14 Herzberg F. The motivation to work. New York, NY: Wiley, 1959. 15 Kober K, Van Damme W. Public sector nurses in Swaziland: can the downturn be reversed? Human Resources for Health. 2006;4:13.

Retention_Study
16
affordable, immediately achievable compensation strategy (assuming institutions can absorb the additional health care costs). Opportunities Exist for Better Supportive Supervision Although health workers reported that management and supervision in their facilities were generally adequate, there was some ambivalence toward relationships with supervisors. While a majority (74%) said that their immediate supervisor was available to give them support, fewer (67%) felt that their supervisor actually “cared.” Sixty-nine percent said they were evaluated fairly in their work, while 61% said they were actually recognised for good work. A majority of focus groups also expressed considerable dissatisfaction about the lack of management’s appreciation or recognition for their “sacrifices and commitment.” More than 60% said that the hospital manager where they work is “competent and committed” and in focus groups, workers said they appreciated the opportunity to participate in regular meetings and discuss issues pertaining to the running of the facility. However, focus groups conducted in Phase II of the study (Faith Based Organisations [FBOs] only) expressed a relatively high degree of dissatisfaction with what they described as an inappropriate amount of non-professional (diocesan) involvement in management, leading to inefficiencies and numerous inequities in management and rewarding practices. Morale, in general, was reported as good, but only 45% of respondents said their facility was a “fun place to work. “ Also fewer than half (45%) said that someone had talked to them and encouraged their development at work within the last six months. A number of questions were asked about safety and security and only 50% of public sector workers felt their organisation was taking adequate (specific) measures to protect them against HIV/AIDS, compared to 73% in the PNFP sector. Fear of HIV infection has been reported elsewhere as an underlying reason for attrition16
Ethical and Organisational Issues In addition to analysing the results of questionnaire responses, our teams made notes on their conversations with staff during informal conversations and formal focus-group discussions. Details are in the Technical Report, but some highlights include the following observations:
.
• Some health workers in public facilities are illegally charging patients fees; administrators feel powerless to intervene.
• Many public sector physicians are running private practices during the time when they are supposed to be working at their “day jobs.”
o Some of these physicians are appropriating drugs and supplies from public facilities for their private practices.
• Many health workers are not properly upgraded after returning from training. • When workers take leave for studies (or other purposes), they are still listed as
current workers at their facilities, creating shortages but not vacancies that can be filled.
16 Ehlers VJ. Challenges nurses face in coping with the HIV/AIDS pandemic in Africa. International Journal of Nursing Studies. 2006;43(6):657-62.
Retention_Study
17
• Many health workers in the PNFP sector said: o There was no clear/proper demarcation of roles and responsibilities
between “church” and hospital administration, resulting in unclear lines of authority and inefficiencies in management.
o Access to further education and opportunities for promotion was limited and “unfairly distributed.”
o There was no job security (in their sector) and, given the chance, they would leave.
• Many health workers blamed decentralisation for reduced interest in positions available in remote locations. Some respondents indicated that the idea of being bonded to a rural district for life is enough to keep a doctor from even applying; rural health facilities were also said to be left to recruit and retain workers on their own.
• The relationship between district-elected leadership, the DDHS and hospital administration can be problematic. When local leaders do not prioritise health, facilities suffer.
• There is corruption among some who hold positions of power. For example, occasionally health workers are required to pay or offer personal services to have their papers or paycheques processed.
Comment: These ethical and organisational issues represent significant challenges in the management and control of the health system, and likely negatively contribute to health worker satisfaction, motivation and morale. Many of these issues cannot be addressed at the facility level and will need the attention of the MoH.
Conclusions The level of satisfaction of the Uganda health workforce was found to be relatively low, with only half the health workforce saying they were satisfied with their job; higher levels of dissatisfaction were reported in the PNFP sector than in the public sector. The highest levels of dissatisfaction, by cadre, were reported amongst physicians; in the PNFP sector; and within the group aged 30 years and below. The vast majority of health workers interviewed considered their salary package to be inadequate and unfair, this being one of the major factors affecting health worker satisfaction. Other factors negatively affecting health worker satisfaction in Uganda included working and living conditions, which were reported to be poor, much more so in the public sector. Health workers in the public sector reported poorer access to electricity both at work and at home, grossly inadequate supplies of drugs and equipment, unmanageable workloads and poor health protection. This may be interpreted as an indicator of a relatively lower public sector investment in (supportive) infrastructure and supplies. Health workers, in both the public and PNFP sectors also reported poor access to good schools for their children, poor shopping and entertainment in their communities and the lack of safe and efficient transport to work. Although the level of supervision and management was good, especially in the PNFP sector, the level of personal care by supervisors (respect accorded health workers and recognition for good work) was lower in the PNFP sector than in the public sector. This factor, in part, may be contributing to the relatively lower levels of job satisfaction seen in the PNFP sector.

Retention_Study
18
Job security was also found to be relatively low, although it was better in the public sector. Amongst the reasons given for better job security in the public sector were (i) the relatively higher salaries, compared to the PNFP sector; (ii) the fact that the public sector offers better access to higher education and (iii) that public sector employment is “pensionable,” which does not seem to be the case in the private sector. Health worker age-distribution in both the public and PNFP sectors differed greatly. The majority of the PNFP workers were aged 30 years and below and the majority of the public sector workers 41 years and above. The PNFP sector thus has a relatively young workforce, which may be more likely to be affected by those factors listed as the main reasons for leaving – poor pay, poor access to higher education and limited opportunities for promotion, amongst others. This is further evidenced by the fact that the profile of those intent on leaving was made up of physicians and clinical officers, aged 30 years or less, with less than 5 years working experience and working in the PNFP sector. Intent to leave was relatively low, with few respondents indicating intent to leave the health sector entirely and/or the country. Most of those that indicated intent to move within the country were in the PNFP sector – leaving for a new facility in the same organisation, or changing organisations completely. Factors that seemed to influence PNFP-to-public sector migration included higher salaries, increased opportunities for further studies and/or promotion, and decreased workload (due to staff shortages in the PNFP sector). Although such movement (PNFP-to-public sector migration) does not contribute directly to sector attrition, it nonetheless makes it extremely difficult to plan. Oftentimes, movement is not reported/captured until much later, making it difficult to determine health workforce distribution and capacity. There were several issues that both sectors shared, however the emphasis placed on some of them was found to be specific to the respective sectors. Respondents in both the public and PNFP sectors agreed that a good working environment, better remuneration, availability of accommodation, good management/active supervision and opportunities for further studies were important retention factors. However, health workers in the PNFP sector indicated a much greater degree of concern about job security, (poor) salary structure, the lack of job descriptions and opportunities for promotion and ambiguous terms of service.

Retention_Study
19
Recommendations
MAJOR FINDINGS KEY CONSIDERATIONS
Compensation • Low salary • Delayed payment of salaries • Higher salaries in Public/GoU facilities than
PNFPs
Support dialogue with key stakeholders Strengthen payroll management
Management and Supervision • Level of Church administration’s
involvement in hospital management sometimes too high in PNFPs
• Management and supervision much more lax in Public/GoU facilities
• Management perceived as good but less personal in PNFPs
• Poor access to further training • Limited opportunities for promotion • Long recruitment and deployment process,
especially in Public/GoU facilities
Develop participatory management programmes and HRIS system at Central and District levels
Strengthen support supervision practices Strengthen orientation programmes for new
recruits Develop “Further Educational
Opportunities” database Streamline recruitment and deployment
processes, learning from examples in the region
Working Conditions • Poor level of equipment, supplies and drugs
stocks, especially in Public/GoU facilities • Understaffing and unmanageable workload • Poor back-up power supply • Poor job security • No resting spots in health facilities
Strengthen procurement logistics Implement workload-based staff indicators Designate staff resting and recreation spaces
in facilities Develop innovative staff recruitment
mechanisms, especially for rural communities
Partner with local communities to ensure local resources contribute to health service delivery
Living Conditions • Inadequate housing • Poor availability of social amenities • Poor access to good schools for children
Support dialogue with key stakeholders such as Inter-Ministerial Steering Committee and promote initiatives that address these issues
Abuse of health workers • By supervisors • While travelling to and from work
Reinforce complaint mechanisms Empower health workers, especially
females, to stand up for their rights Encourage Professional Associations and
Councils to protect their constituents’ welfare and address abuse issues
In order to address the identified key considerations, implementation of the following is recommended:

Retention_Study
20
1. Analyse practices in “magnet” health facilities to identify positive conditions
and practices in order to adapt and adopt them in health facilities throughout the country.
2. Develop strategies for attracting and retaining priority cadres in order to
ensure adequate staffing in Hard-to-Reach areas, as well as equitable staff distribution between the PNFP and Public/GoU sectors. Strategies will focus on:
a. Salary enhancements. b. Health worker deployment, vis-à-vis age group. c. Loans. d. Housing. e. Children’s schooling. f. Further education for health workers.
3. Implement workload-based indicators for staff members in order to identify
and address individual facility staffing requirements through:
a. Dissemination of the Workload Indicator of Staffing Needs (WISN) Report – a World Health Organization (WHO) initiative piloted in Uganda.
b. Initiation and support of the WISN Stakeholder Group in the MoH. c. Pilot implementation of WISN in several districts. d. Identification of how WISN can contribute to annual budget request
(e.g. as they have done in Oman).
4. Develop strategies and tools for performance management and recognition at the health facility level in order to strengthen human resource assessment, mentoring and support supervision approaches.
5. Develop and promote participatory leadership and management programmes
at both MoH and health facility level to ensure key stakeholder input in all planning, development and implementation of District HRH Action Plans, by working with and through Stakeholder Leadership Groups at both the central and district level, as well as through the implementation of Leadership Development Programmes.
6. Enhance and promote community oriented pre-service training for all health
cadres through collaboration with health training institutes as well as innovative deployment of trainees within the communities.
7. Support innovations for team building, recreation and staff welfare at health
units in order to foster and strengthen the sense of belonging and team spirit within the health workforce and identify strategies to address psychosocial issues related to post-conflict environments.

Retention_Study
21
Figure 1. Map of Uganda
Source: U.S. Central Intelligence Agency

Retention_Study
22
SECTION I Introduction Objectives The purpose of Health Workforce Study was to assess the factors related to the retention and satisfaction of health workers throughout Uganda. The findings will help the Ministry of Health (MoH) develop policies to promote successful recruitment and retention of human resources in the health sector. Study Questions The study group set out to answer the following research questions: 1. For those who are currently in a health position: how satisfied are they with their positions? What factors would encourage them to stay in their positions? What is their intent to leave or stay? 2. What are managers’ perception of important job satisfaction factors for their employees and perception about their organisation’s success in achieving workforce satisfaction? For the managers themselves, what is their level of satisfaction and turnover? What training have they received and do they feel prepared for their supervisory roles? Follow up studies will address these questions: 1. When health workers leave a particular health sector position, where did they go?
• Another health sector position (public, faith-based organisation [FBO] or non-governmental organisation [NGO]? Rural or urban? )
• A position in Uganda but outside the health sector (which sector?) • Out of the workforce (death, retirement, family obligation, etc.) • Out of Uganda (a licensed health position or not?)
2. Of those current health workers who left another health position within the previous year: How satisfied were they with their previous positions? What factors drove them to leave their positions? What factors might have encouraged them to stay? Where did they go? 3. How many licensed health professionals (LHPs) left positions in the health sector since July 1, 2005? How many LHPs have left the health labour force since July 1, 2005? What are the sources of data for these figures, and where are they stored? 4. How many unfilled public sector LHP positions were announced in FY 2005 and 2006 for which active recruitment is underway? Of the positions advertised, how many were filled within six months? In what cadres are these positions? What is the turnover rate of LHPs? 5. For those LHPs who we believe have left the country, how many had their licenses verified by the council?

Retention_Study
23
Methods Study Design The methods used in this study produced both qualitative and quantitative data collected from health workers in 18 facilities across nine districts in Uganda. We were interested in each of the following dimensions of the health workers we were studying:
Table 1. Health Worker Dimensions Phase I
Human subjects approvals were obtained from the Uganda Council for Science and Technology (HS 156) and the University of Washington (06-1098-G 01), after extensive review and revisions of procedures and consent materials. Data Collection Methods We used TWO primary methods for collecting data:
1. Questionnaires were administered to three groups: those currently in health care positions in the selected hospitals (stayers), those who voluntarily left an employer since July 1, 2005 (leavers), and two groups of managers—health district directors and facility administrators (managers).
2. Focus groups in each facility: typically one with nurses, one with
physicians and clinical officers and one with allied health and pharmacy staff.
Questionnaires The questionnaires for STAYERS, LEAVERS and MANAGERS were designed to be administered either with an interview or by self-completion. In the course of data collection, they were used both ways. The decision about administration (whether with an interview or self-administered) was made by each data collection team in each facility based on how busy health workers were, what shift they were on, their personal preferences and other immediate factors.
Dimension Strata Sector Public Private not
for Profit (PNFP)
Private
Cadre Nursing Doctor Allied Health Professional
Pharmacy Clinical Officer
Geography Hard-to-Reach and/or hard to maintain
Relatively easy to reach
Gender Male Female Age Under 30 31 – 40 41 – 50 51 and over

Retention_Study
24
The majority of questions were closed-ended. However, some questions were open-ended and for these questions interviewers or respondents wrote down the answer in the space provided. Questionnaires were pilot-tested during the training session at a hospital in Kampala, and revisions were made accordingly prior to implementation of the questionnaire. Focus Groups and Interviews Questionnaires, focus groups and interviews were held in each facility, as described above. Interviews were also held with the District Directors of Health Services (DDHS), and occasionally some staff members of that office. Focus Groups Data collection teams, comprised of Uganda health professionals, were trained in how to conduct focus groups, and practice focus groups were held at the Kibuli Muslim Hospital in Kampala. Each team used the same discussion guide for its focus groups, along with consent forms approved by the human subjects offices. Consent forms were signed and collected for each group member. Copies of consent forms were provided to focus group participants. Teams selected from among themselves a focus group leader and note taker. Most focus groups were audiotaped as well. We held 56 focus group discussions across the 18 facilities. Each group was typically separated by cadre (one with nurses, one with physicians, and one with allied health and pharmacy staff). Sometimes groups were further subdivided (clinical officers alone, for example, or enrolled nurses separate from registered nurses). We were seeking to understand factors that favour retention of health workers, working conditions health workers face at the health facilities, intention to leave, factors that motivate health workers to remain on the job, and suggestions to improve conditions for health workers. We therefore asked the focus groups four broad questions, with prompts to elicit further detail: a. What makes this a good place to work? b. What are some things that aren’t as good about this facility as a place to work? c. Have you considered leaving your job here? If so, why? d. What would keep you in this job longer? Interviews When interviews were conducted with management staff, notes were taken by the interviewer. Questionnaires We developed three separate questionnaires to gather information from three distinct groups of health care providers.
• Health professionals (primarily licensed, but not always) who have not changed employers since July 1, 2005. (we will call this group STAYERS).
• LHPs who have voluntarily changed employers since July 1, 2005 (we will call this group LEAVERS).

Retention_Study
25
• District Health Directors and Hospital Administrators (we will call this group MANAGERS).
Process
• We stratified the health districts in Uganda along the dimensions of Hard-to-Reach/Hard to Maintain or not.
• Nine districts were randomly selected in each category; two facilities were then selected in each district.
• The first hospital in the district was a randomly-selected Ministry (public) district hospital; the second hospital (or, in the three cases where there is no other hospital in the district, a Health Centre IV) selected is the next closest PNFP facility.
• LHPs currently in post in those facilities were asked to complete a 30-minute questionnaire about their job satisfaction and morale, their work history, and the factors that would encourage them to stay in or leave their positions. In small facilities we often interviewed ALL health professionals, licensed or not. All Phase I data collection occurred during July of 2006.
• Our goal was at least 30 total interviews in each facility. We included workers on the day, evening and night shifts by rotating our team members.
• When health workers had voluntarily left a previous position after July 1, 2005 to take a new position in a health facility, we administered a LEAVERS questionnaire, which asked them to compare their previous job to their current job.
• Health district directors and hospital administrators were asked to provide lists of individuals who had left positions in their districts or facilities.
Hard-to-Reach The Ministry of Health offered a scoring system for designating “Hard-to-Reach” districts (see table). Our intent was to select three Hard-to-Reach districts among our nine. The cut-off we used was a score of 45, as that characterized 17 of the 56 districts in our sample (Approximately a third). Hard-to-Reach districts were defined by an algorithm developed by the MoH that included factors of security (50% of the score), distance from Kampala (10%), social amenities and utilities (10%) and proportion of the approved staff positions that were vacant (30%). The security factor was measured by the proportion of the population in a displaced persons camp. The social amenities factor was measured by the presence of a bank, grid electricity, tarmac road and tertiary educational institution. However, this posed somewhat of a problem with Sironko (Mbale) as its social amenities score placed it in the Hard-to-Reach category even though is not thought of as Hard-to-Reach and is the second largest city in Uganda. On the other hand, Nebbi could be described as Hard-to-Reach as it is in the remote Northwest district and reached via insecure roads, yet its score did not reflect this. We therefore settled on describing Apac, Gulu and Moyo as our Hard-to-Reach areas, while the districts of Kampala, Kabarole, Kibale, Mbarara, Nebbi and Mbale were not considered Hard-to-Reach. The scale itself may need to be modified for future use in order to ensure that the scores accurately identify which areas are indeed Hard-to-Reach.

Retention_Study
26
Ministry of Health Criteria for Hard to Serve / Stay/ Work / Reach Districts Variable Measurement Weight Security Aspect of insecurity including insurgency
0 No security problem 1 Moderate security problem: < 20% pop in IDP camps 2 Serious security problem: 20–50 % pop in IDP camps 3 Marked security problem: > 50% pop in IDP camps; armed escort for routine work
50%
Remoteness (District Headquarters)
Distance from Kampala (kms) 0 < 150 kms 1 150 – 300 kms 2 > 300 kms
10%
Social Amenities and Utilities (District Headquarters)
Presence of social amenities and utilities including a Bank, Grid Electricity, Tarmac road and Tertiary Educational Institution 0 3 or more of the above 1 2 of the above 2 1 of the above 3 none of the above
10%
Human Resources for Health
Proportion of approved staff positions appropriately filled with health workers 0 > 80% 1 60 – 80% 2 < 60%
30%
Total 100% Data Entry and Analysis Procedures Data entry forms were designed in Epi Info. We used the default function to determine variable names. There were three questionnaire types, each entered into a separate file: STAYERS, LEAVERS and MANAGERS. Data entry was done on four separate computers. Each computer received its own name so that we could track files on each computer (names were Kobusinge, Kaganza, Kirabo, and Sanne). All questionnaires were entered twice, and the “data compare” function of Epi Info was used to find any errors. Discrepancies between two files were resolved by reviewing the original paper questionnaires and manually entering corrections. Following the correction of all entry errors, files were combined into a single data file for analysis. The first round of quantitative analysis was performed by Dr. Hagopian at the University of Washington in Seattle, with statistical support from Dr. Stover. Subsequent analysis is planned by each member of the Workforce Retention Study Team, for purposes of writing a series of papers.

Retention_Study
27
All focus group notes, sign-in sheets, and evaluation forms were transcribed. Audiotapes of each focus group were sorted and labelled for transcription. Throughout this report, results of focus group analyses are integrated with the results from the questionnaires. The findings presented here are from 27 (of the 56) focus group discussions that were randomly selected to represent the various cadres. A qualitative data analysis software package was used to code and analyze the data, Nu*dist, also known as N6. The team at Makerere’s Institute for Social Research (MISR), headed by Dr. Neema, constructed the coding themes after reviewing transcripts of the tapes. The qualitative analysis portions of this report were provided by Dr. Neema. Qualitative Themes Text answers to our questionnaires were analyzed using qualitative software. Focus group transcripts were analyzed by a team led by Dr. Neema at Makerere University Public Health Institute using qualitative software. Quantitative Variables A questionnaire number was assigned to each questionnaire. The seven-digit number included codes for districts and facilities. The following variables were the focus of analysis, within the strata identified in the analysis plan (public/private, cadre, location, gender and age). Location factors District
Facility Ownership (public, private Catholic, other PNFP)
Region Hard-to-Reach
Demographic characteristics Age Gender Marital status Dependents Birthplace Participant job titles and work histories Training school Cadre
Job title Time in profession Time in organisation Time in job Is this a first job?
Satisfaction Working conditions
Compensation and motivation Intent to stay Intent with regard to length of time in current job

Retention_Study
28
Intent to stay in profession and in Uganda
Comparisons between Stayers and Leavers Comparisons between Managers and Employees We used the following statistical analysis approaches: Frequencies Means, medians, modes, ranges Cross-tabulations between variables Chi-squared tests of significance (p-values) Comparisons of means for continuous variables Student T-test of differences Linear regression Using the dependent variable, Q12, as a measure of overall satisfaction
on a five-point scale Logistic regression Using two dichotomous variables. Q74di describes how long a person
intends to stay in the job; the dichotomy is between those intending to leave in two years or less and those intending to stay three years or more. Q75di
Retention_Study
29
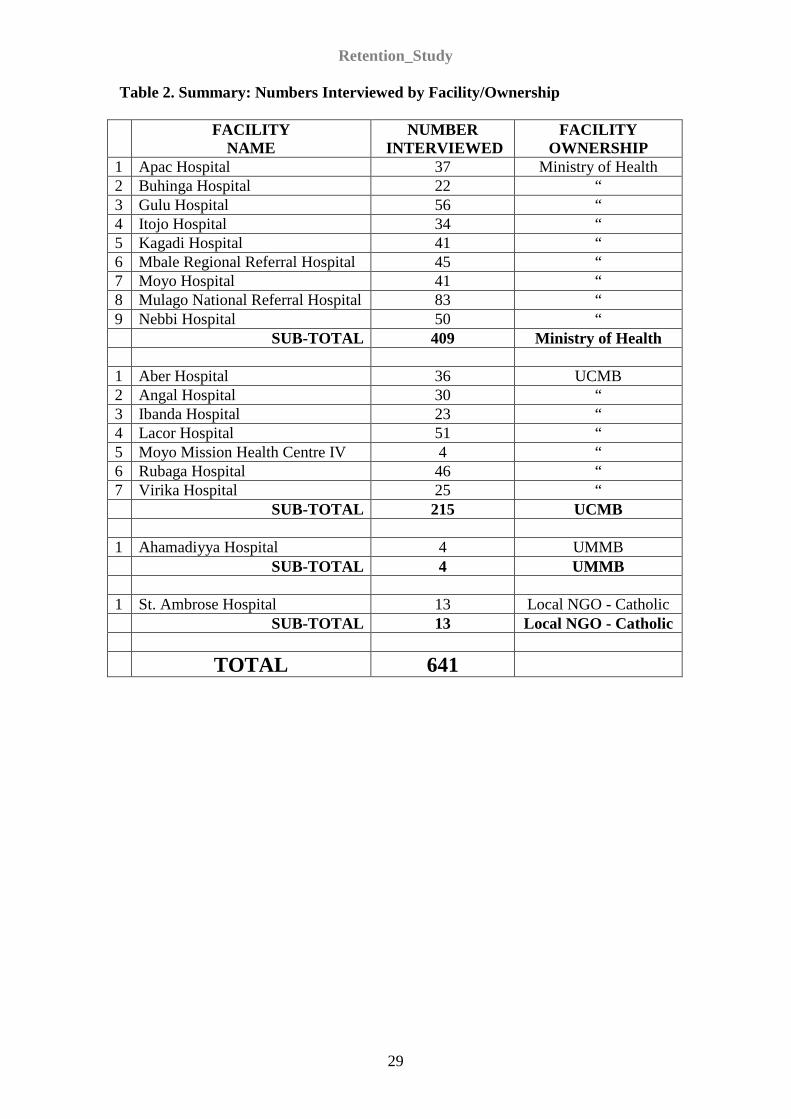
Table 2. Summary: Numbers Interviewed by Facility/Ownership
FACILITY NAME
NUMBER INTERVIEWED
FACILITY OWNERSHIP
1 Apac Hospital 37 Ministry of Health 2 Buhinga Hospital 22 “ 3 Gulu Hospital 56 “ 4 Itojo Hospital 34 “ 5 Kagadi Hospital 41 “ 6 Mbale Regional Referral Hospital 45 “ 7 Moyo Hospital 41 “ 8 Mulago National Referral Hospital 83 “ 9 Nebbi Hospital 50 “ SUB-TOTAL 409 Ministry of Health 1 Aber Hospital 36 UCMB 2 Angal Hospital 30 “ 3 Ibanda Hospital 23 “ 4 Lacor Hospital 51 “ 5 Moyo Mission Health Centre IV 4 “ 6 Rubaga Hospital 46 “ 7 Virika Hospital 25 “ SUB-TOTAL 215 UCMB 1 Ahamadiyya Hospital 4 UMMB SUB-TOTAL 4 UMMB 1 St. Ambrose Hospital 13 Local NGO - Catholic SUB-TOTAL 13 Local NGO - Catholic TOTAL 641

Retention_Study
30
Findings District and Facility Analysis As described in the methods section, nine districts were selected for participation in the study. Within each district, there were two facilities selected, one public and one private. In the very small facilities (Ahmadiyya and Moyo Mission, for example) we surveyed almost all the staff working in the facility (four STAYERS each), and in the larger hospitals we aimed for a minimum of 30 respondents per facility. Our average number of respondents outside of Ahmadiyya and Moyo Mission was 40 per facility, with a range of four each at Moyo Mission Health Centre (Moyo district) and Ahmadiyya Muslim Hospital (Mbale district) to 83 at Mulago in Kampala district. In the smallest facilities, we conducted a single focus group with the available staff. Characteristics of the Sample There were 641 respondents to the STAYERS questionnaire, with the following characteristics. Demographics Age Respondents to the survey reported they were aged between 17 and 70 years (born between 1936 and 1989). The average respondent was 39 years old, with a median of 38. Half the respondents were between 30 and 47 years old. Gender Thirty-eight percent of the respondents to the STAYERS questionnaire were male and 62% were female. Marital Status Approximately 37% of respondents reported they were single, with 63% indicating they were married. There were 39 widowed respondents (6.2%). Very few reported they were divorced (6 respondents, or 1%) or separated (14 respondents, or 2.2%). Dependents Virtually all respondents said they had dependents. Only 15 out of 606 who answered the question reported having no dependents, while the range went up to 57 total dependents. Dependents ranged in age from under one year to 96 years old. The average number of dependents per respondent was seven, with a median of six.
Retention_Study
31
Birthplace/District Almost all respondents reported being born in Uganda, with only four born in Kenya and none born elsewhere. Half the respondents (51%) reported being born in one of the nine districts in the study. The three most frequently named districts were Gulu (68 respondents), Nebbi (60) and Apac (52). Geographical Factors District and Region Regional/district respondent distribution was as follows: North: Apac and Gulu Districts, with 180 (28.8%) of the respondents. Central: Kampala with 129 (20.7%) of the respondents. Northwest: Nebbi and Moyo Districts, with 125 (20%) of the respondents. West: Kabarole and Kibale Districts, with 101 (14.1%) of the
respondents. Southwest: Mbarara/Ntungamo District, with 57 (9.1%) of the respondents. East: Mbale/Sironko District, with 49 (7.2%) of the respondents.
The Ntungamo and Sironko districts in the Southwest and East regions were newly created districts at the time the study was carried out. However the older boundaries of the original districts (Mbarara and Mbale) formed our original sampling frame. The facilities eventually chosen are now in newer districts. Facility There were 18 facilities in the sample, with half being public and half PNFP facilities. The largest facility we surveyed was Mulago National Hospital, where we had 83 respondents. The next largest numbers of respondents came from Gulu Regional (56), St. Mary’s Lacor (51), Nebbi Hospital (50), Rubaga (46), Mbale Regional (45), Moyo (41) and Kagadi (41). The next tier of respondent sizes included Apac (37), Aber (36), Itojo (34), Angal (30), Virika (25), Ibanda (23), and Buhinga (22). The smallest facilities were St. Ambrose (13), Moyo Mission Health Centre (4), and Ahmadiyya Muslim Hospital (4). The Uganda Catholic Medical Bureau (UCMB)-owned hospitals had annual reports that were helpful in describing the size of their facilities on a number of dimensions. Some of these reports also revealed interesting qualitative information, such as this comment on retention in the Virika 2004/05 report: “Loss of staff nurses and midwives to other institutions, especially local government…” The report also highlighted staffing issues in a clinic that was to distribute anti-retroviral drugs (ARVs) for AIDS treatment; “… but due to lack of sufficient medical officers, we have not been able to drastically enroll clients in the programme….”

Retention_Study
32
Sector/Ownership Almost two-thirds of the sample is employed in public hospitals (64%). One third (33%) is in the PNFP sector, with the vast majority of those at facilities operating as facilities of the UCMB. Participant job characteristics and work histories Training Schools A total of 551 participants were trained at one of 42 schools mentioned. The most commonly named institution was Makerere University (Mulago School of Nursing). St. Mary’s Lacor Hospital nurse training school was attended by 53 respondents in our sample, or almost 10%. Cadre Respondents were asked to classify themselves by cadre. Most respondents (55.4%) were in the nursing cadre. Allied health workers comprised 14.4% of our sample, with Medical Officers (physicians) comprising 10%. Clinical Officers, (who are licensed under Allied Health, but evaluated separately in this study) made up 9.1% of our sample, with 21 pharmacists (3.3%) being included. The “other” category included 50 individuals, or 8% of respondents. (Nursing assistants were classified as “other”). Job Title Respondents were asked in an open-ended question for their specific cadre type and job titles. We used the European Union’s DHRH National Classification of Health Occupations (dated 7/23/06) with ISCO codes assigned to Uganda-specific job classifications. A total of 43 job categories were listed, with the largest categories relating to various types of nursing. There were 102 enrolled general nurses, 66 registered nurses, 52 nursing officers or administrators, and 51 enrolled nurse-midwife respondents. In some cases, cadre and job title are the same thing, for example Clinical Officers (49). Time in Profession Respondents reported an average 13.5 years since they were first licensed in their professions. Almost half (48.7%) said they had been in their profession more than 10 years. Approximately one in four (25.4%) said they had been in the profession for less than 5 years. Time in Organisation Respondents reported an average 12.6 years of service with their current employment organisation (for example, the Public/GoU or the UCMB). Almost half (46%) said they had been with their organisation more than 10 years. More than a third (37.4%) said they had been with their organisation for five years or less.

Retention_Study
33
Time in Job A large majority (81%) of respondents said their current job was their first job in their profession. Respondents reported an average 9.9 years in their current jobs at their present facilities. More than a third (37.1%) said they had been in this job more than 10 years. Just under half (42.8%) said they had been with their organisation for five years or less. Satisfaction Factors Associated with Satisfaction Arguably the most valuable asset in any health system is a stable workforce of competent and dedicated health professionals. Happy, motivated, well-trained and well-supervised health workers lead to high morale, low turnover, and good health care. Negative feelings impact the quantity and quality of work, absenteeism and punctuality, and the health sector’s ability to attract clients to use its services.17 To assess health worker morale and level of satisfaction, respondents’ answers to 23 questions were analysed, to rate their agreement with (generally positive) statements about the workplace. The scale offered ranged from “strongly agree” to “strongly disagree,” with “neutral” as the middle choice.18
Morale – 54% said that the morale in their department was not good or were neutral;
Forty-nine percent of respondents indicated overall satisfaction with their job (15% strongly agreed; 34% agreed with the statement, “Considering everything, I am satisfied with my job”). Additionally, there were 15 satisfaction items for which more than half the respondents said they had a positive experience at work. These included areas of job expectations, social and community engagement, pride in the facility, recognition, relations with supervisors, and training preparation. More than half (59%) said their organisation provides protection from HIV/AIDS. Out of the 618 respondents, only 99 (16%) expressed “neutrality.” However, more than one third (35%) said they were dissatisfied with their job: 11% strongly disagreeing with the statement, “Considering everything, I am satisfied with my job” and 25% disagreeing. Those factors for which a majority of respondents were negative (or ambivalent) included:
Enjoying work – 60% said their posting was not a fun place to work or were neutral;
Supervision
17 Kreisman J. Barbara- Insights into employee motivation, commitment and retention. PhD research/White Paper, Insights Denver, and February 2002. 18 The first question asked was the primary satisfaction “outcome” variable: “Considering everything, I am satisfied with my job.”

Retention_Study
34
a. Fifty-five percent of workers reported that no one talked to them (or were neutral) to encourage their development in the six months prior to the survey, even though evidence from recent studies have shown that frontline supervisors have more power than anyone else to reduce turnover.19
b. Over 30% did not believe supervisors demonstrated a caring nature and were neither passionate about the support they received from supervisors, nor about supervisors competency, and commitment, or were neutral.
Evaluation - Approximately one third did not feel they were fairly evaluated on their work, or were neutral.
Abuse – a notable number reported abuse at work, or on the way to work, or were neutral, the majority of these being nurses and female:
o 24% reported abuse by a supervisor. o 22% reported abuse by a patient or patient’s family member. o 15.5% reported abuse from peers. o 18% reported having experienced abuse on the way to work.
When worker morale is low, service quality begins to suffer, client satisfaction drops and the threat of turnover increases20,21
We asked a number of questions about safety and security. A sizeable proportion (42%) of health workers surveyed disagreed or was neutral about the statement that their employer “takes specific measures to protect me against HIV/AIDS.”
. As a way to understand some of the factors that might energize providers, respondents were asked to indicate the extent to which they receive support from a colleague at work and the extent of their engagement to advance facility and community activities. A substantial number reported to have a good friend at work, to be actively involved in making the facility attractive to clients and considered themselves part of the community. In spite of this, there are strong indications in the data of low morale at work. Forty-five percent did not believe they receive recognition for the work they do. Over half of workers interviewed were neutral or disagreed with the statement suggesting that morale levels at their department were good, and were opposed to the statement suggesting the facility was a fun place to work (mean score 3.0). Additionally, approximately half disputed the assertion of flexibility to balance work demands and personal life. Uganda’s health system seeks to attract and retain workers with appropriate skills and training. When workers do not have the appropriate training, or there is mismatch between the jobs they are expected to do with the skills set they have, workers may become frustrated. Eighty-five percent of workers surveyed agree they know what is expected of them when they come to work and that the jobs they do match their skills and experience. Yet, at the same time, approximately a third reported they may not have the training they need to succeed.
22
19 Levin B and Thornton D - Four Factors that Predict Turnover. An examination of the Factors Affecting Talent Retention. Human R , 2003. 20 Callaghan M. Nursing morale: What is it like and why? Journal of Advanced Nursing. 2003; 82-89. 21 Attree M. Nursing agency and governance: registered nurses’ perceptions. Journal of Nursing Management. 2005; 387-96. 22 Fear of HIV/AIDS infection has been reported elsewhere as an underlying reason for attrition (CRHC, 2004).

Retention_Study
35
Other studies have found that workers quit their job in response to abuse or harassment23,24
Working Conditions
. We asked about physical, emotional and verbal abuse by supervisors, patients/patients’ families, peers and on the way to work. In our study, one in four workers stated that they had been subjected to abuse by a supervisor. Approximately one in five reported abuse by patients or patients’ relatives (21%). Fewer reported abuse by peers (16%) and while travelling to and from work (18%).
Approximately half the respondents (52%) said they were satisfied with job security. Access to drugs and medications was satisfactory for 57% and half of them (51%) said they had the supplies they needed to do their jobs well and safely. A majority expressed satisfaction with access to water at work (66%) and home (71%). However, fewer than half were satisfied with access to equipment needed on the job (48%), or access to electricity (49%). Only approximately a third (36%) agreed that the workload was manageable and only 31% said they had (enough) time to eat lunch during their workday. Focus Group Discussions (FDGs): Health workers “defined” a good working environment was as one where facilities are functional, with good access to equipment and supplies. Adequate hospital supplies, such as gloves, syringes and drugs were reported as necessary to enable health workers to execute their duties diligently. Availability of electricity and safe water were also mentioned as important. Examples of FDGs in which health workers reflected positively on working conditions include: Lacor Hospital, where nurses and midwives reported that they appreciated having
enough supplies and equipment, such as gloves, syringes and a functional x-ray unit, which enabled them do their job well. They also expressed appreciation for a reliable flow of clean water and electricity and reported that the transport facilitation given for outreach and referral patients took services nearer to the people.
Ahmaddiya, Aber and Moyo health facilities, where an adequate and regular drug supply was reported.
Mbale Hospital, where health workers indicated that the equipment available was adequate (Mbale is a referral hospital).
Utilities, however, often presented a different picture, with electricity and water generally being described as mostly lacking. Health workers reported that most of the health facilities had problems with running water and that flushing toilets were non-functional; in some facilities this problem had been long standing. Water-related problems were mostly reported in the facilities in northern Uganda. 23 Tepper, BT. Consequences of Abusive Supervision. Academy of Management Journal. 2000; 178-90. 24 Terpstra D and Baker D. The identification and classification of reactions to sexual harassment. Journal of Organizational Behavior. 1989; 1-14.

Retention_Study
36
The bathrooms are there but they are blocked because of lack of water. They are non functional. The taps are broken and no water flows, yet we do not have outside toilets.
Nurse, Public Health Facility While some hospitals had a full time power supply and stand-by generators, most facilities were affected by frequent load shedding, or the deliberate shutdown of electric power to prevent system failure due to high demand, (a nationwide problem), with no alternative power source.
We carry out operations but we do not have theatre lights. We recently had a problem when we carried out one without lights. After complaining we were given a tube. Even in the whole ward there are not enough lights.
Doctor, Public Health Facility
Health workers further reported that equipment, otherwise deemed as available, was often engaged in other activities.
We have a vehicle used as an ambulance and at the same time used for running up and down.
Allied Health Workers, Public Health Facility Supplies, Drugs and Equipment Most FGDs reported inadequate or unavailable hospital supplies, drugs and equipment, which makes work difficult and also serves to de-motivate the staff; many expressed a feeling of worthlessness, as the equipment they required to do their work was not kept in working order. In one hospital, for example, allied health workers reported that there had been no x-ray machine for two years. Other respondents reported that, although equipment was available, the operating theatres were non-functional, as the facilities did not have the qualified personnel to conduct surgeries. There were also a number of hospitals that reported insufficient access to drugs, including ARVs. However, others reported an improved/now regular supply. Some facilities reported an insufficient number of beds in the wards, resulting in overcrowding (patients sleeping on the floor), and the increased risk of infection – no isolation rooms in some hospitals. Other facilities lacked certain wards entirely - an example being Itojo Hospital, which reportedly lacked orthopaedic, gynaecology and surgery wards.
It is a really Katogo (“mix up”) due to overcrowding and congestion.
Nurse, Public Health Facility
We have causality but no emergency kit. You can’t save a person who has had injury. We just need some of these things.
Doctor, Public Health Facility
Retention_Study
37
Health Protections Although more than half (59%) of the respondents to the questionnaire said their organisation provides protection from HIV/AIDS, focus groups indicated that staff protection, from infections such as TB, was generally inadequate. Additionally, the lack of appropriate protective gear (gumboots, overalls, helmets, etc) exposed health workers to increased risk of infection and where gear was available it was reportedly not up to date. Living Conditions Living conditions at home were no better than working conditions at the hospitals. Seventy-five percent expressed dissatisfaction with transportation to work, and 65% were dissatisfied with access to schooling for their children and access to shopping and entertainment where they live, as well as access to electricity at home. In spite of the relatively high level of dissatisfaction expressed for their living conditions, focus groups revealed a number of “personal-commitment” and other factors which discussants found important. These included ties to community and family, tolerance, and “God’s call.” Many health workers in rural districts reported they appreciated working in their own locality for a number of reasons: There were no language problems. Easy access to their relatives and other members of the community - staff who
stayed in their home areas reported they can look after their families more easily, on the little pay they get.
More able to afford to take their children to school. Access to less expensive foodstuffs for their families.
The locality of this hospital being so rural you will agree with me food is very cheap and it is available. This is a very big factor. Due to the meagre resources we are getting by virtue of it being in a rural place we can afford food.
Clinical Officer, Public Facility
For me I have worked here for four years and here is my home and I am able to help my people. So I feel happy to work at home.
Nurse, NGO Facility Accommodation The availability and quality of accommodation was another important factor mentioned by focus groups. It was reported as common for staff to live in single-roomed accommodation, inadequate and certainly unsuitable for any family. Health workers said that the search for better and more spacious accommodation was one of the more important factors they would consider in leaving their jobs.

Retention_Study
38
Issues related to accommodation were found to be an especially important factor in those areas that had been affected by war, as well as to those who supported many dependants. Other non-facility-specific issues discussed as part of health worker living conditions included: Security: Health workers said that the risks involved in working in war-zones was
an important reason to change jobs and/or location to safer places. Family Separation: Some, staying away from their families, said they wanted to
change from their current job to one where they could stay with their families. Children’s Education: Many expressed the wish to move to locations where they
could access better performing schools for their children. Remoteness: Some facilities were reported as being too remote and difficult to
work in.
As far as education is concerned some of our children, we can say, they can move from one place to another to look for other good schools were we feel they should perform better.
Allied Health Worker, Public Facility Compensation and Motivation A very small number (11.3%) said they felt their salary package was fair, and less than a third reported that their opportunities for promotion with their employer were sufficient. A very large majority (87%) said their salary was “very important” - the same number also rating terminal benefits (retirement, pension, etc.) as equally important. Even more important than salary, however, was health care for family members, which ranked highest out of all the “important compensation factors to be offered by an organisation” - by 90% of respondents. FGDs indicated provision of (better) benefits as very important in considering facilities as being “good places to work in.” Good accommodation. Accommodation allowance. Lunch. Risk allowance. Transport allowance.
Salary All groups acknowledged the problem of low salary and the fact that salaries were disproportionate to the workload; they also complained of the lack of an overtime payment system. Many also described their salaries as often being paid late and “overtaxed, without explanation.”
They can even take two to three months without paying us.
Nurse, Private Facility

Retention_Study
39
Health workers felt there was some discrimination in the way salaries were set. Several groups complained that they were set “individually” (seemingly at whim), as opposed to being set according to cadre, level of experience, workload, etc. They also reported that salary increments were infrequent and/or non-existent, even after many years of service. When and where there had been salary improvements, they were not across the board and the criteria used for salary increases were not known, causing a great deal of dissatisfaction, especially amongst those who had served longer.
There are no benefits at all but I have remained stagnant. You see here the young ones come and you receive the same salaries with them……..I think we are on the same salary scale like the young ones who just came the other day
Nurse, Private Facility It was mentioned that health workers work tirelessly and are not rewarded. Many become de-motivated. So it was suggested that excellence in performance should be rewarded. This would be grounds for promotion and scholarship for further studies and that would encourage health workers. However, a certain amount of transparency would be required to make this work. Regular salary payments were also reported to be motivating. Also, job security in some public facilities was seen by a few groups to be a motivator to stay. Accommodation Lacor Hospital was cited as an example of a good facility to work in because of the benefits provided, which include:
1. Accommodation: Being on the hospital premises where health workers are readily available for consultation.
2. Loans Facilitation and Salary Advances: Through this system some staff members have reportedly managed to build their own houses; many nurses in Lacor Hospital who have built their own houses are now able to stay outside hospital premises.
They try to provide accommodation to as many staff as possible. Those who do not stay inside (not housed) are given allowance for house rent.
Nurse However, the majority reported that adequate accommodation and/or housing allowances were not provided and, where available, the accommodation was generally in a poor state of repair. Some reported to be living in grass thatched houses without electricity, water or toilet facilities - the overcrowding and poor sanitation increasing the already high risk of infection and epidemic outbreaks amongst health workers and their families.
Working here is a torture. Things like accommodation – staff are not accommodated. I wish you were taken where we stay, you would even ran away. The conditions of staff accommodation are very poor.

Retention_Study
40
Allied Health Worker
Other motivating factors discussed included provision of school fees for their children and life insurance. Job Security Only half of the health workers (51%) responded positively to the question, “I feel I have job security”: Public Facilities 58% UCMB Facilities 44%
Focus groups also discussed job security, citing lack of it as an important reason for leaving a current job. This was especially so for staff who had not been confirmed in service and those who felt they did not have adequate opportunity to upgrade. Some health workers expressed the hope that, with a change in workplace, training and educational opportunities would improve, due to being under different and presumably better management. A minority said they hoped for the necessary training to enable them to change their career completely: politics was mentioned as a desirable option. Health workers in private/NGO facilities complained that they are not treated like their counterparts in Public/GoU hospitals. Examples were mentioned in which they were not given proper terms of service, proper job descriptions, or a clear understanding of the salary scale. Cases of “victimisation” were also reported, which often took the form of retaliation – refusal to produce a release letter for example, after the employee had secured a public sector job.
We work with no contracts so we are not sure of tomorrow.
Nurse, NGO Facility
The other problem is job security, in most cases you don’t know where you will go, they can fire you at any time, the other thing is promotions are rare, salary increments are not there, then also the public relations.
Physician, NGO Facility Management and its Role in Employee Satisfaction and Retention Management and supervision of employees presented a mixed, but similar picture, in both public and UCMB facilities. Sixty-one percent said their hospital manager was competent and committed and that their immediate supervisor cared for them as a person. Almost 70% said their supervisor was available when they needed support. However, less than half (45%) said that someone had talked to/encouraged them in the last 6 months. Good management and supervision were also mentioned by several focus groups as important to job satisfaction. The overall view was that facilities with friendly staff and supervisors fostered team work, good communication and cooperation amongst staff and with the community.
Retention_Study
41
I think it is a good place to work in because there is cooperation with top officials except a few loopholes where there is some pressure; otherwise generally people do not complain too much.
Nurse, Public Facility Staff expressed appreciation for the opportunity to participate in regular meetings to discuss issues pertaining the running of the facility; eighty-seven percent said they felt actively involved in “helping to make the facility great.”
I must really say that one of the things that bind us together as health workers is team work…. We always try to work together. We need each other for better services.
Doctor, Public Facility
Lack of respect and recognition however, were identified as factors that made work unpleasant. To the question, “My opinion seems to matter at work; I am respected,” the respective facility responses were: Public Facility 70% UCMB Facility 60%
The same lack of respect was commonly mentioned in focus groups, a majority expressing a lot of dissatisfaction about the lack of appreciation and recognition by management for the (high) level of their sacrifice and commitment. Lower level cadres, such as enrolled nurses and nursing assistants, reported that they are assigned night duties as a token of disrespect. They also reported other expressions of disrespect, such as calling them names like “pink panthers,” a reference to the colour of their uniforms.
Amongst those who expressed a desire to leave due to management-related factors, most reported poor administration, lack of respect for subordinates, rude behaviour and negative criticism as the primary reasons. A few of the groups reported “corruption in the system and political interference” as drawbacks in the management system. Workload Workload was the most common problem expressed by staff, in nearly all facilities, during FGDs. Sixty-five percent of health workers indicated that their workload was too heavy/unmanageable, as evidenced by their responses to the statement, “Workload is manageable.” They also said that heavy work load, with little pay, was one of the important factors influencing their desire to leave their current place of work. Staff–to-patient ratios were reported as very low, with many facilities being chronically understaffed. Some facilities reported having no doctor, or having only one doctor who was overworked. Another problem caused by understaffing was the fact that specialists or more highly qualified staff often “wasted their expertise providing basic care.”

Retention_Study
42
The ratio of doctor to patient is approximately 14,000 patients (1:14,000) and there is no way we can offer quality services with few doctors.
Doctor, Public Facility
All of us are really sick of understaffing. I noticed a big problem but considering the regional status you find they are two in your department. I am the head and I am alone. You find the workload is really too much. You also need personal time which isn’t really there. So staffing can’t be underscored here. It needs to be looked at in a special way. We are overworking.
Allied Health Worker, Public Facility Health workers often reported to work very early in the morning and left late, without overtime or pay for extra load. The long hours and heavy load were a cause for concern because of the resulting poor quality services provided, as well as the tendency for staff to take short cuts with precautionary measures designed to protect their own health.
When you are overworked, at times you don’t even take much precaution, what you know is to finish your work and go home….We are understaffed when you are tired surely you cannot protect yourself, you always aim at finishing, and you may not even end up rendering quality services as well as infecting yourself. At the end of the day when you are tired you dump needles any how and so on.
Nurse, Public Facility Professional Development, Continuing Education and their Role in Job Advancement The vast majority of health workers (96%) said they knew what was expected of them at work, and 64% said they had the necessary training to succeed in their job. Yet, focus groups further stressed the importance of continued professional development; training opportunities, continuing education, career motivation and opportunities for workshops and seminars - factors seen as highly motivating. However, most groups reported that training opportunities as rare, especially for those up-country, and said that information about Public/GoU scholarships was not readily available.
If you went to the Ministry of Foreign Affairs, or the Health Manpower Development in Ministry of Health you will find that there are so many scholarships that have expired, and they have not been advertised, and yet so many people have tried to chase these things and failed. For my case I have tried to chase these things for the past 14 years. Sometimes I would reach a place and I know that this scholarship is there and everything I am aware of it, but they say sorry we cannot sign your contract.
Doctor, Public Facility Cases in which staff returned from training (especially nurses) and were promoted were reported as having encouraged others to enroll for further studies. However, there were other examples mentioned in which staff used their own means to support themselves through further studies, only to return and find that the district was unable to absorb them into a higher position. Physicians who found alternative non-
Retention_Study
43
traditional means of support or supported themselves for further training were reportedly less likely than other cadres to return to and work in Uganda. Confirmation of position and promotion, which were also mentioned during discussion about job security and management, were again mentioned by focus groups who said that there were many instances of staff not being confirmed in service after probation in spite of meeting the required standard(s). Staff promotions were also said to be held up indefinitely in some cases, in spite of having the demonstrated competence and required length of service for the promotion(s). Referral Capacity Focus groups in referral hospitals said that their facilities tended to be better organised, with greater administrative, technical and financial capacity: they also appreciated the access to specialists, such as gynaecologists, surgeons and physicians. Such facilities were also reported as having better infrastructure, equipment and supplies, which facilitated the work of employees, as well as being able to provide more benefits such as housing and allowances (for overtime). In some places, recognition for good work, by way of small presents and certificates, was shown and appreciated.
Well, when we hold our annual party which we usually have every year some members of staff definitely get recognized by way of small presents here and there, they get some recognition here and those are some of the things that motivate us, even that annual party by the way is a motivator, because we get together out of the hospital setting and we do not hold the party within the hospital premises, we get out, so it’s a motivating factor, we usually invite somebody from the Ministry of Health – our bosses – to come and share with us and socialize.
Doctor, Public Facility Reasons to Leave the Job Respondents were asked to consider factors that could make them decide to leave their current job. The five most important were:
1. Low pay 82% 2. Poor access to higher education 67% 3. Limited opportunities for promotion 61% 4. Poor educational facilities for children 57% 5. Lack of housing facilities 55% 6. High cost of living 55%
Frustrations for approximately half of respondents included poor access to supplies and equipment at work and lack of utilities at work (49%). Although the study (Phase I) found that salary was the leading factor in making the decision to leave their jobs for over 80% of respondents, health workers did not report salary as being the most important compensation factor: this was found to be family health care.

Retention_Study
44
In order to understand factors that would encourage health workers to stay on the job, focus groups were asked what would keep them in their current job longer. Most of the groups reported issues to do with (i) salary increment; (ii) opportunities for further studies/training; (iii) human resources; (iv) job security; (v) basic amenities; and (vi) reasonable workload. When asked if they were considering leaving their current job, most respondents reported that if their situations remained unchanged, they would leave the current job. Focus groups also revealed that staff in PNFP hospitals believed it was more secure to work in Public/GoU hospitals, although there were some in Public/GoU hospitals who wished to change to private health provider (PHP) hospitals, which they believed paid more highly. Some staff expressed a concern with political interference in their work as a contributory (but not significant) factor in deciding to leave.
Intent to Stay Of those who might consider leaving their current job within three to five years from the time of the survey, 19% prefer to either stay with the same organisation but switch to another location, while 24% said they would switch to another employer in Uganda. Only 11% said they would consider taking up a job outside the country. Physicians are more likely to consider changing jobs. More than half of the physicians in the sample intend to stay in their current jobs for two years or less. Workers who have less than five years of experience, fewer years of tenure at the facility and were working for FBOs or NGOs are more likely to consider leaving their jobs within the next two years if the opportunity arises. Managers’ Views
The UCMB obtained and analysed data on 495 health workers who left its employment in Fiscal Year 2005/06. Their findings were that more women (70%) than men left during the period, with most of them (72%) being 30 years or under. The five main reasons, in order of magnitude, given for leaving were: salary, ambition for better positions, the desire to go to the public sector, further studies, and domestic/personal reasons. The leavers profile was as follows: Enrolled Nurse-Midwives 46.0% Physicians 11.5%
o Medical Officers 11.1% o Interns 0.4%
Clinical Officers 10.1% Registered Nurses 9.1%

Retention_Study
45
A separate questionnaire for managers, at both the hospital and district levels, was used requesting that they rate a number of factors both on how important they felt those factors were to employee satisfaction and how well they (managers) thought their organisations performed on these factors. There were slightly more male managers (64.4%) than female, and approximately two-thirds (67%) were 41 years old and above. Almost half (47.5%) had been in management positions for at least 10 years. On average, they had been in their organisations for 16 years and in their current jobs approximately eight years. More than a quarter (29%) was trained as nurses and approximately the same number (27%) as clinical officers and one third of them (33%) worked in the District Medical Officer’s office. Most (73%) were married, with an average 7.9 dependents. Thirty-three percent of the managers interviewed worked in Hard-to-Reach areas. Job Satisfaction: Although a very large majority of managers (82.5%) said job satisfaction was “very important,” only 13% felt their organisations performed “very well” on this indicator. Other areas where there were big discrepancies between importance of the factor and self-rated performance included recognition of and rewarding good work, overall morale, and making the workplace enjoyable and stimulating. Compensation Factors: There were also discrepancies seen in the ratings, as judged by managers and employees, of the various compensation factors. Ninety percent of employees felt health care was the most important compensation factor compared to 74% of managers who viewed this as very important. Managers thought employees felt salary was the most important factor (97% of managers rated it “very important” compared to 87% of employees). Only 56% of managers thought that employees felt that assistance with transportation was very important, compared to the 77% of employees who said it was. There was a similar discrepancy for food allowances. Reason for Leaving: Employers were asked to rate the importance of a number of factors in the loss of any employees in the recent year. Similarly, employees were asked to state the importance of a number of factors in their consideration of leaving a position. In all cases managers rated each factor as less important than employees did. Low pay was listed by both groups as the primary reason for leaving, with higher education and promotion opportunities following closely. However, managers rated the importance of educational facilities for children well below that given by employees: twenty-four percent of managers considered this very important, as compared to 56% of employees. Working Conditions: Managers were also asked to report their own satisfaction on a number of factors, as well as how they judged their employees’ satisfaction. Managers were most satisfied with access to water at home and work, access to supplies, their workload, and safe transport to work. They judged their employees would be most satisfied with supply availability, water at work and home, workload and access to equipment. The only factor where managers judged employees would be significantly more satisfied than themselves was in the area of “opportunities for promotion.”

Retention_Study
46
Organisational Performance: Factors where managers felt their organisations were performing better included placing people in suitable jobs (49%), taking measures to protect workers against disease (49%), training (37%), preventing harassment by supervisors (32%), creating flexibility for employees (32%) and valuing and respecting each worker (30.5%). Satisfaction and Intent to Stay by Key Areas Gender Most physicians (90%), allied health workers (83%) and clinical officers (78%) were men; eighty-nine percent of nurses were women. More women (85%) than men (74%) were still in their first jobs, although the average age of men was no different from women (39 years). Women had been in their jobs an average of 10.3 years, compared to men at 9.2 years. Women had also been with their organisations longer than men; 13.2 years and 11.6 years respectively. Women had also been in their professions longer, an average of 14 years, compared to 12.8 years for men. With regard to “satisfaction by gender,” there were not many areas where men and women respondents varied significantly in their views. The areas where there were differences, however, were important. Women were more likely to say they felt attached to their facilities in a social
and emotional way. They were also more likely to say there were actively involved in helping to make their hospitals “great health care facilities” and report that they would encourage their friends and family to seek care there They were also more likely to consider themselves a part of the community.
Women reported a slightly higher level of abuse than men; by a supervisor,
patients, or patients’ friends and family members. Men were more likely to report they had (enough) time for lunch at work
“almost every day” and that the workload was manageable. Women were more likely to indicate:
o That they had access to safe, clean water at work and at home. o That they had the equipment or supplies they needed to do their jobs.
Women were also more likely than men to report that salary was very important to them, as were all the other components of compensation. The fact that 43% of women were single, as compared to 21% of men, and thus presumably supporting themselves on a single income may have some bearing on this.
In general, women were more likely to say they would leave their current job
because of unfavourable working conditions:

Retention_Study
47
o Women reported a greater likelihood of leaving over the issue of poor access to water or electricity at work.
o Women indicated a higher likelihood of leaving their current jobs over the issue of workload.
Age The average respondent was 39 years old, and this average age held across several categories of interest including marital status, still in a first job, and three of the five cadres while physicians had an average age of 36 and pharmacy staff 43 years. The overall “satisfaction-level” registered by older respondents was greater than that for younger ones and there was a progressive increase in “satisfaction-levels” for each successively older group. It is interesting to note, however, that older respondents expressed less satisfaction with regard to access to equipment and/or drugs. Older respondents (aged 41 and above) were far less likely to indicate intent to
leave their job within two years, leave Uganda or leave the health profession. Attachment to the facility and the community tended to be stronger in the
older age group and relationships with supervisors were better. Older respondents reported more recognition for good work.
Older respondents also said they had a higher degree of satisfaction with
respect to their terminal benefits. Location Birthplace/District Health workers are likely to be working in the regions where they were born, except in Kampala (Central region). Hospitals that organize their own training schools often reap the benefits by employing their graduates. Hard-to-Reach There are not significant differences among health care worker profiles in Hard-to-Reach areas compared to those working in “easier” to reach areas. While workers are more satisfied in some Hard-to-Reach areas, there are others in which they are not. The pattern is not particularly meaningful. Sector There are some fairly significant profile differences of workers in the public and private sectors. Public sector workers are older (average age 42 compared to 35), have been in their jobs longer (three years compared to 2.5 years), and with their organisation longer (15 years compared to eight years). They are also more likely to be male (43% compared to 29%), married (70% compared to 51%) and have more dependents (7.7 compared to 5.6). Private sector workers are more likely to be in their first jobs (86% compared to 79%).

Retention_Study
48
There is no difference between public and private sector workers in regard to overall satisfaction, but there are significant differences in measures related to working conditions. Working conditions were consistently rated more highly by private sector workers, with statistically significant differences measured for the availability of supplies, equipment and drugs, utilities, transportation, and time for workers to eat lunch. The public sector does better on flexibility to balance home and work demands and having supervisors who care about them. Morale is more highly rated in the private sector. The public sector rates better on compensation factors including salary, retirement, food allowance, assistance with transportation and job security. Private sector workers are largely associated with UCMB facilities, but there were two other facilities (with small employee counts) in our sample. A large majority of public sector workers said they intend to stay in their jobs three years or more (81%), with smaller majorities in the Catholic facilities (67%) and the other facilities (54%) saying they would stay that long. On the other hand, public sector workers who do intend to leave their jobs say they are more likely to leave Uganda or the health sector than their private sector counterparts. While 10% of Catholic workers say that if they left, they would leave the country or the health field, the percentage jumps to 18% for public sector workers. When asked for reasons to leave their current job, public sector workers cited more significant concerns about access to supplies, utilities, opportunities for promotion, communication problems, lack of housing and the high cost of living. The private sector scored worse only on concerns about poor supervision and management. In the focus groups, it was revealed that Christian hospitals were thought to promote spiritual development, creating familial bonds among staff and between staff and their clients. This was reported to enhance honesty, kindness, collaboration and transparency. Such health facilities were considered to be supportive to the community in that staff worked without bias or discrimination toward their patients. This acceptance and spiritual foundation may promote better care for the poor, especially pregnant women and children.
We can be given credit for helping the needy….they come and don’t pay …. We give them care and treatment…… we feel happy about it.
Nurse, Hard-to-Reach, NGO Cadre Physicians Physicians, compared to the other cadre in our study, are the group most likely to say they are eager to leave their jobs within two years (57%) and most at risk for leaving Uganda or the health sector (46% said they would leave if they could). Only 37% said they were satisfied overall with their jobs, and physicians had the lowest satisfaction ratings on a number of individual job satisfaction measures.

Retention_Study
49
Most physicians in the study were male (90%), and most were married (61%). The average number of dependents per physicians was 6.5. Most physicians were in their first jobs (58%). On average, physicians had been in their professions almost 10 years, with eight years average employment with their current organisation. On many objective measures, physicians reported the fewest complaints, such as the best access to utilities at work and at home, and least likely to report abuse from supervisors, peers or patients. Nonetheless, they were the cadre reporting the lowest satisfaction ratings on 16 separate measures. For example, physicians were significantly lower than other cadres in their ratings of morale in their units (average 2.9 on a scale of five), receiving recognition for doing good work (2.8), or feeling they have the flexibility to balance the demands of work and personal life (2.8). They reported the lowest ratings on having the supplies they need to do their jobs well (2.8), or that their facilities had good access to drugs and medications (2.9). Clinical Officers Most clinical officers intend to stay in their jobs, with 23% reporting intent to leave within two years. Approximately 18% expressed intent to leave Uganda or the health profession. Clinical Officers in the study were mostly male (78%) and most were married (74%). The average number of dependents per clinical officer was 7.9 (the highest of any cadre). Most clinical officers were still in their first job (87%), more than any other cadre, despite having the same average age as other allied health workers and nurses (39). This subset of allied health workers had been in their professions an average of 13 years, in their organisations a total of 12 years and in their current facility almost nine years. Clinical officers had an average job satisfaction (3.1 on a 5-point scale) slightly higher than other allied health workers and higher than physicians, but lower than nurses or pharmacists. They were quite likely to say the job was a good fit for them (4.2 on a 5-point scale), and they were the most likely cadre to report that they know what is expected of them when they come to work. On the other hand, they were the cadre most likely to leave their current job because of the issue of limited opportunities for promotion, and had the greatest concerns about housing accommodation and the cost of living. They were also the most concerned of any cadre about the lack of access to higher education. This cadre was most likely to say they would encourage their friends and family to seek care at the facility where they work. They were also most likely to say they had the equipment they needed to do their jobs.

Retention_Study
50
After nurses, they were also the ones most likely to say they had been abused in some way by a supervisor. After physicians, they were the least likely to say their salary package was fair. Some responses were inconsistent. While clinical officers were most likely to say they have the flexibility to balance the demands of work and family, they were also the least satisfied with their workload. Nurses One in five nurses (20%) intends to stay two years or less in their jobs, and this is the cadre least likely to report an interest in leaving Uganda or the health profession (10%). Nurses are mostly female (89%) and are an average 39 years of age. They comprise the cadre least likely to be married (57%), perhaps because some portion of this group includes Catholic sisters. They had an average 6.8 dependents. Most nurses (85%) were still in their first jobs, and they had an average 15 years in the profession, 13 years with their organisations, and 10 years in their facilities. Nurses were the cadre most likely to say the job was a good match for their skills and experience. They were also the cadre most likely to say the organisation takes measures to protect them from HIV/AIDS high at 3.5 on a 5-point scale. Satisfaction with opportunities for promotion was highest for this group at 2.8 on a 5-point scale. Importance of compensation was also the highest (2.9 on a 3-point scale), compared to other cadres, perhaps because 43% are presumably the heads of their households without spouses. Respondents who were nurses were most likely to report being abused by a supervisor and tied with pharmacy staff for abuse by peers. Nurses were most likely to report a high workload as a potential cause for leaving their job, along with poor management. Allied Health Allied Health workers include health assistants, health inspectors, lab assistants/technologists, social workers, theatre attendants, vaccinators, and dental assistants. More than one in four allied health workers (27%) expressed intent to leave their jobs within two years and 12% were at risk for leaving Uganda or their health profession. This cadre was mostly male (83%), age 39 on average, 83% married, and had an average 7.4 dependents. Three in four (74%) reported still being in their first jobs, with 13 years in their professions, 11 years with their organisations, and nine years in their facilities.

Retention_Study
51
Their satisfaction on the job did not seem to differ much from other cadres. They were the most likely to say they had been given the training needed to succeed. Compared to others, they were most likely to say their workload was manageable. Pharmacists Pharmacists reported being the least likely to leave their jobs within two years, yet 20% (more than nurses, clinical officers or allied health workers) said they would leave the health sector or the country of Uganda if they intended to leave their jobs soon. Pharmacists are the cadre most likely to report job satisfaction (3.7 on a 5-point scale), and the most likely to report they receive recognition for good work. They were also the most likely to report satisfaction with their supervisors and that their opinion matters at work. Pharmacists said the morale in their departments was the highest of all the professions (3.5 on a 4-point scale). They were most likely to consider themselves a part of the community and the most likely to feel they had been fairly evaluated. Despite the highest job satisfaction, pharmacists were the most likely to report being abused on the job by patients or patients’ family members. The average pharmacist scored 3.8 on satisfaction with access to drugs and medication (on a 5-point scale), the highest of the cadres. They were also the most likely to report job security. They were least likely to say there were sufficient opportunities for promotion. Pharmacists had the oldest average age of all the cadres (43 years), and two in three (67%) were male. Approximately 62% were married, with an average 7.6 dependents. Like the other cadres, most were in their first jobs (84%). They have been in their professions an average of 16 years, with 14 years in their organisations and nine in their facilities.

Retention_Study
52
SECTION II Background The findings of Phase I of the study were presented in several fora, including at the Senior Management Meeting (SMM) of the Uganda MoH. After presentation of the results, the MoH then requested that Capacity Project/Uganda introduce a “deliberate selection bias,” conducting a similar study to obtain information from facilities of the Uganda Protestant Medical Bureau (UPMB) and Uganda Muslim Medical Bureau (UMMB). The information obtained in Phase II of the study would be useful to the MoH for purposes of planning within the whole health sector. Methodology Study Design The methods used in this study produced both qualitative and quantitative data, collected from health workers in eight facilities across seven districts in Uganda. The study focused on each of the following dimensions of health workers: Table 3. Health Worker Dimensions: Phase II
Data Collection Methods The method used for collecting data was by administration of the same (STAYERS) questionnaire used in Phase I of the study. Questionnaires were administered, either by interview or by self-completion, to health workers currently in health care positions in the selected hospitals.
Dimension Strata Organisation Uganda
Protestant Medical Bureau
Uganda Muslim Medical Bureau
Cadre Nursing Physicians Allied Health
Professionals
Pharmacy Clinical Officer
Geography Hard-to-Reach and/or
hard to maintain
Relatively easy to reach
Gender Male Female Age Under 30 31 – 40 41 – 50 51 and over

Retention_Study
53
The Study Process Six districts, out of the nine districts randomly selected for Phase I of the study, were selected for evaluation in Phase II. They were purposefully chosen upon the advice of the relevant medical bureaus, to ensure the selection of UPMB and UMMB facilities of at least Health Centre (HC) III capacity, a sub-country level facility with a catchment population of 20,000. LHPs working in the selected UPMB and UMMB facilities were interviewed. The number of health workers interviewed in each facility depended on the size of the facility. All data collection took place in May, 2007. Data Entry and Analysis Procedures Data entry was done on one computer. The same data entry and analysis procedures used in Phase I were used in Phase II of the study. The same quantitative variables used in Phase I, described in Section I of this report, were used for the Phase II analysis, as were the same statistical analysis approaches. Limitations of the Study There are limitations to this phase of the study. The study protocols used were not exactly the same as for Phase I of the study. The districts were not randomly selected; they were chosen from amongst the nine districts selected for Phase I, and were purposefully selected to ensure a given number of “suitable” UPMB and UMMB facilities. The facilities selected for Phase II of the study were mostly HC III-level facilities, which are smaller than the hospitals selected in Phase I, and with a lower catchment population. Only two of the facilities selected were UMMB facilities and the numbers of UMMB health workers interviewed were small. Therefore, data analysis and interpretation of the results may have been affected.

Retention_Study
54
Table 4: Summary: Numbers Interviewed by Facility/Ownership Phase II FACILITY
NAME NUMBER
INTERVIEWED FACILITY
OWNERSHIP 1 Amai Community Hospital 19 UPMB 2 Kuluva Hospital 26 UPMB 3 Mengo Hospital 59 UPMB 4 Kumi Hospital 41 UPMB 5 Ruharo Mission Hospital 17 UPMB 6 Ishaka Hospital 24 UPMB SUB-TOTAL UPMB 186 UPMB 1 Saidina Abubakar Hospital 5 UMMB 2 Oriagin Hospital 12 UMMB SUB-TOTAL UMMB 17 UMMB TOTAL 203
Findings Characteristics of the Sample There were 203 respondents, with the following characteristics: Demographics Respondents’ age ranged from 14 to 79 years, the average age being 35 years. The majority of respondents (59%) were female and 57% were married. The women (average age 33 years) were younger than the men (average age 37 years). Almost 43% of the respondents were aged 30 years and below, with slightly more than 75% being 40 years of age and below. More respondents were born in the Central region than any other: Central Region: 23.2% East Region: 21.2% Northwest Region: 20.7% Southwest Region: 18.2% North Region: 9.1% West Region: 7.6%
Forty-eight percent of health workers interviewed worked in the region in which they were born.

Retention_Study
55
Job Characteristics and Work Histories The majority of respondents (57%) were nurses, followed by Allied Health Professionals (13%). Medical Officers (physicians) made up less than four percent of the sample. Most health workers interviewed (75%) were still in their first job, with 46% having spent less than five years in the health workforce; only 28% had more than 10 years of experience in the health workforce. 56% of the respondents had worked with their umbrella organisation (which may
be comprised of several different facilities) for less than five years. Approximately 61% had spent less than five years working in the specific facility
in which they were interviewed. Satisfaction Only 51% said that they were satisfied with their job. However, the majority responded positively to statements related to factors associated with satisfaction. More than 90% saw themselves as actively and closely involved in the development of their facility and also considered themselves a part of the community. Ninety-eight percent said they knew what was expected of them with 87% saying their job was a good match for their skills. The majority (almost 85%) said they would recommend the facility in which they worked to both friends and family. In focus groups, many health workers also mentioned “personal reasons” related to their faith/religious beliefs as having some degree of influence on how they felt about their work.
One is that this place is a faith-based organisation; people tend to keep in line of trying to serve others equally. We use the concept of trying to do our best at our work. Here we use teamwork and we do not have to force people to work.
Doctor, PNFP Facility Most respondents indicated that both the management (practices) of their facility and the level of supervision received were more than adequate: 62% considered their hospital manager to be competent and committed. 79% said their supervisor was available when needed. Almost 75% said they were evaluated fairly on their work.
Overall morale was reported as being good ( by 70% of health workers interviewed), with 68% saying their workload was manageable and 72% reporting that their organisation took adequate measures to protect them against HIV/AIDS. Most also said they could achieve a reasonable balance between their personal and working lives. However, less

Retention_Study
56
than 50% said they actually enjoyed working where they were, and even less (45%) said they had job security. Working Conditions: More than 70% said they had access to safe and clean water, both at work and at home, and that their facility had good access to drugs and supplies. However, only 53% said that their facility was equipped adequately enough for them to do their job properly. When focus group participants were asked what makes a facility a good place to work, factors most frequently mentioned included: A well-equipped facility, including medicines and supplies. Facility size (it was deemed preferable to work in larger/hospital facilities, which
were better equipped). Good management/administration. Staff recognition. Reasonable remuneration. Being part of a faith-based foundation. Working near home.
Living Conditions: In spite of good access to safe and clean water (at home) being reported, living conditions were generally found wanting. Only 36% indicated that they had access to a good electricity supply at home. Social amenities were also reported as inadequate, with only 44% saying they had access to good schooling for children and less than 41% saying their community had good shopping and entertainment facilities, or safe and efficient transport to work. In focus groups, health workers related that the location of the health facilities in which they worked mattered very much to them. Proximity to town and access to social amenities and schools influenced how much health workers liked where they worked.
Another thing I would look at is that we have children – and of course you would expect them to go to schools. Now, this being rural, the location is very far from town. And the schools here are also remote. We cannot afford to take our children to those good schools. So that one is also a problem – access to good schools.
Allied Health Worker, PNFP Facility Compensation: The vast majority of health workers interviewed (more than 83%) in UPMB and UMMB facilities said their salary package was not fair and approximately two thirds felt they did not have sufficient opportunities for promotion.
The one thing I don’t like about this place is that there is no staff motivation, in that salaries are not increased. You see, when you are working for the government, they increase salaries annually until you reach the ceiling on your salary scale, but for us here that is not the case.

Retention_Study
57
Enrolled Nurse-Midwife, PNFP Hospital
What the government is paying is far much better than what they are paying (here). We are just here because we don’t have anywhere to go. Many nurses come but when they get frustrated, they go away very fast for better pay. So they are changing all the time.
Enrolled Nurse-Midwife, PNFP Hospital Family health care was found to be the most important compensation factor, with the highest number of respondents rating it as “very important.” Respondents rated compensation factors as “very important” in the following order:
1. Family Health Care 82.9% 2. Salary 82.7% 3. Food Allowance 72.4% 4. Housing Allowance 65.2% 5. Terminal Benefits 66.4% 6. Transport Assistance 36.7%
In addition to salaries, focus groups discussed the opportunity for further studies and terminal benefits. Participants said they considered the opportunity for further studies to be an important incentive to remaining in their position. In a number of FGDs, participants said they would be willing to pay for their further studies, if given the chance. They said that if helped to develop their careers, they would be more willing to stay in their current (up-country/rural) place of work. Terminal benefits were considered to be very unsatisfactory, there generally being no pension after retirement in the PNFP sector. The “good” hospitals were said to give only a three-month salary package and the “bad” ones give nothing at all. Nurses in a rural health facility summed it up as follows:
Well, we seem to be in a closed circuit. First of all the salary is low the benefits are almost not there. Then I cannot go for further studies, you see?
Nurse, PNFP Facility
We are here because we do not have anywhere to go. The retirement package is very little (a three-month pay) or not there at all, irrespective of how long you have worked.
Enrolled Nurse-Midwife, PNFP Hospital
Intent to Leave Only nine percent indicated that they intended to leave within the next two years. Fifty-one percent said they intended to stay in their current job indefinitely.

Retention_Study
58
Twenty-six percent (26%) of the respondents in UPMB and UMMB facilities said that, given the chance, they would leave their organisation but stay in Uganda. Only 6% said they intended to switch jobs to out of the country, with a further six percent saying they intended to switch out of the health sector. Reasons for Leaving the Job: The most important factors listed in considering the decision to leave one’s place of work, in order of importance were:
1. Low Pay 80.1% 2. Poor access to higher education 68.0% 3. Limited Opportunities for promotion 57.7% 4. High cost of living 55.0% 5. Poor educational facilities for children 52.2%
Those who indicated the intent-to-leave in focus groups mentioned social issues, poor pay and administrative/management issues as the “greatest influencers.” The most frequently mentioned influencers that would promote health worker retention included remuneration, job security, opportunity for further studies, professional development and terminal benefits.
Also, if I get job security and I stop worrying that tomorrow I may be dismissed, this may make me stay longer.
Registered Nurse, PNFP Hospital
COMPARATIVE ANALYSIS OF PUBLIC AND PNFP SECTORS A secondary analysis was carried out on the combined data obtained from Phases I and II of the study. Although there were differences in methodologies used for the two phases, the data from the two were combined as far as possible, and analysed in order to gain a global picture of the factors related to retention and satisfaction of health workers throughout Uganda. Data from a total of 844 returned questionnaires (641 in Phase I and 203 in Phase II) were analysed and the following were the characteristics of the combined samples:
Demographics Age The age group with the highest number of health workers (approximately 35%) was between 31 and 40 years, the numbers being similar for both public and PNFP sectors. The second most common age group, with 29% of respondents, was 30 and under. In this

Retention_Study
59
group however, there was a fairly significant difference between the public and PNFP sectors. More than 42% of PNFP workers were aged 30 years or below, compared to only
14.5% in the public sector. Almost 50% of Public/GoU health workers were aged 41 years and above,
compared to only 25% in the PNFP sector. Almost 75% of health workers in the PNFP sector were aged 40 years and below. UPMB had the highest number (79%) of health workers aged 40 years and below,
with 72% of UCMB workers in this category.
Figure 2. Age Distribution Curve by Sector
42.4
32.4
16.29.0
14.5
36.5
26.122.8
05
1015202530354045
30 Years and Below
31 - 40 Years
41 - 50 Year 51 Years and Above
Perc
ent (
%)
Age
PNFP FACILITIES GoU FACILITIES

Retention_Study
60
Figure 3. Health Worker Age Groups by Facility Ownership
Gender More female (61%) than male (39%) health workers were interviewed in both phases of the study. The percent of female health workers by sector/organisation were as follows: UCMB 71.3% UPMB 60.2% UMMB 50.0% Public Sector 56.7% PNFP Average 65.5% Health Sector (Overall) 61.1%
Marital Status Almost 62% of the respondents were married, there being more married health workers in the public health sector (70%) than in other organisations (UCMB 50%; UPMB 55%). Birthplace Ninety-nine percent of the respondents were born in Uganda and one percent in Kenya. Of those born in Uganda, the highest proportion (22%) were born in the northwest with the fewest (11%) being born in the west.
Under 30 Years
31 - 40 Years 41 - 50 Year 51 Years and Above
42.0
30.4
19.8
7.4
44.1
35.0
11.99.0
14.5
36.5
26.122.8
Perc
ent
Age
UCMB UPMB GoU
Retention_Study
61
The proportion of health workers, by region of birth, was fairly consistent across sectors (public and PNFP), except for those born in the Central region. Only 9.1% of the public sector health workers were born in the central region, compared to 20.4% of PNFP sector workers.
Geographical Factors District and Region Of the 844 respondents from both phases of the study, 49.2% were employed in the PNFP sector and 48.6% in the public sector. The distribution, by organisation, of the 26 health facilities visited in Phases I and II was as follows: 9 Public/GoU facilities 8 UCMB facilities 6 UPMB facilities 3 UMMB facilities
The overall regional distribution of health workers interviewed was as follows: North Region 24.1% Central Region 23.1% Northwest Region 19.7% Southwest Region 12.1% West Region 10.6% East Region 10.4%
Employment Characteristics and Work Histories
Cadre Fifty-six percent of health workers interviewed were nurses, the cadre with the second highest number being Allied Health Professionals (14.5%), followed by the Clinical Officers (8.9%) and Medical Officers (physicians) at 8.7%. The proportion of nurses employed in the PNFP sector (59%) was higher than that employed by the Public/GoU (53%); UCMB, which had the highest number of female health workers, also employed the most nurses (61%). There were more physicians employed by the public sector (10.8%) than in the PNFP sector (6.5%). Of the health workers interviewed in UCMB and UPMB facilities, 8.5% and 4.8% respectively, were physicians.

Retention_Study
62
Work Experience Profile Time in Job: Almost 80% of health workers, in both the PNFP and public sectors were still in their first job, the highest number being in UCMB (81%) and the lowest in UMMB (59%). In all cases more female health workers were still in their first job than males: Female s in First Job Males in First Job Public/GoU 59% 41% UCMB 73% 27% UPMB 84% 66% UMMB 75% 50%
Years in the Workforce: The relative age distributions between sectors seem to have affected the profiles of respondents’ work history in those sectors. Fewer than 15% of health workers had less than 5 years work experience in the workforce, with more than 58% of them having more than 10 years experience. This was in marked contrast to the much younger PNFP workforce, in which almost 45% had less than five years experience and slightly less than 31% having more than 10 years experience in the workforce.
Figure 4. Years Spent in the Workforce by Organisation/Sector
Under 5 Years 5 - 10 Years More than 10 Years
45.1
21.1
33.8
47.5
27.425.1
44.8
24.5
30.8
13.7
28.0
58.3
Perc
ent
Age
UCMB UPMB PNFP AVERAGE GoU

Retention_Study
63
Time with Organisation/Facility: A similar trend as that seen for the number of years in the health workforce was seen with respect to the amount of time spent in the same organisation and/or facility. Fifty-five percent of the workers in the public sector had worked for the Public/GoU for more than 10 years, in contrast to almost half that proportion of respondents in the PNFP sector (with a younger workforce) where only 29% had worked for their organisation for more than 10 years. Also, reflecting the age-distribution dynamics in the respective sectors, only six percent of Public/GoU workers had spent less than two years with the same organisation, compared to the more than 22% in the PNFP sector. Approximately 43% of public workers had spent more than 10 years at the same
facility. Approximately 23% of PNFP workers had had spent more than 10 years at the
same facility. Table 5. Amount of Time Spent with the Organisation
UCMB
(%) UPMB
(%) UMMB
(%) PNFP (%)
Public (%)
Under 2 Years 20.7 23.0 23.5 21.8 6.3 2 – 5 Years 30.8 33.3 29.4 31.8 21.4 6 – 10 Years 16.3 19.5 11.8 17.5 17.1 More than 10 Years 32.2 24.1 35.3 28.8 55.2 Table 6. Amount of Time Spent at the Facility
UCMB
(%) UPMB
(%) UMMB
(%) PNFP (%)
Public (%)
Under 2 Years 16.8 24.4 35.3 21.2 9.9 2 – 5 Years 34.5 35.6 41.2 35.3 26.2 6 – 10 Years 20.3 21.5 17.6 20.7 20.8 More than 10 Years 28.4 18.1 5.9 22.8 43.1 Region of Work versus Region of Birth Of the 844 health workers interviewed, 377 (45%) worked in their region of birth. The North and Northwest regions had the highest percentage of respondents working where they were born; 71% and 69% respectively. The Central region had the fewest number of respondents (28%) working where they were born. More Public/GoU health workers in the North and Northwest worked in their region of birth. However, in the Central, East and Southwest regions the proportion of Public/GoU

Retention_Study
64
personnel working where they were born was significantly less (almost half) than that of the PNFP sectors. Proportion working in their region of birth: Public/GoU PNFP North Region 74.4% 67.4% Northwest Region 70.1% 67.9% West Region 38.8% 33.3% Southwest Region 23.5% 40.7% East Region 20.6% 43.8% Central Region 17.1% 33.3%
There was a greater willingness for health workers in the northern part of the country to stay and work where they were born. Although this may be due to lower access to opportunities in the rest of the country, the markedly higher degree of community attachment and apparent loyalty cannot be ignored; and this in spite of (or perhaps because of) the 20 years of civil strife in the north. During the focus groups, health workers (especially in northern Uganda) employed in facilities located in their birthplace noted that they enjoyed working there because they felt they were helping their community and relatives.
I also like working in a community in my home area. I also like serving my community and my relatives.
Nurse, PNFP Facility
Job Satisfaction and Morale Factors Affecting Job Satisfaction To assess health worker satisfaction and morale and the sector/organisational variations, an analysis of the same 23 questions used in Phase I was done. Overall satisfaction was rated using responses that indicated “agreement” and “strong agreement” with the statements made in the questionnaire. Only approximately half of health workers interviewed indicated that they were satisfied with their jobs, as evidenced by their responses to the statement, “Considering everything, I am satisfied with my job.” Morale was also found to be “merely acceptable,” especially in public and UCMB facilities, in that only 42% (Public/GoU) and 51% (UCMB) of respondents agreed with the statement, “Overall, the morale at my department or section is good.” Fewer still indicated that they enjoyed working in their facilities (“This is a fun place to work; the work I am doing is stimulating.”) Only UMMB had a “rating” above 50%, with UCMB and Public/GoU institutions again scoring the lowest (41.8% and 37.9%, respectively).

Retention_Study
65
Table 7. Overall Satisfaction and Morale Ratings by Organisation/ Sector
Satisfaction Rating (%)
Morale Rating (%)
Fun Place to Work (%)
UCMB 49.2 50.5 41.8 UPMB 64.4 58.3 46.8 UMMB 47.0 81.3 52.3 Public Sector 49.0 41.6 37.9 PNFP Sector Average 53.5 63.4 47.0 Health Sector Average 52.4 57.9 44.7 There were a number of factors mentioned by focus group participants which affected satisfaction. One such factor was facility size. Health workers said the size of the facility was an important element in retaining staff. They noted that working in (large) hospitals made “outsiders” respect them. Another factor affecting satisfaction that arose in the focus groups was the perceived conflict between some PNFP organisational values and personal freedoms. An example mentioned by a number of respondents (on a number of occasions) was the uncomfortable degree of pressure brought to bear on those whose marriages were traditional (as opposed to church-sanctioned) to conform to faith-based norms and values. In spite of the relatively low level of satisfaction and morale, the majority of health workers (80 - 90%) said that they felt they were actively involved in the development of their facility, were part of their community and that they would readily encourage friends and family to seek health care in their facility. Job Satisfaction by Cadre: The least satisfied cadre overall was Medical Officers (physicians), with only 25% saying they were very satisfied with their job. There was a greater degree of dissatisfaction seen amongst physicians in the PNFP sector (where only 22% said they were very satisfied) than in the public sector (where 35% said they were very satisfied); the greatest degree of dissatisfaction seen was in UPMB where 22% said they were satisfied and/or very satisfied (half the proportion seen in UCMB with 44%). Allied Health Professionals, of whom only 27% said they were very satisfied, followed close behind Medical Officers (physicians). The most satisfied cadres were pharmacy (41%) and nursing (39%). However, only 25% of nurses in UPMB said they were very satisfied, compared to 50% and 52% in Public/GoU and UCMB facilities, respectively. UPMB scores indicated it to have the least satisfied health workers, by cadres. Only amongst pharmacists and clinical officers did more than 35% say they were very satisfied; 25% or fewer of other UPMB cadres said they were satisfied.
Figure 5. Job Satisfaction by Cadre

Retention_Study
66
Job Satisfaction by Age: The least satisfied group, overall, was aged 30 years or below (37% satisfied) and the most satisfied group 51 years and above (53.1%). UPMB also had the lowest satisfaction rating by age. In none of the four age categories assessed did more than 35% of UPMB respondents say they were very satisfied with their job.
Allied Health
Clinical Officer
Medical Officer
Nurse Pharmacy
35.0
26.7
44.451.8
66.7
27.5
36.4
22.225.3
50.043.8
57.9
35.0
50.045.5
Perc
ent (
%)
UCMB UPMB Gou

Retention_Study
67
Figure 6. Job Satisfaction by Age
A similar trend was noted for job satisfaction by years of experience and by years of tenure at the facility. In each case, as the number of years of experience/tenure increased, so did the number of health workers reporting satisfaction. As with satisfaction-by-age, UPMB was found to have the least satisfied workers by years of experience/tenure. Support Supervision and Management: Respondents indicated that the level of supervision and management at their facility was adequate/above average, it generally being higher in the PNFP sector. 74% said that their immediate supervisor was available to give support when
needed (67% in the public sector; 76% in the PNFP sector). 69% said they were fairly evaluated in their work. 61% felt their hospital manager was competent and committed (56% in the public
sector; 62% in the PNFP sector).
There is good relationship between the health workers and their supervisors because from the beginning, our tutors are the ones supervising us. So they are friendly. They don’t look at you as students; they look at you as a colleague. This helps in confidence building. Where you are wrong, they correct you.
Allied Health Worker, PNFP Hospital
30 Years and Below
31 - 40 Years 41 - 50 Years 51 Years and Above
45.340.0
62.5
86.7
27.422.5
35.0
12.4
36.4
47.841.4
63.2
Perc
ent (
%)
UCMB UPMB Gou

Retention_Study
68
However, responses to statements reflecting management involvement at the personal level - (i)”My immediate supervisor cares about me as a person;” (ii) “My opinion matters at work; I am respected;” and (iii) “I receive recognition for good work” - indicated that health workers in the PNFP sector felt there was less personal interaction with management than in the public sector. UCMB had the least number of respondents who agreed with these statements, in all three cases. Focus groups also indicated that there were certain management issues specific to the PNFP sector. On several occasions, participants said there was no clear distinction between hospital and church administration and that this resulted in top-management interference from the diocese, even though it (church administration) lacked the requisite medical/management skills and background. That notwithstanding, some focus groups said that the Christian (faith-based) foundation for some hospitals ensures a good inter-personal relationship between management and staff. Table 8. Care, Respect, and Recognition by Organisation and Sector Supervisor’s
Personal Care (%) Appropriate Level
of Respect (%) Work
Recognition (%) UCMB 58.0 59.8 48.2 UPMB 67.6 66.9 59.1 UMMB 76.5 70.6 76.5 Public Sector 64.1 70.2 59.1 PNFP Sector Average 67.4 65.8 61.3 Health Sector Average 66.6 66.9 60.7 Furthermore, only 45% of respondents said they had received any form of personal encouragement (someone talking to them) in the last 6 months. In this regard, UPMB scored lowest, with only 38% reporting having received such encouragement. Abuse: Findings showed that abuse (physical, emotional and verbal) is an issue within the health sector. Abuse received from supervisors and on the way to and from work (19% of respondents, respectively) was worse than that received from patients, patients’ relatives (17%) and peers (13%). The level of abuse, on average, was slightly higher in the public sector (21%) than
in the PNFP sector (16%). The highest percentage of abuse reported by health workers was as follows: Public Sector PNFP From supervisor 24% 17% Travelling to and from work 20% 18%

Retention_Study
69
Living and Working Conditions Striking differences were reported in the living and working conditions between the PNFP and the public sectors. In almost all cases conditions were notably worse in the public sector, especially with respect to working conditions. Supplies, Drugs and Equipment: The most striking difference seen between the “performance” of the Public/GoU and PNFP facilities was in the level of supplies, drugs and equipment – the adequacy of supply and availability in Public/GoU facilities was very poor compared to the PNFP sector. Forty-one percent of the Public/GoU health workers interviewed said that their facility had good access to drugs and medication and only 36% felt that the (available) supplies were sufficient to enable them to do a good and safe job. The proportion that said they had the equipment required to do their job well and efficiently were lower still, at 27%. In marked contrast, over 80% of UCMB respondents said that their facility had (i) good access to drugs and medication; (ii) supplies adequate enough to enable them to do their job well and safely; and (iii) enough equipment to ensure that they could do their job well and efficiently. Sixty-five to seventy-five percent of UPMB respondents also said they had adequate access to drugs, medication, supplies and equipment.
Figure 7. Access to Drugs, Supplies and Equipment
UCMB UMPB UMMB GoU
83.4
75.7
64.7
41.0
79.0
69.0
82.3
36.0
86.1
66.3
40.0
27.2Perc
ent (
%)
Good Access to Drugs Adequate Supplies Adequate Equipment

Retention_Study
70
Access to Safe Water and Electricity: Access to clean and safe water was reported as good throughout the health sector, with more health workers actually reporting access as being better at home than at work. Over 75% of respondents in PNFP facilities said access was good, both at home
and at work. 60% of Public/GoU health workers said their access at home was good and 56%
said the same for work. However, access to electricity in the public sector was found to be very poor. Only 37% of public health workers said they had good access at work, even fewer (28%) saying they had good access at home. Although access at work was reportedly much better in the private sector (70% for UCMB; 75% at UPMB), it was relatively poor at home (46% for UCMB; 42% for UPMB). Considering the fact that poor electricity supply is a nationwide problem, the above findings imply that PNFP facilities have made greater and more deliberate efforts to invest in back-up power supplies, thus improving working conditions in this respect. Health Protections: Overall, more than two thirds of the respondents said their organisation took specific measures to protect them against HIV/AIDS. However, only half the Public/GoU workers said the same. UCMB and UMMB scored highest with 74% and 82% of their health workers, respectively, agreeing with the statement, “The organisation takes specific measures to protect me against HIV/AIDS.” Workload: Overall, a slight majority (52%) of respondents said that their workload was manageable; 82% in UMMB and 53% of UPMB health workers. However, only 35% of the respondents in UCMB and Public/Government of Uganda (GoU) facilities agreed that their workload was manageable. Similarly, UPMB had the most respondents (53%) who felt they had enough time every day to eat lunch. Only 33% of UCMB and 29% of GoU respondents felt the same. More health workers in the public sector (64%) and at UPMB (63%) felt they had the flexibility to balance the demands of the workplace with their personal lives. Fewer (52%) felt they could achieve that same balance at UCMB. Social Factors: Living conditions, as assessed by access to social amenities, were also reported as very poor (in addition to the poor access to electricity at home). The numbers in both sectors, judging access to schooling, shopping and entertainment as being good, were low: Access to good schooling for children 39% Access to good shopping and entertainment 38% Safe and efficient transportation to work 34%

Retention_Study
71
Job Security Less than half of the health workers interviewed (48%) said they felt they had job security. The highest level of security was found amongst Public/GoU health workers, where 58% said they had job security. UPMB workers indicated the lowest level, with only 37% reporting job security. The percent of health workers who responded positively to the statement, “I feel I have job security,” were as follows: Public/GoU 58.0% UCMB 43.9% UPMB 37.3% UMMB 53.0% PNFP Sector Average 44.7% Health Sector Average 48.1%
The lack of job security, as a disincentive, also featured prominently in almost all Phase II focus group discussions. Many in the PNFP sector said that because of their undefined terms of service, they were never sure of their future with the health institution/facility in which they worked.
There is no job security like is the case in (any) non-governmental (NGO) organisation. An expel is where the Diocesan Secretary can wake up one day and decide that you should go – then you have to go!
Allied Health Worker PNFP Hospital
Compensation Satisfaction with salaries was very low, with only a very small number overall (14.2%) saying they felt their salary package was fair. The lowest numbers were seen in UCMB and Public/GoU facilities (11.7% each) with the highest numbers in UPMB facilities (21.5%). Opportunity for promotion was also deemed to be poor across the health sector. Factors Affecting Compensation: Six compensation factors that health workers felt should be offered by an organisation were assessed, with respondents ranking them according to their level of importance. The most important factor overall was found to be “family health care.” Salary, which was the second most important factor for Public/GoU, UPMB and UMMB workers, was ranked third by UCMB workers, “food allowance.”

Retention_Study
72
Table 9. Compensation Factors Offered by Organisations, by Importance PUBLIC
SECTOR (%) PNFP
SECTOR (%) HEALTH
SECTOR (%) Family Health Care 91.7 84.7 86.5 Salary 89.9 83.0 84.7 Food Allowance 89.5 76.2 79.5 Housing Allowance 84.8 70.4 74.0 Terminal Benefits 83.6 68.5 72.3 Transport Assistance 80.5 48.1 56.2
Intent to Leave Intent to leave was measured by the total number of respondents who indicated readiness to leave their current job (i) as soon as possible; (ii) within a year from now; and (iii) one to two years from now. Respondents who said that they would leave their job three to five years from now, or planned to stay indefinitely in their jobs were deemed to have expressed (a current) intent to stay. The vast majority of health workers interviewed (74%) expressed the intent to stay, with 26% saying they intended to leave within the next two years. Only 14% said they intended to leave within a year from the time of the interview, including those who said “as soon as possible.” More respondents from PNFP than Public/GoU institutions indicated the intent to leave than did respondents in Public/GoU institutions. The organisation with the highest numbers of those intending to leave in two years or less was UCMB (33%), compared to 25% in UPMB and 19% in the public sector. Almost 20% of UCMB respondents said they intended to leave within the next year or as soon as possible, as did approximately 12% in UPMB and 11% in the public sector. Table 10. Health Worker Intent to Leave by Organisation
UCMB
(%) UPMB
(%) Public/GoU
(%) Health
Sector (%) As Soon As Possible 8.2 6.4 8.2 7.6 Within 1 Year from Now
11.7 5.7 2.5 6.6
1 to 2 Years from Now 13.3 12.7 8.2 11.4 TOTALS 33.2 24.8 18.9 25.6
Reasons for Leaving Factors that health workers said influenced the decision to leave their (current) job were assessed, the five most important being:

Retention_Study
73
1. Low pay 81% 2. Poor access to higher education 68% 3. Limited opportunities for promotion 59% 4. High cost of living 55% 5. Poor educational facilities for children 54%
These remained constant as the “Top-5 Factors for Leaving” in the different organisations. However, relative rankings varied from one organisation to the other. For example, limited opportunities for promotion was ranked as the second most important factor in the public sector. Poor access to higher education was ranked third in public sector, but the second most important factor across PNFP organisations. The three most important factors in the different PNFP organisations were: UCMB Poor educational facilities for children. UPMB Limited opportunities for promotion. UMMB High cost of living.
Health Worker Migration Patterns For purposes of this analysis, “migration” was categorised as internal or external – defined as follows:
1. Internal Migration: Intention to leave the current job, but remain and work in the Uganda health sector.
2. External Migration: Intention to leave the country and/or switch to a job outside
of the health sector. The level of internal migration far out-weighed external migration. Of those who said they would consider leaving their current job (within the next five years), the greater number (43%) said they would remain and work in the Uganda health sector – either staying with the same employer/organisation but switching locations (16%) or switching organisations within Uganda (27%). The intent to migrate internally was higher within the PNFP sector. Approximately 56% of UCMB respondents said they intended to do so, with 42% expressing the desire to switch organisations, presumably moving to the public sector. Thirty-eight percent of workers in UPMB indicated the intent to migrate internally, with 26% expressing the desire to switch organisations. Only 13% of Public/GoU respondents said they intended to switch organisations. One of the reasons for migration, repeatedly mentioned in focus groups, was the fact that salaries in the public sector were higher than in the PNFP sector. PNFP health staff argued that if the government relented and revised their salary scales (subsidised the PNFPs), they would be more willing to stay on.
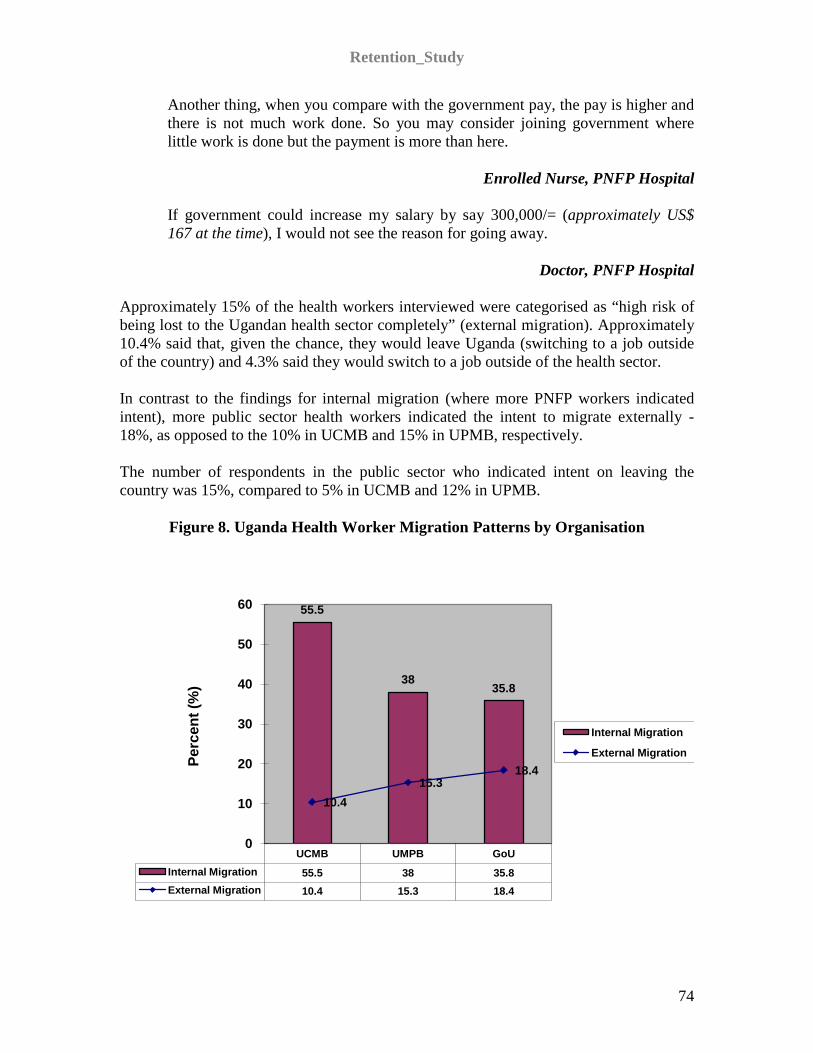
Retention_Study
74
Another thing, when you compare with the government pay, the pay is higher and there is not much work done. So you may consider joining government where little work is done but the payment is more than here.
Enrolled Nurse, PNFP Hospital
If government could increase my salary by say 300,000/= (approximately US$ 167 at the time), I would not see the reason for going away.
Doctor, PNFP Hospital Approximately 15% of the health workers interviewed were categorised as “high risk of being lost to the Ugandan health sector completely” (external migration). Approximately 10.4% said that, given the chance, they would leave Uganda (switching to a job outside of the country) and 4.3% said they would switch to a job outside of the health sector. In contrast to the findings for internal migration (where more PNFP workers indicated intent), more public sector health workers indicated the intent to migrate externally - 18%, as opposed to the 10% in UCMB and 15% in UPMB, respectively. The number of respondents in the public sector who indicated intent on leaving the country was 15%, compared to 5% in UCMB and 12% in UPMB.
Figure 8. Uganda Health Worker Migration Patterns by Organisation
UCMB UMPB GoUInternal Migration 55.5 38 35.8External Migration 10.4 15.3 18.4
55.5
3835.8
10.415.3
18.4
0
10
20
30
40
50
60
Perc
ent (
%)
Internal Migration
External Migration

Retention_Study
75
Figure 9. Internal Migration Patterns by Organisation
Intent to Leave by Selected Categories Intent to leave was further analysed by selected categories - by cadre, age, years of experience, facility tenure (amount of time spent at the current facility), district ease of reach and whether or not it was the respondent’s first job. Findings indicated that in general, the intent to leave decreased with age, level of experience and the length of tenure. However, there were significant differences noted between organisations and sectors. UCMB’s intent-to-leave profile indicated a much higher general intent to leave
than in the other organisations. The highest risk of external migration was found to be in the public sector.
Intent to Leave by Cadre: Eight-two percent of Medical Officers (physicians) in UCMB indicated the intent to leave their current job within the next two years, as did 53% of the organisation’s Clinical Officers; the health sector average for both categories was 43% and 31%, respectively. Of the UCMB physicians who intended to leave, only 25% indicated they were at “high risk” of leaving Uganda or the health sector, compared to the 56% of Public/GoU physicians who indicated they were at “high risk” of leaving the health sector entirely or of leaving the country.
0
5
10
15
20
25
30
35
40
45
UCMB UMPB GoUTo a Different Organisation 41.5 26.3 13.2To a Different Location in Same
Organisation 14 11.7 22.6
41.5
26.3
13.21411.7
22.6
Perc
ent (
%)
To a Different Organisation To a Different Location in Same Organisation

Retention_Study
76
Figure 10. Intent to Leave by Cadre and Organisation
By Age: The age group found to be most ready to leave their current position was 30 years or below, the numbers being higher in the PNFP sector than in the public sector: in UCMB 48% of this age group expressed the intent to leave, with only 22% in the public sector doing so. However, only 13.2% of UCMB workers in this age group indicated that they were a “high-risk-loss” to the Uganda health sector, compared to 33.3% of Public/GoU health workers. In the public health sector, the 31 – 40 year age group reported the highest
proportion of health workers intending to leave (23%). Those aged 41 – 50 years reported the lowest overall numbers intent on leaving.
By Years of Experience: Overall, of those who indicated readiness to leave within two years, the greatest proportion (21%) were those who had worked in the profession for less than five years. 42% of health workers in UCMB with less than five years experience indicated
their intent to leave, compared to 31% in UPMB and only 10% in the public sector.
28% of Public/GoU workers with five to ten years of experience indicated a high risk of external migration, the highest recorded number (by category of work experience) of those at risk. In the PNFP sector however, this category of health worker had the lowest risk of leaving.
Allied Health
Clinical Officer
Medical Officer
Nursing Pharmacy
36.8
53.3
82.4
22.9
33.333.327.3
42.9
19.5 16.7
25.0
10.8
45.9
14.6 16.7
Perc
ent (
%)
UCMB UPMB GoU

Retention_Study
77
Figure 11. Health Worker Intent to Leave by Age Group
Figure 12. High Risk of External Migration by Age Group
30 Years and Below 31 - 40 Years 41 - 50 Year 51 Years and
AboveUCMB 48.1 29.6 10 18.8UPMB 35 19.7 15 20GoU 21.6 23.1 10 19.5
48.1
29.6
10
18.8
35.0
19.715.0
20.021.6 23.1
10.0
19.5
0
10
20
30
40
50
60Pe
rcen
t (%
)
UCMB UPMB GoU

Retention_Study
78
Conclusions The level of satisfaction of the Uganda health workforce was found to be relatively low, with only half of the health workforce saying they were satisfied with their job; higher levels of dissatisfaction were reported in the PNFP sector than in the public sector. The highest levels of dissatisfaction were reported (i) amongst physicians, (ii) in the PNFP sector and (iii) within the group aged 30 years and below. The vast majority of health workers interviewed considered their salary package to be inadequate and unfair, this being one of the major factors adversely affecting health worker satisfaction. Other factors negatively affecting health worker satisfaction in Uganda included working and living conditions, which were reported to be poor, much more so in the public sector. Health workers in the public sector reported poorer access to electricity both at work and at home, grossly inadequate supplies of drugs and equipment, unmanageable workloads and poor health protection. This may be interpreted as an indicator of a relatively lower public sector investment in (supportive) infrastructure and supplies. Health workers, in both the public and PNFP sectors, also reported poor access to good schools for their children, poor shopping and entertainment in their communities and the lack of safe and efficient transport to work. Although the level of supervision and management was good, especially in the PNFP sector, the level of personal care by supervisors (respect accorded health workers and recognition for good work) was lower in the PNFP sector than in the public sector.
10.47.6
4.3
19.4
33.3
20.0
16.4
8.6
0
5
10
15
20
25
30
35
30 Years and Below
31 - 40 Years 41 - 50 Year 51 Years and Above
Perc
ent (
%)
PNFP FACILITIES GoU FACILITIES

Retention_Study
79
Although this may be a contributory factor to the comparatively lower level of job satisfaction seen in the PNFP sector, the apparently higher degree of satisfaction in the public sector was also partly due to differences in management/supervision practices. The perception of health workers, in both the public and PNFP sectors, is that there is a much greater degree of freedom for public sector workers to “do their own thing,” as compared to the PNFP sector, where management insists on health workers fulfilling their expected duties. Health worker satisfaction notwithstanding, a “laissez-faire” management attitude (as perceived to be the case in the public sector) is potentially a contributory factor in the lower quality of health care received by patients. Job security was also found to be relatively low, although it was better in the public sector. Amongst the reasons given for better job security in the public sector were (i) the relatively higher salaries, compared to the PNFP sector; (ii) the fact that the public sector offers better access to higher education and (iii) that public sector employment is “pensionable,” which does not seem to be the case in the private sector. Health worker age-distribution in both the public and PNFP sectors differed greatly. The majority of the PNFP workers were aged 30 years and below and the majority of the public sector workers 41 years and above. The PNFP sector thus has a relatively unstable workforce, which is more likely to be affected by those factors listed as the main reasons for leaving – poor pay, poor access to higher education and limited opportunities for promotion, amongst others. This is further evidenced by the fact that the profile of those intent on leaving was made up of physicians and clinical officers, aged 30 years or less, with less than five years working experience and working in the PNFP sector. Potential external migration was relatively low, with few respondents indicating intent to leave the health sector entirely and/or the country. Most of those who indicated intent to move within the country were in the PNFP sector – leaving for a new facility in the same organisation or changing organisations completely. Factors that seemed to influence PNFP-to-public sector migration included higher salaries, increased opportunities for further studies and/or promotion, and decreased workload (due to staff shortages in the PNFP sector), as well as the availability of work contracts and terminal benefits. Although such movement (PNFP-to-public sector migration) does not contribute directly to sector attrition, it nonetheless makes it extremely difficult to plan. Oftentimes, movement is not reported/captured until much later, making it difficult to determine health workforce distribution and capacity. There were several issues that both sectors shared, however the emphasis placed on some of them was found to be specific to the respective sectors. Health workers in both the public and PNFP sectors agreed that a favourable working environment, better remuneration, availability of accommodation, good management/active supervision and opportunities for further studies were important retention factors. However, health workers in the PNFP sector indicated a much greater degree of concern about job security, (poor) salary structure, the lack of (streamlined) job descriptions, few opportunities for promotion and ambiguous terms of service.

Retention_Study
80
Recommendations
MAJOR FINDINGS KEY CONSIDERATIONS
Compensation • Low salary • Delayed payment of salaries • Higher salaries in Public/GoU than PNFPs
Support dialogue with key stakeholders Strengthen payroll management
Management and Supervision • Level of Church administration’s
involvement in hospital management sometimes too high in PNFPs
• Management and supervision much more lax in Public/GoU facilities
• Management perceived as good but less personal in PNFPs
• Poor access to further training • Limited opportunities for promotion • Long recruitment and deployment process,
especially in Public/GoU
Develop participatory management programmes and HRIS system at Central and District levels
Strengthen support supervision practices Strengthen orientation programmes for new
recruits Develop “Further Educational
Opportunities” database Streamline recruitment and deployment
processes, learning from examples in the region
Working Conditions • Poor level of equipment, supplies and drug
stocks, especially in govt. facilities • Understaffing and unmanageable workloads • Poor back-up power supply • Poor job security • No resting spots in health facilities
Strengthen procurement logistics Implement workload-based staff indicators Designate staff resting and recreation spaces
in facilities Develop innovative staff recruitment
mechanisms, especially for rural communities
Partner with local communities to ensure local resources contribute to health service delivery
Living Conditions • Inadequate housing • Poor availability of social amenities • Poor access to good schools for children
Support dialogue with key stakeholders such as Inter-Ministerial Steering Committee and promote initiatives that address these issues
Abuse of health workers • By supervisors • While travelling to and from work
Reinforce complaint mechanisms Empower health workers, especially
females, to stand up for their rights Encourage Professional Associations and
Councils to protect their constituents’ welfare and address abuse issues

Retention_Study
81
In order to address the identified key considerations, implementation of the following is recommended:
8. Analyse practices in “magnet” health facilities to identify positive conditions and practices in order to adapt and adopt them in health facilities throughout the country.
9. Develop strategies for attracting and retaining priority cadres in order to ensure
adequate staffing in Hard-to-Reach areas as well as equitable staff distribution between the PNFP and Public/GoU sectors. Strategies will focus on:
a. Salary enhancements. b. Health worker deployment, vis-à-vis age group. c. Loans. d. Housing. e. Children’s schooling. f. Further education for health workers.
10. Implement workload-based indicators for staff members in order to identify and
address individual facility staffing requirements through:
a. Dissemination of the Workload Indicator of Staffing Needs (WISN) Report – a World Health Organization (WHO) initiative piloted in Uganda.
b. Initiation and support of the WISN Stakeholder Group in the MoH. c. Pilot implementation of WISN in several districts. d. Identify how WISN can contribute to annual budget request (e.g. as they
have done in Oman).
11. Develop strategies and tools for performance management and recognition at health facility level in order to strengthen human resource assessment, mentoring and support supervision approaches.
12. Develop and promote participatory leadership and management programmes at
both MoH and health facility level to ensure key stakeholder input in all planning, development and implementation of District HRH Action Plans, by working with and through Stakeholder Leadership Groups at both the central and district level, as well as through the implementation of Leadership Development Programmes.
13. Enhance and promote community oriented pre-service training for all health
cadres through collaboration with health training institutes as well as innovative deployment of trainees within the communities.

Retention_Study
82
14. Support innovations for team building, recreation and staff welfare at health units in order to foster and strengthen the sense of belonging and team spirit within the health workforce and identify strategies to address psychosocial issues related to post-conflict environments.

Retention_Study
83
APPENDIX I PHASE I REGRESSION ANALYSIS Regression Analysis: Accounting for Multiple Factors at One Time Satisfaction (Q12) In a linear regression analysis (see table), we were able to evaluate the effects of several factors simultaneously to judge their relative importance. We used as a dependent (or outcome) variable the respondents’ ratings on Question 12, “Considering everything, I am satisfied with my job.” We included all the five strata of interest in the regression equation—age, gender, cadre, sector, and region--although they were not necessarily independently significant. This was for purposes of avoiding confounding associated with these factors. We were able to construct a model that explained 33.4% of the variance in overall job satisfaction. The coefficients in the table (below) represent the improvement we see in the overall satisfaction of respondents when they report improved satisfaction in some specific factors such as salary. For example, when respondents rated their satisfaction with salary one point higher, their overall job satisfaction improved by almost one-fourth of a point (.224), other variables in the analysis (named above and in the table) being equal. Also, when respondents increased by one point their agreement with the statement that their job was a good match with their skills and experience, their overall job satisfaction went up more than one fourth of a point (.268), other factors held equal. Other factors that contribute to improved satisfaction scores include satisfaction with their supervisor (.177 points), their workload (.138), or their feeling that the job is stimulating or fun (.134), other factors held equal. Significant, yet much smaller increases in overall satisfaction were observed for increases in satisfaction with job security (.08), other factors held equal. Satisfaction levels rose with the respondents’ age, but at a very gradual rate (.012 points per year of increased age), again, other factors held equal. Satisfaction in the East region was lower than the reference region, Central (Kampala), holding other variables constant, although the results were only marginally significant. Likewise, pharmacists tended to show an improved level of satisfaction compared to nurses, but the results were not significant. Other cadre showed no significant differences after controlling for other factors. Sector was not significant in predicting satisfaction.

Retention_Study
84
Variables of significance in the Q12 Model.
Significance Coefficient Gender (1=male, 2=female) .385 .127 Age (yearly increments) .019 .012 Sector (1=public 2=private) .775 .037 Pharmacists .068 .565 East region (compared to Central) .058 - .399 13-The job is a good match for my skills and experience .000 .268 48-My salary package is fair .000 .224 16-My immediate supervisor cares about me as a person .000 .177 35-The workload is manageable .001 .138 23-This is a fun place to work; the work I am doing is stimulating
.001 .134
46-I feel I have job security .044 .08 37-I have the equipment I need to do my job well and efficiently .075 .08 21-I would encourage my friends and family to seek care here .142 .08 Note: we do not display other cadre or geographical areas, as they were not significant at the p<.05 level. Intent to stay (Q74di) In a logistic regression analysis (see table), we were able to evaluate the effects of several factors simultaneously to judge their relative importance. Our outcome variable was the respondents’ ratings on Question 74, with statements about when they would want to leave their jobs. We transformed the outcome variable into a dichotomous one, with 0 = Intent to stay in current job two years or fewer (ready to leave) and 1= Intent to stay in job at least three more years. We included all the five strata of interest in the regression equation—age, gender, cadre, sector, and region--although they were not necessarily independently significant. This was for purposes of avoiding confounding associated with these factors. The significant job characteristic contributors to the intent to stay were cadre and sector (public or private). Region, age and gender were not statistically significant. We found the odds of reporting an intent to stay on the job at least three years were lower for physicians (OR=.2, p=.004) compared to nurses, adjusted for other factors in the model. This helps us sort out the fact that most nurses are female while most physicians are male; which is more important in the decision to leave—being male or being a physician? We learned it is the factor of being a physician, not being a male, since both factors are in the model. Note that in our model, females have nearly twice the odds of reporting an intent to stay, compared to males (OR=1.8, p=.153), but the results are not significant at the p<.05 level. Private sector respondents had lower odds of reporting an intent to stay (OR=.4, p=.001), compared to public sector respondents, adjusted for other factors in the model.

Retention_Study
85
Other factors that seemed important in improving the odds of staying in the job longer included the following, all other factors in the equation held equal:
• when one was more actively involved in helping to make this a great health care facility (OR=1.4, p=.019),
• when the respondent said s/he had more flexibility to balance the demands of workplace and personal life (OR=1.3, p=.014),
• when the workload was judged to be more manageable (OR=1.3, p=.008), and • when there was more recognition for good work (OR=1.2, p=.085 - note, only
marginally significant). When the worker said s/he had been subject to abuse (physically, emotionally, or verbally) by a supervisor, the odds of staying were lower (OR=.7, p=.000), other factors held equal. (Note: Odds Ratios over one indicate improved odds of staying for secod level in the independent variable.) Variables of significance in the Q74di Model Odds Ratio Significance Gender (1=male, 2=female) 1.8 .153 Age 1.0 .244 Sector (1=public 2=private) .4 .001 Medical Officers (compared to nurses) .2 .004 Northwest region (compared to Central) 1.8 .187 24-I have been abused (physically, emotionally, verbally) by a supervisor
.7 .000
50-Importance of salary (very, somewhat or not important)
1.6 .095
34-I am actively involved in helping to make this a great health care facility
1.4 .019
22-I have the flexibility to balance the demands of my workplace and my personal life
1.3 .014
35-The workload is manageable 1.3 .008 15-I receive recognition for doing good work 1.2 .085 Note: we do not display other cadre or geographical areas, as they were not significant at the p<.05 level. Intent to Leave Uganda and the Health Profession (Q75di) In a logistic regression analysis (see table), we were able to evaluate the effects of several factors simultaneously to judge their relative importance. Our outcome variable was the respondents’ ratings on Question 75, which asked if health workers were going to leave

Retention_Study
86
their jobs soon, where were they intending to go? We transformed the outcome variable into a dichotomous one, with 0= Intent to stay in Uganda and work in health care (combines intent to stay with employer but change locations and desire to change employers within the health sector) and 1= high risk of leaving Uganda or the health sector. We included all the five strata of interest in the regression equation—age, gender, cadre, sector, and region--although they were not necessarily independently significant. This was for purposes of avoiding confounding associated with these factors. The only significant personal characteristic contributing to the intent to stay was gender. Overall, cadre was a significant predictor of leaving in this model, and Medical Officers (physicians) were most likely to report an intent to leave (compared to nurses), although as a stand-alone variable, it did not rise to the level of .05 significance (p=.095). We found the odds of indicating an intent to leave Uganda or the health care sector were lower for women compared to men (OR=.3, p=.013), other factors in the model held equal. Private sector employees were at lower risk of leaving as well, other factors held equal (OR=.5, p=.062), although the results were not statistically significant. Age was not significant after controlling for all the other factors. Region was a significant predictor overall in a separate logistic regression analysis. Compared to the Central region, living in all the other seems protective of leaving, other factors held equal. Living in the Central region increases the odds of leaving, and the region where health workers expressed the least likelihood of leaving was the North. Odds were more than two times higher of leaving Uganda or the health sector when respondents rated the importance of salary more highly, other factors held equal (OR=2.7, p=.016). Other factors that seemed important in reducing the odds of leaving included the following, all other factors in the equation held equal:
• when respondent said s/he had more flexibility to balance the demands of workplace and personal life (OR=.7, p=.005),
• when the workload was judged to be more manageable (OR=.7, p=.016), and • when opportunities for promotion were better (OR=.7, p=.017).
(Note: Odds Ratios under one indicate lower odds of leaving for 2nd level in the independent variable.)

Retention_Study
87
Variables of significance in the Q75di Model Significance Odds Ratio Gender (1=male, 2=female) .013 .3 Age .311 1.0 Sector (1=public 2=private) .062 .5 Medical Officers (Physicians) .095 2.6 West Region (compared to Central) .032 .3 Northwest region .009 .3 North region .003 .2 East region .540 .7 Southwest region .115 .3 50-Importance of salary (very, somewhat or not important) .016 2.7 22-I have the flexibility to balance the demands of my workplace and my personal life
.005 .7
35-The workload is manageable .016 .7 49-I feel there are sufficient opportunities for promotion with this employer
.017 .7
Note: we do not display other cadre or geographical areas, as they were not significant at the p<.05 level.

Retention_Study
88
Variables of significance in the Models Q74di logistic Q75di logistic Q12 linear
Odds Ratio*
Sign Odds Ratio**
Sign Co-efficient
Sign
Gender (1=male, 2=female) 1.8 .153 .3 .013 .127 .385 Age 1.0 .244 1.0 .311 .012 .019 Sector (1=public 2=private) .4 .001 .5 .062 .037 .775 Medical Officers (compared to nurses) .2 .004 2.6 .095 Pharmacists .565 .068 Northwest region (compared to Central) 1.8 .187 .3 .009 North region .2 .003 Southwest region .3 .115 East region .7 .540 - .399 .058 West region .3 .032 13-The job is a good match for my skills and experience .268 .000 15-I receive recognition for doing good work 1.2 .085 16-My immediate supervisor cares about me as a person .177 .000 21-I would encourage my friends and family to seek care here .08 .142 22-I have the flexibility to balance the demands of my workplace and my personal life 1.3 .014 .7 .005 23-This is a fun place to work; the work I am doing is stimulating .134 .001 24-I have been abused (physically, emotionally, verbally) by a supervisor .7 .000 34-I am actively involved in helping to make this a great health care facility 1.4 .019 35-The workload is manageable 1.3 .008 .7 .016 .138 .001 37-I have the equipment I need to do my job well and efficiently .08 .075 46-I feel I have job security .08 .044 48-My salary package is fair .224 .000 49-I feel there are sufficient opportunities for promotion with this employer .7 .017 50-Importance of salary (very, somewhat or not important) 1.6 .095 2.7 .016 *Q74di: OR over one is improved odds of staying for 2nd level ** Q75di: OR over one is higher odds of leaving for 2nd level

Retention_Study
89
APPENDIX II SELECTED TABLES FROM PHASE I Intent to Leave Health worker intent to leave the job was measured by Question 74.
Factor Intent to stay in current job 2 years
or fewer (%)
Intent to stay in job at least 3 more years (%)
Number of respondents
(N)
Significance (p-value)*
Cadre 510 .000 Allied Health 27 73 82 Clinical Officer
23 77 53
Medical Officer
57 43 56
Nursing 20 80 322 Pharmacy 12.5 87.5 16
Years of experience 552 .001 Under 5 years of experience
31 69 135
5-10 years 30 70 143 More than 10 years
17 83 274
Tenure on this job (in this facility) 538 .000 Under 2 years of tenure here
34 66 71
2-5 years 34 66 155 6-10 years 21 79 112 More than 10 years
14 86 200
Hard-to-Reach districts 574 .868 Hard-to-Reach 25 75 199 Not Hard-to-Reach
24 76 375
Sector 576 .000 Public 19 81 367 Catholic 33 67 196 Other non-profit
46 54 13
First job? 544 .164 Yes 23 77 443 No 29 71 101

Retention_Study
90
Marital status 562 .103 Married 22 78 351 Single 27 73 211
*the p-value measures the chance that this distribution occurred by chance. The lower the p-value, the more likely the finding is “real,” as opposed to occurring by chance. In general interpretation, values under .05 are considered significant. Career Intentions: If you were to leave, where would you go?
Factor Likely to stay in Uganda and work in
health care (%)
High risk of leaving Uganda
or the health sector (%)
Number of respondents
(N)
Significance (p-value)*
Cadre 455 .000 Allied Health 88 12 68 Clinical officer
82 18 39
Medical officer
54 46 52
Nursing 90 10 254 Pharmacy 80 20 10
Years of Experience 440 .113 Under 5 years of experience
85 15 107
5-10 years 79 21 124 More than 10 years
88 12 209
Tenure on this job (in this facility) 430 Under 2 years of tenure here
84 16 57
2-5 years 78 22 129 6-10 years 90 10 97 More than 10 years
86 14 147
Hard-to-Reach districts 459 .024 Hard-to-Reach 90 10 164 Not Hard-to-Reach
82 18 295
Sector 460 .073 Public 82 18 288 Catholic 90 10 164 Other non-profit
88 13 8
First job? 438 .080 Yes 86 14 362 No 79 21 76

Retention_Study
91
Marital status 448 .313 Married 84 86 273 Single 16 14 175
Job Factors Associated with Job Satisfaction
Factor Overall, % satisfied or
very satisfied with job
Overall, % neutral or dissatisfied
with job
Number of respondents
(N)
Significance (p-value)*
Cadre 612 .040 Allied Health 41 59 88 Clinical officer
48 52 54
Medical officer
37 63 60
Nursing 50 50 343 Pharmacy 55 45 20
Years of Experience 593 .212 Under 5 years of experience
46 54 154
5-10 years 44 56 149 More than 10 years
52 48 290
Tenure on this job (in this facility) 578 .063 Under 2 years of tenure here
46 54 79
2-5 years 41 59 166 6-10 years 48 52 119 More than 10 years
55 45 214
Hard-to-Reach districts 617 .327 Hard-to-Reach 47 53 208 Not Hard-to-Reach
49 51 409
Sector 618 .532 Public 49 51 392 Catholic 49 51 209 Other non-profit
35 65 17
First job? 584 .270 Yes 49 51 473 No 45 55 111

Retention_Study
92
Marital status 604 .372 Married 49 52 381 Single 47 53 223
What is Associated with Job Satisfaction (Among those who are Satisfied)? (Note: column 3 portrays the ratio of those who (agree + strongly agree) over those who are satisfied in Q12di from a cross-tab run in SPSS.) # To what extent do you agree with the following statements? % Satisfied who
agree or strongly agree
Significance
12 Considering everything, I am satisfied with my job. 100 14 When I come to work, I know what is expected of me. 97 .009 13 The job is a good match for my skills and experience. 96 .000 30 I consider myself a part of this community. 95 .000 20 I have a good friend at work. 93 .000 34 I am actively involved in helping to make this a great health care
facility. 93 .000
21 I would encourage my friends and family to seek care here. 86 .000 32 My supervisor is available when I need support. 80 .000 19 My opinion seems to matter at work; I am respected. 79 .000 16 My immediate supervisor cares about me as a person. 76 .000 31 I am fairly evaluated on my work. 76 .000 33 The hospital manager here is competent and committed. 73 .000 28 I have been given the training needed to succeed in my position. 73 .001 15 I receive recognition for doing good work. 71 .000 22 I have flexibility to balance the demands of my workplace and my
personal life. 70 .000
29 The organisation takes specific measures to protect me against HIV/AIDS. 68
.000
18 Overall, the morale level at my department or section is good. 56 .000 17 In the past six months, someone has talked to me to encourage my
development. 52 .000
23 This is a fun place to work; the work I am doing is stimulating. 50 .000 24 I have been abused (physically, emotionally, verbally) by a
supervisor. 19 .001
27 I have been abused (physically, emotionally, verbally) while traveling to/from work. 17
.001
26 I have been abused (physically, emotionally, verbally) by patients/their friends/family members. 13
.002
25 I have been abused (physically, emotionally, verbally) by my peers. 13 .079

Retention_Study
93
Working Conditions Associated with Overall Job Satisfaction
# To what extent do you agree with the following statement?
% satisfied who agree or strongly
agree
Significance
38 This facility has good access to drugs and medications. 66 .000 36 I have the supplies I need to do my job well and safely
(gloves, needles, bandages, etc). 63 .000
46 I feel I have job security. 62 .000 37 I have the equipment I need to do my job well and efficiently
(ultrasound, x-ray, blood pressure cuffs). 56 .000
35 The workload is manageable. 47 .000 45 I have safe and efficient transportation to work. 30 .016 44 I have access to good schooling for my children. 39 .018 47 The community where I live has good shopping and
entertainment. 37 .035
39 I can take time to eat lunch almost every day. 36 .05 41 At work, I have access to safe, clean water. 72 .168 43 At work, I have good access to electricity. 51 .211 42 At home, I have good access to electricity. 36 .454 40 At home, I have access to safe, clean water. 74 .640 Compensation and Satisfaction # To what extent do you agree with the following
statements? % Satisfied who
agree or strongly agree
Significance
48 My salary package is fair. 20 .000 49 I feel there are sufficient opportunities for promotion
with this employer. 34 .202
Importance of Compensation Factors and Job Satisfaction # How important are the following compensation
factors offered by an organisation to you? % Satisfied say
“very important” Significance
54 Health care for my family. 94 .003 51 Terminal benefits (retirement, pension, etc). 89 .062 50 Salary. 90 .093 53 Assistance with transportation. 80 .296 55 Food allowance. 80 .546 52 Receiving a housing allowance. 83 .957 Degree of Importance of Factors That May Make One Decide to Leave a Current Job # If you were to consider leaving your current job
position, how important would the following factors be in that decision?
% Satisfied who say
“very
Significance

Retention_Study
94
important” 56 Low pay/salary/allowances 77 .002 61 Poor supervision and management 39 .027 57 High workload 43 .034 66 Communication problems, telephones 34 .048 60 Social conflicts in the workplace 35 .084 58 Poor access to supplies and equipment at work 50 .129 59 Limited opportunities for promotion 62 .176 69 Poor access to higher education for myself 65 .186 63 Poor/lack of utilities (water, electricity) at home 39 .271 62 Transport problems 41 .315 67 High cost of living 53 .427 65 Lack of housing facilities 51 .459 68 Poor educational facilities for children 58 .827 70 Work is far from home. 31 .838 64 Poor/lack of utilities (water, electricity) at work 49 .866

Retention_Study
95
APPENDIX III SELECTED TABLES FROM PHASE I and II COMPARATIVE ANALYSIS RESPONDENT PERSONAL CHARACTERISTICS
UCMB (No.)
UPMB (No.)
UMMB (No.)
PNFP Sector (No.)
Public Sector (No.)
UCMB (%)
UPMB (%)
UMMB (%)
PNFP Sector
(%)
Public Sector
(%)
Total Numbers
Health Sector
(%)
Gender Female 149 112 8 269 225 71.3 60.2 50.0 65.5 56.7 494 61.1 Male 60 74 8 142 172 28.7 39.8 50.0 34.5 43.3 314 38.9
Age Under 30 87 78 5 170 57 42.0 44.1 29.4 42.4 14.5 227 28.6 Age 31-40 63 62 5 130 144 30.4 35.0 29.0 32.4 36.5 274 34.5 Age 41-50 41 21 3 65 103 19.8 11.9 17.6 16.2 26.1 168 21.1 Age 51 and over 16 16 4 36 90 7.4 9.0 23.5 9.0 22.8 126 15.8
Marital Status
Married 105 103 12 220 281 50.5 55.4 70.6 53.5 70.1 501 61.7 Single 103 83 5 191 120 49.5 44.6 29.4 46.5 29.9 311 38.3
Dependents Yes 182 162 14 358 393 93.8 87.1 82.4 90.2 99.2 751 94.7 No 12 24 3 39 3 6.2 12.9 17.6 9.8 0.8 42 5.3 Region of Birth
Central 35 41 5 81 35 17.6 22.5 31.3 20.4
9.1 116 15.0
East 6 42 0 48 68 3.0 23.1 0.0 12.1 17.7 116 15.0 North 74 18 0 92 78 37.2 9.9 0.0 23.2 20.3 170 21.9 West 24 15 0 39 49 12.1 8.2 0.0 9.8 12.7 88 11.4 Southwest 23 36 0 59 51 11.6 19.8 0.0 14.9 13.2 110 14.2 Northwest 37 30 11 78 97 18.6 16.5 68.8 19.6 25.2 175 22.6 Region of Health
Central 46 57 5 108 83 21.4 30.6 29.4 25.8
20.3 191 23.1

Retention_Study
96
Facility East 0 41 0 41 45 0.0 22.0 0.0 9.8 11.0 86 10.4 North 87 19 0 106 93 40.5 21.6 0.0 25.4 22.7 199 24.1 West 25 0 0 25 63 11.6 0.0 0.0 6.0 15.4 88 10.6 Southwest 23 43 0 66 34 10.7 23.1 0.0 15.8 8.3 100 12.1 Northwest 34 26 12 72 91 15.8 14.0 70.6 17.2 22.2 163 19.7
RESPONDENT EMPLOYMENT CHARACTERISTICS
UCMB (No.)
UPMB (No.)
UMMB (No.)
PNFP Sector (No.)
Public Sector (No.)
UCMB (%)
UPMB (%)
UMMB (%)
PNFP Sector
(%)
Public Sector
(%)
Total Numbers
Health Sector
(%)
Cadre Nursing 130 106 10 246 213 61.3 57.0 58.8 59.3 52.6 459 56.0 Allied Health
22 30 1 53 66 10.4 16.1 5.9 12.8 16.3 119 14.5
Medical Officer
18 9 0 27 44 8.5 4.8 0.0 6.5 10.8 71 8.7
Clinical Officer
16 13 3 32 41 7.5 7.0 17.6 7.7 10.1 73 8.9
Pharmacy 9 6 0 15 12 4.2 3.2 0.0 3.6 2.9 27 3.3 Other 17 22 3 42 29 8.0 11.8 7.6 10.1 7.2 71 8.7
First Job Yes 180 135 10 325 296 85.7 76.7 58.8 80.6 78.5 621 79.6 No 30 41 7 78 81 14.3 23.3 41.2 19.4 21.5 159 20.4
Years in Workforce
Under 5 yrs 92 85 2 179 54 45.1 47.5 11.8 44.8 13.7 233 29.4
5 - 10 years 43 49 6 98 110 21.1 27.4 35.3 24.5 28.0 208 26.2 More than
10 years 69 45 9 123 229 33.8 25.1 52.9 30.8 58.3 352 44.4

Retention_Study
97
Years at Organisation
Under 2 years
43 40 4 87 25 20.7 23.0 23.5 21.8 6.3 112 14.1
2 - 5 years 64 58 5 127 85 30.8 33.3 29.4 31.8 21.4 212 26.6 6 - 10 years 34 34 2 70 68 16.3 19.5 11.8 17.5 17.1 138 17.3 More than
10 years 67 42 6 115 219 32.2 24.1 35.3 28.8 55.2 334 42.0
Years at Facility
Under 2 years
33 44 6 83 38 16.8 24.4 35.3 21.2 9.9 121 15.6
2 - 5 years 68 63 7 138 101 34.5 35.6 41.2 35.3 26.2 239 30.8 6 - 10 years 40 38 3 81 80 20.3 21.5 17.6 20.7 20.8 161 20.7
More than 10 years
56 32 1 89 166 28.4 18.1 5.9 22.8 43.1 255 32.9
Hard-to-Reach
Hard-to-Reach
90 90 133 42.1 42.1 32.6 223 35.9
Not Hard-to-Reach
124 124 275 57.9 57.9 67.4 399 64.1
Health Workers Working in the Region Where They Were Born
Central 8 19 0 27 6 22.9 46.3 0.0 33.3 17.1 33 28.4 East 0 21 0 21 14 0.0 50.0 0.0 43.8 20.6 35 30.2 North 50 12 0 62 58 67.6 66.7 0.0 67.4 74.4 120 70.6 West 13 0 0 13 19 54.2 0.0 0.0 33.3 38.8 32 36.4 Southwest 11 13 0 24 12 47.8 36.1 0.0 40.7 23.5 36 32.7 Northwest 20 23 10 53 68 54.1 76.7 90.9 67.9 70.1 121 69.1
JOB SATISFACTION and MORALE TO WHAT EXTENT DO YOU AGREE WITH THE FOLLOWING STATEMENTS?
UCMB (%)
UPMB (%)
UMMB (%)
Public/ GoU (%)
Average Score PNFP (%)
Average Score Public Sector

Retention_Study
98
(%)
Considering everything, I am satisfied with my job. 49.2 64.4 47.0 49.0 53.5 52.4 When I come to work, I know what is expected of me. 96.2 96.7 100.0 95.8 97.6 97.2 I have a good friend at work. 87.8 85.9 88.3 91.7 87.3 88.4 I am actively involved in helping to make this a great health care facility. 86.9 90.3 94.1 87.9 90.4 89.8 The job is a good match for my skills and experience. 90.9 86.1 87.6 85.9 88.2 87.6 I consider myself a part of this community. 85.2 87.3 100.0 87.8 90.8 90.1 I would encourage my friends and family to seek care here. 82.0 81.7 87.6 76.8 83.8 82.0 My supervisor is available when I need support. 71.6 70.1 87.5 66.9 76.4 74.0 My immediate supervisor cares about me as a person. 58.0 67.6 76.5 64.1 67.4 66.6 My opinion seems to matter at work; I am respected. 59.8 66.9 70.6 70.2 65.8 66.9 I am fairly evaluated on my work. 61.9 60.8 88.2 65.9 70.3 69.2 The hospital manager here is competent and committed. 62.4 67.4 56.3 58.5 62.0 61.2 I have flexibility to balance the demands of my workplace and my personal life.
51.7 63.4 64.7 64.0 59.9 61.0
I have been given the training needed to succeed in my position. 61.4 67.2 70.6 66.7 66.4 66.5 I receive recognition for doing good work. 48.2 59.1 76.5 59.1 61.3 60.7 The organisation takes specific measures to protect me against HIV/AIDS.
74.0 62.5 82.3 50.3 72.9 67.3
Overall, the morale level at my department or section is good. 50.5 58.3 81.3 41.6 63.4 57.9 This is a fun place to work; the work I am doing is stimulating. 41.8 46.8 52.3 37.9 47.0 44.7 In the past six months, someone has talked to me to encourage my development.
45.2 38.3 50.1 45.3 44.5 44.7
I have been abused (physically, emotionally, verbally) by a supervisor. 25.8 20.2 5.9 23.6 17.3 18.9 I have been abused (physically, emotionally, verbally) by patients/their friends/family members.
21.1 18.5 5.9 23.1 15.2 17.2
I have been abused (physically, emotionally, verbally) by my peers. 14.3 16.4 5.9 16.6 12.2 13.3 I have been abused (physically, emotionally, verbally) while traveling 14.4 14.8 25.0 20.0 18.1 18.6

Retention_Study
99
to/from work. WORKING CONDITIONS TO WHAT EXTENT DO YOU AGREE WITH THE FOLLOWING STATEMENTS?
UCMB (%)
UPMB (%)
UMMB (%)
Public/ GoU (%)
Average Score PNFP (%)
Average Score Public Sector
(%) At home, I have access to safe, clean water. 80.2 82.9 75.0 65.8 79.4 76.0 At work, I have access to safe, clean water. 83.8 71.8 76.4 55.5 77.3 71.9 This facility has good access to drugs and medications. 83.4 75.7 64.7 41.0 74.6 66.2 I have the supplies I need to do my job well and safely (gloves, needles, bandages, etc).
79.0 69.0 82.3 36.0 76.8 66.6
I have the equipment I need to do my job well and efficiently (ultrasound, x-ray, blood pressure cuffs).
86.1 66.3 40.0 27.2 64.1 54.9
At work, I have good access to electricity. 69.8 75.2 47.1 37.1 64.0 57.3 I feel I have job security. 43.9 37.3 53.0 58.0 44.7 48.1 I have access to good schooling for my children. 31.5 37.2 50.0 36.6 39.6 38.8 The community where I live has good shopping and entertainment. 38.3 34.6 47.0 33.1 40.0 38.3 The workload is manageable. 35.0 53.5 82.4 35.2 57.0 51.5 At home, I have good access to electricity. 46.0 42.0 29.4 28.3 39.1 36.4 I can take time to eat lunch almost every day. 32.6 52.8 64.7 28.6 50.0 44.7 I have safe and efficient transportation to work. 34.7 37.8 43.8 20.3 38.8 34.2
COMPENSATION

Retention_Study
100
TO WHAT EXTENT DO YOU STRONGLY AGREE WITH THE FOLLOWING STATEMENTS?
UCMB (%)
UPMB (%)
UMMB (%)
Public/ GoU (%)
Average Score PNFP (%)
Average Score Public Sector
(%) I feel there are sufficient opportunities for promotion here 27.9 31.3 35.3 32.9 31.5 31.9 My salary package is fair 11.7 21.5 11.8 11.7 15.0 14.2 HOW IMPORTANT IS IT TO YOU THAT THE FOLLOWING COMPENSATION FACTORS BE OFFERED BY AN ORGANISATION?
UCMB (%)
UPMB (%)
UMMB (%)
Public/ GoU (%)
Average Score PNFP (%)
Average Score Public Sector
(%) Salary: Very Important 83.7 77.1 88.2 89.9 83.0 84.7 Salary: Somewhat Important 12.5 20.7 11.8 8.3 15.0 13.3 Salary: Not Important 3.8 2.2 0.0 1.8 2.0 2.0 Family Health Care: Very Important 88.5 77.5 88.2 91.7 84.7 86.5 Family Health Care: Somewhat Important 9.1 15.9 11.8 5.6 12.3 10.6 Family Health Care: Not Important 2.4 6.6 0.0 2.8 3.0 3.0 Terminal Benefits: Very Important 83.8 73.9 58.8 89.5 72.2 76.5 Terminal Benefits: Somewhat Important 7.8 12.5 23.5 6.6 14.6 12.6 Terminal Benefits: Not Important 8.3 13.6 17.6 3.8 13.2 10.8 Housing Allowance: Very Important 80.9 65.7 64.7 84.8 70.4 74.0 Housing Allowance: Somewhat Important 13.9 15.7 5.9 8.1 11.8 10.9 Housing Allowance: Not Important 5.3 18.5 29.4 7.1 17.7 15.1 Transport Assistance: Very Important 71.0 66.5 68.8 80.5 68.8 71.7 Transport Assistance: Somewhat Important 17.4 19.0 12.5 10.9 16.3 15.0 Transport Assistance: Not Important 11.6 14.5 18.8 8.6 15.0 13.4

Retention_Study
101
Food Allowance: Very Important 72.7 68.2 76.5 83.6 72.5 75.3 Food Allowance: Somewhat Important 14.6 15.1 17.6 8.8 15.8 14.0 Food Allowance: Not Important 12.7 16.8 5.9 7.6 11.8 10.8 Ranked Number 1 Overall: Family Health Care 88.5 77.5 88.2 91.7 84.7 86.5 Ranked Number 2 Overall: Salary 83.7 77.1 88.2 89.9 83.0 84.7 Ranked Number 3 Overall: Terminal Benefits 83.8 73.9 58.8 89.5 72.2 76.5 Ranked Number 4 Overall: Food Allowance 72.7 68.2 76.5 83.6 72.5 75.3 Ranked Number 5 Overall: Housing Allowance 80.9 65.7 64.7 84.8 70.4 74.0 Ranked Number 6 Overall: Transport Assistance 71.0 66.5 68.8 80.5 68.8 71.7
INTENT TO LEAVE: FACTORS AND THEIR IMPORTANCE IF YOU WERE TO CONSIDER LEAVING YOUR CURRENT JOB/POSITION, HOW IMPORTANT WOULD THE FOLLOWING FACTORS BE IN THAT DECISION?
UCMB (%)
UPMB (%)
UMMB (%)
Public/ GoU (%)
Average Score PNFP (%)
Average Score Public Sector
(%) Percent of respondents indicating factor is “very important” for their leaving:
Low pay/salary/allowances 83.1 78.9 81.3 81.1 81.1 81.1 Limited opportunities for promotion 54.6 59.0 56.3 67.3 56.6 59.3 Poor access to higher education for myself 71.5 67.2 68.8 62.6 69.2 67.5 High cost of living 51.0 47.5 62.5 58.1 53.7 54.8 Poor educational facilities for children 56.0 54.3 50.0 56.9 53.4 54.3 Poor access to supplies and equipment at work 44.0 40.0 50.0 53.6 44.7 46.9 Poor/lack of utilities (water, electricity) at work 44.7 41.6 56.3 52.2 47.5 48.7 Lack of housing facilities 53.6 49.2 50.0 56.2 50.9 52.3 High workload 54.8 30.0 18.8 44.3 34.5 37.0 Poor supervision and management 49.8 37.6 68.8 35.8 52.1 48.0

Retention_Study
102
Transport problems 35.7 36.5 56.3 38.6 42.8 41.8 Social conflicts in the workplace 33.3 29.6 50.0 30.3 37.6 35.8 Poor/lack of utilities (water, electricity) at home 37.0 31.6 25.0 36.5 31.2 32.5 Communication problems, telephones 28.8 20.8 31.3 36.0 27.0 29.2 Work is far from home. 28.8 28.2 43.8 31.8 33.6 33.2
INTENT TO LEAVE: BY SELECTED CATEGORIES
CADRE UCMB (%)
UPMB (%)
UMMB (%)
Public/ GoU (%)
Average Score PNFP (%)
Average Score Public Sector
(%) Ready to leave current job/position within two years from now.
Allied Health 36.8 33.3 0.0 25.0 23.4 23.8 Clinical Officer 53.3 27.3 33.3 10.8 38.0 31.2 Medical Officer 82.4 42.9 0.0 45.9 41.8 42.8 Nursing 22.9 19.5 0.0 14.6 14.1 14.3 Pharmacy 33.3 16.7 0.0 0.0 16.7 12.5 Other 50.0 24.8 0.0 12.5 24.9 21.8
High risk of leaving Uganda, or the health sector
Allied Health 6.7 27.2 0.0 14.0 11.3 12.0 Clinical Officer 15.4 0.0 33.3 20.0 16.2 17.2 Medical Officer 25.0 12.5 0.0 55.9 12.5 23.4 Nursing 5.7 17.1 0.0 12.9 7.6 8.9 Pharmacy 33.3 0.0 0.0 0.0 11.1 8.3 Other 0.0 5.3 0.0 9.1 1.8 3.6

Retention_Study
103
AGE UCMB (%)
UPMB (%)
UMMB (%)
Public/ GoU (%)
Average Score PNFP (%)
Average Score Public Sector
(%) Ready to leave current job/position within two years from now.
Less than 30 years 48.1 35.0 0.0 21.6 27.7 26.2 31 - 40 years 29.6 19.7 20.0 23.1 23.1 23.1 41 - 50 years 10.0 15.0 0.0 10.0 8.3 8.8 51 years and above 18.8 20.0 0.0 19.5 12.9 14.6
High risk of leaving Uganda, or the health sector
Less than 30 years 13.2 17.9 0.0 33.3 10.4 16.1 31 - 40 years 8.7 14.0 0.0 20.0 7.6 10.7 41 - 50 years 6.3 6.7 0.0 16.4 4.3 7.4 51 years and above 8.3 16.6 33.3 8.6 19.4 16.7
INTENT TO LEAVE: BY SELECTED CATEGORIES
YEARS OF EXPERIENCE
UCMB (%)
UPMB (%)
UMMB (%)
Public/ GoU (%)
Average Score PNFP (%)
Average Score Public Sector
(%) Ready to leave current job/position within two years
Under 5 years 42.0 30.6 0.0 10.4 24.2 20.8 5 - 10 years 29.3 23.6 0.0 29.2 17.6 20.5

Retention_Study
104
from now. More than 10 years 21.5 17.5 11.1 15.9 16.7 16.5 High risk of leaving Uganda, or the health sector
Under 5 years 14.9 16.7 0.0 16.2 10.5 12.0 5 - 10 years 5.6 15.0 0.0 27.7 6.9 12.1 More than 10 years 7.7 18.6 16.7 14.0 14.3 14.3
FACILITY TENURE
UCMB (%)
UPMB (%)
UMMB (%)
Public/ GoU (%)
Average Score PNFP (%)
Average Score Public Sector
(%) Ready to leave current job/position within two years from now.
Under 2 years 46.9 40.5 0.0 15.6 29.1 25.8 2 - 5 years 45.6 20.4 14.3 26.9 26.8 26.8 6 - 10 years 18.9 24.3 0.0 23.0 14.4 16.6 More than 10 years 17.0 16.7 0.0 12.9 11.2 11.7
High risk of leaving Uganda, or the health sector
Under 2 years 7.1 11.8 20.0 26.9 13.0 16.5 2 - 5 years 14.6 23.8 0.0 26.0 12.8 16.1 6 - 10 years 2.8 13.4 0.0 15.0 5.4 7.8 More than 10 years 13.2 7.7 0.0 13.8 7.0 8.7
INTENT TO LEAVE: BY SELECTED CATEGORIES
DISTRICT EASE OF REACH
UCMB (%)
UPMB (%)
UMMB (%)
Public/ GoU (%)
Average Score PNFP (%)
Average Score Public Sector
(%) Ready to leave current job/position within two years from now.
Hard-to-Reach 32.5 19.0 32.5 25.8 Not Hard-to-Reach 33.0 18.8 33.0 25.9

Retention_Study
105
High risk of leaving Uganda, or the health sector
Hard-to-Reach 11.9 9.3 11.9 10.6 Not Hard-to-Reach 9.4 23.0 9.4 16.2
FIRST JOB UCMB
(%) UPMB
(%) UMMB
(%) Public/ GoU (%)
Average Score PNFP (%)
Average Score Sector
(%) Ready to leave current job/position within two years from now.
YES 31.7 25.7 0.0 17.5 19.1 18.7 NO 39.3 22.2 14.3 24.3 25.3 25.0
High risk of leaving Uganda, or the health sector.
YES 9.2 15.1 14.3 17.2 12.9 14.0 NO 21.1 19.3 0.0 20.0 13.5 15.1
INTENT TO STAY: BY SELECTED CATEGORIES
CADRE UCMB (%)
UPMB (%)
UMMB (%)
Public/ GoU (%)
Average Score PNFP (%)
Average Score Public Sector
(%) Likely to stay in Uganda and work in health care.
Allied Health 93.3 72.8 100.0 86.0 88.7 88.0 Clinical Officer 84.6 100.0 66.7 80.0 83.8 82.8 Medical Officer 75.0 87.5 0.0 44.1 54.2 51.7 Nursing 94.3 82.9 100.0 87.1 92.4 91.1 Pharmacy 66.7 100.0 0.0 100.0 55.6 66.7 Other 100.0 94.7 100.0 90.9 98.2 96.4
Intent to stay in current job/position for at least three more years.
Allied Health 63.2 62.5 100.0 75.0 75.2 75.2 Clinical Officer 46.7 54.5 100.0 89.2 67.1 72.6 Medical Officer 17.6 42.9 0.0 54.1 20.2 28.7

Retention_Study
106
Nursing 77.1 73.6 90.0 85.4 80.2 81.5 Pharmacy 66.7 83.3 0.0 100.0 50.0 62.5 Other 50.0 68.8 100.0 87.5 72.9 76.6
AGE UCMB
(%) UPMB
(%) UMMB
(%) Public/ GoU (%)
Average Score PNFP (%)
Average Score Public Sector
(%) Likely to stay in Uganda and work in health care.
Less than 30 years 86.8 82.1 100.0 66.7 89.6 83.9 31 - 40 years 91.3 86.0 100.0 80.0 92.4 89.3 41 - 50 years 93.8 93.3 100.0 83.6 95.7 92.7 51 years and above 91.7 68.4 66.7 91.4 75.6 79.6
Intent to stay in current job/position for at least three more years.
Less than 30 years 51.9 60.0 100.0 78.4 70.6 72.6 31 - 40 years 70.4 69.6 60.0 76.9 66.7 69.2 41 - 50 years 90.0 80.0 100.0 90.0 90.0 90.0 51 years and above 81.3 80.0 100.0 80.5 87.1 85.5
INTENT TO STAY: BY SELECTED CATEGORIES
YEARS OF EXPERIENCE
UCMB (%)
UPMB (%)
UMMB (%)
Public/ GoU (%)
Average Score PNFP (%)
Average Score Public Sector
(%) Likely to stay in Uganda and work in health care.
Under 5 years 85.1 83.3 100.0 83.8 89.5 88.1 5 - 10 years 94.4 85.0 100.0 72.3 93.1 87.9 More than 10 years 92.3 87.6 83.3 86.0 87.7 87.3
Intent to stay in current job/position for at least three
Under 5 years 58.0 65.2 100.0 89.6 74.4 78.2 5 - 10 years 70.7 65.8 100.0 70.8 78.8 76.8

Retention_Study
107
more years. More than 10 years 78.5 75.0 77.7 84.1 77.1 78.8
FACILITY TENURE
UCMB (%)
UPMB (%)
UMMB (%)
Public/ GoU (%)
Average Score PNFP (%)
Average Score Public Sector
(%) Likely to stay in Uganda and work in health care.
Under 2 years 92.9 88.2 80.0 73.1 87.0 83.6 2 - 5 years 85.4 76.2 100.0 74.0 87.2 83.9 6 - 10 years 97.2 86.6 100.0 85.0 94.6 92.2 More than 10 years 86.8 92.3 0.0 86.2 59.7 66.3
Intent to stay in current job/position for at least three more years.
Under 2 years 53.1 51.3 100.0 84.4 68.1 72.2 2 - 5 years 54.4 71.5 71.4 73.1 65.8 67.6 6 - 10 years 81.1 69.7 100.0 77.0 83.6 82.0 More than 10 years 83.0 80.0 100.0 87.1 87.7 87.5
INTENT TO STAY: BY SELECTED CATEGORIES
DISTRICT EASE OF REACH
UCMB (%)
UPMB (%)
UMMB (%)
Public/ GoU (%)
Average Score PNFP (%)
Average Score Public Sector
(%) Likely to stay in Uganda and work in health care.
Hard-to-Reach 88.1 90.7 88.1 89.4 Not Hard-to-Reach 90.6 77.0 90.6 83.8
Intent to stay in current job/position for at least three more years.
Hard-to-Reach 67.5 81.0 67.5 74.3 Not Hard-to-Reach 67.0 81.2 67.0 74.1

Retention_Study
108
FIRST JOB UCMB
(%) UPMB
(%) UMMB
(%) Public/ GoU (%)
Average Score PNFP (%)
Average Score Public Sector
(%) Likely to stay in Uganda and work in health care.
YES 90.8 84.5 85.7 82.8 87.0 86.0 NO 78.9 80.7 100.0 80.0 86.5 84.9
Intent to stay in current job/position for at least three more years.
YES 68.3 68.2 100.0 82.5 78.8 79.8 NO 60.7 69.4 71.4 75.7 67.2 69.3
OVERALL JOB SATISFACTION: BY SELECTED CATEGORIES
CADRE UCMB (%)
UPMB (%)
UMMB (%)
Public/ GoU (%)
Average Score PNFP (%)
Average Score Public Sector
(%) Percent (%) satisfied or very satisfied with their job.
Allied Health 35.0 27.5 0.0 43.8 20.8 26.6 Clinical Officer 26.7 36.4 33.3 57.9 32.1 38.6 Medical Officer 44.4 22.2 0.0 35.0 22.2 25.4 Nursing 51.8 25.3 30.0 50.0 35.7 39.3 Pharmacy 66.7 50.0 0.0 45.5 38.9 40.6 Other 60.0 4.5 66.7 62.5 43.7 48.4
Percent (%) dissatisfied with or neutral about their job.
Allied Health 65.0 72.5 100.0 56.3 79.2 73.5 Clinical Officer 73.3 63.6 66.7 42.1 67.9 61.4 Medical Officer 55.6 77.8 0.0 65.0 44.5 49.6 Nursing 48.2 74.7 70.0 50.0 64.3 60.7 Pharmacy 33.3 50.0 0.0 54.5 27.8 34.5

Retention_Study
109
Other 40.0 95.5 33.3 37.5 56.3 51.6
AGE UCMB (%)
UPMB (%)
UMMB (%)
Public/ GoU (%)
Average Score PNFP (%)
Average Score Public Sector
(%) Percent (%) satisfied or very satisfied with their job.
Less than 30 years 45.3 27.4 40.0 36.4 37.6 37.3 31 - 40 years 40.0 22.5 40.0 47.8 34.2 37.6 41 - 50 years 62.5 35.0 33.3 41.4 43.6 43.1 51 years and above 86.7 12.4 50.0 63.2 49.7 53.1
Percent (%) dissatisfied with or neutral about their job.
Less than 30 years 54.7 72.6 60.0 63.6 62.4 62.7 31 - 40 years 60.0 77.5 60.0 52.2 65.8 62.4 41 - 50 years 37.5 65.0 66.7 58.6 56.4 57.0 51 years and above 13.3 87.6 50.0 36.8 50.3 46.9
OVERALL JOB SATISFACTION: BY SELECTED CATEGORIES
YEARS OF EXPERIENCE
UCMB (%)
UPMB (%)
UMMB (%)
Public/ GoU (%)
Average Score PNFP (%)
Average Score Public Sector
(%) Percent (%) satisfied or very Under 5 years 41.1 22.8 50.0 51.9 38.0 41.5

Retention_Study
110
satisfied with their job. 5 - 10 years 53.7 28.6 33.3 42.2 38.5 39.5 More than 10 years 59.7 22.3 33.3 50.0 38.4 41.3
Percent (%) dissatisfied with or neutral about their job..
Under 5 years 58.9 77.2 50.0 48.1 62.0 58.6 5 - 10 years 46.3 71.4 66.7 57.8 61.5 60.6 More than 10 years 40.3 77.7 66.7 50.0 61.6 58.7
FACILITY
TENURE UCMB
(%) UPMB
(%) UMMB
(%) Public/ GoU (%)
Average Score PNFP (%)
Average Score Public Sector
(%) Percent (%) satisfied or very satisfied with their job.
Under 2 years 51.5 25.0 16.7 40.5 31.1 33.4 2 - 5 years 41.5 23.8 42.8 41.5 36.0 37.4 6 - 10 years 47.5 26.3 66.7 48.7 46.8 47.3 More than 10 years 63.0 18.7 0.0 51.9 27.2 33.4
Percent (%) dissatisfied with or neutral about their job.
Under 2 years 48.5 75.0 83.3 59.5 68.9 66.6 2 - 5 years 58.5 76.2 57.2 58.5 64.0 62.6 6 - 10 years 52.5 73.7 33.3 51.3 53.2 52.7 More than 10 years 37.0 81.3 100.0 48.1 72.8 66.6
OVERALL JOB SATISFACTION: BY SELECTED CATEGORIES
DISTRICT EASE OF REACH
UCMB (%)
UPMB (%)
UMMB (%)
Public/ GoU (%)
Average Score PNFP (%)
Average Score Public Sector
(%) Percent (%) satisfied or very Hard-to-Reach 43.0 50.0 43.0 46.5

Retention_Study
111
satisfied with their job. Not Hard-to-Reach 53.7 48.3 53.7 51.0 Percent (%) dissatisfied with or neutral about their job.
Hard-to-Reach 57.0% 50.0% 57.0% 53.5% Not Hard-to-Reach 46.3% 51.0% 46.3% 48.7%
FIRST JOB UCMB
(%) UPMB
(%) UMMB
(%) Public/ GoU (%)
Average Score PNFP (%)
Average Score Public Sector
(%) Percent (%) satisfied or very satisfied with their job.
Yes 48.3 22.3 30.0 49.8 33.5 37.6 No 57.1 32.5 42.8 41.3 44.1 43.4
Percent (%) dissatisfied with or neutral about their job.
Yes 51.7 77.7 70.0 50.2 66.5 62.4 No 42.9 67.5 57.2 58.8 55.9 56.6

Retention_Study
112
APPENDIX IV NUMBER OF RESPONDENTS WORKING IN THE REGION THEY WERE BORN; BY FACILITY OWNERSHIP
APPENDIX V NUMBER OF FOCUS GROUP DISCUSSANTS BY FACILITY AND CADRE: PHASE II
UCMB UPMB UMMB GoU KAMPALA 8 19 6
CENTRAL NAKASEKE 1 MPIGI 1 LUWERO 1
Sub-Total Central 8 19 3 6 JINJA 1
EAST KUMI 21 MBALE 1 11 SIRONK0 3
Sub-Total East 0 21 2 14 UCMB UPMB UMMB GoU GULU 29 34
NORTH APAC 21 24 LIRA 8 AMOLATAR 4
Sub-Total North 50 12 0 58 WEST KABAROLE 13 6
KIBAALE 13 Sub-Total West 13 0 0 19
MBARARA 10 5 7 SOUTHWEST BUSHENYI 8
NTUNGAMO 1 5 Sub-Total Southwest 11 13 0 12
NEBBI 17 1 41 NORTHWEST ARUA 23 10
MOYO 3 27 Sub-Total Northwest 20 23 11 68
GRAND TOTAL 102 88 16 177

Retention_Study
113
Organisation Type of group Number 1. Amai Community Hospital Nurses 13 2. Amai Community Hospital Allied Health 5 3. Kuluva Hospital Enrolled Nurses and Midwives 16 4. Kuluva Hospital Physicians 2 5. Kuluva Hospital Allied Health Workers 5 6. Kuluva Hospital Registered Nurses and Midwives 7 7. Mengo Hospital Physician– Medical Officer 2 8. Mengo Hospital Nurses – Ward In-Charges 11 9. Mengo Hospital Enrolled Nurses and Enrolled Midwives 7 10. Mengo Hospital Allied Health and Pharmacy 7 11. Kumi Hospital Enrolled Nurses 15 12. Kumi Hospital Registered Nurses 7 13. Kumi Hospital Laboratory 3 14. Mengo Hospital Laboratory Staff 7 15. Kumi Hospital Clinical Officers 5 16. Kumi Hospital Physicians 3 17. Saidina Abubakar Hospital Allied Health Group 3 18. Saidina Abubakar Islamic Hospital Medical Officer 3 19. Ruharo Mission Hospital Managers 4 20. Ruharo Hospital Allied Health Professionals 4 21. Ruharo Hospital Registered and Enrolled Nurses 5 22. Ruharo Hospital Nurses 4 23. Ishaka Hospital Clinical Officers/Dispenser/Lab 6 24. Ishaka Hospital Registered Nurses and Midwives 5 25. Ishaka Hospital Enrolled Nurses 10 26. Oriagin Hospital Allied Health Professionals 4 27. Oriagin Hospital Nurses 9