Embed Size (px)
Citation preview
MARINE ECOLOGY PROGRESS SERIESMar Ecol Prog Ser
Vol. 301: 1–7, 2005 Published October 11
INTRODUCTION
The development of satellite telemetry in the late1980s allowed the first in-depth studies of animalmovement patterns (Parmelee et al. 1985, Duron-DeFrenne 1987, Fancy et al. 1988). Since then, ServiceArgos, a joint venture between the Centre Nationald’Etudes Spatiales (CNES, the French space agency),the National Aeronautics and Space Administration(NASA, USA) and the National Oceanic and Atmo-spheric Administration (NOAA, USA), has emerged asthe predominant satellite-based system for trackingwildlife (Argos 1996). Polar orbiting satellites can
© Inter-Research 2005 · www.int-res.com*Email: [email protected]
FEATURE ARTICLE
Satellite Tracking and Analysis Tool (STAT):an integrated system for archiving, analyzing
and mapping animal tracking data
M. S. Coyne1, 2,*, B. J. Godley3
1Marine Geospatial Ecology Lab, Nicholas School of the Environment and Earth Sciences, Duke University, Durham,North Carolina 27708-0328, USA
2SEATURTLE.ORG, 1 Southampton Place, Durham, North Carolina 27705, USA3Marine Turtle Research Group, Center for Ecology and Conservation, University of Exeter in Cornwall, Penryn,
Cornwall, TR10 9EZ, UK
ABSTRACT: Despite the obvious power and advan-tages of the Argos system to track animals by satellite,the data generated are difficult for many biologists toexploit. A broad range of skills is required to efficientlydownload, collate, filter and interpret Argos data. Inte-gration of animal movements with other physical (e.g.remote sensing imagery) and anthropogenic (e.g. fish-ery distributions) datasets presents additional technicaland computing challenges. The Satellite Tracking andAnalysis Tool (STAT) is a freely available system de-signed for biologists who work on animal tracking; itincludes a set of standardized tools and techniques fordata management, analysis, and integration with envi-ronmental data. STAT logs in to the Argos computernetwork each day and downloads all available loca-tions and associated data for each user. These data areparsed and stored in a relational database and auto-matically backed up to an offsite location. A number ofdata filtering options are available, including settingmaximum speed, time or distance between consecutivepoints, Argos location class, and turning angle. A vari-ety of environmental data layers, including bathymetry,sea surface temperature, sea surface height, ocean cur-rents and chlorophyll, can be sampled for all locationsin the STAT database and can be downloaded andincorporated into tracking maps and animations. STATalso facilitates collaboration and the sharing of animaltracking information with the wider public and fundingorganizations. We hope that STAT will act as a catalyticfoundation, fostering collaboration among users ofsatellite telemetry, and ensuring maximum value fromthese studies.
KEY WORDS: Satellite tracking · Argos · Wildlifetelemetry · Biologging · Oceanography
Resale or republication not permitted without written consent of the publisher
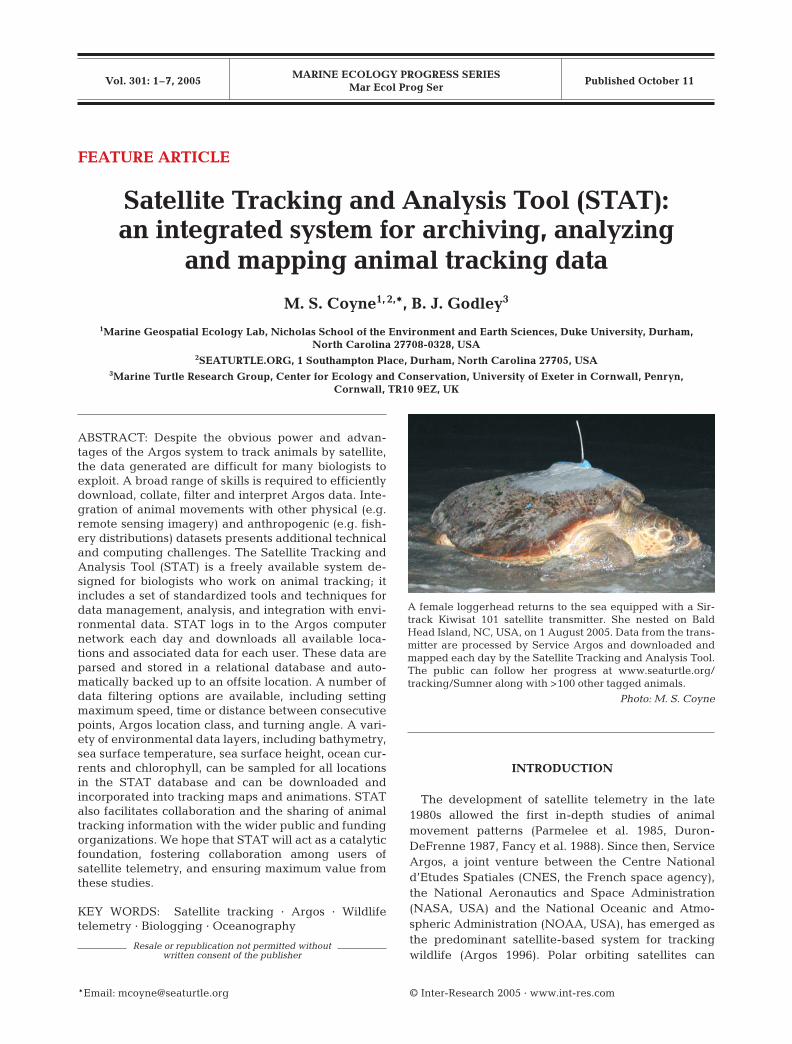
A female loggerhead returns to the sea equipped with a Sir-track Kiwisat 101 satellite transmitter. She nested on BaldHead Island, NC, USA, on 1 August 2005. Data from the trans-mitter are processed by Service Argos and downloaded andmapped each day by the Satellite Tracking and Analysis Tool.The public can follow her progress at www.seaturtle.org/tracking/Sumner along with >100 other tagged animals.
Photo: M. S. Coyne
Mar Ecol Prog Ser 301: 1–7, 2005
locate Platform Terminal Transmitters (PTTs) allowingthe generation of geographic location and limitedtransmission of sensor data. This is especially useful inthe marine realm, where many vertebrate taxa migrateover wide spatial scales and where other trackingmethodologies may be inadequate (Wilson et al. 2002).
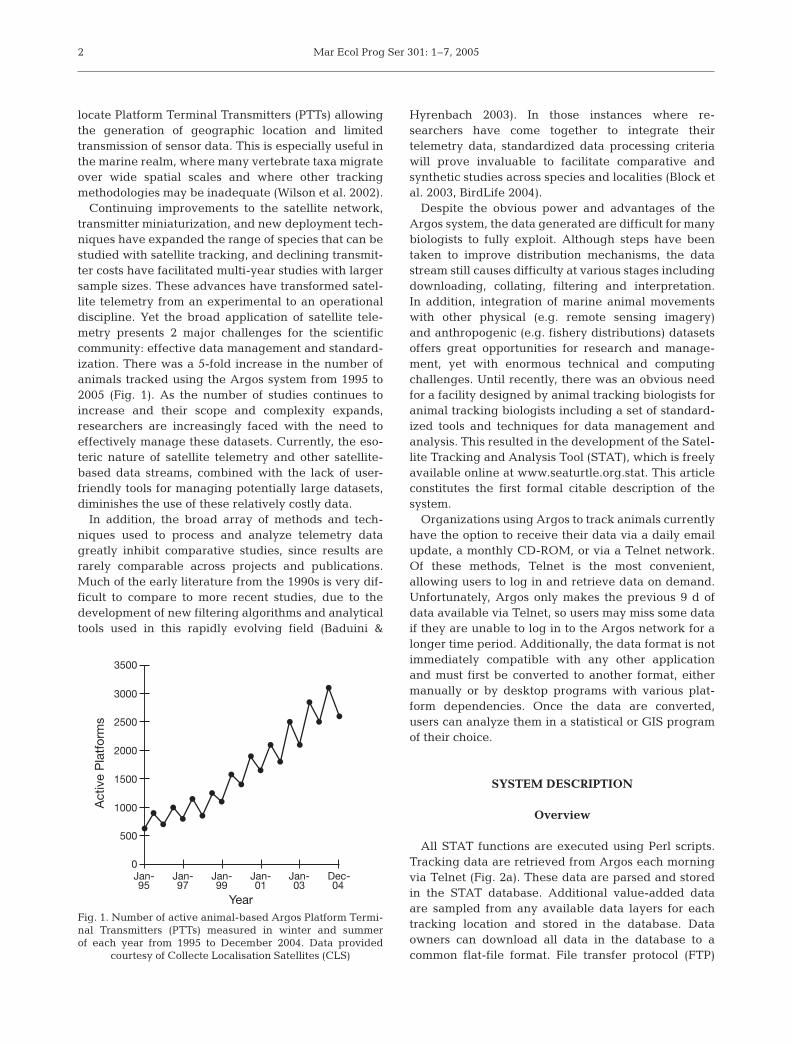
Continuing improvements to the satellite network,transmitter miniaturization, and new deployment tech-niques have expanded the range of species that can bestudied with satellite tracking, and declining transmit-ter costs have facilitated multi-year studies with largersample sizes. These advances have transformed satel-lite telemetry from an experimental to an operationaldiscipline. Yet the broad application of satellite tele-metry presents 2 major challenges for the scientificcommunity: effective data management and standard-ization. There was a 5-fold increase in the number ofanimals tracked using the Argos system from 1995 to2005 (Fig. 1). As the number of studies continues toincrease and their scope and complexity expands,researchers are increasingly faced with the need toeffectively manage these datasets. Currently, the eso-teric nature of satellite telemetry and other satellite-based data streams, combined with the lack of user-friendly tools for managing potentially large datasets,diminishes the use of these relatively costly data.
In addition, the broad array of methods and tech-niques used to process and analyze telemetry datagreatly inhibit comparative studies, since results arerarely comparable across projects and publications.Much of the early literature from the 1990s is very dif-ficult to compare to more recent studies, due to thedevelopment of new filtering algorithms and analyticaltools used in this rapidly evolving field (Baduini &
Hyrenbach 2003). In those instances where re-searchers have come together to integrate theirtelemetry data, standardized data processing criteriawill prove invaluable to facilitate comparative andsynthetic studies across species and localities (Block etal. 2003, BirdLife 2004).
Despite the obvious power and advantages of theArgos system, the data generated are difficult for manybiologists to fully exploit. Although steps have beentaken to improve distribution mechanisms, the datastream still causes difficulty at various stages includingdownloading, collating, filtering and interpretation.In addition, integration of marine animal movementswith other physical (e.g. remote sensing imagery)and anthropogenic (e.g. fishery distributions) datasetsoffers great opportunities for research and manage-ment, yet with enormous technical and computingchallenges. Until recently, there was an obvious needfor a facility designed by animal tracking biologists foranimal tracking biologists including a set of standard-ized tools and techniques for data management andanalysis. This resulted in the development of the Satel-lite Tracking and Analysis Tool (STAT), which is freelyavailable online at www.seaturtle.org.stat. This articleconstitutes the first formal citable description of thesystem.
Organizations using Argos to track animals currentlyhave the option to receive their data via a daily emailupdate, a monthly CD-ROM, or via a Telnet network.Of these methods, Telnet is the most convenient,allowing users to log in and retrieve data on demand.Unfortunately, Argos only makes the previous 9 d ofdata available via Telnet, so users may miss some dataif they are unable to log in to the Argos network for alonger time period. Additionally, the data format is notimmediately compatible with any other applicationand must first be converted to another format, eithermanually or by desktop programs with various plat-form dependencies. Once the data are converted,users can analyze them in a statistical or GIS programof their choice.
SYSTEM DESCRIPTION
Overview
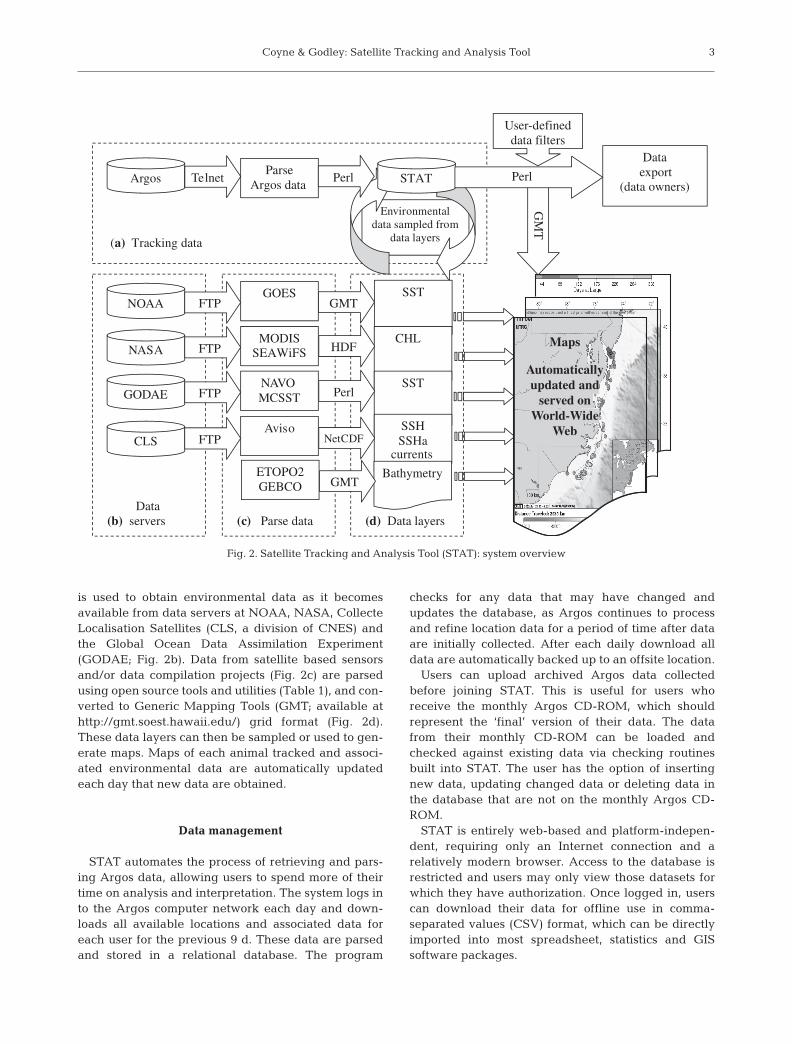
All STAT functions are executed using Perl scripts.Tracking data are retrieved from Argos each morningvia Telnet (Fig. 2a). These data are parsed and storedin the STAT database. Additional value-added dataare sampled from any available data layers for eachtracking location and stored in the database. Dataowners can download all data in the database to acommon flat-file format. File transfer protocol (FTP)
2
0
500
1000
1500
2000
2500
3000
3500
Jan-95
Jan-97
Jan-99
Jan-01
Jan-03
Dec-04
Year
Act
ive
Pla
tfor
ms
Fig. 1. Number of active animal-based Argos Platform Termi-nal Transmitters (PTTs) measured in winter and summerof each year from 1995 to December 2004. Data provided
courtesy of Collecte Localisation Satellites (CLS)
Coyne & Godley: Satellite Tracking and Analysis Tool
is used to obtain environmental data as it becomesavailable from data servers at NOAA, NASA, CollecteLocalisation Satellites (CLS, a division of CNES) andthe Global Ocean Data Assimilation Experiment(GODAE; Fig. 2b). Data from satellite based sensorsand/or data compilation projects (Fig. 2c) are parsedusing open source tools and utilities (Table 1), and con-verted to Generic Mapping Tools (GMT; available athttp://gmt.soest.hawaii.edu/) grid format (Fig. 2d).These data layers can then be sampled or used to gen-erate maps. Maps of each animal tracked and associ-ated environmental data are automatically updatedeach day that new data are obtained.
Data management
STAT automates the process of retrieving and pars-ing Argos data, allowing users to spend more of theirtime on analysis and interpretation. The system logs into the Argos computer network each day and down-loads all available locations and associated data foreach user for the previous 9 d. These data are parsedand stored in a relational database. The program
checks for any data that may have changed andupdates the database, as Argos continues to processand refine location data for a period of time after dataare initially collected. After each daily download alldata are automatically backed up to an offsite location.
Users can upload archived Argos data collectedbefore joining STAT. This is useful for users whoreceive the monthly Argos CD-ROM, which shouldrepresent the ‘final’ version of their data. The datafrom their monthly CD-ROM can be loaded andchecked against existing data via checking routinesbuilt into STAT. The user has the option of insertingnew data, updating changed data or deleting data inthe database that are not on the monthly Argos CD-ROM.
STAT is entirely web-based and platform-indepen-dent, requiring only an Internet connection and arelatively modern browser. Access to the database isrestricted and users may only view those datasets forwhich they have authorization. Once logged in, userscan download their data for offline use in comma-separated values (CSV) format, which can be directlyimported into most spreadsheet, statistics and GISsoftware packages.
3
(a) Tracking data
Data(b) servers (c) Parse data (d) Data layers
Environmentaldata sampled from
data layers
Argos
NASA
CLS
GODAE
NOAA
ParseArgos data
GOES
MODISSEAWiFS
NAVOMCSST
Aviso
SST
CHL
SST
SSHSSHa
currents
STATTelnet Perl
FTP
FTP
FTP
FTP NetCDF
Perl
HDF
GMT
ETOPO2GEBCO
BathymetryGMT
Dataexport
(data owners)
GM
T
Perl
User-defineddata filters
Maps
Automaticallyupdated and
served onWorld-Wide
Web
Fig. 2. Satellite Tracking and Analysis Tool (STAT): system overview
Mar Ecol Prog Ser 301: 1–7, 2005
Data filtering and editing
In addition to daily checks of the previous days’ dataand the potential to compare with the monthly dataCDs provided by Argos, adequate biological interpre-tation requires the possibility of data filtering and edit-ing. A number of options are available, including set-ting a maximum speed, time or distance betweenconsecutive points, Argos location class, start and enddate, and turning angle. The speed filter allows usersto filter points based upon the maximum biologicallyrelevant speed of the organism. Any combination of fil-ter options can be saved for later use. In addition, ancil-lary data such as distance, speed and time betweenlocations, cumulative time and distance from release,and distance from shoreline are included in all datadownloads and are dynamically updated as data arefiltered and edited.
Filtered data can be exported directly to SEA-TURTLE.ORG’s Maptool, a web-enabled interface toGMT representing a collection of open source tools formanipulating geographic data sets and producing highquality maps (Wessel & Smith 1998). The Maptool inter-face allows users to generate publication quality mapswithin the STAT online framework and has been em-powering to users without the financial means to affordexpensive GIS software and the associated hardware.
Integrated environmental data
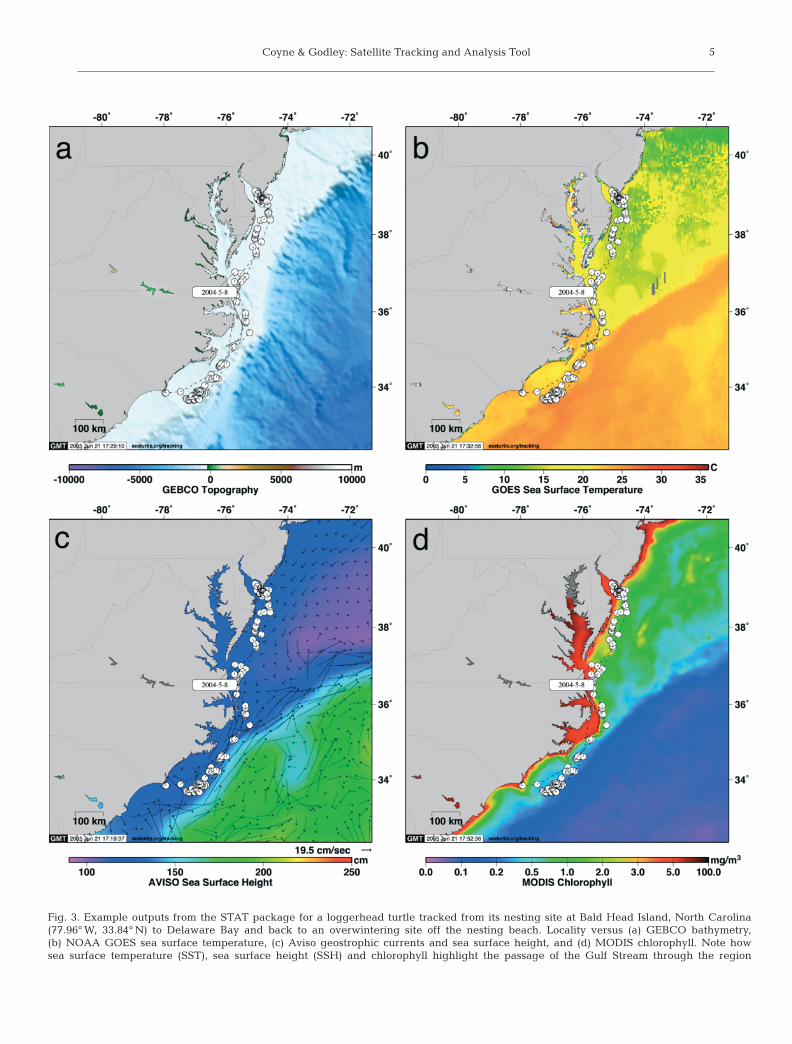
A variety of environmental data layers are availablein STAT for integration with animal tracking. Thesedata are sampled for all locations in the STAT databaseand can be downloaded and incorporated into trackingmaps and animations (Fig. 3).
Bathymetry. Both the General Bathymetric Chart ofthe Oceans (GEBCO) and the ETOPO2 Global 2-Minute Elevations products are available within STAT(Fig. 3a). GEBCO is a global topographic dataset withone-minute (1’) spatial resolution (www.ngdc.noaa.gov/mgg/gebco/; IOC, IHO, and BODC 2003). ETOPO2 is a
gridded database of seafloor and landelevations covering the entire surfaceof the earth (www.ngdc.noaa.gov/mgg/fliers/01mgg04.html). The database isbased on a 2’ latitude/longitude grid.
Sea surface temperature. Sea surfacetemperature (SST) data are gathereddaily from the NOAA GeostationaryOperational Environmental Satellites(GOES), and weekly and monthly fromAdvanced Very High Resolution Radio-meter (AVHRR) satellite-based sensors(Fig. 3b). Near real time SST data from
GOES are available from 5 May 2003 to the presentat a spatial resolution of 6 km (http://podaac.jpl.nasa.gov/products/product190.html. The geostation-ary observations increase the probability of obtainingcloud-free pixels over most of the western hemisphere;24 h composite gridded data are obtained from NOAAand gaps in each daily image are filled with data fromimages taken up to 2 d earlier and/or 2 d later, in aneffort to obtain a completely cloud-free scene. Thesedata are available from 180 to 30° W and 45° S to 60° N.To complement GOES data, global SST data areobtained from GODAE, processed by the US NavalOceanographic Office (www.usgodae.org; May et al.1998). Global weekly and monthly gridded data layersare interpolated from multi-channel SST data (MCSST;derived from AVHRR) at a spatial resolution of 0.05°(nominally 5.6 km) and are available from 1998 to pre-sent. Tracks that fall entirely within the geographicdomain of the GOES data set are mapped using thosedata. Tracks extending beyond the GOES domain areassociated with the MCSST data.
Sea surface height and currents. Sea surface height(SSH), sea surface height anomaly (SSHa) and seasurface current (geostrophic velocity vector) data lay-ers are obtained from the CNES/CLS Aviso/Altimetryproject (www.aviso.oceanobs.com; Ducet et al. 2000).The data products used are from the Ssalto/Duacsmultimission altimeter and include gridded sea levelanomalies, gridded absolute dynamic topography andgridded geostrophic currents (Fig. 3c). These datahave a spatial resolution of 1⁄3° and are available inweekly time steps from 1998 to 2003 on, and in 3.5 dtime steps from January 2004 to present. U and Vcomponents of the velocity vectors are sampled for allanimal locations added to STAT and stored in theSTAT database for analysis and download.
Chlorophyll. Global weekly and monthly chloro-phyll data layers are obtained from NASA’s OceanColor project SeaWiFS and MODIS satellite-basedsensors (http://oceancolor.gsfc.nasa.gov; McClain et al.2004). Chlorophyll data are available from SeaWiFS ata 9 km spatial resolution from 1998 through June 2002
4
Software Version Function Source
Perl 5.6.0 Wrapper perl.orgMySQL 2.23.53 Database mysql.comNetCDF 3.5.1 Data translation fink.sourceforge.netNCSA HDF 4.1r5 Data translation fink.sourceforge.netGMT 3.4.3 Mapping and gridding gmt.soest.hawaii.eduApache 1.3.33 Web server apache.orgGNU Wget 1.8.2 FTP data retrieval fink.sourceforge.netcurl 7.10.7 FTP data retrieval fink.sourceforge.net
Table 1. Open-source tools and utilities used in the STAT system
Coyne & Godley: Satellite Tracking and Analysis Tool 5
Fig. 3. Example outputs from the STAT package for a loggerhead turtle tracked from its nesting site at Bald Head Island, North Carolina(77.96° W, 33.84° N) to Delaware Bay and back to an overwintering site off the nesting beach. Locality versus (a) GEBCO bathymetry,(b) NOAA GOES sea surface temperature, (c) Aviso geostrophic currents and sea surface height, and (d) MODIS chlorophyll. Note howsea surface temperature (SST), sea surface height (SSH) and chlorophyll highlight the passage of the Gulf Stream through the region
Mar Ecol Prog Ser 301: 1–7, 2005
and thereafter from MODIS at 4 km spatial resolution(Fig. 3d).
Visualizing data. STAT uses GMT to generate asuite of map products that are automatically updatedeach day as new data become available for eachtracked animal. Users can set a variety of preferencesthat determine the appearance of the map for eachtracked animal and the method by which tracking dataare filtered, and that include any of the environmentaldata layers illustrated in Fig. 3. High-resolution, publi-cation quality versions of each map are also available.In addition, summary tables, histograms and graphsare automatically generated to show the distribution ofArgos location classes, displacement from release,exposure to environmental variables over time and asummary of the number of days spent within geopolit-ical boundaries. Simple animations of animal move-ment through time are also generated automatically.Animations with specific parameters and includingany of the dynamic environmental layers mentionedabove are available upon request.
PERSPECTIVES
Education and public outreach
STAT facilitates data sharing and visualizing amongcollaborators but also facilitates sharing of excitinganimal tracking information with the general publicand funding organizations. All, some or none of thetracked animals of each project can be shared publiclyon SEATURTLE.ORG to inform and educate the publicabout animal tracking projects. Visitors to the website(www.seaturtle.org/tracking/) can subscribe to emailupdates. On 25 August 2005, 280 tracks were avail-able online; the tracking website currently receives>150 000 visits per month, and has had >2 million visitssince its inception in July 2003. A limited subset of datafrom any tagged animal can optionally be shared withteachers that register on SEATURTLE.ORG for educa-tional activities in the classroom. The intense publicinterest in large vertebrates tracked with STAT hasattracted attention from the mass media. The fact thatthe public can track study animals online in near realtime, combined with the availability of attractive maps,has lead to numerous articles in national and inter-national television, radio, print and online news outlets.
Outlook
At the time of writing (25 August 2005) there weremore than 590 animal tracks in the STAT database,and although it began with sea turtles, it currently
includes 36 organizations around the world and >57different projects on marine mammals, birds andsharks. It is important to note that many of the tools inSTAT can also be used in terrestrial tracking appli-cations.
Planned improvements include the addition of newenvironmental data layers; derived data layers (envi-ronmental gradients, frontal zones, distance from envi-ronmental features); and new analytical tools (homerange, spatial statistics, movement classification algo-rithms). Existing facilities will be improved to provideinteractive visualization and smart data filtering. It ishoped that the addition of metadata support willencourage investigators to begin to use the system asa data clearinghouse linked with existing efforts suchas the Census of Marine Life’s Ocean BiogeographicInformation System (http://seamap.env.duke.edu/;Halpin et al. 2004) and the Global Ocean ObservingSystem (http://ioc.unesco.org/goos; Nowlin et al.2001). In general, it is hoped that STAT will fostercollaboration among researchers utilizing satellitetelemetry and help ensure maximum value from thesestudies.
Acknowledgements. We thank A. Broderick and L. Hawkesof the Marine Turtle Research Group and M. Godfrey of theNorth Carolina Wildlife Resources Commission for providingthe track and maps used as examples. We thank Anne-MarieBreonce of CLS for providing data on the number of activeanimal platforms. B. Godley received funding from theNatural Environment Research Council (UK) during thedevelopment of this manuscript. Helpful comments on anearlier draft were provided by J. Blumenthal, A. Broderick, W.Fuller, M. Godfrey, L. Hawkes, M. Witt, D. Rowat, T. Tuckerand 4 anonymous referees. Finally, many thanks to all of thefounding users of STAT, who allowed the initiative to attaincritical mass and helped to refine its functionality by theirsuggestions, and to the oceanographic community for theirfar-sighted open-access ethos.
LITERATURE CITED
Argos (1996) User’s manual. CLS/Service Argos, ToulouseBaduini CL, Hyrenbach KD (2003) Biogeography of Procel-
lariiform foraging strategies: does ocean productivityinfluence provisioning? Mar Ornithol 31:101–112
BirdLife International (2004) Tracking ocean wanderers: theglobal distribution of albatrosses and petrels. BirdLifeInternational, Cambridge
Block BA, Costa DP, Boehlert GW, Kochevar RE (2003)Revealing pelagic habitat use: the Tagging of PacificPelagics Program. Oceanol Acta 25:255–266
Ducet N, Le Traon PY, Reverdin G (2000) Global high resolu-tion mapping of ocean circulation from Topex/Poseidonand ERS-1 and -2. J Geophys Res 105:19477–19498
Duron-DuFrenne M (1987) Premier suivi par satellite enAtlantique d’une tortue luth Dermochelys coriacea. CRAcad Sci Ser III 304:399–402
Fancy SG, Pank LF, Douglas DC, Curby CH, Garner GW,Amstrup SC, Regelin WL (1988) Satellite telemetry: a new
6
Coyne & Godley: Satellite Tracking and Analysis Tool
tool for wildlife research and management. US Fish WildlServ Res Publ 172:1–54
Halpin P, Read A, Crowder L, Best B, Hyrenbach D, FreemanS (2004) OBIS-SEAMAP: developing a biogeographicresearch data commons for the conservation of marinemammals, sea birds and sea turtles. In: ProceedingsOcean Biodiversity Informatics, International Conferenceon Marine Biodiversity Data Management, Hamburg,Germany, 29 Nov–1 Dec 2004
IOC, IHO, BODC (2003) Centenary Edition of the GEBCODigital Atlas. British Oceanographic Data Centre,Liverpool
May DA, Parmeter MM, Olszewski DS, McKenzie BD (1998)Operational processing of satellite sea surface tempera-ture retrievals at the Naval Oceanographic Office. BullAm Meteorol Soc 79:397–407
McClain CR, Feldman GC, Hooker SB (2004) An overview of
the SeaWiFS project and strategies for producing a cli-mate research quality global ocean bio-optical time series.Deep Sea Res II 51:5–42
Nowlin WD, Briscoe M, Smith N, McPhaden MJ, RoemmichD, Chapman P, Grassle JF (2001) Evolution of a sustainedocean observing system. Bull Am Meteorol Soc 82:1369–1376
Parmelee DF, Parmelee JM, Fuller M (1985) Ornithologicalinvestigations at Palmer Station: the first long-distancetracking of seabirds by satellites. Antarct J US 19:162–163
Wessel P, Smith WHF (1995) New version of the GenericMapping Tools released. EOS Trans Am Geol Union 76:329
Wilson RP, Grémillet D, Syder J, Kierspel MAM and 7 others(2002) Remote-sensing systems and seabirds: their use,abuse and potential for measuring marine environmentalvariables. Mar Ecol Prog Ser 228:241–261
7
Editorial responsibility: Otto Kinne (Editor-in-Chief), Oldendorf/Luhe, Germany
Submitted: June 23, 2005; Accepted: September 1, 2005 Proofs received from author(s): September 27, 2005
