Embed Size (px)
Citation preview
Satellite Rural Telephone Network Design:
A Methodology for Performance Optimization
Roberto Conte
Dissertation submitted to the Faculty of the
Virginia Polytechnic Institute and State University
in partial fulfillment of the requirements for the degree of
Doctor of Philosophy
in
Electrical and Computer Engineering
Dissertation Committee:
Dr. Timothy Pratt (Chair)
Dr. Charles W. Bostian
Dr. Dennis G. Sweeney
Dr. Scott F. Midkiff
Dr. George E. Morgan
September 28, 2000
Blacksburg, Virginia
Keywords: Satellite, VSAT networks, Network design, Rural telephony,
Cellular telephony, Multiple access, Wireless network
Copyright 2000, Roberto Conte
Satellite Rural Telephone Network Design:
A Methodology for Performance Optimization Roberto Conte
(ABSTRACT)
Rural telephony has historically been a recurring subject of concern for most large
developing countries. It is generally considered that rural telephone users do not generate the
same level of telephone traffic and, thus, revenue as urban users, lowering the incentives to
invest in rural telecommunications. The financial implications of wiring a vast area for low
telephone traffic causes most telephone service providers to ignore or delay offering telephone
service to those regions. Still, it is known that telecommunications are essential to the economic
development of a region, and that traffic increases rapidly as soon as the service is available.
A satellite–based telephone network can provide efficient long distance telephone service
to remote rural communities at a lower cost than land-based wired networks in most cases.
Mobile satellite systems already provide this service, but are limited in capacity and charge high
per-minute fees for the satellite link. Small earth stations and GEO satellites can provide this
service more efficiently and at lower cost.
A methodology to optimize the network performance has been developed. A set of
economic models to evaluate different combinations of network topologies and multiple access
techniques have been implemented, and a technical-economic assessment has been performed for
the different technologies under different traffic scenarios. Traffic intensity, network size and
per-minute user costs have been optimized to achieve the network’s economic break-even point
under different conditions and constraints. The general behavior of fixed-assignment Single
Channel per Carrier (SCPC), fixed-assignment Multiple Channel per Carrier (MCPC) and
demand-assignment SCPC star networks, as well as demand-assignment SCPC mesh networks
has been analyzed. Important parameters have been identified in order to improve the process of
effective and cost-efficient satellite rural telephone network design.

iii
Dedication
This work is dedicated to my beloved wife, partner and friend Olimpia, for
following me once again into our never ending adventures in life together.
To our children Roberto, Claudia and Anamilena, who contributed so much to my
well being and happiness on yet another family objective together, you will
always be in my heart.
To God, for all the blessings that He has given us.
To our friends in Blacksburg, Virginia, from whom we have received and learned
so much.
To our families in Mexico and Ohio, for their support and love.

iv
Acknowledgements
During the course of this research, I have received the assistance of many people
to whom I am very grateful.
First and foremost, I want to thank my adviser, Dr. Tim Pratt, for giving me his
support and advice throughout my studies in Virginia Tech. I am greatl y indebted
with him and this dissertation is an acknowledgement of his tenacity and his
confidence in me. Thank you.
I also would like to thank my committee members, Drs. Charles Bostian, Dennis
Sweeney, George Morgan and Scott Midkiff, for their patience and help
throughout my studies and research. Dr. Morgan was especially helpful on the
economic analysis and the use of computational tools.
This dissertation would have been very different without the help of my friends at
Virginia Tech, especially Max Robert, Carl Fossa, Anwer Khan and Punit
Mukhija. Thank you for our discussions and your helpful advice about this
research. I also want to thank Paulo Cardieri and Hao Xu for their warm
friendship and support all this time. A special thank you to Barbara Fraticelli,
ISE, who showed me the key to unfold and efficiently present my results.
I am greatly indebted with Dr. Jaime de la Ree and his family, for all their support
and friendship during our stay in Blacksburg.
I am thankful to all the personnel at the Center for Wireless Communications, for
allowing me to be a part of this nice group of people.
Finally, I want to thank my sponsors, the National Council for Science and
Technology (CONACyT) of Mexico, the U.S. Department of State‘s Fulbright
Program and CICESE Research Center, in Ensenada, Mexico.

v
Contents Chapter 1 Introduction 1
1.1 Problem Statement 1
1.2 Research Goals 3
1.3 Document Overview 3 Chapter 2 Satellite Rural Telephony Background And Literature Survey 5
2.1 General Rural Telephone Networking Background 5
2.1.1 The Rural Telephony Problem: Local and Long Distance
Communications 5
2.1.2 Design of Rural Telecommunications Networks 6
2.1.2.1 The Life Cycle Process 7
2.1.3 Wireless Local Loops (WLL) for Rural Local Communications 9
2.1.3.1 High Tier (Cellular) WLL 10
2.1.3.2 Low Tier (Cordless) WLL 10
2.2 Satellite Communications Background 11
2.2.1 Satellite Communications Concepts 12
2.2.1.1 Satellite Communications Theory 12
2.2.1.2 Satellite Communications Model 13
2.2.2 Basic Repeater (Bent-Pipe) Satellite Systems 15
2.2.3 Advanced On-Board Processing (OBP) Satellite Systems 16
2.3 Satellite Systems used for Rural Telephony 18
2.3.1 First Rural Satellite Systems 19
2.3.2 Mobile Satellite Systems (MSS) 20
2.3.3 VSAT-Based Rural Satellite Systems 21
2.3.4 Broadband Satellite Systems 22
2.4 Economic Issues in the Design 0f Satellite Rural Telephone Networks 23
2.4.1 Rural Telephony Economic Issues 24
2.4.2 Multiple Access and Topology Evaluation Techniques 25
2.4.2.1 Multiple Access Techniques 25
2.4.2.2 Topology Evaluation Techniques 28

vi
2.4.3 Traffic Intensity and Grade of Service 31
Chapter 3 Quality of Service in Digital Telephony over Satellite 34
3.1 Performance Indicators for Quality of Service (Qos) in Digital
Voice Transmission. 35
3.1.1 Quality of Service and Network Performance Metrics 36
3.1.2 Circuit- and Packet-Switched Networks 38
3.2 Circuit Switched Voice Transmission over Satellite 38
3.2.1 Circuit Switched Digital Telephony Networks 39
3.2.1.1 Space Division Switches. 40
3.2.1.2 Time Division Switches. 40
3.2.2 Circuit-Switched Digital Telephone Networks 40
3.2.2.1 Integrated Services Digital Network 41
3.2.2.2 ISDN Channel Types 42
3.2.2.3 Broadband Isdn (B-ISDN) 44
3.2.3 Satellite Circuit-Switched Network Requirements 44
3.2.4 Quality of Service in Real-Time Voice Applications Via Satellite 47
3.2.4.1 Propagation Delay 47
3.2.4.2 Echo 47
3.3 Packet-Switched Telephony over Satellite 48
3.3.1 Introduction to Packet-Switched Communications Networks 49
3.3.2 The Open Systems Interconnection Layered Model 50
3.3.2.1 The Seven OSI Layers 52
3.3.2.2 Applying the OSI Model on Satellite Technology 54
3.3.3 Packet-Switched Digital Telephone Networks 54
3.3.3.1 Voice Telephony over IP (VoIP) 55
3.3.3.2 Improving Qos over IP Telephony 57
3.3.3.3 ITU Recommendation H.323: Voice over the Internet 57
3.3.3.4 Voice Telephony over ATM (VToA) 58
3.3.3.5 Itu Recommendations I.363.2, I.366.1
and I.366.2: Voice over ATM 58

vii
3.4 Quality of Service on Packet-Switched Telephony over Satellite 60
3.4.1 ATM Quality of Service Parameters 61
3.4.2 Satellite Packet Network Architectures 62
3.4.3 Bent-Pipe Satellite Network Architecture 64
3.4.4 On-Board Processing Satellite Network Architecture 65
3.4.5 Latency on Satellite Links 67
3.5 Packet Satellite System Performance 68
3.5.1 Bandwidth -Delay Product 68
3.5.2 Buffering 69
3.5.3 Throughput 69
3.5.4 Congestion Control 69
Chapter 4 Methodology for Cost-Effective Network Design 70
4.1 Introduction to Communications System Design 72
4.1.1 Problem Definition 72
4.1.2 Performance Metrics 73
4.1.2.1 Traffic Intensity 73
4.1.2.2 Grade of Service 74
4.1.2.3 Mean Delay 74
4.1.2.4 Throughput Capacity 75
4.2 Network Planning Factors 75
4.2.1 System Boundaries 76
4.2.1.1 Satellite Orbits 76
4.2.1.2 Satellite Link Frequencies 77
4.2.1.3 Satellite Technology 77
4.2.1.4 Earth Station Technology 78
4.2.1.5 Link Availability 79
4.2.2 Network Boundaries 79
4.2.2.1 Network Size 79
4.2.2.2 Network Quality of Service 80
4.2.2.3 Network Access to the PSTN / Broadband WANs 80

viii
4.2.2.4 User Cost 80
4.3 Network Planning Optimization Algorithms 81
4.3.1 Linear Programming 81
4.3.2 Break-Even Economic Evaluations 83
4.3.3 Optimizing Parameters for Minima and Maxima 84
4.3.4 Constrained and Unconstrained Optimization 85
4.3.5 Evaluation Involving Optimization and Multiple Criteria 86
4.4 Economic Models for Satellite Network Design 86
4.4.1 Evaluation Techniques 87
4.4.2 Satellite Networking Economic Analysis 87
4.4.2.1 Earth Station Segment Costs 88
4.4.2.2 Space Segment Costs 90
4.4.2.3 Networking Costs 91
4.4.3 Satellite Networking Economic Models 92
4.4.3.1 Fixed-SCPC 94
4.4.3.2 Fixed-MCPC 101
4.4.3.3 SCPC-DAMA 103
4.4.3.4 Mesh SCPC-DAMA 106
4.4.3.5 OBP Regenerative Satellites 109
4.4.4 Experimental Design 111
4.4.4.1 Computer Model Description 111
4.4.4.2 Pivoting 113
4.4.4.3 Generation of Results 114
4.5 Summary 114
Chapter 5 Parametric Analysis Results 116
5.1 Parametric Analysis Results of the Economic Models 116
5.1.1 Fixed-SCPC Model 117
5.1.1.1 Low Traffic Scenario 118
5.1.1.2 Medium Traffic Scenario 118
5.1.1.3 High Traffic Scenario 120
ix
5.1.2 Fixed-MCPC Model 122
5.1.2.1 Low Traffic Scenario 124
5.1.2.2 Medium Traffic Scenario 124
5.1.2.3 High Traffic Scenario 126
5.1.3 SCPC DAMA Model 130
5.1.3.1 Low Traffic Scenario 132
5.1.3.2 Medium Traffic Scenario 132
5.1.3.3 High Traffic Scenario 134
5.1.4 Mesh SCPC-DAMA Model 135
5.1.4.1 Low Traffic Scenario 135
5.1.4.2 Medium Traffic Scenario 138
5.1.4.3 High Traffic Scenario 138
5.2 Comparison of Multiple Access Models 139
5.2.1 Effects due to Traffic Intensity Variations 139
5.2.2 Effects due to Network Size Variations 144
5.2.3 Effects of User Cost per Minute-Call Variations 146
5.3 Predictive Power of Models 148
5.4 Summary 149
Chapter 6 Conclusion And Recommendations 151
6.1 Summary of Research 152
6.2 Conclusions 154
6.3 Recommendations for Future Research 159

x
List of Figures
2.1 The systems engineering life cycle process. 7
2.2 Basic repeater (bent-pipe) satellite link elements. 16
2.3 Hybrid satellite system. 19
2.4 Integrated satellite system. 19
2.5 Taxonomy of multiple access protocols for satellite communications. 26
2.6 Star topology on satellite networks,
a) four VSAT example, b) representation.
28
2.7 Mesh topology on satellite networks,
a) 3 VSAT example, b) representation [Mar95].
29
2.8 EIRP vs. G/T comparison in a VSAT network, VSAT-to-VSAT, from
Mar95].
31
3.1 Quality of service and network performance, from [Cla91], p.332. 36
3.2 Circuit switching. a) Space-division, b) Time-division 40
3.3 Different interfaces on telephone applications, from [Elb97], p. 327. 45
3.4 The Open Systems Interconnection (OSI) layered model 50
3.5 Layer to layer encapsulation in the OSI model, from [Mar95], p. 112. 51
3.6 Taxonomy for On Board Processing (OBP) satellite architectures, adapted
from [Toh00].
63
3.7 Architecture of a bent-pipe (repeater) satellite based packet network. 64
3.8 On-board switching satellite on satellite networks architecture. 65
3.9 Inter-satellite switching architecture on packet-switched satellite networks 66
3.10 End to end delay performance in packet-switched networks. 67

xi
4.1 Economic Impact of Quality of Service in a system, from [Lan75]. 70
4.2 Economic impact of Quality of Service on different systems, from
[Lan75].
71
4.3 Fixed SCPC satellite network to be simulated. 94
4.4 Fixed MCPC satellite network. 101
4.5 SCPC DAMA satellite network. 104
4.6 Mesh SCPC DAMA satellite network with g gateways or mini -hubs. 107
4.7 Satellite rural telephone network design optimization model. 112
4.8 Network economic model flowchart. 113
5.1 Fixed SCPC simulation results. 119
5.2 Comparison between low, medium and high traffic scenarios for Fixed
SCPC
121
5.3 Fixed MCPC simulation results for one TDM voice channel per VSAT. 123
5.4 Fixed MCPC simulation results for two TDM voice channels per VSAT 125
5.5 Variation of user cost with multiple TDM users for Fixed MCPC. 127
5.6 Comparison of low, medium and high traffic, for single user MCPC. 128
5.7 Comparison of low, medium and high traffic for two-user MCPC model. 129
5.8 SCPC DAMA simulation results for VSAT network design. 131
5.9 Comparison of low, medium and high traffic for the SCPC DAMA model. 133
5.10 Mesh SCPC DAMA simulation results for VSAT network design. 136
5.11 Low, medium and high traffic comparisons for the Mesh SCPC DAMA
model.
137
5.12 Sensitivity of traffic changes on profits. 142
5.13 Impact of user cost per minute variations on required traffic. 143

xii
5.14 Economic impact of network size variations on user cost per minute. 146
5.15 Economic impact of user operational time variations. 148
5.16 Cost – effectiveness of the different economic models. 150

xiii
List of Tables
2.1 High Tier Wireless Local Loop technologies 10
2.2 Low Tier Wireless Local Loop technologies 11
2.3 Characteristics of star and mesh network configuration, from [Mar95]. 31
3.1 SONET bit rate hierarchy, from [Saa94], p. 388. 44
3.2 Interface standards for satellite telephone connections, from [Elb97], p. 328 46
4.1 Expected traffic intensity for satellite rural telephone networks. 73
4.2 Fixed Satellite Service typical satellite parameters. 77
4.3 Number of channels n and number of nodes N for different network sizes. 79
4.4 Summary of Interest Formulas, from [Bla98]. 93
4.5 Glossary of economic network analysis terms 94
4.6 Fixed-SCPC satellite network economic model. 100
4.7 Fixed-MCPC satellite network economic model. 103
4.8 SCPC-DAMA satellite network economic model. 105
4.9 Mesh SCPC-DAMA satellite network economic model. 108
4.10 On-Board Processing (regenerative) satellite network economic model. 110

Chapter 1
Introduction
1.1 Problem Statement Rural telephony has always been a recurring subject for most large and/or developing
countries. It has been known for a long time that a country's economic development (as
measured by its Gross National Product, GNP) is strongly correlated to its telephone density
(number of telephone lines per 100 people). This situation is more evident in countries with a
vast territorial area or with a large rural population, which require a l arge investment in
telecommunications equipment, and which need a long implementation time. It is generally
considered that rural telephone users do not generate the same level of telephone traffic, and thus
revenue, as urban users, lowering the incentives to invest in rural telecommunications. The
financial implications of wiring a vast area for low telephone traffic causes most service
providers to ignore or delay offering telephone service to those regions.
Governments, telephone companies and researchers all agree that cost is the largest hurdle
[Tal98]. Studies show how bringing telecommunications to rural areas increases the indirect
benefits of telecommunications investment on the economic development of that region [Hud84].
The same studies also show how actual telephone traffic rapidly increases once the service starts,
often exceeding the initial projected traffic.
A satellite-based telephone network can provide efficient long distance telephone service to
remote rural communities at lower cost than land-based wired networks in most cases. Mobile
Satellite Systems (MSS) have been proposed for this application among others, but their intrinsic
nature (circuit switched, low traffic capacity, high operational costs) has kept them away from
rural telephony applications. References [Eva96], [Joh95]. [Wes94] and [Wes96] show the
technical capacity of these systems, and [Con98], [Och98], [Tal98] and [Con99] show alternative
solutions to this particular problem. To identify the most promising cost-effective technologies
for satellite communications, [Pri96] states that “... technical feasibility, available financing and
existence of a market must be present for a business to be viable,” conditions which must be
clearly presented in the business plan for any future satellite network.

2
2
The thesis of this research is that current satellite and earth station technology already
provides technical feasibility for rural telephone systems, although this technology can and will
be improved in the future to provide a better, more cost-effective service to the users. As for the
market existence, over 75% of the world’s population (about 4 billion people) currently has no
telephone service, although that does not mean that they all can afford it. Still, the market exists
for a large number of people in extended areas and rapidly developing countries. The financing
required to serve them will appear when a proper business case is presented, together with the
best performing technology available. This work shows how this can happen now (year 2000).
This dissertation describes a simple but efficient methodology for digital telephone
network design using a computer model with variable input data for specific rural scenarios. It
processes those data through a numb er of specific control parameters (technical constraints), and
processes all data according to the desired performance parameters. This allows the designer to
define the most efficient satellite system (or combination of systems) which best provides quali ty
rural telephone and data service for optimal performance.
Initial boundary conditions for this work are based on the need to offer efficient telephone
service using digital satellite systems and to interconnect to the Public Switched Telephone
Network (PSTN). A variety of small, medium and large size networks of simultaneous satellite
and telephone users were simulated throughout the research. Telephone circuits are assumed to
be symmetrical (same amount of information flowing both ways), real time (no delays other than
typical satellite propagation delay) and with standard Quality of Service (QoS) as expected from
international digital voice transmission standards to access the Public Switched Telephone
Network (PSTN). Typical Geostationary Earth Orbit (GEO) commercial satellites are
considered for ease of use and lower operational costs, and Radio Frequency (RF) subsystems
are considered standard on typical fixed, parabolic dish antenna earth stations. Finally, the
absence of a terrestrial link or return channel demands this to be an autonomous, complete, bi-
directional satellite system.
1.2 Research Goals The purpose of this work is to investigate and define efficient ways to provide economic
digital telephone service and data transmission to rural communities by means of a
communications satellite. A detailed description and analysis of current technology is developed
to fully assess the convenience of serving rural communities with current systems or the need to

3
3
provide new options. An economic analysis for different technologies is presented, with
emphasis on different performance parameters and its impact on total network cost, optimizing
for both lowest investors and users cost.
The analysis of satellite rural telephony network designs allows the designer to look at all
important aspects of network design and to investigate critical aspects of system performance.
Since every desired rural network's technical, economic and social-geographic characteristics are
different, it is common to have different parameters driving the network design process.
Assigning a single solution to all design cases is an inefficient way to find a solution. A digital
network design methodology that allows for specific parameter and performance optimization on
rural telephone and data networks has been developed, allowing the designer to find the best
possible technology according to the desired performance parameters.
This report also proposes a novel satellite network architecture and protocols which were
developed as part of this research, that allow good Quality of Service (QoS) to remote telephone
users by modifying the Asynchronous Transfer Mode (ATM) standard for digital packet
communications over a high latency satellite channel.
1.3 Document Overview This document presents a methodology for the technical and economical study of satellite
rural telephone network design. It discusses the rural telephony problem and reviews past and
current technologies which have been used in a attempt to provide telephone service to rural
areas. Also discussed are economic indicators, performance requirements and network design
techniques. It also mentions briefly a new approach to voice and data packet switched
communications especially adapted to the satellite environment.
Chapter 1 presents the rural telephony problem, along with the research goals and an
overview of this document.
Chapter 2 presents a comprehensive literature review on rural telephony, the fundamentals
and strategies of communication systems design, reviews the initial, existing and future Wireless
Local Loop (WLL) and satellite systems for this application as well as the economic issues in the
design of satellite telephone networks.
Chapter 3 describes digital circuit- and packet-switched networks with an emphasis on
Quality of Service requirements for digital voice over satellite channels, as well as satellite
system and network performance and technology.

4
4
Chapter 4 describes the network design methodology proposed for rural telephone network
design by means of optimization tools that maximize performance while providing users with a
cost-effective service. Different scenarios are described and simulated for different
technologies, and results are shown.
Chapter 5 describes the analysis of the results obtained in Chapter 4 and discusses their
impact on telephone network design, specifically for rural satellite applications. The analysis is
based on both technical factors (network size and traffic capacity) as well as economical factors
(capital investment, operational expenses, revenues and user costs per-minute call). Several
technical and economic parameters are analyzed and their impact on performance is optimized.
Chapter 6 shows a summary of this work, its main conclusions and contributions, and
indicates potential areas for further study.

Chapter 2 Satellite Rural Telephony Background
and Literature Survey
2.1 General Rural Telephone Networking Background Remote and rural communities in large or developing countries have historically been left
with poor or non-existent communications due to a number of factors, although telephone service
has often been considered important for regional growth. Wireline networks are often not an
economic option due to high initial investment and low financial returns, especially in small
communities and isolated locations. Most current rural telephone networks exist as an
obligation from governmental requirements for telephone service providers to cover low density
and small remote locations. Maximum limits on mandated tariffs are often imposed, so the
economics of those rural nodes have been subsidized either by the government or by urban users.
Wireless communication networks are gaining an increasing amount of attention for use in
such applications due to more cost-effective performance. Although analog Multiple-Access
Radio has been used before in rural applications, new wireless digital systems could help bring
telephone communications to remote locations through the use of Wireless Local Loops (WLL)
as mentioned by [Cox96], [Pad95] and [Wes96]. Since wireline service operators may not serve
remote locations, high- and low- tier WLLs can provide a wireless “last-mile”, but it still
requires long distance access to the PSTN. This can be achieved with a satellite terminal, which
has ubiquitous presence under the satellite’s footprint. For that reason satellites are being
considered as either a relay service (hybrid bent-pipe) or as part of an integrated cellular /
satellite system, as reported by [Re95], [Eva97], [Con99] and [STM99].
2.1.1 The Rural Telephony Problem: Local and Long Distance
Communications Rural communities without telephone service have two different problems: they can neither
call their neighbors (local calls) nor the outside world (long distance calls). If a rural village has
at least a single long distance telephone line placed at the local store, authority or health facility,
local people can at least communicate with relatives, authorities or other government offices.
The calls may be for personal, emergency or important official messages, even if users have to

6
walk to this place. Although many countries mandate their local telecommunications operators
to provide long distance telephone service to certain size communities, these mandates are often
ignored or delayed because of economic factors.
A rural village will hardly have local service if they do not have long distance service,
which has higher priority. Local telephone service will usually be implemented in villages tha t
reach a certain minimum size and telephone traffic conditions, and only after long distance
service has been operational and people are familiar with its use. A local network not connected
to the Public Switched Telephone Network (PSTN) is called a private network. The local
network's transmission media between the switch and the local user's premises is called the "last
mile technology", and it may consist of cabled (wired) or radio (wireless) communication links.
Local calls are handled by a local switch office, which connects calls from one villager to
another rural subscriber according to the number dialed. If a long distance number is dialed, the
local rural office will switch the call to the long distance switch, or gateway, which will connect
the call to the long distance transmission system and carry the call to another gateway connected
to the PSTN. Thus, the long distance gateways are the most important elements of the telephone
network regarding rural telephony. It is the intention of this work to show that a satellite system
can provide rural telephone service with a good Quality of Service (QoS) using a digital
communications network. Special attention is drawn to the remote (rural) and gateway (urban)
earth station elements and overall satellite network technology that provides long distance
telephone service using Very Small Aperture Terminal (VSAT) technology when following a
cost-efficient design methodology.
2.1.2 Design of Rural Telecommunications Networks There are many issues to be defined when designing rural telecommunication networks, all
of them of varying importance, but almost all of them fall into three main areas: geopolitical,
technical and economic. Geopolitical issues deal with the rural region's developmental level
based on its social, political, educational and economic history, which is important to define but
will not be covered in this work [Sch96]. Technical issues usually refer to available technology,
regulatory and legal frameworks, rural communities’ size and expected communications traffic,
type of communication services and available technical workforce [Con94]. Economic issues

7
deal with defining the initial investment required to deploy communications equipment in a
remote region, its operational cost and the users’ revenue generating capacity, so the service is
self-supported financially and keeps subsidies to a minimum.
The latter analysis must include both the cost of available technology, initial and future
expected traffic and the performance metrics and technical standards required by the national
telecommunications networks or PTT operators. It is in these two areas, technical and economic,
where the present work is situated.
Although the design and specification of technical elements in communications networks
fall almost entirely into the telecommunications engineering area, and the economic analysis of
the network is a mainly a finance problem, the proper network design sequence and future
economic success depends heavily on another engineering branch, called systems engineering.
2.1.2.1 The Life Cycle Process
The systems engineering process provides a way to better understand and approach most
design problems over the complete life cycle of a product, in this case a rural
telecommunications network. It provides the methodology to efficiently manage any given man-
made system, from the conceptual design to the termination and disposal stages [Bla98]. Based
upon this approach, the design of any communications network must include the steps shown in
Figure 2.1
Network Planning
Network Design
Network Development
Network Implementation
Network Operation
Network Termination
Figure 2.1. The systems engineering life cycle process.
The sequence of technical and economic activities required to design a satellite rural
communications network are complex processes that should be achieved by many people in
different areas of expertise and at different times, working as a team, following a system
management plan and supervised under a single authority. The key for the systems engineering
process' success is good planning, good management and teamwork.

8
The technical scope of the present work is only at the network design stage; thus the rest of
the technical process is to be done elsewhere. On the other ha nd, the economic scope of this
work must include all steps shown in Figure 2.1 in order to provide investors with a clear idea of
all major financial milestones.
1. Network Planning Stage: This refers to the basic identification of rural telephone needs,
dimensioning of the networking problem and definition of possible solutions.
2. Network Design Stage: This refers to the search for real and feasible solutions once the basic
needs have been identified. The input information must be processed with whatever
technical and economic constraints exist, and optimal solutions are delivered.
3. Network Development Stage: This refers to the necessary steps to develop the network
elements as defined at the design stage. Includes the logistics to acquire, assemble and
deliver systems and subsystems, personnel training and testing.
4. Network Implementation Stage: This refers to the construction of the network following the
previously defined logistics plan by transporting the equipment to its final destination,
assembly of systems and subsystems at each site, testing each terminal and local network,
and training of local operators.
5. Network Operation Stage: This refers to the use of the communications network by rural
users, as initially specified at the conceptual stage. It actua lly is the delivery of the end
product to the consumer, in this case digital telephone service to rural users, and it should last
throughout the expected equipment life cycle. It is also during this productive equipment’s
lifetime that it will generate revenue to network operators and investors, as defined in the
network design stage.
6. Network Termination Stage: This refers to the retirement of equipment after it has reached its
operational lifetime. Aging, new technology availability, frequent equipment malfunctions
or high operational costs may be the cause. New regulations show increasing concern to
dispose of old products in an environmentally friendly way.
2.1.3 Wireless Local Loops (WLL) for Rural Local Communications Currently, wireless technology offers different networking options for local loop telephone
applications, not considering point-to-point or point-to-multipoint radiotelephones. Digital

9
wireless telephone technology can be divided into two very well defined groups, based on its
technology platforms, services and characteristics. 1) Cordless telephone systems , which are also
defined as Low-Tier Wireless Local Loops (L-WLL), and 2) Cellular telephone systems , which
are also defined as High-Tier Wireless Local Loops (H-WLL). Since both WLL groups work at
UHF frequencies, rain is not a problem, and for rural, scattered, semi -fixed users, multipath is
not as big a problem as it is in urban applications.
Cellular (high-tier) communications allow wireless telephone service, but coverage is
usually limited to urban and suburban areas. Cordless (low-tier) communications can now offer
this service, too, but the coverage area is even smaller than that of cellular systems. In both
cases, satellite access to the PSTN Central Office (CO) switch is needed for remote site
applications. Either type of technology could provide adequate service in a remote Wireless
Local Loop application if there is a satellite link to the PSTN.
Personal Communications Systems (PCS) is a term often applied to cellular telephone
systems, although PCS and cellular are not exactly the same. Certain bands of frequency have
been assigned for cellular service (450-470, 824-849 and 869-894 MHz), depending upon the
country and technology being used. On the other hand, frequency spectrum around 1900 MHz
has been assigned to PCS, consisting of three blocks of 30 MHz each and three more blocks of
10 MHz each, including forward and reverse bands. The bands from 1850-1910 MHz and 1930-
1990 MHz are reserved for licensed operations, while the band in between (1910-1930 MHz)
was assigned to PCS unlicensed operations [Rapp96].
The main difference between cordless (low-tier, L-WLL) and cellular (high-tier, H-WLL)
systems is the coverage area, which in the first case is usually a few hundred meters for low
mobility users, while in the second case the area may be a few kilometers for high mobility
users. Each WLL technology also has specific characteristics regarding traffic capacity and
performance depending upon the network size, and will be briefly described next.
2.1.3.1 High Tier (Cellular) WLL
A high tier WLL is basically a cellular radio mobile system which provides a wireless
connection from the user's terminal (portable, mobile or semi -fixed) to the PSTN through a radio
channel. Current cellular systems are known as Second Generation, since they are the digital

10
evolution over the analog First Generation cellular systems. New developments in technology
will bring what is being called Third Generation (3G) systems, a further evolution on current
(2G) cellular systems that allows higher bit rates, able to serve data services such as the Internet.
The three most important 2G digital cellular standards are known as GSM, CDMA and
TDMA. The first, Global System for Mobile or GSM/DCS1800, is a European standard and
currently the most widely used digital cellular and PCS standard in the world. The second,
using Code Division Multiple Access or CDMA/IS-95 is a U.S. standard introduced by the
company Qualcomm, and the third, using Time Division Multiple Access or USDC/IS-136, is an
evolution of the first generation AMPS system and also a U.S. standard. The main parameters of
the 2G H-WLL systems mentioned above are presented in Table 2.1.
Table 2.1. High tier wireless local loop technologies
Cellular standard IS-54/136 GSM IS-95 DCS 1800 Multiple Access TDMA/FDMA TDMA/FDMA CDMA/FDMA TDMA/FDMA Freq. Bands Fwd
Rev 869-894 MHz 824-849 MHz
935-960 MHz 890-915 MHz
869-894 MHz 824-849 MHz
1805-1880 MHz 1710-1785 MHz
Modulation π/4 DQPSK GMSK BPSK/QPSK GMSK RF Channel 30 kHz 200 kHz 1250 kHz 200 kHz Carriers per channel 3 8 Variable 8 Channel bit rate 48.6 kbps 270.833 kbps 1.2288 Mchip/s 270.833 kbps
2.1.3.2 Low Tier (Cordless) WLL
Low tier WLLs are currently the high-end evolution of indoor cordless telephones, which
now feature digital services and allow more extensive coverage area than their predecessors.
Frequency spectrum has been assigned to L-WLLs around 1900 MHz in most countries. In
order to solve the last mile problem for the PSTN they are expected to cover only a
neighborhood area, thus limiting fast-moving phones. L-WLLs could be used for large
concentrations of users in small areas with low user mobility, such as pedestrians or home users
in urban or suburban locations.
Arguably the three most promising digital standards in the world are mentioned next. First,
the Personal Access Communications System (PACS), a U.S. system designed to merge with the

11
Integrated Services Digital Network (ISDN). Second, the Digital European Cordless Telephone
(DECT), a European system with a new PCS version (PWT) proposed for its use in the U.S.; and
third, the Personal Handiphone System (PHS), a highly successful Japanese system. Table 2.2
shows the basic parameters of each technology.
Table 2.2. Low tier wireless local loop technologies
Cordless standard PACS DECT / PWT PHS
Multiple Access TDMA/FDMA TDMA/FDMA TDMA/FDMA
Frequency (MHz) 1850-1910
1930-1990 1880-1900 1895-1918
RF Channel (kHz) 1728 300 300
Number of carriers 16 pairs/10 MHz 10 77
Channels per carrier 8/pair 12 4
Channel rate (kbps) 32 32 32
2.2 Satellite Communications Background In 1945 Arthur C. Clarke [Cla45] showed that a man-made radio repeater placed over the
equator at 42,164 km from the center of the earth would have an orbital period that matched the
earth's period (23hours 56 minutes). At this altitude the satellite would seem to be stationary to
an observer on earth, thus allowing it to be used as a permanent radio repeate r covering almost
42% of the earth's surface. This orbit is called the Geostationary Earth Orbit (GEO). Three
GEO satellites in the same orbit placed 120 degrees apart could provide radio relays to almost
the entire world. The USSR launched the first artificial satellite, Sputnik, in 1957. In 1958 the
U.S. launched Score, the first satellite to transmit a recorded voice message, and just like
Sputnik, it was placed in a Low Earth Orbit (LEO).
The first satellite to reach GEO orbit was Syncom II, launched by the U.S. in 1963. Since
then, a large number of communications, earth observation and military satellites have been put
in different orbits, depending upon the specific application. Most communications satellites have
been placed in GEO orbits, but recently new global satellite systems have been using a large
number of LEO satellites in inclined orbital planes in order to provide service to the entire world.
This is called a satellite constellation.

12
2.2.1 Satellite Communications Concepts All satellite communication systems have two segments: the ground segment (earth
stations) and the space segment (communications satellites). The ground segment may be further
divided into two main elements: a transmit earth station and a receive earth station. There may
be any possible combination of these elements: a single transmit/receive earth station operating
on a closed loop, one transmit and many receive earth stations (broadcast), or any number of
transmit/receive earth stations forming a satellite communications network. A network may be
connected into a number of different topologies, depending upon its main application and
technical requirements. Since the early 1960's the development of satellite communications has
been impressive in terms of capacity as well as in performance.
2.2.1.1 Satellite Communications Theory
Any satellite follows a trajectory that is defined by its distance from the center of the earth,
as described by orbital mechanics theory. The physical and mathematical basis for orb ital
mechanics were described by Newton and Kepler centuries ago, but only in recent times did
technology allow high altitude launches and the use of electronic communications systems.
Newton's Universal Gravitational Law describes the force and velocity required for a body
to stay in orbit, while Kepler's three laws describe the geometry and trajectories of celestial
bodies. The general case for Kepler's laws applies to elliptical orbits but a circular orbit may be
considered as a special case where both foci are at the same position. The period of an orbit of
any satellite is described in [Pra86] by:
µπ 22
2 4 aT = (2.1)
Where T = orbital period (seconds), a = Distance between satellite and center of the earth
(km), and µ = Kepler's constant (µ = 3.9861352 x 10⁵ km3/s2)
If the satellite orbital period equals the earth's rotational period, the satellite is in a GEO
orbit, located at 42,164 km over the equator. If the satellite's orbital period is much shorter than
earth's, it follows a Low Earth Orbit, but requires a higher velocity to avoid being pulled down
by the earth's gravity. If the satellite's orbital period is longer than earth's, then it follows a High
Earth Orbit (such as the moon) and a much lower velocity is needed to maintain orbit.

13
The distance to the satellite is very important in telecommunications for two reasons: signal
attenuation and time delay. Free Space Attenuation is the loss of radiated signal power as it
moves away from the transmit antenna due to spherical spreading. A long propagating distance
results in low signal power density per unit area. Additional attenuation occurs in the
atmosphere due to interaction of the signal with atmospheric gases during propagation. Delay is
the time it takes for the signal to travel from one point to another at the speed of light. GEO
satellites are placed so far from earth that it takes over one quarter of a second to relay a signal
between two earth stations. This delay can be significant in certain cases such as real-time voice
and video, as well as in some data transmission applications.
2.2.1.2 Satellite Communications Model
What makes a communications satellite different from other satellites is its payload,
usually a radio repeater consisting of a transmitter/receiver combination called a transponder.
The long path between an earth station and a satellite causes high losses (attenuation) especially
at higher frequencies, therefore amplifier gain must be provided for the carrier signal in order to
overcome this problem, and this is the transponder's task. A typical bent-pipe transponder
consists of 5 main elements:
1. Receive antenna
2. Front end receiver (mainly a Low Noise Amplifier = LNA)
3. Frequency converter
4. Transmitter (mainly a High Power Amplifier = HPA), and
5. Transmit antenna, which may be the same as the receive antenna (element 1).
While the antennas provide passive gain, the LNA and HPA must provide active
(electrical) gain to the signal, enough to overcome the path losses. Extra losses are often taken
into consideration, especially rain fades and interference losses. Earth stations typically consist
of elements 1 and 2 mentioned above (receive earth station) and 4 and 5 (transmit earth station),
which are used for the same purpose. The end-to-end signal power budget, called a link budget,
is described in (2.2) in dB units as
C/N (dB) = Pt + Gt - Lp -Lr + Gr - k - Tsys – B (2.2)
Where

14
C/N = Received signal's carrier to noise ratio (dB)
Pt = HPA's transmitter power (dBW)
Gt,r = Transmit and receive antenna gain (dBi)
Lp = Propagation loss (dB)
Lr = Rain loss (dB)
k = Boltzmann's constant (-228.6 dB-J/K)
Tsys = System noise temperature (dBK)
BN = Receiver Noise bandwidth (dB-Hz). The total C/N figure is based on the combination of numerical (ratio, not dB) values of the
uplink and downlink C/N figures plus an interference ratio C/I, as shown next
( )( ) ( ) ( )I
CN
CN
CN
C
du
t 1111
++= (2.3)
Once the signal is guaranteed to provide a good carrier to noise ratio, demodulation
provides the required Energy per bit to Noise density (Eb/No) ratio, described as
Eb/No = C/N + B – Rs (2.4)
Where Rs is the symbol rate in dB-symbols/second.
When more than one signal is sent to the satellite, there must be an organized way to
accommodate each carrier, so channels are divided and used according to a pre-defined multiple
access scheme, which heavily influences the satellite network' s bandwidth efficiency and
throughput. Multiple access protocols are classified by [Pey99] into several types: fixed
assignment, demand assignment, random access, hybrid random access and reservation, and
adaptive protocols.
Fixed assignment protocols are good on high traffic, small (few nodes) networks. Demand
assignment protocols are better suited to low traffic, larger networks, such as satellite rural
telephony. Random access protocols are mainly used to transmit medium traffic data in packet
networks, while hybrid random and reservation protocols work best at medium traffic data
packet networks with occasional higher traffic by just one or a few of the nodes at any time.
Finally, adaptive protocols allow completely random access for low traffic and change
dynamically to reservation for higher traffic loads.

15
2.2.2 Basic Repeater (Bent-Pipe) Satellite Systems As mentioned before, what differentiates a communications satellite from other satellites is
its repeater payload, a number of radio receivers/transmitters that are better known as
transponders. A transponder is a communications repeater for radio signals received on board
the satellite, processed and then transmitted to a ground earth station. A transponder is generally
defined by its bandwidth capacity (36, 54 or 72 MHz on Ku-band satellites), its available
transmit effective isotropic radiated power (40 dBW to 54 dBW or 10,000 W to 250,000 W) and
its on-board processing capabilities.
Early transponders were simple and consisted of only a few subsystems: receiving and
transmitting antennas, a Low-Noise Amplifier (LNA) receiver, a frequency converter and a
High-Power Amplifier (HPA) transmitter. This basic (and still very popular) type of transponder
would only receive the signal through the Rx antenna, amplify it in the LNA, change the
frequency (down convert) and feed it to the HPA, and then transmit it through the Tx antenna.
Since no change is made to the signal, except for carrier frequency translation and power
amplification, a satellite with this type of transponder is also known as repeater (or bent-pipe)
satellite.
A traditional repeater satellite is complex in the sense that several effects can take place in
the received signal (non-linearity, delay, distortion), but always regarding its frequency and
power, not the signal content itself, so the transponder never “knows” anything else about the
signal. A bent-pipe transponder is almost transparent to the user since it sends back basically the
same information, and in the same sequence, as it arrived, thus “repeating” the signal. That has
been sufficient for past and most current satellite applications, but may not be enough for digital
packet satellite networks. Figure 2.2 shows the basic arrangement for a bent-pipe satellite link.
Downlink f2
LNA Frequency HPA
Converter
Satellite Transponder
Tx Earth Station Rx Earth Station
Uplink f1

16
Figure 2.2. Basic repeater (bent-pipe) satellite link elements.
2.2.3 Advanced On-Board Processing (OBP) Satellite Systems As mentioned above, a repeater satellite only changes frequency and power parameters on
a digitally modulated, but still analog, signal. That means that if there is distortion on the uplink
analog signal, this distortion will be amplified and translated in frequency to the downlink, thus
lowering even more the quality of the analog signal. This has a negative impact on the received
downlink signal power and total C/N ratio, as described on equations 3 and 4. This has a direct
effect on the digital signal’s bit error rate, and neither the user nor the repeater satellite can
improve that signal, although coding may help.
A repeater satellite also forces the signal to follow the same route; from the receiver to the
transmitter all signals on that specific transponder will always be together, coming from the same
transmit earth station and going to the same receiving earth sta tions. That is a limiting factor in
some networking applications, where versatility to switch is needed to offer a better service.
Due to these limiting factors on basic bent-pipe satellites, new type of transponders were
conceived, which allow a number of different approaches to avoid these problems, although none
is currently able to solve all of them, since the limitations are different for each application.
These types of transponders are used on “smart” satellites called On-Board Processing (OBP)
satellites, since they process in various ways the uplinked signals before repeating them on the
downlink.
One type of on-board processing, called base-band (BB) processing takes place by
downconverting and demodulating the analog signal, then demultiplexing and reconstructing the
binary information stream to correct any errors that may have happened during the uplink. A new
rectangular pulse waveform is generated with the clean binary sequence and, after that, the signal
is again modulated, multiplexed and upconverted to be transmitted on the downlink, clean from
any uplink degradation, thus improving the Eb/No ratio and, therefore, the BER at the receiving
earth station.

17
Another type of OBP takes place when many Time Division Multiple Access (TDMA)
signals from different transmitting earth stations are received at the satellite, then are base-band
processed into binary streams and multiplexed into a single TDM signal going down to a single
receiving earth station. This earth station usually acts as a hub or gateway into a single computer
or network in a star topology, thus optimizing the satellite’s power and bandwidth for the
downlink.
Two other common types of OBP are increasingly taking place on satellite systems
involving some type of on-board switching: spot beam switching, and packet switching and
routing.
Spot-beam switching involves the use of several receive and/or transmit antennas (or
directive beams) onboard the satellite, which are used to send information to selected regions
(spots) as seen from the satellite. This allows the reuse of the same frequencies for different
coverage areas, thus increasing satellite capacity, as long as the spots are sufficiently far apart
from each other to avoid interference. The satellite would have to “know” to whi ch spot the
incoming signal must be sent, or the other way around, usually by the use of certain link
frequencies or by reading the packet’s address. This is a very effective way of routing specific -
site or point-to-point links.
The other type of onboard switching involves the use of the satellite as an “intelligent”
network node. It will be mentioned later how packet networking architectures such as ATM and
TCP/IP require the packets to follow a certain path or route to its terminal node, as included in
the packet overhead (or address) during the connection period. The process of routing is done
by a cross-connect device called a "switch". Each switch has a number of input and output
ports, which are connected to other ports at different switches across the network according to a
connection plan stored in memory, also called a "routing table". There, the switch reads its
virtual connection parameters and sends the packet to the physical channel through the proper
output port.
Broadband satellite networks are developing on-board processing technology that allows
the use of the satellite as a network router, or as they call it, a "Switch in the Sky", which will
allow faster routing and forwarding. A number of experimental and commercial satellites have

18
been using switching technology for some time, like Italy’s ITALSAT and European OLYMPUS
satellites as well as NASA’s Advanced Communications Technology Satellite (ACTS) [Had99].
Since satellites can reach longer distances, it is expected that less processing time will be
required (only one router/switch) with the possibility of lower latency, although propagation time
on satellite networks will still play a significant role in overall latency. Another advantage is that
an OBP satellite will be able to re-direct packets into the correct spot beam, time frame,
downlink frequency or sub-network, either for a single user or for broadcast, at -and from- any
point where a satellite’s extensive coverage area allows.
2.3 Satellite Systems Used for Rural Telephony Rural Telephony by satellite has been widely studied and described, but in fact much of
that work never became a reality until recent times for several reasons. There were a few places
where it had been implemented before, usually on small pilot networks as mentioned in [Ros81]
and [Con94]. Recent large applications are currently being deployed in South Africa (3,000
small terminals), Guatemala (600) and Australia (400) as reported in [Gil99]. There have also
been large network implementations in Chile (1,700) and Peru (190) as detailed in [Com99], but
large VSAT manufacturing companies and telephone service providers are still looking for cost-
efficient designs, attractive for all involved (manufacturers, operators and service users).
Several satellite system technologies can be used in rural telephony, requiring different
analysis of technical parameters. The satellite network’s technology heavily influences the user
terminal (small earth station) characteristics as well as its overall costs. Typical uses of small or
personal satellite terminals are
• Serve coverage areas without wireline or cellular service,
• Replace telephone networks in disaster situations, or
• Serve as an auxiliary buffer when the wired or wireless capacity has been reached.
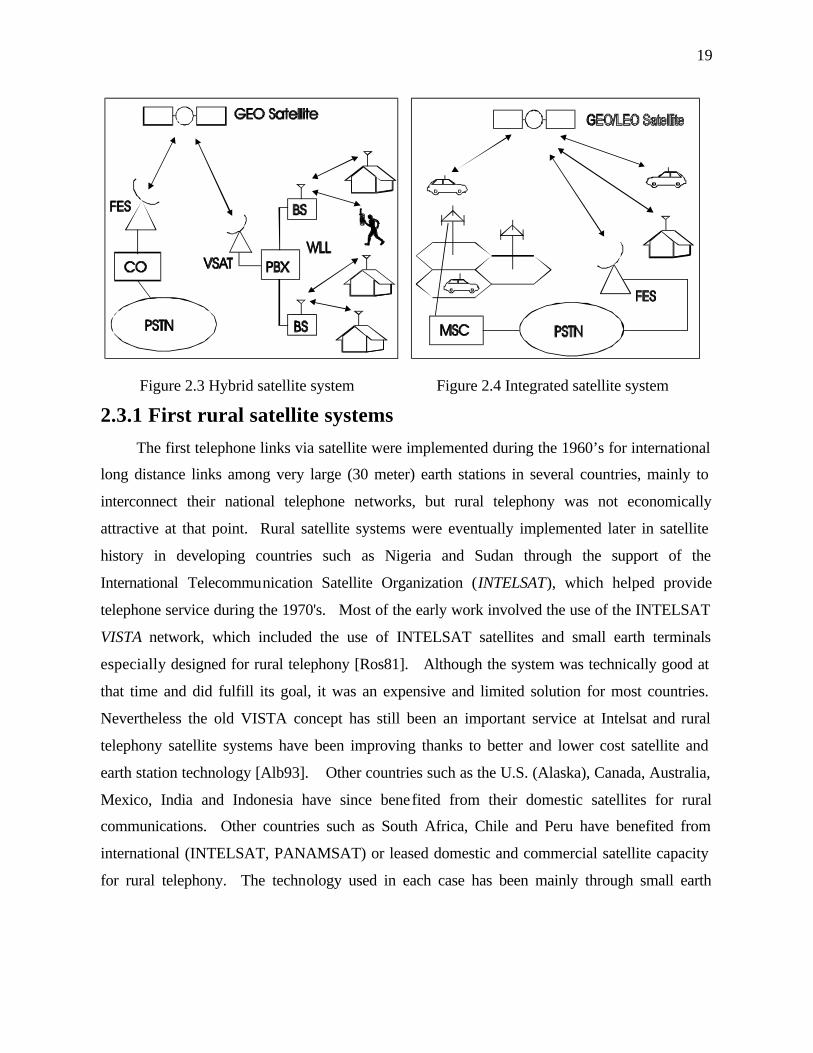
A remote user can access the PSTN via satellite in one of two ways: through an indirect
user link access to the satellite, or a direct link access. The indirect access to the satellite is made
from a wired or Wireless Local Loop (WLL) user terminal through a VSAT terminal and a GEO
satellite (hybrid system, Figure 2.3). The direct access architecture allows the user to transmit
from a mobile terminal directly to the satellite (integrated system, Figure 2.4).
19
2.3.1 First rural satellite systems The first telephone links via satellite were implemented during the 1960’s for international
long distance links among very large (30 meter) earth stations in several countries, mainly to
interconnect their national telephone networks, but rural telephony was not economically
attractive at that point. Rural satellite systems were eventually implemented later in satellite
history in developing countries such as Nigeria and Sudan through the support of the
International Telecommunication Satellite Organization (INTELSAT), which helped provide
telephone service during the 1970's. Most of the early work involved the use of the INTELSAT
VISTA network, which included the use of INTELSAT satellites and small earth terminals
especially designed for rural telephony [Ros81]. Although the system was technically good at
that time and did fulfill its goal, it was an expensive and limited solution for most countries.
Nevertheless the old VISTA concept has still been an important service at Intelsat and rural
telephony satellite systems have been improving thanks to better and lower cost satellite and
earth station technology [Alb93]. Other countries such as the U.S. (Alaska), Canada, Australia,
Mexico, India and Indonesia have since benefited from their domestic satellites for rural
communications. Other countries such as South Africa, Chile and Peru have benefited from
international (INTELSAT, PANAMSAT) or leased domestic and commercial satellite capacity
for rural telephony. The technology used in each case has been mainly through small earth
Figure 2.3 Hybrid satellite system Figure 2.4 Integrated satellite system

20
stations with telephone interfaces that allow interconnection to the PSTN over a typical GEO
satellite at either C or Ku band. Most rural satellite service is still subsidized at some point.
2.3.2 Mobile Satellite Systems (MSS) Early satellite systems used fixed-antenna earth stations with narrow antenna beams, where
a parabolic dish ground station antenna was pointed towards the GEO satellite. This allows the
placement of many satellites a few degrees apart from each other to avoid interference. The
earth station must have a directional antenna, which cannot be used for mobile (cars, trains, ships
or airplane) communications.
Departing from the initial fixed-earth station application, during the mid 1970's a global
satellite communication system for US ships, MARISAT, was developed to provide voice and
data communications to ships on the high seas using L band frequencies (1.6/1.5 GHz) with
small, directional and omnidirectional antennas. By the end of that decade an international
consortium was created under the name INMARSAT, which included MARISAT and the
European MARECS satellites, offering commercial service to maritime, terrestrial and
aeronautical users. INMARSAT uses small, portable terminals for voice, low bit rate data and
fax for vehicle and ship-borne applications on a global basis through a gateway earth station
connected to the PSTN or public data networks. Other mobile communication satellite systems
were later created using GEO satellites at L band: MSAT, a US/Canadian joint venture; Optus, an
Australian system, and Solidaridad, an INMARSAT-like Mexican system [Con94].
More recent systems include the use of multiple Low Earth Orbit (LEO) satellites such as
Iridium, a 66 satellite system developed by Motorola for voice and paging services, operational
since the end of 1998 at L band, but later put out of business. Globalstar, a 48 satellites system
developed by Loral Qualcomm for voice and data services at S and L bands (2.5/1.5 GHz),
already deployed and operational, but allegedly in financial trouble since the service launch.
Other systems are also being developed at this time, although the initial excitement for global
mobile satellite services has seriously slowed down.

21
2.3.3 VSAT-Based Rural Satellite Systems A Very Small Aperture System (VSAT) satellite network consists of a Master Earth Station
(Gateway, Hub) which controls a number of smaller remote earth stations allowing digital
transmission through a number of possible networking combinations, usually in a star or mesh
topology. The remote terminals are known as VSATs (Very Small Aperture Terminals) because
they have small antennas. VSATs were originally developed during the early 1980's for
business data transmission between remote sales offices or branches and its mainframe computer
or communications center [Gil91]. They have been heavily used for retailing, banking, financial
and parts distribution companies' data networks operating as multiple sites in large regional or
national systems [IEEE88], [Gil95].
A VSAT terminal usually includes a 0.6 - 2.4 meter dish antenna and a transceiver radio
(outdoor unit - ODU) and a set of baseband and IF subsystems (indoor units - IDU). It requires
electrical power, which in some locations could mean solar panels and battery banks, as well as
some kind of fixed shelter for harsh environments. In hybrid architectures the VSAT is
connected to the WLL base station or radio port and to the local switching exchange.
Examples of rural telephony systems, some of them hybrid, are those offered by Gillam
(Belgium), Gilat (Israel), and Titan, Scientific Atlanta, STM Wireless and Hughes Network
Systems in the US [Com99]. These systems provide local wireless service plus a GEO satellite
terminal for long distance access to the PSTN in a networked environment. The users only
require a common wireless phone since the service provider or network operator provides the
VSAT terminal. The satellite frequency spectrum required for these syste ms might be that of
any available C or Ku band transponder that services the coverage area, but the local WLL
frequency spectrum, cell size and distribution and required radio power have to be defined and
approved locally. Most systems include solar cell powered equipment for remote rural
communities if needed.
Gillam manufactures the SATELNET product [Gill99]. Gilat manufactures the DialAway
and FaraWay products [Gila99], [Com99] part 1.1.1. Scientific Atlanta manufactures the Skylinx
product [SA99], while Hughes Network Systems (HNS), developed its Terminal Earth Station
(TES) Quantum and later its TES Quantum-Direct products [HNS99]. STM Wireless, Inc.
22
manufactures the DAMA 10000 and the new SpaceLoop network [STM99]. And finally The
Titan Corporation manufactures the Xpress Connection [Tit99]. Most of these systems have had
mixed economic success, and the market is strongly divided between Gilat and HNS [Com99].
2.3.4 Broadband Satellite Systems The Internet explosion has created a global demand for wideband data services that cannot
be met by current wireline terrestrial networks only. Cellular and other current wireless systems
do not have the capacity to provide wideband services either. A new technology, Local
Multipoint Distribution Service (LMDS) will be able to provide this service in urban and some
rural communities, but its reach is still limited. Satellite systems have entered the broadband
communications arena through the use of different technologies, such as Direct Broadcast
Satellites (Hughes’s dual DirectTV and DirectPC). VSAT technology is also being used for this
application, mainly through similar systems offered by the same companies mentioned above
(Gilat, HNS, STM Wireless, S-A) and others such as ViaSat, Datel, Norsat and Wireless World
Wide Web (W4). Most of these VSAT-based systems already offer a rural or remote high speed
(64 kbps to 2 Mbps) satellite connection to the Internet through various hub gateways and
operate on a star topology at Ku-band with antenna sizes between 0.8 and 2.4 m.
In a different area, but following upon the promise of the mobile communication satellites
and expanding its limited bandwidth capacity, a number of companies are developing broadband
mobile satellite systems at both LEO and GEO orbits in order to provide broadband multimedia-
capable digital services at a global level. These networks will be able to provide Broadband
Integrated Services Digital Network (B-ISDN) channel capacity and high-speed IP and ATM
packet switching services to every corner of the earth. The only part of the RF spectrum with
available bandwidth for these applications is Ka band (30/20 GHz), so most broadband satellite
systems are planning to use that frequency band.
One such system, Teledesic, is based on an on-board ATM packet switching format
through a constellation of 288 LEO satellites at Ka band and is expected to start operations by
2004 [Tel99]. Another system called Spaceway, proposed by Hughes Network Systems (HNS),
consists of 8 GEO satellites with advanced on board processing and regeneration capacity
operating at Ka band, expected to be operational by 2002 [Spa99]. Astrolink is a new system

23
proposed by Lockheed Martin, TRW and Telespazio based on the use of 9 GEO satellites
scheduled to begin operations in 2003 [Ast99]. Skybridge is a system proposed by Alcatel,
based on the use of 80 LEO satellites at Ku band, expected to be operational by 2002 [Sky99].
2.4 Economic Issues in the Design of Satellite Rural
Telephone Networks As mentioned in Section 2.1 above, the design of rural telecommunications networks
mainly involves two main areas: communications engineering and economic planning. Since
both areas are important, the first part of the network process involves a joint collaboration,
where both engineers and economists will work together to try to dimension the real telephone
needs for a certain region and offer a technically and economically feasible solution. This will
allow an intelligent choice of technology regarding system capacity and cost-effectiveness.
All components, systems and subsystems of the proposed network have an associated cost,
and its continued operation will also generate expenses throughout the system’s lifetime. On the
other hand, the system’s operation will also generate revenue, allowing these costs to be
recovered with the network’s usage during the system’s lifetime. Costs should be kept to a
minimum while still providing quality service to the users, and revenue should be maximized
while still charging a low usage cost. This is not an easy balancing task, so every aspect of the
network’s cost and usage must be carefully analyzed, for a small input parameter change could
make a large output difference and possibly define the project’s economic success or failure.
Next, the most important issues when designing a satellite network, in this case for rural
telephony applications, will be presented.
2.4.1 Rural Telephony Economic Issues As mentioned above, the design of a rural telephone network involves collaboration
between engineers and economists. For the engineers, this means gathering geographical data,
considering the location, number and size of all potential communities and looking for available
technologies that could provide such service. Another need is to assume within some limits the
amount of expected local and long distance traffic for the separate nodes, and narrow it down to
a cautiously reasonable figure. If there is interest or the need to provide a different type of
24
communications service (data, video, fax, Internet access), this should also be considered in the
traffic and system capacity analysis, along with the proper network interconnection. At this point
all cabled, fiber optic, radio and satellite options must be evaluated in order to define the best
technology that allows interconnecting the remote sites to the Public Switched Telephone
Network (PSTN) or any other desired network.
The previous network design experience of engineers involved in this stage is very
important in order to eliminate obviously inappropriate or inefficient technologies according to
the specifics of the situation. Two typical examples of inefficient use of technology would be
the use of fiber optic cables on a large number of dispersed small villages in mountainous terrain,
or the use of satellite systems in a community within a few miles from a large city. A network
topology (star, mesh, tree or bus) has to be defined after determining the total number of nodes in
order to provide the most efficient access to the desired network. Once the service has been
defined as a viable option, a technical-economical analysis will define one option over the other
technologies. If a satellite network is found to be the most attractive solution, then the satellite
network design process begins.
The work that economic planners must do is different, since it involves many economic
aspects of the network in order to make a business case out of it, otherwise the project will never
take place. The first element of data that must be found is the expected telephone service
demand or number of calls per unit time and expected call length in minutes. That is known as
traffic, and is important since that will be the single most important factor for determining
revenue and, thus, the profitability of a network. Second, there must be an evaluation of the
existing market, that is, the rural community’s interest for the service and its economic
purchasing or spending power, both of which should provide guidance for a financially healthy
business.
Once the network has been defined along with the engineers, the economists must make a
cost analysis of the network life cycle process, its development and implementation costs as well
as its operational life and retirement costs. That should include both the terrestrial and the space
segments along with maintenance and other operational expenses. They must then define the
expected revenue from the network’s usage, and also extend the analysis over its lifetime in
order to learn about its profitability over time.

25
2.4.2 Multiple Access and Topology Evaluation Techniques Multiple access is the process of optimizing the resources on a communications network, in
this case the satellite channel, when many earth stations try to communicate through it.
Depending on the network configuration, and especially on the expected earth station traffic, the
channel may be available to every one at all times (fixed assignment), to just a few who ask for it
(demand assignment), or to those who grab it by random access when it’s needed (contention
assignment).
Different applications require different types of multiple access, depending upon the type,
quantity and limitations of the information to be sent. High volume and high traffic applications
usually require fixed assignment at all times, while short, bursty applications are more efficient
on contention assignments. Demand assignment is somewhere in between, when a channel may
be needed for a large volume transmission but only for some time, releasing the channel once it
has finished using it.
2.4.2.1 Multiple Access Techniques
There are different types of fixed assignment (or basic) multiple access protocols:
• Frequency Division Multiple Access (FDMA), where each earth station is allocated a specific
frequency and bandwidth on the satellite’s transponder at all times and no one else can use it,
even when the frequency is idle.
• Time Division Multiple Access (TDMA), where each earth station is allocated the whole
transponder bandwidth but only for a specific amount of time in a sequence, called a time slot.
• Code Division Multiple Access (CDMA), where each earth station may use the whole
transponder bandwidth all the time, thus interfering with each other, but is assigned a specific
orthogonal binary code so that only the desired receiving earth station can recover the
transmitted information.
Figure 2.5 shows the general taxonomy of multiple access protocols typically used in
satellite communications, with an emphasis on the protocols used in this work.

26
Figure 2.5 Taxonomy of multiple access protocols for satellite communications
There are several advantages and disadvantages to every type of fixed multiple access, and
that makes them useful for specific situations depending upon the network configuration,
topology and type of transmitted information.
The selection of a multiple access protocol should consider the specific bandwidth and
power availability and communications requirements at both the transponder and the earth
stations [Bha81], [Pra86], [Rod96]. Any communications satellite is basically subdivided into
several transponders with different frequency bands, which is a rough type of FDMA. Any type
of multiple access can be used on a transponder.
The main advantage of fixed assignment multiple access is that the channel is always
available when the user needs it, but it also creates expense due to transponder bandwidth or time
usage, even when it is not in use. For low traffic applications that may not be a sound business
idea, so demand or contention assignment are usually recommended. Demand assignment is
usually used for medium to low traffic, longer duration applications, such as voice telephony,
Multiple Access
Contention-based Controlled Access
Demand Assignment Pre-assigned Probabilistic Time
DA -TDMA SCPC - DAMA FDMA TDMA CDMA
Fixed SCPC
Fixed MCPC Protocols analyzed in this work.

27
while contention assignment is widely used for short, frequent data bursts such as in data and
Internet transmissions.
Probably the most important demand assignment protocol, known as Demand Assignment
Multiple Access (DAMA), is related to both time or frequency assignment demand. Frequency
demand usually takes place when a single earth station requires the use of a single channel to
communicate with another earth station, and is known as Single Channel per Carrier (SCPC).
Here both earth stations are assigned a narrowband channel onboard the satellite during the
length of the call from a limited pool of channels, and is known as SCPC-DAMA. After the
communication session is over, both earth stations release their channels, which are then free to
be assigned to a new pair of earth stations when requested.
Traffic theory, through the Erlang B formula, helps define the correct number of available
voice channels for a pre-determined network size and grade of service, as will be explained
shortly. SCPC-DAMA has been the multiple access technique of choice in satellite rural
telephony applications since long ago due to its ease of implementation and efficient use of the
satellite channel [Ros81]. Demand Assignment TDMA (DA-TDMA) is a demand protocol used
to request a time slot on a TDMA network, but its implementation is more complex than SCPC-
DAMA, and it is not widely used on telephony applications. TDMA generally requires higher
power earth station transmitters than SCPC-FDMA, and is consequently less popular.
Up until this part it has been assumed that all earth stations would have a single user
channel per link, but multiplexing technology allows that channel to be shared even further,
through the use of Frequency (FDM) and Time (TDM) Division Multiplexing. Since most
applications now are digital, TDM is the multiplexing technique of choice. Available technology
allows multiplexing of up to 8 and 10 TDM user channels into a single 64 kbps carrier, which is
a typical narrowband satellite channel [Alb96]. This technique of multiplexing several users into
a single satellite channel is called Multiple Channels per Carrier (MCPC), and it is believed that
it would improve not only the capacity but also the revenue of an earth station [Com99]. This
assumption will be analyzed later on this work.

28
2.4.2.2 Topology evaluation techniques
An assumption so far has been that any earth station can communicate with each other at
will if the users are more interested in talking to each other on a local loop than in accessing a
larger area network, such as the PSTN. In the case of satellite rural telephony it is assumed that
the users would like to connect to the PSTN more often than to each other, changing the network
topology from full mesh to star, shown in Figures 2.6 and 2.7. A star topology allows all remote
nodes to interconnect to the PSTN through a single network element knows as gateway or hub.
Figure 2.6 Star topology on satellite networks, a) four VSAT example, b) representation.
VSAT A
VSAT B
HUB
VSAT C
VSAT D
b)
a)
VSAT C VSAT D
VSAT B
VSAT A
VSAT E
HUB
Satellite channel

29
Figure 2.7 Mesh topology on satellite networks, a) 3 VSAT example, b) representation [Mar95]
Several problems have been associated with the star topology, the most important due to its
reliability on a single node, the hub, which could prove catastrophic to the whole network if the
hub goes down. Another, more important to the customers, is that the hub is usually located at a
large city in order to provide quick access to the PSTN, and whose geographical location is
transparent to the satellite. As seen from Figure 2.6, a centralized network element (Hub)
concentrates all communications. A link between any two VSAT terminals requires two hops,
increasing end-to-end delay. A call from a remote user to a subscriber in the large city would
include only the satellite cost plus that of a local call, but a call to any other ci ty would increase
the cost of the call according to the distance between the hub and the distant subscriber. Thus, a
VSAT C B and C
VSAT B
VSAT A
A and B
A and C
VSAT C VSAT D
VSAT B
VSAT A
VSAT E
b)
a)

30
single point of access to the PSTN would imply that any call to other cities apart from the one
where the hub is located would increase the cost of the call.
One solution to the single point of access problem for satellite rural telephony has been the
use of a partial mesh topology, where a few of the remote earth stations are allowed to perform
as gateways to the PSTN in order to reduce long distance fees. Here, the satellite network would
find the shortest path and place the call through that specific gateway, decreasing the cost of the
call. One problem with this architecture is that the gateway earth stations are larger, more
complex and expensive than the usual remote terminals and the network requires a better
Network Management System (NMS), which is the software that operates the network.
Several VSAT manufacturing companies currently offer products which can be used on
either star or mesh topologies, depending upon the customer’s preferences. The question about
which topology, mesh or star, is more adequate according to [Mar95] depends upon three factors:
1. The structure of information flow within the network.
2. The requested link quality and capacity.
3. The allowed transmission time delay.
All three factors depend upon their different sensitivities to a single- or double-hop in
matters of directionality (one way/two way links), degradation (C/N for single/double hop) or
time delay (one/two hops in one/two ways). It is important to mention that double hops in star
topology networks happen only in remote to remote communications. Remote to hub are always
single hop links. Mesh and star are the most widely used topologies on satellite ne tworks, but
that choice must be carefully made based upon the network size, multiple access and traffic
requirements. Figures 2.6 and 2.7 show simplified diagrams and topologies of star and mesh
satellite networks, allowing bi-directional communications between any VSAT terminal.
The choice of a certain topology has a direct impact upon the earth station’s figures of
merit: Effective Isotropic Radiated Power (EIRP) and antenna Gain to noise Temperature (G/T).
Figure 2.8 shows the behavior of an earth station’s requirements for EIRP and G/T for a constant
Bit Error Rate (BER) with varying bit rate Rb. It can be seen that the star topology allows for
more capacity based on the VSAT’s EIRP and G/T figures.

31
Figure 2.8. EIRP vs. G/T comparison in a VSAT network, VSAT-to-VSAT, from [Mar95].
This larger capacity is due to the presence of the Hub’s larger EIRP and G/T figures, which
have a positive effect upon the overall link budget, obtaining more capacity with the penalty of a
longer delay (two hops). Table 2.3 summarizes the effects of network topology on VSAT
capacity and delay.
Table 2.3. Characteristics of star and mesh network configuration, from [Mar95].
Network configuration Star network (double-hop)
Mesh network (single-hop)
Capacity (given VSAT EIRP and G/T) large Small
Delay (from VSAT to VSAT) 0.5 s 0.25 s
2.4.3 Traffic Intensity and Grade of Service Traffic intensity T is the parameter mentioned at the beginning of this dissertation as one of
the most important parameters of rural telephony system design, and its dimensioning is crucial
for both the technical design (satellite capacity) and the economic design (business case).
Given BER
(G/T)VSAT
Curve 2: Star, double hop
Curve 1: Mesh, single hop
(EIRP)Hub Outbound link
Increasing Rb
Inbound link (EIRP)VSAT
(G/T)Hub G/T
EIRP
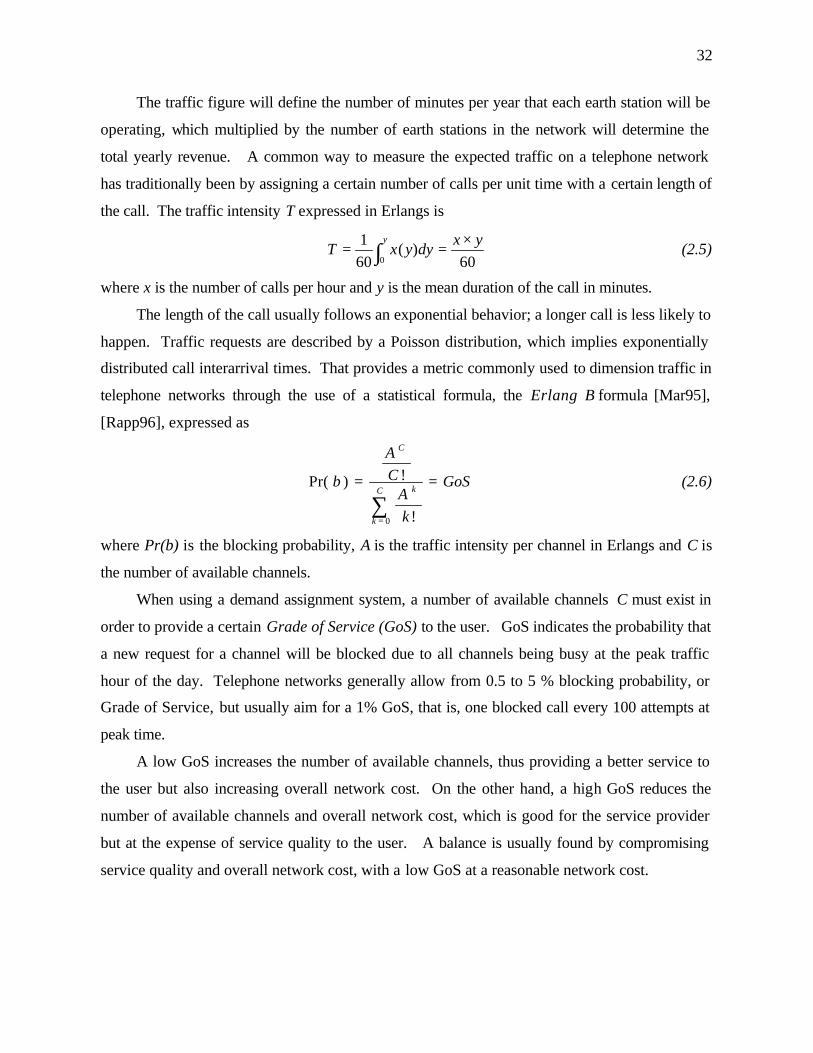
32
The traffic figure will define the number of minutes per year that each earth station will be
operating, which multiplied by the number of earth stations in the network will determine the
total yearly revenue. A common way to measure the expected traffic on a telephone network
has traditionally been by assigning a certain number of calls per unit time with a certain length of
the call. The traffic intensity T expressed in Erlangs is
60)(
601
0
yxdyyxT
y ×== ∫ (2.5)
where x is the number of calls per hour and y is the mean duration of the call in minutes.
The length of the call usually follows an exponential behavior; a longer call is less likely to
happen. Traffic requests are described by a Poisson distribution, which implies exponentially
distributed call interarrival times. That provides a metric commonly used to dimension traffic in
telephone networks through the use of a statistical formula, the Erlang B formula [Mar95],
[Rapp96], expressed as
GoS
kA
CA
bC
k
k
C
==
∑= 0 !
!)Pr( (2.6)
where Pr(b) is the blocking probability, A is the traffic intensity per channel in Erlangs and C is
the number of available channels.
When using a demand assignment system, a number of available channels C must exist in
order to provide a certain Grade of Service (GoS) to the user. GoS indicates the probability that
a new request for a channel will be blocked due to all channels being busy at the peak traffic
hour of the day. Telephone networks generally allow from 0.5 to 5 % blocking probability, or
Grade of Service, but usually aim for a 1% GoS, that is, one blocked call every 100 attempts at
peak time.
A low GoS increases the number of available channels, thus providing a better service to
the user but also increasing overall network cost. On the other hand, a high GoS reduces the
number of available channels and overall network cost, which is good for the service provider
but at the expense of service quality to the user. A balance is usually found by compromising
service quality and overall network cost, with a low GoS at a reasonable network cost.

33
Freeman [Fre96] mentions that a Grade of Service of 0.01 (1%) is a typical value for most
Public Switched Telephone Networks (PSTN). That value is acceptable in a typical wired local
area loop since the channel cost is rather low, but in satellite networks the transponder channels
are more expensive. A GoS of 1% to 2% is considered good quality on satellite applications,
meaning that one call between 50 and 100 will be blocked or lost during the busy hour.
In a congested system the traffic flow lost is related to the GoS by
traffic lost = traffic requested × Pr(b) (2.7)
where Pr(b) is the probability of blocking a call, and the actual traffic flow is
traffic flow = traffic requested – traffic lost
= traffic requested × [1-Pr(b)] (2.8)
Satellite networks use the same traffic and blocking probability analysis to define the
number of satellite carriers needed to provide thin-route telephone service on demand to multiple
earth stations. One difference between wired telephone local loops and radio and satellite
networks is that the radio network topology and multiple access exerts a strong influence in the
traffic analysis parameters, with an important impact in overall network cost.
Fixed multiple access networks (FDMA, Fixed-SCPC, TDMA) do not need traffic analysis
since each earth station has been assigned a permanent individual frequency or time slot, and
contention assignment uses a different analysis to define its capacity. Throughout this work, the
usage of the variables shown in Equation 2.6 will be n for the number of satellite channels
(equivalent to C on Equation 2.6) and T for the traffic intensity in Erlangs (A on Equation 2.6).
On SCPC-DAMA satellite networks the expected long distance traffic T, along with the
Erlang B formula helps define the number of n transponder channels to assign to a certain size
network with N total nodes. This assumes that N > n, according to the pre-defined GoS.
Although both terms sound similar, Grade of Service (GoS) and Quality of Service (QoS)
are not the same. GoS is the blocking probability of a call during peak time, a quantifiable and
measurable parameter that helps indicate the quality of the network. On the other hand, Quality
of Service (QoS) is a rather intangible concept, which really means how happy (or unhappy) a
subscriber is with his or her service [Fre96]. A number of parameters can help to better describe
the QoS concept. Chapter 4 will further explain the implications of Quality of Service in digital
telephony over satellite in both circuit-switched and packet-switched networks.
Chapter 3
Quality of Service in Digital Telephony over Satellite Telephony is the technology that allows two people to communicate verbally from a
distance through the use of electric signals. Voice transmission can take place either in analog
or in digital form, depending mainly upon the technology used at the local PSTN Central Office
(CO) when switching calls.
Almost all the existing central offices are now digital, although there may be a few analog
systems still operational throughout the world. The large investment in CO equipment is
justified only by its use over a long operational lifetime, even if that technology is in danger of
being rendered obsolete by new technical developments.
Voice can be converted into electrical signals by means of a transducer, such as a
microphone. An analog voice signal is an electrical signal carrying the voice information in the
form of changes in amplitude and frequency of an electrical time -variant sinusoid waveform.
This signal can be conducted over wired (cabled) or wireless (radio) bandpass channels as long
as the information signal is modulated and sent over the channels using a higher frequency
carrier signal.
Telephone signals between 300 Hz and 3,400 Hz are carried as analog baseband voice over
a two-wire link called the local loop and categorized as a voice channel, from the subscriber site
to the CO, in analog form in most current telephone networks. As soon as the voice signal
reaches the digital CO it is sampled and converted into a digital bit stream of ones and zeroes
according to the information content, becoming coded or digitized voice.
A voice coder (Vocoder) performs the process of digitizing voice for storage or
communication purposes, and there are several very efficient algorithms and techniques for
digitizing voice. The process of coding voice is also known as Pulse Code Modulation (PCM),
which is an erroneous term since modulation never takes places at this stage.
Switching takes place at the CO, and the digitized signal will remain digital throughout its
transmission over the channel until it reaches the other end’s subscriber loop. In our case of
interest, switching takes place at the satellite network gateway and routes voice over a satellite
channel. If the voice channel originates from the PSTN the digitization process occurred at the
35
local CO, while a voice signal from a remote site probably was digitized at the telephone set or at
the earth station telephone interface.
Coded voice may be transmitted and routed through a network as either a constant binary
stream over a dedicated network circuit (circuit-switched network) or in segmented form as
small reduced-size packets over a common network channel (packet-switched network). Each
type of network (circuit- and packet-switched) has its own characteristic behavior regarding
voice transmission and affects voice quality in a different fashion over the network.
3.1 Performance Indicators for Quality of Service (QoS) in
Digital Voice Transmission Communication systems are not only required to convey information from one point to
another, since this simple notion is missing the important customer’s point of view regarding the
quality of the service. Users do not need nor want to know about the specific technical
parameters of a service, but they are certainly interested in obtaining a “quality service” for
whatever application they are using since they are paying the service provider a usage fee.
This quality, along with the service itself, is what will be marketed to potential users so
they become attracted to the new service and the network starts having relevant traffic usage. A
low quality network will not generate as much revenue as a high quality network since users will
avoid calling on non-important issues and may end up using it only for emergencies or work-
related calls. This may not be enough traffic to recover the initi al investment and the network
may not be profitable, so the perception of quality by the network user is critical.
Since there are many different applications demanded from communications networks, it is
important to define the most important quality characteristics of a given application, although at
times there may be more than one service or application running over a single network. A
typical example of a large network running several applications is the telephone network
(PSTN), which must run optima lly for voice conversations but also for facsimile machines and
low bit-rate data modems.
3.1.1 Quality of Service and Network Performance Metrics There are a number of important parameters that may be analyzed or measured that help
establish a network’s QoS and Network Performance, which may sound similar but they are not.
Clark [Cla91] defines separately both QoS and NP, establishing that “QoS measurements help a

36
telecommunications service or network provider to gauge customer’s perceptions of the servi ce.
Network Performance parameters, on the other hand, are direct measurements on the
performance of the network, in isolation from customer and terminating equipment effects.”
This way it can be seen that the difference, although artificial or subjecti ve, gives QoS a
wider field than NP due to the user’s perceptions. This difference is also becoming important in
places where the government regulating entity (the FCC in the US) requires a certain QoS at the
network, but only up to a socket in the user’s premises. With this arrangement there can be cases
when, even by having an excellent NP a user may rate the QoS of a network as poor due to
possible problems at either user’s premises. Figure 3.1, taken from [Cla91] shows the difference
between both terms.
Figure 3.1. Quality of Service and network performance, from [Cla91], p.332.
There are several parameters that help explain the concept of Quality of Service from end
to end on a telephone link from a user’s point of view, less technical and more on customer
satisfaction terms. Rejected calls, which is the number of calls that are blocked due to network
congestion during peak times is one of the most common problems that any user can detect on a
telephone network. Other factors are intelligibility of speech, interference from other telephone
lines, interrupted calls, distortion, and speed of connection setup.
Network Performance
Quality of Service
Network
Customer premises
�(
Customer
Customer premises
(�Customer

37
Echo is the reflection of a signal from the other end in long-distance calls where the talker
hears his/her own voice slightly delayed. It is very annoying and is especially noticeable on
satellite telephone systems. System reliability and quick repair time are crucial since a terminal
down will not generate revenue but will generate frustrated customers. Other types of quality
metrics are the number of times, the total period of lost or interrupted service time and number of
faults per customer line per year. The total time a telephone set (home or payphone) is out of
order is also important.
Voice itself has been subjectively measured when testing QoS in telephone networks where
a number of people grade the quality of the communications link on a "very-good/ good/ regular/
bad/ very-bad" fashion, and then all grades are averaged, thus obtaining this measure. Although
it may not be technically sound, it provides a measure of customer satisfaction, indicating to the
engineers whether a problem is present somewhere on the network.
Network performance (NP) can be measured by means of objective testing for certain
parameters that help describe the performance of the different systems along the network. Some
of the most common parameters to measure are
• Attenuation distortion. This is the variable attenuation of different frequency components
of the voice spectrum caused by the line, which attenuates certain frequencies more
than others, distorting the tonal balance of the voice.
• Phase distortion or envelope delay. This is the delay of frequency components at the
extremes of the voice spectrum due to different propagation velocities in the channel
over long distances, due to the channel’s behavior as a bandpass-filter.
• Signal loudness. This is the audio level in the receiver’s phone, which must be at about
the same level as the original signal in the transmitter’s phone, in dBm.
• Noise (thermal, impulse, intermodulation and crosstalk) and total signal to noise (S/N)
ratio on the telephone line.
• Overall link signal delay.
• Network congestion in direct and alternate routes.
Although both the subjective and objective methods are good measures of the system's
quality, it is easier to work with specific parameters and avoid depending upon people's
perceptions and shifting moods that may affect grading telephone quality.

38
3.1.2 Circuit- and Packet-Switched Networks The Public Switched Telephone Network (PSTN) is the main communications network
developed by telephone operating companies and telecommunications service providers to bring
communications services to the end user, or subscriber, since the early days of telephony. Also
known as the Plain Old Telephone System (POTS), it was initially based on copper wires and
cables that ran into every subscriber's home or office to provide basic (analog) telephone service.
Central Offices (CO) routed the call to the proper destination as dialed by the calling party.
Local calls were routed through the same CO, and if the call involved a different area, it
would use transmission systems between Central Offices for metropolitan, regional or national
calls. The way this switching was done defined the type of network: it could be circuit-switched
or packet-switched.
In the first type, as mentioned before in this work, one physical link exists between both
user lines for the duration of the call and only initial addressing (dialing) is needed. In the
second type one physical link is shared among multiple simultaneous users and constant
addressing (packet address) is needed.
3.2 Circuit Switched Voice Transmission over Satellite There are certain aspects of voice transmission over satellite that are specific to circuit
switching, which still is the most common way of interconnecting telephone terminals over
satellite in the world. Next, a brief introduction to circuit switched telephony and its technical
and economic implications when carrying voice over satellite networks.
Although a satellite telephone network would eventually interconnect all calls to the PSTN
and switching would take place at the PSTN central office, there is also the possibility of using a
switching device at the hub for internal network calls (node to node). In star networks the central
node would perform this function while in a mesh network any node could do it. In either case
there is no reason to go through the PSTN switches, thus avoiding PSTN access fees.
3.2.1 Circuit Swi tched Digital Telephony Ever since the first public telephone systems appeared on the 1860’s circuit switching has
been present, although in different forms due to changing technologies. It first appeared in the
form of telephone operators who switched lines by connecting copper cables on a switchboard
between end users and leaving the line on until one hung up. By the turn of the 20 th century
39
large electromechanical switches helped create automatic switch offices, enabling telephone
service to be affordable for the public at large [Kes97]. Modern digital switches use arrays of
logic gates that close the circuit until one of the users hangs up, releasing the gate to be used by a
different user. In most telephone networks the CO still links the calling party's line to the called
party's line, thus following a route defined by the Central Office's switch and occupying that
connection at all times, so no one else can use it. The user is assigned a full time connection,
circuit or channel. According to [Cla91], a circuit-switched exchange must be able at all times to
perform the following three actions.
To establish and hold a physical connection between the caller and the calling party for the
duration of the call and disconnect it afterwards.
To connect any circuit carrying an incoming call to any other from a multitude of circuits and do
this by extracting the correct outgoing circuit from the dialed number.
To prevent new calls intruding into circuits that are already in use, diverting instead the intruder
to an alternative circuit that generates a “busy” tone.
A switch transfers information from an input to an output, which can be complicated at
some central offices with up to 150,000 inputs and outputs. The two ways to do circuit
switching are space division switching and time division switching, briefly described next.

40
3.2.1.1 Space Division Switches.
A typical space-division switch has a number of inputs arranged in rows and a number of
outputs arranged in columns, an arrangement simply called a crossbar. To connect any input to
any output, the switch controller makes a connection at the point where the input row meets the
output column. All other cross points are left unconnected. Figure 3.2 a) shows a crossbar with
input B connected to output 5, input C with output 1 and input E with output 3.
Figure 3.2. Circuit switching. a) Space-division, b) Time-division.
3.2.1.2 Time Division Switches.
A typical time-division switch described by [Kes97] has n inputs stored in a temporary
buffer. The switch reads from the buffer n times faster than the inputs and writes them to the
outputs in the proper order. This element is also called a time-slot interchange, or TSI. For
example, to achieve the same connections as in Figure 3.2 a), the time division switch shown in
Figure 3.2 b) would first read from B and write to 5, then read from C and write to 2, and finally
read from E and write to 2. This type of switch has a very similar principle of operation to a time
division multiplexer.
3.2.2 Circuit-Switched Digital Telephone Networks The Public Switched Telephone Network (PSTN) was designed from the beginning for the
analog 4 kHz voice channel, which has provided speech telephony since the 1880’s. The only
A
B
C
D
E
1 2 3 4 5 a)
A
B
C
D
E
1
2
3
4
5
Inputs Buffers Outputs
b)
Read
Write

41
other telecommunications service available at the time was the telegraph, which was developed
some 30 years before, and both systems evolved separately until the telegraph lost its place to
telex in the 1940’s and to the facsimile in the 1960’s. Facsimile quickly integrated into the
PSTN but it required a modem to be compatible with the analog telephone channel [Fre96].
During the 1950’s computer-generated data began to emerge, requiring some type of point-
to-point data transmission system, so it fit nicely into the then almost ubiquitous telephone
network, although it still needed a modem to integrate the digital service into the analog PSTN.
Although digital communication was available by then, it was severely limited by the 4 kHz
analog voice channel.
With the development of the transistor and digital communications theory by the late
1940’s, applications of digital telephony began to appear in the expansion of the telephone
network during the 1960’s with Pulse Code Modulation (PCM) transmission and switching
systems. PCM was designed to serve speech telephony, and even today more than 80% of the
traffic on the PSTN is voice telephony. That is the reason why all digital communication
systems today are based around the 64 kbps PCM channel [Fre96]. Although there were some
applications with in-band signaling (56 kbps data in the U.S.), today most digital services are
based on a clear-channel 64 kbps service.
Telephone companies have been multiplexing long distance calls onto high-speed trunks
since early telephone network years, since it is a proven economical advantage. When a large
number of telephone calls are going in the same direction, it is possible to carry them as a whole
instead of one-by-one, and multiplexing allows that. Since multiplexing equipment must be
identical at each end, a number of digital multiplexing hierarchies has been developed around the
world [Kes97].
3.2.2.1 Integrated Services Digital Network
Most public telecommunications operators throughout the world have been introducing
digital transmission and digital switching into the PSTN, and many of them are at various stages
of development of an integrated services digital network (ISDN). This technology allows
customers a variety of services, including voice and non-voice, through a digital network that
extends to the customer’s premises on a limited set of standardized common interfaces.
ISDN provides the user with a basic 64 kbps digital end -to-end connection. This is a big
improvement over the analog subscriber lines that still exist in most telephone networks, which

42
require the use of low bit rate modems (≤ 56 kbps) to use digital applications. One advantage of
ISDN is that it removes the need for telecommunications customers to have separate physical
links to each service network by integrating them in a common 64 kbps channel.
ISDN was designed to provide user interfaces to an existing digital network, working under
ITU-T’s Signaling System 7 (SS7). Under ISDN a single physical connection is provided to the
customer’s premises and a range of services are made available from it. Even more beneficial,
the services can be used simultaneously because access is not restricted to each individual
service in turn. The ISDN basic arrangement is designed to serve, among other services,
• Digital voice.
• 64 kbps data, both circuit- and packet-switched.
• Telex/teletext.
• Facsimile.
• Slow-scan video.
3.2.2.2 ISDN Channel Types
ISDN considers two classes of users, residential and commercial, as well as three types of
channels: B, D and H. The H channel may also be divided into the H0 channels and two types of
H1 channels, the H11 and H12 channels. There are three types of configurations available to
users. One is the Basic Rate Interface (BRI), with information carrying capacity of 144 kbps
simultaneously in both directions, and the other two are two different versions of Primary Rate
Interfaces (PRI), one with 1,536 kbps and the other with 1,920 kbps capacity simultaneously in
both directions. The standard bit rates for user access links are:
• B, at 64 kbps for the basic user (bearer) channel.
• D, at 16 or 64 kbps for the signaling (demand) channel.
• H0, at 384 kbps for the user information channel at the Primary Rate Interfaces (PRI).
• H11, at 1,536 kbps for 23 B channels plus 1 D channel (23B + D), totaling 1.544 Mbps.
• H12, at 1,920 kbps for 30 B channels plus 1 D channel (30B + D), totaling 2.048 Mbps.
The Basic Rate Interface (BRI) is composed of two B-channels and a D-channel, referred
to as “2B + D”, with the D-channel interface operating at 16 kbps. H0-channels may be used
separately (384 kbps) or in H11 (4 H0 or 3 H0 + D) or H12 (5 H0 + D) arrangements.

43
For the circuit-switching case the B channel is fully transparent to the network. It is the D
channel that carries the circuit-switching control function for its related B channels. Whether it
is the 16 kbps (BRI) or the 64 kbps (PRI) D channel, it is that channel which supports the
signaling information from the user’s ISDN terminal to the first serving telephone exchange of
the telephone company or administration, and then changed into SS7 signaling data. With
packet switching two possibilities emerge.
The first basically relies on the B channel to carry out OSI layers 1, 2 and 3 functions at
separate packet-switching facilities. The D channel is used to set up the connection to the local
switching exchange at each end of the connection. The second method utilizes the D channel
exclusively for lower data rate packet packet-switched service where the local interface acts as
an ITU-T X-25 data communications device [Fre96].
Since ISDN was designed to operate in an all-digital network, it can operate on those based
upon the Open System Interconnection (OSI) layer model. The network’s physical layer (layer 1)
allows the BRI user-network interface the bi-directional transmission of the two independent B
channels, which are Time-Division Multiplexed (TDM) over a four-wire interface. Frames are
transmitted full duplex, and both point-to-point and point-to-multipoint modes are supported in
the BRI.
The Layer 1 supports the PRI only for point-to-point mode. Since the B channel is not
specified for the data layer (layer 2), the D channel controls all of the B channels on the interface
as well as its own data transmission, including link access, flow control a nd error detection. The
main purpose of the network layer (layer 3) is to establish, maintain and clear network
connections such as circuit-switch connections using the B channel; packet switched connections
using the D or B channel; and user-to-user signaling connections using the D channel.
3.2.2.3 Broadband ISDN (B-ISDN)
ISDN was designed to operate in an all copper, lower capacity, wired network, at BRI (144
kbps) and PRI (1.544 or 2.048 Mbps), which are referred to as Narrowband ISDN (N-ISDN).
However, high bit rate services, such as image and video services cannot be provided in the 64 or
384 kbps channels offered by N-ISDN.
Advances in optical fibers, computing switching and Digital Signal Processing (DSP) have
stimulated a rapid demand for higher channel capacities, increasingly replacing copper as a Wide
Area Network (WAN) technology, so ISDN is evolving towards what is known as Broadband

44
ISDN (B-ISDN). A number of technologies can provide these services, more notably ATM,
over a number of high digital transport technologies such as the Synchronous Network Hierarchy
(SDH) / Synchronous Optical Network (SONET), with standard bit rates for access shown in
Table 3.1. B-ISDN and ATM are described in more detail in Appendix A, along with the brief
description of a proposed new architecture and protocols which resulted from this research,
called Modified ATM over Satellite (MAS) architecture.
Table 3.1. SONET bit rate hierarchy, from [Saa94], p.388.
OC Level
SONET designation
Payload rate (Mbps)
Line Rate (Mbps)
OC-1 STS-1 50.112 51.84
OC-3 STS-3 150.336 155.52
OC-9 STS-9 451.008 466.56
OC-12 STS-12 601.344 622.08
OC-24 STS-24 1202.688 1244.16
OC-48 STS-48 2405.376 2488.32
3.2.3 Satellite Circuit-Switched Network Requirements Any satellite network can be designed for efficient operation and good commercial quality.
However, the most critical problem encountered in the application of satellite telephone
networks is interfacing to the terrestrial PSTN. Telephones are nearly the same all over the
world but different standards apply in different countries, and when other OSI layers than the
physical (satellite channel) are involved (data, network, transport and session), the information is
coded and signaling features are included, the possibility for problem grows.
Therefore, interfacing to the PSTN is a potential bottleneck and design challenge, but as
Figure 3.3 shows, the importance of satellite communications in thin route applications is also
reflected in the many services offered.

45
Figure 3.3. Different interfaces on telephone applications, from [Elb97], p.327.
In many cases, such as in rural telephony, the satellite network provides the primary means
of communication from a remote location and should be as flexible as the telephone network.
The satellite network telephone interface brings with it unique electrical, bandwidth and
signaling characteristics that must be compatible with those at the PSTN gateway earth station.
It is common to consider the gateway earth sta tion similar to interconnecting a PBX to the
PSTN, though the local exchange interface should be able to access international digital
standards like E1, T1/DS1, SS7 and ISDN BRI interfaces, as shown in Table 3.2 from [Elb97].
Telephony baseband equipment
International gateway
Toll exchange
Local exchange
RF terminal
PSTN facilities
Hub
(
:
Ê
PBX
RF terminal
Telephony baseband equipment
End-user equipment
Remote

46
Table 3.2. Interface standards for satellite telephone connections, from [Elb97], p.328.
Facility Type of Access Standard
Telephone Two-wire, touch-tone (DTMF)
PC data RS-232
ISDN Basic Rate (BRI)
Modem/fax Same as telephone
Private; end-user
PBX 4-wire E&M, alternatively T1 or E1
Local exchange Two-wire touch-tone (DTMF); 4-wire E&M, T1 or E1
Toll exchange Four-wire E&M, T1 or E1
PSTN facilities
International gateway
International connection, T1, E1 or SDH
The toll exchange is almost always digital and follows a nati onal standard, besides being
usually provided by a major manufacturer and many of them have been recently installed. This
may be the easiest part to implement.
The access to an international gateway can occur either at the domestic side or at the
international side when interconnecting telephone networks. The domestic side should be
interconnected using the same interface as that of the toll exchange, but on the international side
the transmission plan and signaling must be clearly specified.
Older PSTN networks tend to use two different types of network signaling, R1 in the
Americas and R2 in Europe and the rest of the world, but newer networks are already using SS7,
thus rendering it compatible with ISDN. Out-of-band or common channel signaling is standard
in a demand assigned SCPC satellite network, as will be discussed later in this work.
47
3.2.4 Quality of Service in Real-time Voice Applications via Satellite Voice communications are based on the interaction between two people, and although the
common user may not understand technicalities about Quality of Service, a low quality service
will immediately be noticed. Satellite communications, especially over Geostationary (GEO)
orbit satellites, generate a noticeable delay that is easily recognized, and that has long been
known to degrade the quality of voice communications. However, this delay may be acceptable
in some cases because it often is the only (or most economic) way to provide telephone service
to remote places.
3.2.4.1 Propagation Delay
When transmitting over a GEO satellite channel there is always a propagation time delay,
expressed by Equation 3.1, which is the time it takes for the signal to travel from the transmitting
station to the satellite
cd
t p = (3.1)
where tp is the propagation time, d is the distance to the satellite in meters and c is the
speed of light (c = 3×10⁸ m/s). In a typical case with a GEO satellite at an average distance of
38,500 km (38.5×10⁶ m) it takes the signal about 0.128 s to reach the satellite and a similar
amount of time to return to the receive earth station. This creates a 0.256 s propagation time
delay on a one-way call from the transmit earth station to the receive earth station. This delay is
important for two-way, real-time applications such as voice or videoconferencing, since it takes
more than 0.5 seconds, not counting other minor sources of delay.
3.2.4.2 Echo
One of the most annoying effects on circuit-switched voice transmission over satellite is
called "echo", which is caused either by an incorrectly adjusted element (the hybrid) at the
remote telephone set, or by audio feeding itself from the handset speaker to the microphone at
the remote end. This delay is proportional to the propagation time, and in GEO satellite
applications it can be over half a second long, causing an annoying effect to the caller hearing his
own words again. Another time -sensitive application is interactive data transaction, especially
computer networks, which have a limited time period to acknowledge correct reception of data.
This application and its effects over satellite networks will be explained later in this chapter.

48
Those applications that are time -sensitive must have a guaranteed access to the satellite at all
times and show the lowest possible overall delay.
3.3 Packet-switched Telephony over Satellite Satellite networks are able to meet a wide variety of data communications needs for
practically all types of users: business, education, government and individuals. What makes
satellite networks attractive is the wide area coverage combined with the ability to provide
variable bandwidth with a certain consistency in the quality of the service. A standard 36 MHz
transponder can transfer 60 Mbps, suitable for supercomputer applications and multimedia,
although most applications do not need such high speeds.
The satellite can carry as much digital information as its transponder bandwidth and/or
power limitations allow, and the user may benefit from this as much as its earth station
equipment permits it. On the user equipment part, traffic capacity is directly related to the
terminal’s figures of merit such as antenna size, transmitter power and receiver system noise
figure, or EIRP and G/T figures.
Propagation delay on satellite packet links reduces the throughput when there is significant
interaction between the two ends of the link, particularly where devices need to exchange control
information for flow control, including establishing connections and confirming receipt. The
most popular data communications standards are Transmission Control Protocol/Internet
Protocol (TCP/IP) and Systems Network Architecture with Synchronous Data Link Control
(SNA/SDLC), both of which request retransmission of blocks where errors have been detected.
Although some techniques have been developed to overcome this problem, such as
spoofing or using very large window sizes, there is still much work to be done in this area
[Had99], [Bem00].
Packetized voice transmission over satellite has been the subject of ongoing research for
some time now, but the problems encountered have yet to be solved in a satisfactory fashion.
Although there are some satellite networks currently offering some type of packet-voice
transmission, the quality of service is still not sufficient to be used widely in a large national
telephone network such as the PSTN. Part of the work on this dissertation involved finding an
effective way to provide packetized voice over satellite for rural applications.

49
The preliminary results of a Modified ATM over Satellite (MAS) network architecture for
rural telephony involving VSAT networks is presented in Annex A of this document. Although
that model is still incomplete, it is a direct result of the research presented in this dissertation.
3.3.1 Introduction to Packet-switched Communications Networks Most national PSTN systems currently operate over a high-capacity fiber optic backbone,
such as SONET, cross-connecting a number of large cities mainly in the broadband and public
long distance area. Most large packet networks are still used between PSTN offices since bulk
traffic is handled more efficiently this way, but an increasing number of smaller private networks
are emerging, mainly to provide Internet connections to clusters of interested users. This usually
happens either at a single location (on campus, company facilities) or spread over the city
(Internet Service Providers, ISPs).
Although most packet networks are based upon the OSI reference model, none has actually
been implemented exactly like that. Many other layer architectures have followed somewhat
different but also successful models, such as the one already used in all Internet connections,
Transmission Control Protocol/Internet Protocol (TCP/IP), or the more recent ATM protocols.
TCP/IP was initially designed to interconnect and support interworking of dissimilar
computers across a network providing end-to-end reliable transport layer functions over IP
controlled networks [ATM99]. Voice over IP would rely on the transfer of IP cells over a User
Datagram Protocol (UDP) instead of TCP, which is contemplated in the Internet. ATM may be
used in a stand-alone ATM network, or may be a medium for carrying IP over it.
The packet networks are designed to efficiently use and share the medium, and the Internet
is showing many possibilities and advantages over traditional circuit-switched networks,
although it is still under development [Has00].

50
3.3.2 The Open Systems Interconnection Layered Model The Open Systems Interconnection (OSI) layer reference model was developed by the
International Organization for Standards to provide a basis for defining the interconnection of
computer systems. Although the OSI protocols are hardly used by any network, they set the
functions of different layers of protocols, which have been followed by most computer network
manufacturers and service providers.
For that reason, it is a good idea to understand the OSI seven layer protocol model, shown
in Figure 3.4 and explained afterwards in a satellite network environment.
Figure 3.4. The Open Systems Interconnection (OSI) layered model.
Layers in different stacks at the same level are called “peer” layers. At every layer there is
a pair of cooperating processes, one on each end host, which exchange messages according to the
corresponding layer protocol [Mar95]. The principle of layered protocols is that layers can
interact in a peer-to-peer manner with their immediate higher and lower layers, but as long as the
interface between the layers is not affected, it is not important how the specific function of a
layer is carried out.
Each layer of the OSI model relies upon the service of the layer beneath it, and when
receiving a Packet Data Unit (PDU) along with some other parameters from an immediate layer
it uses the parameters to include a new header and, possibly, a trailer. This is done so that its
peer layer on the other end will know what to do with the packet, a process called
Network
Data link
Physical
Network
Data link
Physical
Intermediate nodes within the network
Application
Presentation
Session
Transport
Network
Data link
Physical
End host
Application
Presentation
Session
Transport
Network
Data link
Physical
End host

51
“encapsulation”, illustrated in Figure 3.5. The shaded areas at the beginning of each segment are
the layer’s name and the term “Header”, e.g. AH stands for Application Header, PH for
Presentation Header, etc. The shaded area at the end of the frame on the Data link layer is the
“Data link Trailer”.
Figure 3.5. Layer to layer encapsulation in the OSI model, from [Mar95], p. 112.
It can be easily seen from Figure 3.5 that a large number of bits in a packet is used only for
protocol information (overhead), thus the total information (data) content in a packet depends
upon the ratio of useful data bits to the total number of bits. Although this is important, it may
lead to misleading conclusions.
In order to increase the useful information (payload) in a packet we can either reduce
overhead or increase packet size. The first may increase the possibility of error between layers
due to fewer control parameters, while the second may affect the overall latency of the network
due to larger packetizing and buffering delays. For more information related to the OSI model,
refer to [Saa94], [Dav96], [Fre96] and [Kes97],
Application
Presentation
Session
Transport
Network
Data link
Physical
Name of protocol
Name of unit exchanged
data
A data
P data
data
data
data
bits
bits
S
TH
N
D
data
APDU
PPDU
TPDU, message
packet
frame
bit
SPDU
DT

52
3.3.2.1 The Seven OSI Layers
1. The first layer is the Physical Layer, which deals with the actual transfer of information
between two systems connected over the physical medium, in this case the satellite
channel. It provides the physical connectivity between the two systems and may take the
form of wired link (cable, wires or optic fibers) or wireless (radio, satellite or
infrared/optical). It is concerned with all aspects of bit transmission such as bit format,
bit rate, bit error rate, forward error correction (FEC) encoding and decoding, modulation
and demodulation, etc. The physical layer is what defines a satellite network from other
similar networks, and it includes the radio carrier’s (EM wave) magnitude and frequency.
2. The second layer is the Data link Layer, which ensures the reliable delivery of data across the
physical link by means of performing transmitter and receiver synchronization, flow
control and error detection and correction. It sends blocks of data called frames, which
provide the necessary frame identification to perform the functions described above. In
satellite packet networks the data link layer is important since it may be a major cause of
delay due to frame errors. In a high latency channel this may generate multiple
retransmissions until an acknowledgement (ACK) signal arrives, thus sending the next
frame and waiting for the next ACK for a long period of time every frame, slowing down
the transmission to an unusable rate and congesting the transmitter. This can be reduced
with a number of actions such as spoofing (tricking the receiver into believing an ACK
has arrived) or by the use of sliding window techniques with large windows (transmitting
multiple packets before an ACK is received), which require large amounts of buffering
capacity.
3. The third layer is the Network Layer, which sets up end-to-end connections by routing
packets from the source to the destination, determining the individual links to be used and
making sure they are available. This implies identifying the destination (addressing),
identifying the path (routing), checking resource availability (congestion control) and
identifying the link user for billing (accounting). At a satellite network this could
happen at the main earth station (hub, gateway) if repeater satellites are used, or onboard
the satellite if on-board processing (OBP) satellites with packet-switching capacity are
used.

53
4. The fourth layer is the Transport Layer, which is an end-to-end protocol that enables
processes on different hosts to communicate by making the network connection that best
matches the session requirements in terms of quality of service, data unit s ize, flow
control and error correction needs. If more than one network is available (packet
network, circuit-switched data, telephone network, etc.) it chooses between them. It
performs functions such as segmenting and reassembling a message, multiplexi ng several
transport connections into a unique network link, and flow control by controlling
information flow between end terminals so a fast terminal does not saturate a slow one.
Most of these functions in a satellite network would be performed at the hub
(multiplexing and flow control) although there would be its counterpart at the remote
earth station (segmenting, reassembling).
5. The fifth layer is the Session Layer, which provides the means for cooperating presentation
entities to organize and synchronize their dialogue and to manage the data exchange. The
session protocol implements the services that are required for users of the session layer,
negotiates for an appropriate type of session (full duplex or half duplex), and manages the
session (synchronizes, interrupts, resumes and releases the connection at the end of the
session).
6. The sixth layer is the Presentation Layer, which is concerned with data transformation, data
formatting and data syntax, which are required to adapt the information-handling
characteristics of one application process to those of another application process (use
syntax from site A or B). It hides data representation differences between applications to
a network standard. It may also encrypt data, both to authenticate it to the receiving
application and to prevent unauthorized parties from accessing it.
7. The seventh layer is the Application Layer, which provides services to the application
processes and serves as a window through which the application gains access to the
communication services provided by the model. It also establishes requirements for data
syntax and is responsible form overall management of the transaction. The application
itself may be executed by a machine (CPU + software) or by a human operator.
54
3.3.2.2 Applying the OSI Model to Satellite Technology
Only the first four layers (physical, data link, network and transport) are of importance to
satellite networks. The upper layers (session, presentation and application) are usually part of
the user’s end application and thus have very little impact on satellite networks. It is doubtful
that a satellite will perform any upper layer function any time soon, although applications are
affected by satellite characteristics such as latency.
All repeater satellites operate only at the physical layer, mostly over an analog waveform
that contains the physical layer’s radio-electric information, which is amplified and shifted in
frequency for the downlink. Few satellites currently perform functions above the physical layer,
but that seems to be changing since new satellite technology allows some regenerative functions
(re-modulation, error detection and correction) on satellites at the data link layer.
Only the most advanced On Board Processing (OBP) satellites perform functions related
to the network layer, such as packet switching and routing. That seems to be the direction that
future satellites will be taking, at least those designed to provide broadband capacity on global
digital networks. References [IEEE97], [IEEE99-1] and [IEEE99-2] mention a wide number of
projects working on new architectures, protocols and applications for broadband, packet-satellite
networks.
A common term in recent publications refers to the OBP capacity and technology of this
type of broadband satellite as “switchboard in the sky” [Bem00], [Far00], [Wit00]. The potential
of OBP satellites for networking applications can be easily noted by the over 1,300 expected
satellites to operate on Ka-band (30/20 GHz) and V-band (50/40 GHz), with conservative
estimates suggesting over 500 broadband satellites by the year 2009, as described by [Had99].
3.3.3 Packet-switched Digital Telephone Networks Although voice is an analog signal it has been commonly transmitted on digital networks
for several decades now with no tangible loss of quality. Satellite voice transmission has been
possible due to the use of advanced signal processing algorithms that allow low bit-rate voice
compression, eliminating signal redundancy and optimizing bandwidth.
Nevertheless, when voice is packetized its continuous bit stream is segmented into blocks
of bits called cells, and with the addition of cell headers they become packets. One problem
with packetized voice is that if a packetized payload cell gets corrup ted (bit error), little

55
information is lost and the user will hardly notice it, but if a whole packet is lost (header error) or
corrupted (burst error) then the QoS will be severely degraded. This makes header errors more
important than payload errors. Of the several technologies mentioned to replace the telephone
network Voice Telephony over ATM (VTOA) and Voice over IP (VoIP) seem to be the most
promising, and there are current efforts to provide both technologies over satellites, so a brief
description of each will follow.
3.3.3.1 Voice Telephony over IP (VoIP)
The most common telephone system today is still analog over a wire, and though it is a
very old technology it has many advantages: it is simple and keeps end -to-end voice transmission
delay very low since electrical signals on cables travel close to the speed of light. On the other
hand, noise adds up in the analog signal at all stages of the transmission and there is no way to
separate the voice signal from the added noise. Most countries now use digital transmission
systems but the subscriber line remains analog, so the voice is converted into a 64 kbps digital
data stream and multiplexed in time (TDM) in the first local exchange.
Most telephone conversations only use the channel 40 % of the time, so Voice Activity
Detection (VAD) is used on digital voice to transmit only during that time, thus optimizing the
channel through the use of statistical multiplexers. If the channel is empty the voice uses it, and
if it is busy it waits until it is available. Since this uncertain channel availability is statistical of
nature, statistical multiplexers are used, and the variation during the waiting time is called jitter,
which needs to be corrected on the receiving side.
The next-generation telephone network will probably use statistical multiplexing and mix
voice with data on the same lines. VoIP is mentioned as having a slight advantage over ATM
regarding connectivity [Her00] since it does not require setting up virtual channels. VoIP
requires the use of the Real Time Protocol (RTP), which allows receivers to compensate for jitter
and de-sequencing introduced by IP networks. RTP can be used for any real-time stream of data
such as voice and video applications by formatting IP packets carrying i sochronous data,
including information on the type of data, timestamps and sequence numbers.
RTP does not have any influence on the behavior of the IP network and does not control
the service in any way, so RTP packets can be dropped, delayed or de-sequenced just like any
other IP packet. RTP is not associated with the Resource reSerVation Protocol (RSVP) since it

56
only allow receivers to recover from network jitter by buffering and sequencing, and provides
network information.
RTP is typically used on top the User Datagram Protocol (UDP), which provides notion of
port and a checksum. RTP over UDP can reach several destinations, since RTP can be carried
by multicast packets. Since each RTP carries a sequence number and timestamp it can manage a
reception buffer on the receiver, placing the incoming packet in the corresponding sequence and
allocating up to 100 milliseconds of speech before beginning the playback.
If a packet is delayed or lost it can decide to copy the last frame on the packet and play it
repeatedly until the timestamp is caught or try to use some interpolation scheme. The packet
payload (actual coded speech), specifies the codec type used for voice formatting, which follows
the general H.323 standard for the architecture and operation of videoconferencing systems over
a packet network. H323 is not specific to IP, since it can also operate over ATM.
The main attractive of VoIP is the possibility of using the Internet to provide telephone
service at a fraction of the current cost of calling through the PSTN, independent of the distance
and time tariff currently operational. Internet Service providers charge only for the local call plus
a standard packet tariff per packet ($/packet) or per data volume ($/Mbyte).
Network convergence is also an attractive option for IP service providers, since it allows
the use of a single network for most information transfer needs, along with a larger range of
audio quality, from highly compressed voice to high fidelity stereo audio, multicast conferenc ing
and even voice web browsing [Li00].
Internet technology is also relatively immature, with quality and latency still being major
issues. Humans can tolerate about 250 ms of latency before it has a noticeable effect, and voice
services over the Internet today easily exceed this figure.
3.3.3.2 Improving QoS over IP Telephony
There are two main mechanisms being developed in order to improve the QoS of Voice
over IP (VoIP), namely the Integrated Service Model (IntServ), and the Differentiated Services
Framework (DiffServ) [Li00].
IntServ must manage resources (bandwidth and buffer) for each real time application. This
requires a router to reserve resources using resource reservation protocol (RSVP) in order to
provide specific QoS for packet streams, or flows.

57
The DiffServ architecture can offer each user a range of services differentiated on the basis
of performance. Traffic entering a network is classified and conditioned at the boundaries of the
network. Users request a specific performance level on a packet-by-packet basis.
Voice over IP would require specific IP hardware such as desktop IP phones and terminals,
switches, routers and IP/PSTN gateways, as well as software such as the call manager. IP
switches and routers connected to a PBX can carry voice traffic over data IP networks. Long
distance calls can be routed through the WAN link and, best of all, the transport for IP telephony
would be transparent to the users.
3.3.3.3 ITU Recommendation H.323: Voice over the Internet
The International Telecommunications Union (ITU-T) has been working for a number of
years on de creation of a new standard for Voice Telephony over ATM (VoATM), which has
been named Recommendation H.323. This recommendation defines procedures for multimedia
communications services over packet based networks that do not provide guaranteed QoS. It
includes H.323 endpoint elements such as terminals and gateways, where terminals are user
devices that provide for real time, two-way multimedia communications with other H.323
endpoints.
Gateways provide for real time, two-way communications between H.323 terminals on
packet networks and terminals on N-ISDN, B-ISDN or PSTN. Gatekeepers control access to the
packet network at the endpoints and provide other services such as address translation between
packet networks and the PSTN. Finally there are the Multipoint Control Units (MCU), which
enable three or more terminals or gateways to participate in a conference.
3.3.3.4 Voice Telephony over ATM (VTOA)
A common problem in voice telephony over packet-switched networks is that voice during
a conversation is time-sensitive, so the packets must have the lowest possible delay and arrive in
orderly sequence at the other endpoint. That is why a connection-oriented (one single route)
packet-switched network such as Asynchronous Transfer Mode (ATM) offers many advantages
for this type of application.
One of the functions offered on ATM by the equivalent to the OSI Transport Layer called
the ATM Application Layer (AAL) is to segment a binary stream into same size cells, with the

58
capacity to create different type services according to its application and time delay
requirements.
The ATM Application Layer 1 (AAL 1) provides for Continuous Bit Rate (CBR) service
over a Circuit Emulation Service (CES) channel, requiring stringent traffic parameter values on
its traffic contract. Although voice can be supported by AAL 5, it is usually carried by AAL 1
for transport over a public ATM network. Until recently ATM only provided voice capabilitie s
at 64 kbps (125 µs/sample), so an AAL 1 voice cell would require 47 bytes (2.94 ms) of waiting
time to assemble the packet and then send it. This is called processing delay and it also has an
effect on buffering delay.
Much work has been published regarding voice over ATM [Sta95], [Hän98], [Dav99], but
only recently are standards emerging, mainly over an AAL 2 Class service platform [Sta99],
[McL97-1], [McL97-2] and [Fla97].
3.3.3.5 ITU Recommendations I.363.2, I.366.1 and I.366.2: Voice over ATM
Recently a new subgroup of study emerged, developing new standards called ITU-T
Recommendations I.363.2, I.366.1 and I.366.2 that call for the use of the more efficient AAL 2
protocol platform for Variable Bit Rate (VBR) services. This allows the use of compressed
voice and video in real time applications over an ATM network, overcoming the excessive
bandwidth needed when using Circuit Emulation Service (CES) for Continuous Bit Rate Service
(CBR). This standard can only be used when all the network nodes are AAL 2 capable, but it
can handle both CBR and VBR traffic, allowing statistical multiplexing, silence detection and
suppression and idle channel removal [McL97-1].
ATM provides support for a wide variety of applications and services based upon a
different treatment of traffic, which is called Quality of Service (QoS). By performing the
proper traffic management, ATM allows networks to achieve network performance objectives
that provide the users with its critical QoS performance levels.
Some services demand higher QoS parameters than others do, and ATM guarantees
reaching those service requirements based upon the network's performance and capacity. QoS
parameters usually include network capacity, latency, bit and packet errors or synchronization
problems, and each service has different values for its representative parameters to guarantee its
individual QoS over the ATM network.
59
The Asynchronous Transfer Mode (ATM) standard is based on the evolution of the
Integrated Services Digital Network (ISDN), which was designe d to "provide subscribers with a
single, digital access channel for both voice and data traffic" [Dav99].
ISDN was initially designed as a circuit-switched Time Division Multiplexed (TDM)
network but applications soon demanded higher bit rates with the need to provide packet
switching capacity, so an improved version of ISDN emerged, called Broadband ISDN (B-
ISDN). ATM is a packet-oriented transfer mode that involves switching, multiplexing and
transmission of uniform size packets, or groups of data bits, using an asynchronous TDM
multiplex technique.
ATM is connection-oriented since every cell in a transmission travels over the same pre-
established virtual path. ATM now allows B-ISDN to deliver high bit rate data services to
subscribers, and integrates voice, video and data over a single digital network using broadband
telecommunications infrastructure.
The possibility to provide capacity and compatibility for future applications makes ATM
an attractive technology, which is the main reason this work was based on a modified ATM
architecture and protocol, created in order to provide telephone service to rural communities
using conventional GEO satellites.
3.4 Quality of Service on Packet-switched Telephony over
Satellite A satellite network must be designed to provide the Quality of Service (QoS) that the
application requires in order to function in a satisfactory manner. QoS involves factors such as
bit error rate or packet error rate, link availability, throughput, delays or call set-up time. It has
been shown that in packet switching networks, QoS applies from end -to-end during the duration
of the session, so the design must include provisions over a long call-time.
There are many parameters that can be improved, such as buffer size, number of buffers
and other time variant constants depending on the network protocol, and that varies with the
application, whether is real-time or non real-time.
ATM has been at the forefront of most broadband satellite networks due to its easy
integration into terrestrial networks, although IP-based satellite networks are taking more
relevance and will soon clear most of its current real-time problems.

60
All aspects of IP and ATM over satellite networks are being studied. From introductory
articles [Aky97], [Spr98], [Met00], [Far00] to network architectures [Bar95], [Kot97], [Toh98],
[Mer99], [Chi99], [Wit00], Quality of Service [Fah95], [Fah96], [Kal96], [Kal98], medium
access control [Pey99], traffic management [Goy99], modeling and simulation [Conn99] and to
standards [Cue99]. Only the most important concepts are mentioned in this work.
However, it has also been mentioned that in packet transmission over satellite networks,
the main problem in providing QoS telephony, resides in both the time delays correspond ing to a
typical GEO satellite link as well as those found on a typical packet-switched terrestrial network.
These delays can take any of two forms: continuous, or variable.
Continuous delays are those associated with processing the voice, switching and routing or
propagation. They may be large or short, but they are constant, and thus, can be predicted. On
the other hand, variable delays create many problems for the network designer, since an estimate
must be made regarding delays, and that estimate will never be exact.
Variable delays involve variations in traffic that create waiting lines at the switches and
routers generating jitter and semi -random buffering delay, or errors in bits or packets, requiring
retransmissions, thus lowering the network throughput. This section will try to explain briefly
each case.
3.4.1 ATM Quality of Service Parameters
An ATM network commits to provide a certain QoS for the end -to-end connection. A
number of network performance parameters can be negotiated at the connection setup trough the
traffic contract for an efficient service to the traffic descriptors.
CTD (Cell Transfer Delay) is the end-to-end elapsed time of a cell from the moment it exits the
source network interface to the corresponding time when it enters the destination network
interface.
CDV (Cell Delay Variation) is a component of the cell transfer delay associated with CBR and
VBR services, showing the difference in time between the peak CTD minus the fixed CTD.
CLR (Cell Loss Ratio) indicates an acceptable value for loss of cells on a specific network, while
still keeping a required QoS during the lifetime of the connection. A lost cell is one that
does not arrive within the CTD interval.

61
CER (Cell Error Ratio) is the ratio of errored cells in a trans mission in relation to the total cells
sent in as transmission. An errored cell is one with an uncorrectable error at the cell header
or a cell with a corrupted cell payload.
SECBR (Severely Errored Cell Block Ratio) is the ratio of cell block with more than 1 bit error in
the cell header to the number of successfully delivered cell blocks.
CMR (Cell Misinsertion Rate) indicates the number of received cells at a connection endpoint
that were not sent by its other endpoint, thus not intended to arrive at this point, during a
period of time.
BT (Burst Tolerance) is an upper bound on the number of cell arrivals observed at the peak rate.

62
3.4.2 Satellite Packet Network Architectures Satellite networks are usually defined by their network architecture, protocol layer models
and network size and topology. Although generic satellite architectures are usually presented in
most references, there must be distinctions regarding their switching standard, in this case IP or
ATM over satellite. Satellite ATM (SATM) ne tworks usually require extra information since
their Physical Layer parameters are very different from the fiber optic networks that B-ISDN was
originally designed to work with.
Satellite IP networks are being designed mainly for Internet applications, thus TCP
compatible, which is not friendly for real-time applications such as voice telephony. The
terrestrial networks designed to carry packet traffic are mainly based upon fiber-optic
technology, with very little deterioration of the signal, no interference, and point to point
topologies. The most important networks are SONET, SDH or Fiber Distributed Data Interface
(FDDI), capable of carrying Frame Relay Service, mentioned before in Section 3.2.2.3.
Fiber optic networks do not have the long propagation times that satellite links present, so
satellites must provide extra attention to this problem and continuing research is being done in
this area, as mentioned by [Far00], [Bem00] and [Had99]. New architectures, protocols and
interfaces are being developed in order to integrate packet network technology with satellite
technology, driven initially by the Internet demand [Abr00] but increasingly by the attractive
possibility to offer multimedia and broadband services over large coverage areas. This
dissertation includes a novel architecture and protocols to serve telephone and low bit rate
services in thin-route application via a Modified ATM Satellite (MAS) network, described in
Appendix B of this work.
Most satellite packet network architectures are based on two types of technologies: Bent-
pipe satellite networks, and on-board switching satellite networks [Toh98]. There is a big
difference between the two, and thus each requires completely different approaches. There are a
number of capabilities that both bent-pipe and OBP satellites can perform, with the simplest
being the simple relay satellite, growing in complexity up to the several switching functions
described later in this chapter.
Figure 3.6 shows the taxonomy of On Board Processing (OBP) capabilities of satellite,
adapted from [Toh98].

63
Figure 3.6. Taxonomy for On Board Processing (OBP) satellite architectures, adapted from
[Toh00].
Satellite OBP
Bent-pipe OBP
Demodulate re-modulate
Switch Repeater Interconnect Regenerative
Transponders Antenna beams
Spread codes
Packets Time slots

64
3.4.3 Bent-pipe Satellite Network Architecture Bent-pipe satellite networks use repeater satellites, which only relay packet traffic from one
remote user to another through the packet’s physical layer. The satellite does not have access to
the packet's data link nor transport layers, therefore it cannot switch cells nor route them through
virtual paths or channels. This fact makes it easier to use generic (off the shelf) satellites, thus
lowering satellite complexity and cost, but requiring instead better performance from the earth
stations with an increase on network cost.
The bent-pipe repeater satellite does not need a special Medium Access Control (MAC)
layer, except for the basic multiple access technique common in most satellite networks. On the
other hand, since the quality of a satellite link depends upon weather conditions, burst errors can
severely affect the network’s QoS parameters.
A satellite without on-board processing and bit /packet regeneration cannot correct these
errors, and the downlink may even increase them. This is a big disadvantage of bent -pipe
satellite networks. Figure 3.7 shows the basic architecture of a packet network based on repeater
satellite. In this case, even while the satellite is part of the packet network it only performs
repeater functions over the physical layer.
Figure 3.7. Architecture of a bent-pipe (repeater) satellite-based packet network.
Physical
Satellite
Application
Presentation
Session
Transport
Network
Data link
Physical
User terminal
Application
Presentation
Session
Transport
Network
Data link
Physical
End host / PSTN Gateway
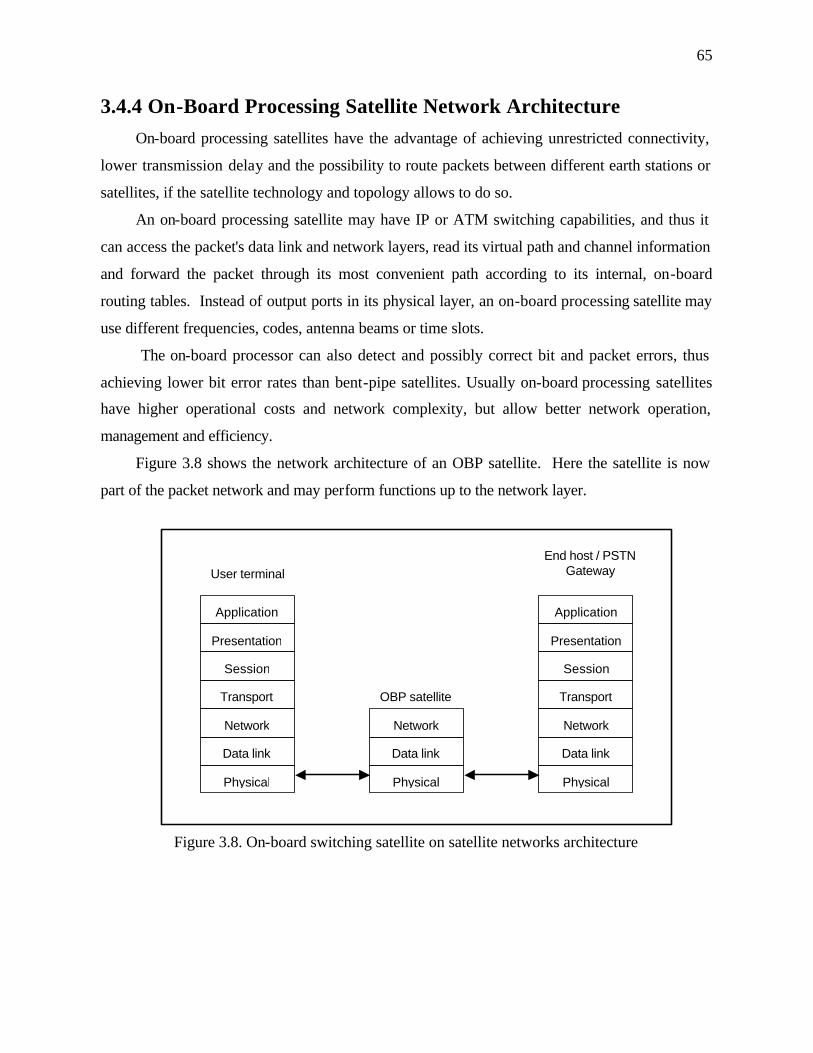
65
3.4.4 On-Board Processing Satellite Network Architecture On-board processing satellites have the advantage of achieving unrestricted connectivity,
lower transmission delay and the possibility to route packets between different earth stations or
satellites, if the satellite technology and topology allows to do so.
An on-board processing satellite may have IP or ATM switching capabilities, and thus it
can access the packet's data link and network layers, read its virtual path and channel information
and forward the packet through its most convenient path according to its internal, on-board
routing tables. Instead of output ports in its physical layer, an on-board processing satellite may
use different frequencies, codes, antenna beams or time slots.
The on-board processor can also detect and possibly correct bit and packet errors, thus
achieving lower bit error rates than bent-pipe satellites. Usually on-board processing satellites
have higher operational costs and network complexity, but allow better network operation,
management and efficiency.
Figure 3.8 shows the network architecture of an OBP satellite. Here the satellite is now
part of the packet network and may perform functions up to the network layer.
Figure 3.8. On-board switching satellite on satellite networks architecture
Application
Presentation
Session
Transport
Network
Data link
Physical
User terminal
Application
Presentation
Session
Transport
Network
Data link
Physical
End host / PSTN Gateway
Network
Data link
Physical
OBP satellite

66
Some broadband satellite networks are being design to operate on Low Earth Orbit (LEO)
constellations, with numerous satellites moving in different orbital planes. This reduces the
propagation delay, having an improvement on overall system latency due to the orbit, and
although some of these satellites will be repeater only, there are some networks that have
satellites perform onboard switching. As mentioned before, on-board switching improves even
more the overall throughput of a satellite network, since the packets can be routed between
neighboring satellites until reaching the desired destination.
This type of satellite network performs not only switching but also routing to its user
destination using shortest-path routing algorithms. This is not an easy technological task, since
the satellites are fast-moving switches with ever-changing ground gateways to many different
terrestrial networks, so the satellites must have global routing tables which need to be updated in
real-time at all times. It is doubtful anybody has come up with a way to do this yet, so what is
currently being done is to upload the routing tables from the gateway under the satellite’s path as
soon as it appears, and use routing algorithms on the terrestrial nodes. There is much work to be
done in this area. Figure 3.9 shows the typical architecture of a broadband satellite -switching
network.
Figure 3.9. Inter-satellite switching architecture on packet-switched satellite networks.
Application
Presentation
Session
Transport
Network
Data link
Physical
User terminal
Application
Presentation
Session
Transport
Network
Data link
Physical
End host / PSTN Gateway
Network
Data link
Physical
Network
Data link
Physical
Packet-switching satellite network
Inter-satellite routing within the network

67
3.4.5 Latency on Satellite Links Some digital applications may be affected by other delays besides propagation time but still
not degrade the quality of the service. Other delays are buffering delay (tb), transmission
(packetizing) delay (tt) and processing (switching & routing) delay (ts). These delay times plus
propagation delay (tp) add up to what is called "end to end delay", more commonly known as
"latency" (D), described by
D = tt + tp + ts + tb (3.2)
Latency is probably the most important source of concern in packet-switched, time-
sensitive applications, since it will directly impact the Quality of Service of the ne twork. For
digitized and packetized voice undesired effects could affect recognizability (who is speaking),
intelligibility (what is being said) and integrity (missing information). In high latency voice
links the problem compounds with non-instantaneous conversation, since each caller has to wait
a certain amount of time from the moment he stops speaking until the moment he receives a
response, even if the other party responded immediately, due to the delays described above.
Figure 3.10, shows transmission, processing and buffering delays accounted for by "Tx delay"
during transmission at site A, "Rx delay" during reception at site B, and again for the return.
Figure 3.10 End to end delay performance in packet-switched networks.
Site A Site A
Rx delay Propag.
delay
Tx delay Response
Rx delay
Propag. delay
Tx delay Initial call
Site B
Initial call from A to B Response call from B to A
Total time delay from end of spoken question at site A to the beginning of heard response at site A
End-to-end delay = LATENCY
68
The traffic performance of a network during cell transmission between connection points
defines the Quality of Service (QoS) of the connection. It is defined on an end -to-end basis in
terms of several attributes of the end-to-end connection, known as "Traffic Parame ters". On the
other hand, these parameters can only be guaranteed when the network provides the proper QoS
connection through several parameters known as "Network Performance Parameters", described
by [Gor95], [Dav96] and [ATM99].
3.5 Packet Satellite System Performance There are two major challenges in the design of satellite IP and ATM networks. The first is
throughput (the number of packets that the network can forward each second) and the second is
size (how many remote terminals it can handle simultaneously. Both cases have a common
element in terms of available or required bandwidth. For the case of bent-pipe GEO satellites, a
maximum bandwidth must be available at all times, independently of its multiple access
technique. For that reason the multiple access technique must be carefully chosen. This is well
explained in [Mar95], [Elb97], [Kot97], [Had99] and [Eva99] regarding satellite performance.
For a more detailed explanation of the following subjects, it is recommended to read [Fre96],
[Pet96], [Tan96] or [Kes97].
3.5.1 Bandwidth -Delay Product In GEO satellite systems propagation delay tends to be the major component of overall
delay and a limiting factor of multiple access performance. In satellite links user information is
continuously being sent to the channel and the transmitted bit rate defines how many bits are
being sent per second. The bandwidth-delay product is a figure of merit that specifies the
number of bits inside the channel when transmitting at full capacity. Let tp represent the
propagation time between any two earth stations through the satellite in seconds and c the
satellite channel capacity in bits per second; then the bandwidth-delay product in bits is
d = c 5 tp (3.3)
What the bandwidth-delay product will show is how many bits are present inside the
channel, which in high latency applications such as GEO satellite links can reach a large quantity
of information. This product is very important in high-speed bit data applications, too.

69
3.5.2 Buffering If a signal with a 280 ms propagation time carries a 2.048 Mbps signal, the bandwidth-
delay product is 573.44 kbits. This means that at any given time there are 573.44 kbits
propagating through space in both directions, not present at the transmitting site nor at the
receiving site. If any of these bits is affected by impairments or errors, either a retransmission
will be needed or Forward Error Correction (FEC) will be attempted. In retransmission all sent
information is temporarily stored in memory until no longer needed, a process is known as
"buffering". This process takes up much memory, especially for large bandwidth-delay product
applications, since all that data must be available for retransmission until the response arrives.
Buffer sizing is a critical process in satellite networks, especially for broadband and multimedia
applications.
3.5.3 Throughput Bit errors may occur when some of the traffic arriving at the satellite is affected by
propagation impairments (e.g. rain), thus requiring a retransmission of the errored packet or
packets. Since the same information has been sent twice but it will be useful only once it takes
the place of another packet waiting to be transmitted. The ratio of useful packets (or bits) to the
total packets (or bits) sent in a time period is called "throughput".
3.5.4 Congestion control Congestion is defined as a state in which the network is not able to meet the required QoS
for already established connections and/or new connection requests. In order to avoid
congestion, traffic control procedures (prevent congestion) and congestion control procedures
(minimize intensity and duration of congestion) have been established. Large delays can cause
significant increase in the latency of feedback mechanisms for congestion control, with a
negative effect in overall QoS.

Chapter 4
Methodology for Cost-effective Network Design A communications network is a system that interconnects many communication nodes,
which are built from generating, storing, processing and transmitting systems (hardware), and
many layers of software. The hardware and software in a communications network provide the
user with terminal, computational, storage and transmission resources that are used to provide
network services. System design is the process of putting together these resources into an
efficient and cost-effective whole, which is not easy.
It is important to define the difference between an efficient and an effective
communications system. Efficiency is concerned with minimizing the cost of producing a given
output. Effectiveness is concerned with making use of the output to meet the goals of the
organization [Lan75]. Figure 4.1 shows how an effective system is a joint concern of both the
system’s designers and its users, and how an equilibrium must be found between Quality of
Service (QoS) and the network’s value, and the cost of producing the service. Figure 4.1 a)
shows the relationship between QoS vs. Value on one curve and QoS vs. Cost on the other. It
can be seen that increasing QoS beyond a certain point does not increase the network’s value
much, but increases cost rapidly. A satellite system analogy could be reducing the number of
blocked calls compared to the cost of adding more RF carriers.
Figure 4.1. Economic impact of Quality of Service in a system, from [Lan75].
Value
Quality of Service
Cost
Money $
a)
Value
Quality of Service
Cost
P
K
Q1
Money $
b)

71
As QoS approaches perfection, providing great value, the network’s cost rises exponentially,
increasing the user cost and lowering requests for service. On the other hand, a low cost network
provides the users a low value service, which may generate loss of interest in the service by
users. Obviously a middle ground is needed, where an acceptable service value to the user may
be obtained with a reasonable investment by the network provider. [Lan75] calls this an effective
system with an optimum QoS. Figure 4.1 b) shows how the optimum point is found at Q1, the
point where the slopes of the tangents at P and K are equal, where the cost of increasing QoS by
one unit equals the value to the network of that extra unit of service. This slope change is also
referred to as the crossover point between marginal costs and marginal revenue.
A change in technology may offer improvements over a previously considered system so
an analysis should be made to find out if a system change or upgrade is justifiable. Figure 4.2
shows how the new system (system 2) provides the same QoS of the previous system, Q1, at the
reduced cost L1, so it is an efficient system. On the other hand, to achieve an effective system
(slope at P2 equal to slope at L2) the QoS would be increased to Q2 at a cost of L2. The
effective system provides a higher QoS than the merely efficient system, but at a higher cost.
Network designer must determine which case is the best fit to the specific application. This
model requires the designer to specify a QoS determined both by the potential value to the users
as well as by the cost of providing such quality.
Figure 4.2. Economic impact of Quality of Service on different systems, from [Lan75]
Value
Quality of Service
Cost 1
P1
L1
Q1
Cost 2
Q2
L2
K
P2
Money $

72
The question now is how to determine the value of the quality of a satellite telephone
network, even if the costs can be estimated. Two essential aspects here are the expected net
value due to a change in QoS, as well as the expected user behavior. That is where the market
study, technical standards, regulatory body requirements and personal experience of the
designers and economic planners come into the systems design process.
4.1 Introduction to Communications System Design In any system some resources are more available than others, and these freely available
resources are called unconstrained resources, while a resource whose availability determines
overall system performance is called a constrained resource [Kes97]. In a satellite system the
satellite’s transponder bandwidth and power constrain the overall performance, as measured by
the effective traffic capacity of the link; therefore the satellite is a constrained resource.
A system designer must optimize one or more performance metrics given a set of resource
constraints. A performance metric measures some aspect of a system’s performance, such as
traffic capacity, delay, capital cost or user cost. A resource constr aint is a limitation on a
resource such as bandwidth, transmitter power, maximum network size or user cost that the
designer must obey. By explicitly identifying performance metrics and resource constraints, a
system designer ensures that the design space is well defined, the solution is feasible and the
design is efficient. This allows balancing unconstrained and constrained resources to maximize
the design’s utility at the lowest cost. A well-designed system maximizes achievable
performance while still satisfying the resource constraints.
4.1.1 Problem Definition Communications systems design is a process that demands a balance between experience
and calculated guesses, or as [Kev97] describes it, “... systems design is both an art and a
science.” Four major reasons make the process hard to control:
1. Intangible parameters that cannot be quantitatively measured, such as simplicity,
effectiveness, or even whole concepts such as Quality of Service and user satisfaction.
2. Technology changes can make constraint assumptions obsolete during the system’s
design, implementation or operational lifetime, forcing the designer to predict
tendencies and make a design “future-proof” as much as possible.

73
3. International standards that may change over time, but often impose difficult or
arbitrary constraints that still have to be included in the design.
4. Variable market conditions that may require changes in the design when part of the
design is already complete.
Identifying resources and the metrics that can be used in good communication system
design is the first step into a methodology that allows cost-efficient network design.
4.1.2 Performance Metrics System design and network planning requires developing quantitative and qualitative
design-to criteria, as mentioned by [Bla98]. The quantitative factors or metrics associated with
the system to be designed are called Technical Performance Measures, also called Performance
Metrics. A description of how to select techniques and metrics for computing and
communication system performance can be found in [Jai91] as part of the steps for the
Performance Evaluation Study.
4.1.2.1 Traffic Intensity
As mentioned in Section 2.4.3, traffic intensity is an important parameter that helps define
the expected number of minutes that each earth station in a satellite communication network will
be generating revenue. Therefore, expected traffic intensity is one of the most important
performance metrics for the satellite model analysis. This work is based on a rural application
where previous telephone service is assumed non-existent, so low traffic figures are used for
conservative purposes. Table 4.1 shows the traffic intensity values used in this study for both
individual subscribers with a telephone set at home, and a Public Calling Offi ce (PCO), with a
public access telephone onsite, from [STM00].
Table 4.1. Expected traffic intensity for satellite rural telephone networks
Traffic amount Usage time Traffic Intensity
Very low traffic 1.5 min/hr 0.025 Erlang
Low traffic 3 min/hr 0.05 Erlang
Typical subscriber traffic 6 min/hr 0.10 Erlang
Typical PCO traffic 12 min/hr 0.20 Erlang
High traffic 15 min/hr 0.25 Erlang
Very high traffic 20 min/hr 0.33 Erlang

74
4.1.2.2 Grade of Service
In any telephone network application the Grade of Service is an important performance
metric. GoS is the blocking probability of a call during peak time, a parameter that helps
indicate the quality of the network by dimensioning the number of required channels. As
mentioned in Section 2.4.3, a GoS of 1% to 2% is considered good quality in satellite
applications, meaning that one call in 50 and 100 will be blocked or lost during the busy hour.
This allows a good service quality at a reasonable satellite networking cost, since transponder
use is expensive. All demand assignment (DAMA) simulations in this work were done
assuming a GoS between 1% and 2%.
4.1.2.3 Mean Delay
Mean delay is another common performance metric. The propagation delay in a GEO
satellite link is usually around 280 ms one-way due to propagation time. Voice is assumed to
have a good QoS if the one way delay is less than 400 ms. This is possible in any circuit-
switched, mesh topology network as well as in a VSAT-to-hub satellite link, but not in a VSAT-
to-hub-to-VSAT, star topology network.
On the same token, a Voice Telephony over ATM (VTOA), packet-switched transmission
may be successful over a GEO satellite link due to its guaranteed virtual channel, depending
upon the network topology. Unfortunately, this is not yet the case in Voice over IP (VoIP)
transmission over satellite, even when using RSVP or RTP over UDP, as explained in Section
3.3.3.1, due to the lack of guarantees of maximum latency in real-time applications. Therefore,
due to the still ongoing research and standards definition of packetized voice over satellite, no
packet-switched applications were modeled in this work.
A packet-switched, VTOA application (Modified ATM over Satellite, MAS) model is
briefly described in Appendix A, including a proposed network architecture and protocol, a
preliminary result from this work.
Therefore, a standard 300 ms mean delay is considered throughout this work due to GEO
satellite transmission in circuit-switched applications. No remote-to-remote calls over star
topologies are considered in this work, and switching over the PSTN is assumed almost
instantaneous. This delay is assumed tolerable by the telephone network’s users.

75
4.1.2.4 Throughput Capacity
Another common performance metric, especially in computer systems and networks is
throughput, which is a measure of the efficiency of a transmission in bits per second normalized
to channel data rate. In this work, throughput is defined as the capacity of a terminal to transfer
information over the satellite channel, which is related to available bandwidth. Two types of
satellite transponders are assumed in this work, repeater (bent-pipe) and on-board processing
(OBP) transponders. Any transponder has a defined range of the frequency spectrum in which it
will carry out its function, which is called transponder bandwidth.
It is assumed that a VSAT terminal uses a 64 kbps signal to transmit from one to eight
digital voice signals into a 100 kHz RF channel on a BPSK modulated carrier with 50% roll -off
and a small guard band. Most current and proposed Ku- and Ka-band satellites use transponders
with 36 or 54 MHz bandwidth, so a full transponder can transmit up to 360 or 540 VSAT carriers
with 100 kHz bandwidth in each case if the transponder is not power limited. Some systems
mention compressed voice at 8 to 16 kbps transmitted over a 27 kHz channel using BPSK and
50% roll-off, allowing up to 2000 simultaneous channels on a 54 MHz transponder. More
compressed voice channels does not seem to be the solution on rural networks, sinc e in either
case the terminals cost about the same, thus requiring a huge initial investment in large networks.
Therefore, a variable number of satellite channels in a transponder, with a maximum
number of 500 simultaneous satellite channels, is used in this model to simulate a variable sized
rural satellite telephone network. All channels are assumed to carry one 64 kbps signal over a
100 kHz carrier from a single terminal at all times, with full control over the carrier while it is
assigned to that channel. The 64 kbps signal is a standard digitized voice signal with 8 bits and 8
kHz sampling
4.2 Network Planning Factors The following sections document the parameters in the network under consideration. The
assumptions made about these parameters are intended to restrain the models into realistic and
workable limits, allowing reasonable simulation and modeling results.
A network planner operates in a context influenced by a number of factors, described by
[Rob99] as technology factors, business factors, organizational factors and environmental
factors, each one with a different area of influence. In this work, only the boundaries of some of

76
these factors will be established, since it is an analytical model that is under study rather than the
full simulation and measurement of a complete (and specific case) communications network.
4.2.1 System Boundaries There are several limitations imposed upon the design of rural satellite telephony networks
regarding the system model and the required simulations, which may facilitate its analysis and
bound its parameters. The network considered in this research consists of an arbitrary number
of earth stations networked together via satellite to provide mainly voice and low bit-rate data
service to rural locations. Therefore, a number of boundaries have been defined to limit the
number of variations to what current technology provides or will soon provide. The core of this
work is the methodology followed to optimize network performance. The proposed economic
models are a set of equations that allow the analysis of different parameters that influence the
network’s topologies, multiple access or multiplexing, looking for cost-effective performance
measures.
Satellite telephone networks have numerous parameters and can exist in many different
configurations. The following sections will further define the network investigated in this
research.
4.2.1.1 Satellite Orbits
The satellite orbit defines the potential service coverage area, which is important, but it also
demands a number of requirements from the earth station, which can have an impact on system
parameters and cost. It has an impact on QoS (delay, attenuation, BER), on capacity (earth
station’s antenna, bandwidth and power) and on cost (earth station’s size , required power and
complexity). The sole designation of the satellite’s orbit defines many of the network’s technical
and economic advantages and disadvantages, but an orbit must be chosen at some point.
Satellites in Medium Earth Orbit (MEO) and Low Earth Orbit (LEO) help reduce
propagation delay and losses but require large constellations of satellites, thus increasing the
network’s complexity and overall cost. Geostationary Earth Orbit (GEO) satellites in circular
equatorial orbit (inclination angle: 0 degrees) will be used in all the computer analysis of the
parametric designs. An average distance of 38,000 km from the satellite to the earth station will
be considered, having a clear line of sight from the earth station at a high (>20 degrees) elevation

77
angle. In this dissertation, only GEO satellites will be considered, since they provide available
bandwidth capacity and have lower leasing cost per transponder than LEO or MEO satellites.
4.2.1.2 Satellite Link Frequencies
Satellite frequencies are limited to a number of spectrum bands, as agreed by international
body standards in order to avoid interference from and with terrestrial systems. The currently
allowed bands for Fixed Satellite Service (FSS) in the Americas are shown in Table 4.2, along
with other typical satellite parameters. This research will simulate links at Ku band for most
applications, and at Ka band for the OBP case.
Table 4.2. Fixed Satellite Service typical satellite parameters
Frequency band Satellite EIRP Satellite G/T
Transponder Bandwidth
C-band (6/4 GHz) 36 to 40 dBW -3 to 2 dB/K 36 MHz
Ku-band (14/11 GHz) 45 to 50 dBW 0 to 5 dB/K 36, 54, 108 MHz
Ka-band (30/20 GHz) 55 to 60 dBW 4 to 9 dB/K 36, 54, 108 MHz
V-band (50/40 GHz) > 50 dBW > 5 dB/K 36, 54, 108 MHz
4.2.1.3 Satellite Technology
The satellites considered for simulation and network design in this work have the typical
parameters of commercially available GEO satellites, with the following characteristics.
• A generic, readily available satellite able to operate at C, Ku or Ka bands from GEO orbit.
• Enough EIRP to deliver a strong signal over the area of interest as shown in Table 4.2 is
assumed at all times in this work.
• Enough G/T ratio to receive good quality signals from small remote earth stations is also
assumed in all simulations, as shown in Table 4.2.
• A typical bent-pipe repeater satellite and a regenerative-type on-board processing (OBP)
satellite (no packet switching or routing, nor beam or time -slot switching capabilities) are
assumed in this work.
• Enough bandwidth and power transponder capacity to serve a large size Wide Area Network
(WAN) with multiple sites. Although a larger bandwidth transponder allows higher bit rates
and more capacity, there are filter, amplifier linearity, and group delay problems associated
78
with broadband transmissions. Therefore, a typical 36 MHz transponder will be assumed at
all times in this work.
4.2.1.4 Earth Station Technology
There are a number of assumptions for the earth station technologies that fall into the
following parameters for all cases throughout the simulations on this work, as mentioned next.
• All earth stations are assumed to be under the satellite's main coverage area, with clear line of
sight to the satellite and located at the –3dB edge of the satellite antenna’s main beam.
• All Remote Earth Stations (RES, VSAT terminals) and Gateway Earth Station (GES, Hub)
use high gain, directional, parabolic (center-fed, offset or Cassegrain) dish antennas.
• All earth stations include an Outdoor Electronic Unit (ODU) comprising an up/down
frequency converter, a Low Noise Amplifier (LNA) or Block-converter (LNB), and a solid
state or tube High Power Amplifier (HPA).
• A typical RES should not be larger than 1.8 meters in diameter and HPAs should not have
more than 2 Watts of maximum RF output power.
• All earth stations use Indoor Electronic Units (IDU) comprising a generic satellite modem
using BPSK, QPSK or any of its variants, and include multiple access control to the satellite.
• All RES include a user interface and terminal equipment (telephone, data port) for an
individual user, provide a TDM interface and equipment for multiple users, or access to the
PBX or WLL equipment, depending upon each case.
• All IDU equipment is sheltered from the open weather and provided with electric and
electromagnetic shielding. All terminal equipment can be controlled and monitored by
remote control supervisory operation, and electrical power supplies are assumed available.
• The gateway earth station (GES), or hub, provides direct access to the PSTN at all times
through a number of physical connections (circuits or routers), according to the expected
channel and traffic capacity analysis.
Typical VSAT prices for a 2-Watt radio and 1.2 m antenna unit, and varying hub sizes for
this research are based on the following values, taken from [Mar95], [COM99], [Joh00].
Unit price 10 nodes 50 nodes 100 nodes 500 nodes >1000 nodes
VSATs $10,000 $9,000 $7,500 $6,000 $5,000
Hub $40,000 $100,000 $1,000,000 $1,000,000 $2,500,000

79
4.2.1.5 Link Availability
A reliable communications link is assumed at all times, with link availability of 99.9% of
the time in a year and only 8.77 hr/year of outage time, due mainly to rain. For VSAT networks,
quality of service is guaranteed to be a BER (after FEC) bette r than 10-8 for 99.9% of the time
(system reliability). The system is assumed to be down 0.1% of the time in a year with a BER
higher than 10-4, which may be good for voice transmission but not for data, where a BER lower
than 10-6 is required. A 99.9 % availability is considered for link budget purposes throughout all
simulations in this work. A higher availability figure has a direct impact on important network
resources, especially in earth station requirements, forcing an increase in overall costs.
4.2.2 Network Boundaries Since the models presented in this work are directed towards a general methodology for
network design and not to the design of a specific network, the models must allow the designer
to “play” with different boundaries, depending upon the desired parameter to optimize.
4.2.2.1 Network Size
If a general methodology for network design is to be used, network size must be a variable
parameter. Network size determines the initial cost of the network, so planning for a large or
small network should include different boundaries. Depending upon the desired network’s size,
topology, multiple access and GoS, the network will require a number of satellite channels for all
the network’s nodes. Section 2.4.3 describes how traffic analysis he lps in dimensioning the
number of channels n required for a certain GoS at a network with N nodes, where N > n.
The number of nodes used in this research shows the technical and economic trends when
different size networks are used in different cases. A small network requires a different
technical and economic analysis than a large network, so variations in size are used throughout
the simulations. Different size networks with N nodes and n channels are shown in Table 4.3.
Table 4.3. Number of channels n and number of nodes N for different network sizes
Network Size Very small small regular medium large
Fixed assignment n/N 20/20 50/50 100/100 200/200 500/500
Demand assignment n/N (GoS)
10/30 (1.8%)
15/50 (1.2%)
25/100 (1.3%)
50/240 (1.9%)
96/500 (1.8%)

80
4.2.2.2 Network Quality of Service
As mentioned before, the term “Quality of Service” is a rather intangible concept, with a
number of parameters that help to understand it. The parameters used (after Forward Error
Correction, FEC) in this work are: BER = 10-4 (voice), BER = 10-7 (data), Mean delay = 300 ms,
GoS between 1% and 2% of blocked calls, 99.9% availability, among other parameters. As
mentioned above, these figures give an idea of the Quality of Service of the proposed networks.
4.2.2.3 Network Access to the PSTN / Broadband WANs
The user interface for the rural telephone network is assumed to allow a rural user to call a
distant site by means of basic telephone operation, but also to transmit data through the proposed
satellite communications system if necessary. The interfacing public switched telephone
network (PSTN) uses international communications standards and interfaces, for either basic
circuit-switched telephone service as well as the VoIP and VTOA future systems. The Remote
Earth Station (RES), or VSAT terminal, has access to common user voice and data interfaces to
the IDU equipment. The Gateway Earth Station (GES) is assumed to present a common
interface to the PSTN or public IP or ATM networks, along with the proper ATM and Physical
layer information. The voice quality must be equal to that expected from the PSTN, even if
compressed and digitized. A connection fee to the PSTN is assumed at $0.04/min per voice
channel.
4.2.2.4 User Cost
Since the objective of this research is mainly to provide telephone service to remote
locations and villages without it, it is expected that the user cost for the telephone service should
remain low. Currently, big long distance companies offer attractive tariffs for urban users
around $0.10 per minute at special times, but these prices can only be offered by multiplexing
many calls to nearby destinations, at least during certain routing lines. Economies of scale allow
service providers such prices, but only when traffic is high in certain routes, which is not the case
in rural telephony. Besides, fiber optic links provide huge capacity that, under high traffic
conditions, allows the low prices mentioned above. [Elb97] mentions that the cost per telephone
channel of a high-capacity fiber cable is 50% to 90% less expensive than a comparable satellite
link, provided that the fiber capacity is fully utilized.

81
For satellite networks, pricing varies according to the technology used. LEO systems were
charging prices for telephone service between $1/min for Globalstar to $3/min for Iridium
[Ste96], [Con99], although there is no available service currently offered by either one. VSAT
systems show somehow lower prices, ranging between $0.25 to $0.50/min for owned systems
and $0.15/min to $0.25/min for leased system [Com99]. Prices are difficult to obtain since few
systems are operating anywhere in the world, and pricing information is not easily accessible.
Therefore, the $0.20/min to $0.50/min price range will be used throughout the simulations for
this research analysis, as mentioned by [Com99] and [Alb93].
4.3 Network Planning Optimization Algorithms Network planning requires the evaluation of multiple criteria for both economic and
technical factors involved in decision making. The different problems in each case may be
formulated mathematically, and this formulation mainly consists of two parts.
1) The objective function, which is a mathematical function that shows what the “cost” of
a solution would be, cost being any performance related quantity, along with a set of
variables describing the possible solution.
2) A set of constraints, expressed as a set of mathematical equations with one or more
limitations on the range of acceptable solutions. The constraint equations define the
feasible solution region.
An objective function and its associated set of constraints is called a mathematical
program, which once formulated allows for an optimal solution that minimizes or maximizes the
objective function while satisfying the set of constraints.
This section explains the methodology for using optimization algorithms in
communications network planning and design.
4.3.1 Linear Programming Linear programming is the most widely used form of mathematical programming, that has
been developed as a branch of applied mathematics for methodological planning. Linear
programming deals with special mathematical methods or algorithms that can be computer
programmed to solve specific optimization problems. Sometimes the algorithms produce a
globally optimal solution, a local optimal solution or no solution at all, depending upon the
algorithm and the problem’s constraints.

82
Although linear programming has long been used in network planning to optimize
telecommunications network design, as mentioned by [Wu84] and [Rob99], telephone and
telecommunications companies consider their design algorithms, assumed performance metrics
and parameter constraints as sensitive and proprietary information. Therefore it is very difficult
to find real cases or examples of network optimization problems, and the authors of papers end
up describing only the theory and mathematical tools.
Linear programming is concerned with the problem of optimizing a linear objective
function of several variables subject to a set of linear cons traints. The canonical form of the
problem is described by the two parts previously mentioned in Section 4.3 above.
The first part is the objective function to be maximized (or minimized) described as
∑=
=++++=n
jjjnn xcxcxcxcxcz
1332211max K (4.1)
where xj (j = 1, 2, ..., n) are the decision variables whose optimal value has to be found and
cj (j = 1, 2, ..., n) are the proportional costs that multiply each of the xj. The term z is the total
cost to be maximized (z) or minimized (-z) depending upon the specific case.
The second part is the set of constraints, where there are m linear constraint equations for
the decision variables, described by
a11 x1 + a12 x2 + · · · + a1n xn = b1 (4.2)
a21 x1 + a22 x2 + · · · + a2n xn = b2 (4.3)
am1 x1 + am2 x2 + · · · + amn xn = bm (4.4)
that can be written as
∑∑= =
=m
i
n
jijij bxa
1 1
, i = 1, 2, · · ·, m (4.5)
xj = 0, j = 1, 2, · · ·, n (4.6)
Note that both the objective function and the constraint equations are linear functions of xj,
which means that there is also another field for non-linear programming, dealing with the
solution of non-linear problems, outside the scope of this work.
When Equations 4.2 to 4.5 result in an inequality (? aij xj = or = bi) they can be converted
into an equality by introducing slack or surplus variables ym into the equations, representing the
excess or difference between both sides of the equation.

83
The main difficulty for linear programming lies in setting up the model in a clear set of
mathematical expressions. Optimization problems most often are stated verbally. The solution
procedure is to model the problem with a mathematical program and then solve the program with
linear programming techniques. [Bro97] recommends the following approach for transforming a
word problem into a mathematical program:
Step 1. Determine the quantity to be optimized and express it as a mathematical function (define
input variables).
Step 2. Identify all stipulated requirements, restrictions and limitation, and express them
mathematically (define constraints).
Step 3. Express any hidden conditions not explicitly stipulated in the problem but apparent from
the physical situation being modeled.
A common optimization problem using linear programming is often stated as
∑=
=n
jjj xcz
1
max given ∑∑= =
=m
i
n
jijij bxa
1 1
constraints, where xj = 0.
Each one of the constraint equations can be plotted in a graph defining an individual
solution space, so the set of constraints reduces to solving the problem in a feasible solution
space, bound by the constraint limits. Solutions can be found graphically and numerically
4.3.2 Break-even Economic Evaluations Often at the planning stage, early in a project, multiple alternatives with multiple futures
are projected. In telecommunication networks this usually means evaluating different tr affic
conditions for multiple network size scenarios. Each of the financial sources will lend or invest
money based on the anticipated sales of the service and will use a varying interest rate based on
the anticipated demand for the service.
If the service demand is anticipated to be high the interest rate will be lower than when,
anticipated demand, is low; thus the evaluation and presentation of these alternatives is of great
importance for the network planner [Bla98].
Break-even analysis is an evaluation technique useful in relating fixed and variable costs to
any measured operational activity, and it may be graphical or mathematical in nature. The
break-even point is of primary interest since it identifies the range of the decision variable within
which the most desirable economic outcome may occur. When the cost of two or more

84
variables is a function of the same variable, it is usually useful to find the value for which the
alternatives incur equal cost.
There are mainly two concepts of break-even analysis performed in this dissertation, based
mainly on the perception of profits over the network’s lifetime with regards to interest rate.
1) The most common type of break-even analysis is performed considering current
interest rates from financial entities (e.g. banks), usually between 6 % and 10 % as a
yearly interest rate. This way, the break-even point for the return of investment will
probably happen somewhere around the half way point of the expected lifetime. This
means all capital and operational expenses so far have been recovered and any revenue
beyond this point will be a source of profit. This is the most common type of break-
even analysis; it is simple and allows a quick view into an investment’s future.
2) The second type of break-even analysis is performed considering a very high interest
rate, usually between 15 % to 25 % yearly interest rate, and designing for a break-even
point at the end of the network’s lifetime. This way, by the time the break-even point is
reached, the return on investment will have recovered all capital and operational
expenses and provided a constant revenue with expected profits already included. This
is not a common type of break-even analysis, although it is also simple and guarantees
the financial sources a solid return of investment in the future.
The economic models included in this research can present either type of break-even
analysis, depending upon the economic risk involved and expected return of investment.
4.3.3 Optimizing Parameters for Minima and Maxima Optimization is the process of seeking the best value on a decision variable. Since the
decision variables are part of a larger mathematical equation, the optimal points can be found by
means of calculus-based methods. The slope of a function y = f(x) is defined as the rate of
change of the dependant variable y divided by the rate of change of the independent variable x.
If a positive change in x results in a positive change in y, the slope is positive. On the other hand,
if a positive change in x results in a negative change in y then the slope is negative. If y = f(x)
defines a straight line, the rate of change of y with respect to x is the slope of the straight line, so
this slope is constant for all points on the straight line, that is, ?y/?x = constant.
For a nonlinear function the rate of change of y with respect to changes in x is not constant,
but changes with changes in x, so the slope must be evaluated at each point on the curve.

85
Differential calculus allows successive approximations for the slope at the tangent line of the
nonlinear function. In classical optimization, the slope is the instantaneous rate of change that is
sought [Bla98], obtained with the first derivative:
0)(
== oxxdx
xdf (4.7)
If the first derivative of f(xo) equals zero it may imply either an optimum point or a point of
inflection at xo. To be certain about an optimum point it is necessary that the second derivative
at xo be positive or negative: xo being a minimum if the second derivative is positive and a
maximum if the second derivative is negative. If the second derivative is also zero, a higher
order derivative is sought until the first nonzero one is found at the nth derivative as
0)( =
= oxxn
n
dxxfd (4.8)
If n is odd, the xo is a point of inflection. If n is even and if
0)( <
= oxxn
n
dxxfd (4.9)
then xo is a local maximum. But if
0)( >
= oxxn
n
dxxfd (4.10)
then xo is a local minimum.
4.3.4 Constrained and Unconstrained Optimization The design of complex systems that are optimum in some sense is an important challenge
for the systems engineer, seeking optimum values of design variables. The specific mathematical
methods used vary in degree of complexity and depend on the system under study, which may
show constrained or unconstrained behavior in some of its parameters.
In a linear program an optimum solution may be determined geometrically by locating the
extreme points in a feasible region. In a nonlinear program, even with linear constraints, the
optimum solution can occur inside, at the extreme point or on the boundary of a feasible region,
and neither case can be considered as an extreme point.

86
There are several economic decision situations in systems design when two or more cost
factors are affected differently by common design variables. Certain parameters may vary
directly with an increase in a variable while others may vary inversely. When the total cost of an
alternative is a function of increasing and decreasing cost components, a value may exist for the
common variable, or variables, which may result in a minimum cost for the alternative. This is
called unconstrained optimization theory, and there are several algorithms and optimization
methods that help solve this type of problems [Wu84], [Bro97], [Bla98]. That theory is out of
the scope of this work.
4.3.5 Evaluation Involving Optimization and Multiple Criteria Optimization is not an end in itself, it only allows to compare mutually exclusive
alternatives into a preferable (optimal) solution, which must lie inside the feasibility region.
Usually there is no need to continue improving the design if the dominant criterion is met.
When multiple criteria are present in a decision situation, neither technical nor economic
(financial) optimization is enough. Although they are necessary, the optimum design must be
extended to include extra information about the degree to which each alternative meets or
exceeds the specific criteria.
If possible, a new parameter must be found which allows the previous criteria to be
compared against allowing the systems designer to decide which alternative is more convenient
for the design. If that is not possible (or very difficult), then a number of subjective ratings may
be established for each alternative and compared, and the alternative with the best ratings can be
negotiated as the best possible choice. Although not an elegant solution, it can be presented to
the decision takers in order to take definitive action.
4.4 Economic Models for Satellite Network Design This section discusses the typical requirements for the different satellite network economic
models, along with the mathematical equations that help define the economic impact of different
satellite technologies, network topologies and multiple access techniques in the network’s overall
economic performance.
87
4.4.1 Evaluation Techniques The evaluation of network performance involves a great deal of information analysis. The
techniques used in this work allow network planners and designers to evaluate the different
technological and economic options that each case provides. A set of analytical models was
developed in order to provide both mathematical and graphical performance indicators that allow
performance evaluation. Although certain evaluation techniques allow some freedom to
interpret the network’s technical and economic performance, the final criteria for decision
making will depend ultimately on the planner’s previous experience, the network’s constraints
and the financial sources’ expected profits analysis. That is to say there are no absolute
evaluation technique; each situation is taken independently from others and evaluations are often
performed based upon subjective analyses
4.4.2 Satellite Networking Economic Analysis A satellite network, just like any other business providing communicati on services,
requires a heavy initial investment and a long operational time in order to recover the initial and
operational expenses by selling service to its users and subscribers, like any other business. In
the specific case of satellite rural telephony, there are a few assumptions that must be made when
planning a network since rural users and their economic and demographic environment are not
the same as urban users. Some of the assumptions to be considered in this work are explained
next.
• Traffic. To begin with, if a satellite telephone network needs to be implemented in a rural
community, it is safe to assume there is none available there yet, so it is very difficult to
come up with a precise estimate of expected traffic. A low expected traffic per terminal is a
safe choice, in this case from 3 to 10 call-minutes per hour and only one call per hour
(T=0.05 to 0.167 Erlang), hoping the demand will increase over the system’s lifetime. At
this point and for the sake of design feasibility only, an average traffic figure will be applied
to all earth stations on the network, and all earth stations will be assumed to generate a
uniform distribution of traffic throughout the network’s lifetime.
• Topology. It may be a good idea to assume that most telephone calls to and from the remote
villages will be connected to the PSTN, so a star topology is recommended, accepting that

88
there will be double hops in calls between remote villages, which seriously affects the quality
of service (QoS).
• Application. Since the main objective is to provide telecommunications service to remote
villages that currently have no service, the problem of what type of services arises during the
network planning stage. Once again we can safely assume that voice traffic will be the mos t
required service over data or video transmission or Internet access. The reason is simple: the
source for voice communications requires only the user’s mouth, which is integrated on all
potential users, while data and video services require an extra component, a computer or a
camera and monitor. Still, provisions can be made for not just voice, but also general digital
access to the remote terminal in case data transmissions need to be sent or received.
• Symmetry. In any digital network it is important to define the link traffic symmetry, which
means how much information is sent in one direction with respect to the amount of
information coming the other way. In data applications such as interactive transactions or
Internet access, there is usually a high degree of asymmetry since a small data request
generates large amounts of information in return. That is not the case in telephony, where
one can safely assume that the amount of information in each direction is equal, thus
generating symmetric traffic.
4.4.2.1 Earth Station Segment Costs
The terrestrial segment is probably the most expensive part of a satellite network with a
large number of terminals, since it requires a large capital investment plus a maintenance fee
over the system’s lifetime, which add up to more than half the expenses generated by the
network. Both parts of the earth station segment (remote terminals and hub) are expensive, and
their unit cost depends directly on the total number of nodes in the network. The larger the
network size is, the lower the unit cost for each remote terminal, but then there is a larger cost for
the overall network and the hub. On the other hand, the remote earth stations will be generating
revenue, so theoretically a large network would not only generate large expenses but also large
revenue.
According to their topology, satellite networks can be either centralized (star) or distributed
(meshed), which helps define several Quality of Service parameters and also influences the
capital and operational costs of the network. All centralized networks require a central (or

89
master) node that controls the network’s internal operation, usage, maintenance, billing and
access to other networks. It also updates any changes in the network such as adding/deleting
new/old nodes, keeps statistics on individual and multiple traffic and keeps track of each node’s
behavior and operation at all times. A central node must be very reliable since it is a single
point of failure and that could be catastrophic for the whole network. This means the central
node is usually a complex part of the network; it must include redundant elements and a very
complete, large and expensive Network Management System (NMS), a long and complex
software program. For those reasons a star satellite network must use an intelligent central node,
known as a Master Earth Station (MES) or hub. The cost of a hub is directly proportional to the
total network size and multiple access to the satellite, either fixed or by demand, and may cost
from $100,000 for 100 nodes to more than $2 Million for more than 2,000 nodes [Mar95]. A
hub station usually includes a large parabolic antenna (3.5 m to 10 m) and powerful transmitters
(20W to 1 kW) depending upon network size and multiple access, thus the large hub cost.
Smaller networks usually lease space on another hub, thus avoiding this expense and only paying
an extra fee for the service.
Remote Earth Stations (RES) used on satellite rural telephony act as the remote network
nodes and usually involve small terminals, depending upon the system being used. Some Low
Earth Orbit (LEO) satellite systems such as the failed Iridium or Globalstar systems required
portable handsets or public phone booths with omnidirectional antennas that could be used for
rural telephony. These systems were priced between $1,500 and $3,000 for the portable terminal
[Joh95]. VSAT systems like those offered by Gilat or HNS used for rural telephony consist of a
0.8 m to 2.4 m parabolic dish antenna, an RF out door unit (ODU) a small in-door unit (IDU) and
equipment rack, and their cost varies from $5,000 to $10,000 [Mar95], [Com99]. Early 1980’s
VISTA Intelsat earth stations for rural telephony used larger 3 to 5 m antennas and were priced
at tens of thousands of dollars each.
More complex earth station technology allows the use of better voice coding and
compression techniques so more users can be time -multiplexed (TDM) into a single RF channel
onboard the satellite. This sounds like an attractive market for medium to large size communities
with low traffic, as described by [Alb93], but [Com99] explains how the more complex (and
expensive) earth stations only increase the overall network capital cost while providing very little
increase in revenue due to the low traffic density. [Com9 9] further explains how the

90
manufacturing companies have decreased the volume of those products, aiming instead at the
more lucrative one- to two-user terminals, where they allege the bulk of the satellite rural
telephony market is found.
4.4.2.2 Space Segment Costs
The space segment costs are directly related to the transponder portion required to provide
capacity to all earth stations, depending upon the network size, multiple access and topology
involved, and are charged either on a monthly or yearly basis. It is a constant source of expense
that has not seemed to go down in price over the years, but which will is essential for the service
providers to provide telephone service and generate revenue [Mar95], [Joh00]. Transponder
cost is directly related to the bandwidth or power requirements from the transponder, both of
which are limited, so the satellite operator will charge for the relative transponder power or
bandwidth used, whichever has the higher value.
( )TpTotal
qB Costn
B
BCost ×= Re (4.11)
( )TpTotal
qP Costn
P
PCost ×= Re (4.12)
Where n is the number of satellite carriers in the network, BReq and PReq are the earth
station’s required bandwidth and power from the transponder respectively, and BTotal and PTotal
are the transponder’s total bandwidth and power.
Since multiple access protocols allow a more efficient use of the channel resource, in this
case the satellite channel, they are directly related to the space segment costs. A fixed demand
multiple access network will probably pay more for the space segment than a demand
assignment equivalent network, since more capacity will be allocated to it. On the other hand,
more satellite capacity could allow more revenue, which is traffic dependent, so again it is the
traffic parameter that will help decide which multiple access protocol is more appropriate for a
specific network.

91
FDMA and Fixed-SCPC must pay for the total number of satellite channels assigned to the
satellite network, so they are not bandwidth efficient. Since FDMA and SCPC use independent
carriers for each channel, a guard band is used to separate adjacent channels and reduce
interference among them, thus reducing even more transponder capacity. FDMA and SCPC also
require the transponder’s power amplifiers to operate into their linear or slightly non-linear
region in order to avoid inter-modulation products, which also limits power capacity. It is
generally assumed that large networks using FDMA and SCPC render the transponder power-
limited rather than bandwidth-limited, so they are charged by the relative power usage.
Demand assignment networks require less satellite capacity since not all network nodes
have an assigned channel, so satellite usage costs are lower than fixed demand costs. On the
other hand, there are fewer terminals generating revenue so earnings are more limited. One basic
reason for which demand assignment is widely used is due to its more efficient use of the
channel at all times, provided good traffic analysis was done at the design stage.
4.4.2.3 Networking Costs
Networking costs are those cost associated with interconnecting the new network (in this
case the satellite network) to the PSTN. Since the PSTN “sees” the sate llite network as a private
network, it charges interconnecting fees for each user circuit by unit time, generally per minute.
These fees are usually considered low (between $0.03 and $0.05 US) when first learned of, but
when added up and multiplied for the number of call minutes per year per number of earth
stations, networking costs become a really important part of the overall network operational
expenses. Since the user must pay these charges anyway, a low interconnection fee would save
them a large amount of money over time, although that is a parameter set up by the PSTN
operating company usually under government regulations.
A licensing fee is usually required during the network licensing process from the
government regulators in order to process the application. It may be charged as one total fee for
the overall network, or as the sum of the individual remote terminal fees plus the hub.
Another type of yearly fee may be required from the satellite operator just to continue
renewing the lease, paid at the beginning of the year to guarantee satellite service. It is not
related to the actual transponder usage. It may again be a single fee for the whole network, or a
single fee per site.

92
4.4.3 Satellite Networking Economic Models A typical network evaluation must include all the parameters discussed above, which
include costs as well as revenue, so the interested parties (design engineers and economic
planners) must work together to present investors a business plan in a clear and detailed way.
This should be done following a technical-economic model that takes into consideration all the
above issues, specifying the technical and economic parameters of the terrestrial segment, the
space segment and the networking segment. The revenue projections must be included in order
to compare expenses and revenues and find a break-even point where profits are made at some
point in the network’s lifetime, while still charging the users a low per-minute-call user tariff.
In order to implement the economic model it is important already to have initial market
research results, which will be requested before any large amount of money is committed to the
project. Assuming the marketing research is well performed, there will be enough information
to determine market segmentation, potential service packages and pricing options required by the
different market segments. It is important to understand the market, and its potential use (or
lack of use) of the satellite network since this presents a high economic risk.
The satellite communications business may be at risk not only due to wrong traffic
analysis, expensive service or bad management, but also to bad Quality of Service, bad network
or earth station design, and even sloppy equipment installation or maintenance [Mar95]. If the
business plan is inaccurate it may take several years longer (or maybe never!) to reach the
breakeven point, which leads to unpleasant situations for both economic planners and
engineering designers [Eva99].
Robertazzi defines network planning as “the orderly and efficient deployment and
management of communications facilities over time” [Rob99] different to simple network
management. Probably all major economic decisions regarding telecommunication systems
planning are based on economic considerations that analyze the economic behavior of the
network over its projected lifetime. Some important economic tools to analyze and quantify the
changing value of money over time are described in [Sep84] and [Bla98], with an emphasis on
communications networks by [Rob99].
These tools allow the analysis of proposed capital investments over time regarding the
present value (P), future value (F) and single amount payment series or annuities (A). All these
parameters have formulas that help explain the changing value of money at a certain interest rate
93
(i) over a certain number (t) of interest periods of time. Table 4.4 shows the summary of interest
formulas, taken from [Bla98].
Table 4.4. Summary of interest formulas, from [Bla98]
Formula name Function Formula Designation
Single-payment compound formula
Given P, Find F ( )tiPF += 1 F = P (F/P, i, t)
Single-payment present amount
Given F, Find P
( )
+= ti
FP1
1 P = F (P/F, i, t)
Equal-payment present amount
Given A, Find F ( )
−+=ii
AFt 11
F = A (F/A, i, t)
Equal-payment-series sinking fund
Given F, Find A
( )
−+=
11 tii
FA A = F (A/F, i, t)
Equal-payment-series present amount
Given A, Find P ( )( )
+−+= t
t
iii
AP1
11 P = A (P/A, i, t)
Equal-payment-series capital recovery
Given P, Find A ( )( )
−++
=11
1t
t
i
iiPA
A = P (A/P, i, t)
One of the simplest ways to find the monetary value of an investment over time is to
assume initial and expected periodic expenses and revenue over a number of years in the future,
and bring back those amounts to present value (P) at a certain interest rate. That way the
economic planners and investors can take calculated investment decisions.
Next a typical evaluation model for a star topology, Ku-band, 64 kbps per channel, VSAT
network for telephone applications will be presented, as evaluated for Fixed-SCPC multiple
access. All models from Sections 4.4.3.1 to 4.4.3.5 follow the same sequence but require the set
of equations applicable to each case. Table 4.5 shows the terminology used in this analysis.

94
Table 4.5. Glossary of economic network analysis terms
VSAT parameters Hub parameters Network parameters V1 VSAT capital cost H1 Hub capital cost N No. network nodes V2 VSAT variable cost H2 Hub variable cost n No. RF satellite carriers TV VSAT total cost TH Hub total cost t Time period CV VSAT unit cost CH Hub unit cost i Interest rate LV VSAT lease cost/unit LH Hub lease cost Lt Total lifetime period
MV VSAT maintenance cost MH Hub maintenance cost COT Total capital cost IV VSAT installation cost IH Hub installation cost RE Total lifetime revenue
FV VSAT licensing fee FH Hub licensing fee PR Total lifetime profits SV VSAT satellite cost SH Hub satellite cost TS Exp. user satellite traffic AV VSAT PSTN access fee AH Hub PSTN access fee OT Operational time (min/yr) NV VSAT networking cost NH Hub networking cost OD Operational day (hr/day)
r TDM user channels g Mesh gateways or hubs CU User cost ($/min)
4.4.3.1 Fixed-SCPC
In this model, the Fixed SCPC satellite network follows the distribution of a star topology
with all VSATs transmitting on a pre-assigned frequency and accessing the PSTN through a hub
earth station, as shown in Figure 4.3.
Figure 4.3. Fixed SCPC satellite network to be simulated
PSTN
Hub
VSAT 1
VSAT 2
VSAT 3 VSAT 4
VSAT N
f 1 f 2 f 3 f 4 f N
f 1
f 2
f 3 f 4 f N
Permanently assigned frequency channels
95
Terrestrial Segment Cost, Remote Nodes (VSATs).
The VSAT capital costs V1 for a fixed SCPC satellite network at the beginning of its
lifetime are described as
V1 = N (CV + IV + FV) (4.13)
The VSATs variable costs V2 may be considered as a number of equal payment series
present amount (obtained for present value P given A, table 4.4) over a period of time of t years
are described by Equation (4.14), where V2 is the total amount A, as follows.
V2 = A = N [LV + MV + SV + (AV × OT)] (4.14)
Since P = V2(P/A , i, t) according to Table 4.4, we have that the present value of the
variable VSAT costs over t years is obtained as
P = N [LV + MV + SV + (AV × OT)] (P/A, i, t) (4.15)
It is easy to see that the single most important component in the cost parameters shown
from (4.13) to (4.15) is N, the total number of VSAT network nodes, which controls the cost of
all other parameters. That is the reason why it has previously been esta blished as the main
contribution to network costs.
The total present value cost for the remote VSAT terminals is the sum of both terms V1 and
V2 over the system’s lifetime and is termed TV, expressed by
∑=
+=Lt
t
VVTV1
21 (4.16)
( ) ( )[ ]( )tiAPOTAVSVMVLVNFVIVCVNTV
Lt
T
,,1
∑=
×++++++= (4.17)
Terrestrial Segment Cost, Centralized Node (Hub).
The Hub capital costs H1 for the same fixed SCPC satellite network at the beginning of its
lifetime are also described as
H1 = CH + IH + FH (4.18)
while the variable costs H2 (also obtained for present value) over the same period of time
of t years are described by
H2 = A = LH + MH + SH + (AH × OT) (4.19)
In this specific example, the outbound link from the hub to the VSATs may be configured
as an identical number of fixed SCPC channels on board the satellite, or it may take another
form, such as Time Division Multiplex (TDM). This would require a diffe rent analysis for

96
occupied bandwidth, thus having a different satellite cost. We keep the same fixed SCPC bi -
directional arrangement for ease of explanation.
Taking again the Present Value formula from Table 4.4, we have that the hub variable costs
over time can be found as
P = [LH + MH + SH + (AH × OT)] (P/A, i, t) (4.20)
Again, the total present value of cost for the hub is the sum of H1 and H2 as
∑=
+=Lt
t
HHTH1
21 (4.21)
( )[ ]( )tiAPOTAHSHMHLHFHIHCHTH
Lt
T
,,1
∑=
×++++++= (4.22)
Networking Costs
The networking costs have already been included in Equations (4.14) and (4.19) as the
product of the total network nodes with the PSTN access fee multiplied by the channel’s
operational time at both the VSAT and hub sites as
( )[ ]∑=
×=Lt
t
tiAPOTAVNNV
1
,, (4.23)
and
( )[ ]∑=
×=Lt
t
tiAPOTAHNNH
1
,, (4.24)
terms in each case. Here can be seen again the importance of the network size N, as
mentioned before, but there is another term just as important; the AV and AH charge demanded
to access the PSTN, or the network access tariff. What these terms show is that the PSTN tariff
is as important as the other terms regarding networking costs, and a high or low tariff has a large
impact on the overall networking costs. This is often a hidden cost, not obvious at first analysis.
Another potentially large cost may be the long distance cost inside the PSTN. When a
remote user calls from the remote VSAT terminal through the satellite link, he or she is only
charged the cost of the satellite link and the PSTN access fee, but that is assuming the call will
end in the PSTN local area. If the call must be routed to another city or region there will be an
extra charge, a PSTN long distance charge, thus increasing the cost of the call. This happens
mostly in star topology networks, but it may also be present in mesh networks if the number of
PSTN gateways is small. Since this case would require not only a different traffic intensity
97
analysis (long distance into the PSTN) with different, often distance and time related tariffs, it is
considered outside the scope of this work.
Revenue Calculation
The calculation of revenue is one of the most important analyses in the planning of a
communications network, as in any other business. As mentioned before, revenue is directly
dependent upon expected traffic intensity and it may be considered as a series amount of
earnings over the network’s lifetime. Traffic figures help define the expected amount of usage
time that each earth station will serve, which is the time the terminal will also be generating
revenue.
Therefore the estimate of network traffic intensity is probably the major assignment in
network planning and design, which could make or break hopes in the business plan. Traffic will
define the earth station’s Operating Time (OT), which is the number of minutes in a year that the
earth station is expected to be operational.
Nevertheless, a telephone terminal will not be operational 24 hr/day (525,600 min/yr), so a
reasonable number of hours should be found when the terminal would be available to the users.
For a rural telephone terminal, it would usually be placed at some common access facility and a
common usage time could be a typical establishment’s working hours, e.g. between 8:00 AM
and 10:00 PM, which is 14 hours a day. A typical Available Time (AT) for this example would
be obtained as
AT = (365day/yr) × (14 hr/day) × (60 min/hr) = 306,000 min/yr.
Now, the Operational Time (OT) must be found, that is, how many of those minutes will
actually be carrying a conversation, according to traffic intensity TS = ?/µ, where 1/ ? is idle time
between calls and 1/µ is average holding time. For a traffic of 0.05 Erlang (3 min/hr) OT is
OT = TS × AT (4.25)
OT = (0.05 Erlang) × (306,600 min/yr) = 15,330 call-minutes/yr
Traffic intensity estimation is a difficult task by itself since it involves evaluating multiple
user behaviors for a large network, and coming up with a single (average) figure when every user
has a different one. The impact of traffic estimation on revenue is important because it is the
single term in the revenue equation that is based solely on statistical assumptions.
98
Revenue is calculated by obtaining the average OT of each network node (VSAT terminal)
and charging the user per-minute-tariff (user cost, CU) to each one of them, and then multiplying
that value by the total number of operational nodes as
RE = N (OT × CU) (4.26)
Again, considering the revenue as a yearly series amount, its present value earnings over
the network’s entire lifetime can be obtained as
( )[ ]∑=
×=Lt
t
tiAPCUOTNRE
1
,, (4.27)
A last, but still very important parameter, is the call-minute user cost, or user tariff. This is
the amount of money charged to the user for each minute that he or she uses the network, and it
is very difficult to quantify, since it depends upon the economic planners’ break-even
expectations.
Pricing a service is a difficult task, since the planner is at the hands of the market supply-
and-demand variations. A tariff too high will theoretically create large revenue, but an
expensive service may stop users from using it, thus lowering traffic intensity and revenue. A
tariff too low may be attractive, thus increasing traffic intensity and revenue, but it may take
longer (or never) to recover the investment. It will be shown how small variations in traffic
intensity and/or user tariffs estimates create very large variations in other system parameters.
Sudden variations like these can change completely the outlook of the business plan and the
viability of the network.
Network Economic Evaluation Model
Up until now the description of the elements that constitute a satellite communications
network has been presented from a mainly technical point of view, considering their impact on
network economic planning.
A complete network evaluation model should include all economic parameters mentioned
so far, therefore, the total satellite network cost model should include the terms found in (4.16)
for VSAT costs, (4.21) for Hub costs and (4.27) for revenues. Networking costs are already
included in (4.16) and (4.21). The economic network evaluation model would then be based
upon the expected profits (PR), in this case,
Profit = Revenue – Costs (4.28)
PR = RE – TV – TH (4.29)

99
+−
+−= ∑∑==
Lt
T
Lt
T
HHVVREPR11
2121 (4.30)
( )[ ]( ) ( )[ ]( )
( )[ ]( )
×++++++−
×++++++−
×=
∑
∑
∑
=
=
=
tiAPOTAHSHMHLHNFHIHCH
tiAPOTAVSVMVLVNFVIVCVN
tiAPCUOTNPR
Lt
T
Lt
T
Lt
t
,,
,,
,,
1
1
1
(4.31)
Notes:
1. It is important to mention that often small satellite networks (<50 nodes) lease hub capacity
and connectivity on a larger existing hub from a different network, since owning a hub
implies a major capital investment which may not be economically justi fied for a small
network. For that reason a term is included in both equations (9) and (13) as variable
expenses in case either segment is not owned.
2. The PSTN access fee (AV, AH) needs to be paid only once since it is the accessing point to
the PSTN and that only takes place at the hub, so the VSAT proportional cost may be
specified as AV = $0.
3. Traffic intensity estimation (TS) is application-dependent, will be different for each earth
station in a real network, and will vary from network to network. A common way to go
around the specifics is to find a conservative traffic intensity figure from previous similar
experiences, and assume a uniform distribution of traffic at all network nodes.
Fixed SCPC networks have the same number of nodes and satellite channels, therefore any
earth station with a low usage time will actually be generating expenses instead of revenue,
which is not a good idea when planning a telecommunications network.
Table 2.5 shows in a succinct way the mathematical equations (4.13) to (4.31) developed in
this research for the Fixed-SCPC economic model.

100
Table 4.6. Fixed-SCPC satellite network economic model.
Remote nodes (VSATs) Hub Networking
Initial cost V1 = N (CV + IV + FV) H1 = CH + IH + FH ( )[ ]∑=
×=Lt
t
tiAPOTAVNNV
1
,,
Operational cost
V2 = N [LV + MV + SV + (AV × OT)]
H2 = LH + MH + N[SH + (AH×OT)]
( )[ ]∑=
×=Lt
t
tiAPOTAHNNH
1
,,
Total cost ∑=
+=Lt
t
VVTV1
21 ∑=
+=Lt
t
HHTH1
21 OT = TS × AT
VSATs cost ( ) ( )][ ]{ }( )tiA
POTAVSVMVLVNFVIVCVNTVLt
T
,,1
∑=
×++++++=
Hub cost ( ){ }[ ]( )tiAPOTAHSHNMHLHFHIHCHTH
Lt
T
,,1
∑=
×++++++=
Revenue ( )[ ]∑=
×=Lt
t
tiAPCUOTNRE
1
,,
Profits ( )[ ]
( ) ( )[ ]( )
( ){ }[ ]( )
×++++++−
×++++++−
×=
∑
∑
∑
=
=
=
tiAPOTAHSHNMHLHFHIHCH
tiAPOTAVSVMVLVNFVIVCVN
tiAPCUOTNPR
Lt
T
Lt
T
Lt
t
,,
,,
,,
1
1
1
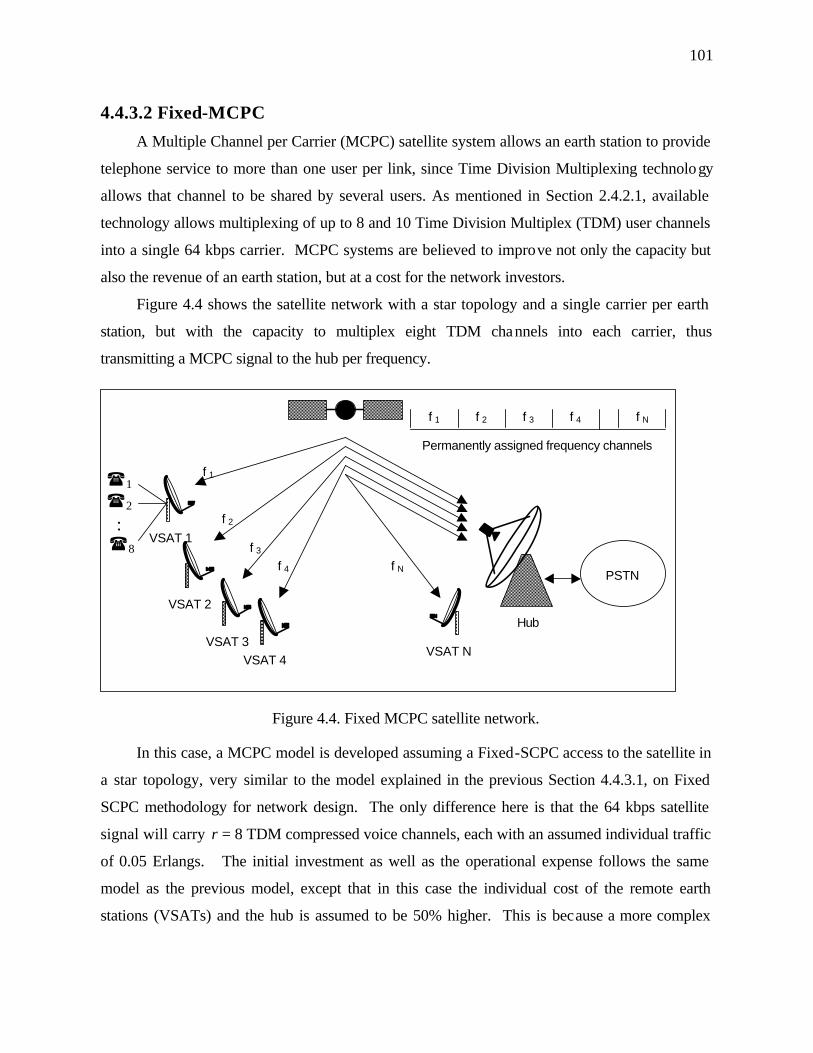
101
4.4.3.2 Fixed-MCPC
A Multiple Channel per Carrier (MCPC) satellite system allows an earth station to provide
telephone service to more than one user per link, since Time Division Multiplexing technology
allows that channel to be shared by several users. As mentioned in Section 2.4.2.1, available
technology allows multiplexing of up to 8 and 10 Time Division Multiplex (TDM) user channels
into a single 64 kbps carrier. MCPC systems are believed to improve not only the capacity but
also the revenue of an earth station, but at a cost for the network investors.
Figure 4.4 shows the satellite network with a star topology and a single carrier per earth
station, but with the capacity to multiplex eight TDM channels into each carrier, thus
transmitting a MCPC signal to the hub per frequency.
Figure 4.4. Fixed MCPC satellite network.
In this case, a MCPC model is developed assuming a Fixed-SCPC access to the satellite in
a star topology, very similar to the model explained in the previous Section 4.4.3.1, on Fixed
SCPC methodology for network design. The only difference here is that the 64 kbps satellite
signal will carry r = 8 TDM compressed voice channels, each with an assumed individual traffic
of 0.05 Erlangs. The initial investment as well as the operational expense follows the same
model as the previous model, except that in this case the individual cost of the remote earth
stations (VSATs) and the hub is assumed to be 50% higher. This is because a more complex
PSTN
Hub
VSAT 1
VSAT 2
VSAT 3 VSAT 4
VSAT N
f 1 f 2 f 3 f 4 f N
f 1
f 2
f 3 f 4 f N
Permanently assigned frequency channels
(1
(2 :
(8

102
user interface is supplied with each earth station, with a number of telephone sets, voice coders
and TDM capabilities per terminal that increase the VSATs and hub cost.
A MCPC system will continue to use (and pay for) a single satellite carrier for up to eight
voice channels, thus saving transponder bandwidth, but requiring more power from both the
earth station and the satellite and perhaps larger antennas. The maintenance expenses are
assumed the same as in other configurations. The PSTN access fee will be charged according to
the number of voice channels actually accessing the network, not by the number of satellite
carriers. Therefore the cost for PSTN access is larger than in other configurations, but the
expected revenue is also proportional to the number of voice channels.
As mentioned before, a Fixed-MCPC system may be attractive only if medium to high
traffic is expected on the network, otherwise the larger initial investment will create a heavy
burden on expected profits. Let’s not forget that an MCPC earth station costs more than a simple
earth station, and only one voice channel is necessary to pay for the full transponder channel. In
a low traffic network a single user in the carrier would pay for the whole channel, w hich would
increase the user cost lowering traffic even more and investors would never recover the initial
investment. For that reason, an MCPC-DAMA system is not even considered in this work.
Still for PSTN access and revenue intent a user traffic probability must be found to define
the economic model. Assuming an expected traffic of 0.05 Erlang per user in an eight -channel
TDM terminal, the number of possible simultaneous calls following a binomial distribution,
leads to a probability pr(1) = 0.2793 for at least one user using the satellite channel and pr(2) =
0.0514 or less for r = 2 users. This work considers TSuser = 0.05 Erlang for each ri user in this
model to obtain operational time (OT).
Table 4.7 shows the mathematical equations developed in this research for the Fixed-
MCPC satellite network model. The sequence to implement the Fixed MCPC economic model
is the same as that presented in Section 4.4.3.1 for the Fixed-SCPC model; only the equations
vary.

103
Table 4.7. Fixed-MCPC satellite network economic model.
Remote nodes (VSATs) Hub Networking
Initial cost V1 = N (CV + IV + FV) H1 = CH + IH + FH ( )[ ]∑=
××=Lt
t
tiAPOTAVrNNV
1
,,
Operational cost
V2 = N [LV + MV + SV + (r × AV × OT)]
H2 = LH + MH + N [SH + (r × AH×OT)]
( )[ ]∑=
××=Lt
t
tiAPOTAHrNH
1
,,
Total cost ∑=
+=Lt
t
VVTV1
21 ∑=
+=Lt
t
HHTH1
21 OT = r × TSuser × AT
VSATs cost ( ) ( )[ ]{ }( )tiA
POTAVrSVMVLVNFVIVCVNTVLt
T
,,1
∑=
××++++++=
Hub cost ( ){ }[ ]( )tiAPOTAHrSHNMHLHFHIHCHTH
Lt
T
,,1
∑=
××++++++=
Revenue ( )[ ]∑=
××=Lt
t
tiAPCUOTrNRE
1
,,
Profits ( )[ ]
( ) ( )[ ]( )
( ){ }[ ]( )
××++++++−
××++++++−
××=
∑
∑
∑
=
=
=
tiAPOTAHrSHNMHLHFHIHCH
tiAPOTAVrSVMVLVNFVIVCVN
tiAPCUOTrNPR
Lt
T
Lt
T
Lt
t
,,
,,
,,
1
1
1
4.4.3.3 SCPC-DAMA
As mentioned in Section 2.4.2.1 describing topologies, Single Channel per Carrier (SCPC)
is probably the most popular multiple access protocol for rural satellite applications. When
SCPC is joined by an efficient demand assignment protocol such as Demand Assignment
Multiple Access (DAMA), the network’s efficiency increases by carefully controlling the access
to the channels. SCPC-DAMA has become the multiple access technique of choice in satellite
rural telephony applications due to its ease of implementation and the efficient use of the satellite
channel.

104
Here both earth stations are assigned a narrowband channel onboard the satellite during the
length of the call, from a limited pool of n channels, and when the communication session is
over, both earth stations release their channels. Since the Erlang B formula helps define the
correct number of n channels for a certain network size of N nodes and a grade of service GoS,
the model considers all three factors to provide the correct network design information.
Figure 4.5 shows how a SCPC DAMA satellite network is connected to the PSTN.
Figure 4.5. SCPC DAMA satellite network
In the SCPC-DAMA case, the initial network cost is still completely influenced by the size
of the network, including operational cost such as licensing and maintenance. The advantage of
SCPC-DAMA over Fixed-assignment SCPC is that only a few earth stations, the active ones, are
using the satellite channels, which lowers the satellite channel cost that idle Fixed-SCPC stations
must pay at all times. Although idle SCPC-DAMA earth stations are not generating revenue,
and still requiring maintenance, the profit from a SCPC-DAMA network depends largely on the
generated traffic. A high traffic SCPC-DAMA network may be very profitable if properly
dimensioned and correctly designed, even under low or medium traffic intensity.
In all cases throughout this research work a Grade of Service figure of 1% to 2% has been
observed, with a tendency to recommend the number of trunks or satellite channels closest to the
2% figure, for economic reason only. It is assumed that if the GoS worsens from 1.5% to 1.8%
PSTN
Hub
VSAT 1
VSAT 2
VSAT 3 VSAT 4
VSAT N
f 1 f 2 f 3 idle f n
f 1
f 2
idle f 3 f n
Frequency channels assigned on demand
N nodes > n carriers

105
at the cost of one or two carriers, it is still a valid sacrifice of network quality (from one blocked
call in 67 to one in 55).
Table 4.6 shows the mathematical equations developed for the SCPC-DAMA economic
model, where n is the number of satellite carriers and N is the total number of network nodes or
earth stations. This is assuming a star topology with single hop links between the hub and VSAT
only; no VSAT-to-VSAT double hops are considered in this work. The sequence to impleme nt
the SCPC-DAMA economic model is the same as that presented in Section 4.4.3.1 for the Fixed-
SCPC economic model, only the equations vary.
Table 4.8. SCPC-DAMA satellite network economic model.
Remote nodes (VSATs) Hub Networking
Initial cost V1 = N (CV + IV + FV) H1 = CH + IH + FH ( )[ ]∑=
×=Lt
t
tiAPOTAVnNV
1
,,
Operational cost
V2 = N [LV + MV] + n[SV + (AV × OT)]
H2 = LH + MH + n[SH + (AH×OT)]
( )[ ]∑=
×=Lt
t
tiAPOTAHnNH
1
,,
Total cost ∑=
+=Lt
t
VVTV1
21 ∑=
+=Lt
t
HHTH1
21 OT = TS × AT
VSATs cost ( ) ] ( )[[ ]{ }( )tiA
POTAVSVnMVLVNFVIVCVNTVLt
T
,,1
∑=
×++++++=
Hub cost ( )[ ]{ }( )tiAPOTAHSHnMHLHFHIHCHTH
Lt
T
,,1
∑=
×++++++=
Revenue ( )[ ]∑=
×=Lt
t
tiAPCUOTnRE
1
,,
Profits ( )[ ]
( ) [ ] ( )[ ]{ }( )
( )[ ]{ }( )
×++++++−
×++++++−
×=
∑
∑
∑
=
=
=
tiAPOTAHSHnMHLHFHIHCH
tiAPOTAVSVnMVLVNFVIVCVN
tiAPCUOTnPR
Lt
T
Lt
T
Lt
t
,,
,,
,,
1
1
1

106
4.4.3.4 Mesh SCPC-DAMA
The mesh topology allows full point-to-point connectivity, thus transferring information
between any two nodes in a network with minimum delay. In a satellite network with N nodes
the number of required connections is N (N - 1) carriers, or one satellite link to every network
earth station. A full-meshed satellite network with fixed assignment access would imp ly that
there are N (N – 1) transponder channels permanently assigned to this network and that each
earth station has N – 1 transmitters and N – 1 receivers, which is obviously impractical. Besides
being an expensive option regarding satellite channel cost if N is large, it would require a
reallocation of the number of transmitters and receivers at each earth station every time the
network incorporates a new earth station.
The fixed-assignment mesh topology assumes a requirement for permanent full
connectivity by each earth station, which is not the case in most applications. Most of today’s
commercial meshed networks are based on demand assignment SCPC, where any earth station
requests a temporary connection to another earth station through a common signaling channel
and a control earth station. The control earth station replies by allocating satellite resources to
both the calling and the called earth stations. This requires only an arbiter control earth station
and for each earth station node to be equipped with dynamic frequency radios to provide the
assigned transmit and receive frequency pairs.
Most cases in rural telephony do not require a full mesh topology, since villagers are
assumed to call the PSTN more often than one other. The reason a mesh topology is used in
rural networks is mainly due to the use of regional gateways that allow connection of the call to
the PSTN gateway closest to the destination site, reducing long distance costs inside the PSTN.
A properly designed mesh network allows the users to benefit from lower cost calls, but it
requires larger earth stations for gateway operation, called Gateway Earth Stations (GES) or
mini-hubs. Gateways are able to carry a number of simultaneous telephone calls into the PSTN
and meshed gateways can provide reliability to the network in case of gateway or PSTN failure.
A certain number of carriers m (and their corresponding transponder space) may be
assigned to each GES so that each remote earth station can access the PSTN through that specific
gateway over a locally defined pair of carriers. The traffic capacity for each GES is defined by a
traffic analysis depending upon expected traffic routes leading to a number of gateways.

107
A network with N nodes is serviced by n satellite carriers with m carriers per GES managed
by the control earth station. Any GES can take the control function. Assuming a similar
distribution of traffic for each GES, all gateways carry the same number of carriers on demand
and thus generate similar expenses and revenue. Therefore, the total satellite capacity required
(and the number of simultaneous telephone calls over the network) is
n = g × m (4.32)
where n is the number of satellite carriers (and te lephone calls), g is the number of
gateways and m is the number of carriers per gateway.
Figure 4.6. Mesh SCPC DAMA satellite network with g gateways or mini-hubs.
PSTN
Mini-Hub 1
VSAT g1
VSAT g2
VSAT gm
f 1 f 2 f 3 f4 f n
Frequency channels assigned on demand
N nodes > n carriers
VSAT 11
VSAT 12
VSAT 1m
Mini-Hub g

108
Although no prices for GES were available, it is assumed that their cost may be
proportional to their traffic capacity. An estimated cost of $100,000 per mini -hub with a traffic
capacity of 25 voice channels per 100 nodes with a 1.3 % GoS is assumed in this model. Table
4.9 shows the mathematical equations developed here for a mesh SCPC-DAMA economic
model.
The sequence to implement the Mesh SCPC-DAMA economic model is the same as that
presented in Section 4.4.3.1 for the Fixed-SCPC economic model; only the equations vary.
Table 4.9. Mesh SCPC-DAMA satellite network economic model.
Remote nodes (VSATs) Hub Networking
Initial cost V1 = N (CV + IV + FV) H1 = g[CH + IH + FH] ( )[ ]∑=
×=Lt
t
tiAPOTAVnNV
1
,,
Operational cost
V2 = N [LV + MV] + n[SV + (AV × OT)]
H2 = g[LH + MH] + n[SH + (AH×OT)]
( )[ ]∑=
×=Lt
t
tiAPOTAHNH
1
,,
Total cost ∑=
+=Lt
t
VVTV1
21 ∑=
+=Lt
t
HHTH1
21 OT = TS × AT
VSATs cost ( ) ] ( )[[ ]{ }( )tiA
POTAVSVnMVLVNFVIVCVNTVLt
T
,,1
∑=
×++++++=
Hub cost [ ] ( )[ ]( )( )tiAPOTAHSHnMHLHgFHIHCHgTH
Lt
T
,,][1
∑=
×++++++=
Revenue ( )[ ]∑=
×=Lt
t
tiAPCUOTnRE
1
,,
Profits ( )[ ]
( ) [ ] ( )[ ]{ }( )
[ ] [ ] ( )[ ]{ }( )
×++++++−
×++++++−
×=
∑
∑
∑
=
=
=
tiAPOTAHSHnMHLHgFHIHCHg
tiAPOTAVSVnMVLVNFVIVCVN
tiAPCUOTnPR
Lt
T
Lt
T
Lt
t
,,
,,
,,
1
1
1

109
4.4.3.5 OBP Regenerative Satellites
So far the models discussed have dealt with repeater-only (bent-pipe) satellites, which
means that at the satellite the analog waveform is only amplified and translated in frequency for
the downlink. No other function is performed at the transponder. Newer satellites prov ide the
option of signal processing onboard the satellite, increasing the signal’s quality and overall
performance. This research includes the simplest of the processing functions that the new
satellites are including, which is the digital signal’s regene ration.
Onboard Processing (OBP) refers to functions that can be performed on board the satellite
to the information signal, as mentioned in Chapter 3. These functions include demodulation/re -
modulation, error encoding/decoding, transponder or beam interconnection/switching,
demultiplexing/re-multiplexing, packet/frame/cell switching, clock generation/regeneration and
several other possible functions.
Some of the functions mentioned above need to be processed in real time, while others can
be processed in non-real time with onboard storage. Since the goal of the present research is to
provide alternatives for voice (telephone) applications, and since current packet-switching
technology does not provide the required QoS guarantees yet, only an OBP regenera tive satellite
is considered in the economic models. This type of transponder performs demodulation, error
correction and re-modulation functions on the digital signal in a processing transponder.
A regenerative payload performs onboard demodulation of the uplink carriers, then
regenerates the correct bit stream obtained from demodulation and a new carrier modulates the
signal again for downlink. This new carrier is noise-free, so the regenerative payload does not
retransmit the uplink noise on the downlink, improving the overall quality.
[Mar97] reports that a typical regenerative satellite can provide between 2 dB and 5 dB
reduction in overall Eb/No with respect to a transparent repeater satellite assuming the signal is
regenerated onboard the satellite. A satellite with OBP capability essentially separates uplinks
from downliks, having two channels with cascading bit error rates, so the total bit error rate is
Pb = Pu + Pd – 2 Pu Pd ˜ Pu + Pd (4.33)
where Pb is the total BER, Pu is the uplink BER and Pd is the downlink BER.
Several advantages emerge with an improved BER in a satellite network.
1. Smaller earth stations can be used with reduced EIRP and G/T for an equivalent service
quality, reducing the initial cost of a network.
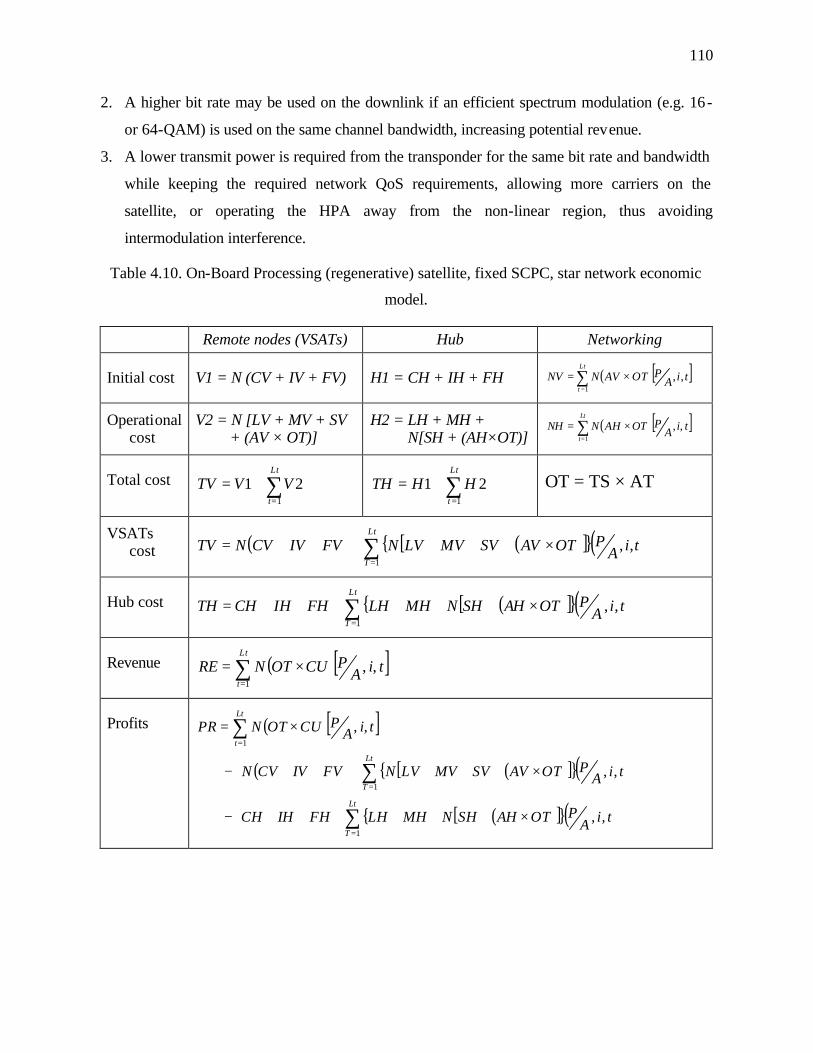
110
2. A higher bit rate may be used on the downlink if an efficient spectrum modulation (e.g. 16-
or 64-QAM) is used on the same channel bandwidth, increasing potential revenue.
3. A lower transmit power is required from the transponder for the same bit rate and bandwidth
while keeping the required network QoS requirements, allowing more carriers on the
satellite, or operating the HPA away from the non-linear region, thus avoiding
intermodulation interference.
Table 4.10. On-Board Processing (regenerative) satellite, fixed SCPC, star network economic
model.
Remote nodes (VSATs) Hub Networking
Initial cost V1 = N (CV + IV + FV) H1 = CH + IH + FH ( )[ ]∑=
×=Lt
t
tiAPOTAVNNV
1
,,
Operational cost
V2 = N [LV + MV + SV + (AV × OT)]
H2 = LH + MH + N[SH + (AH×OT)]
( )[ ]∑=
×=Lt
t
tiAPOTAHNNH
1
,,
Total cost ∑=
+=Lt
t
VVTV1
21 ∑=
+=Lt
t
HHTH1
21 OT = TS × AT
VSATs cost ( ) ( )[ ]{ }( )tiA
POTAVSVMVLVNFVIVCVNTVLt
T
,,1
∑=
×++++++=
Hub cost ( )[ ]{ }( )tiAPOTAHSHNMHLHFHIHCHTH
Lt
T
,,1
∑=
×++++++=
Revenue ( )[ ]∑=
×=Lt
t
tiAPCUOTNRE
1
,,
Profits ( )[ ]
( ) ( )[ ]{ }( )
( )[ ]{ }( )
×++++++−
×++++++−
×=
∑
∑
∑
=
=
=
tiAPOTAHSHNMHLHFHIHCH
tiAPOTAVSVMVLVNFVIVCVN
tiAPCUOTNPR
Lt
T
Lt
T
Lt
t
,,
,,
,,
1
1
1

111
In this work an OBP regenerative satellite is assumed to have the same bandwidth and
transmit power at the Ka frequency band (30/20 GHz), allowing a comparison between current
commercial technology for network. Table 4.10 shows the mathematical equations developed for
an OBP (regenerative) satellite, fixed SCPC, star network economic model.
The sequence to implement the OBP regenerative satellite economic model is the same as
that presented in Section 4.4.3.1 for the fixed-SCPC economic model. The model for the bent-
pipe and OBP satellites is the same since topology and multiple access are the same. Satellite
costs increase and VSAT costs decrease, but the model is the same, only the input values cha nge.
4.4.4 Evaluation Design The different models presented in Section 4.4.3 describe the equations needed to evaluate
the economic impact of different topologies and multiple access in the process of telephone
network design via satellite. The different models were implemented in a number of Microsoft
Excel 97® spreadsheets that allowed individual analysis in four areas for each model. Following
the Excel® terminology, an individual Excel® file has an extension .xls, called a “workbook”,
with a workbook having as many “worksheets” as it may need. As part of this research a
number of Matlab programs were initially developed, but it was decided that Excel® was a better
option for the type of work and analysis required. Besides having the basic mathematical
operations, Excel® also provides plenty of financial, engineering and scientific functions as part
of its extended libraries, including optimization commands that provide the Excel® user with a
very powerful analysis tool. Next, a brief description of the implementation of each computer
model is presented for satellite rural telephone network design.
4.4.4.1 Computer Model Description
This section will describe the computer models for performance optimization. The
computational model was created to manipulate a number of specific-case parameters used as
input data with the proposed economic models as shown in Figure 4.7. A number of control
parameters are introduced as constraints, allowing the optimization process to remain bounded.
The set of optimization parameters are used to maximize or minimize the performance during the
design process on any one of several topics (traffic capacity, user cost, network size, etc.) The
outcome of the process defines which model best solves the specific problem according to the
desired optimization parameters.

112
Figure 4.7. Satellite rural telephone network design optimization model
The models were implemented in a workbook for each model, with a set of four worksheets
in each case. The reason for this distribution was to separate the specific functions of each
worksheet as part of the whole program, with similar functions in all cases but individual
characteristics for each model, shown in flow charts in Figure 4.8. The four parts of each
workbook are described next.
1) A Front worksheet, with the input information about the desired network general
parameters, including number of nodes, application requirements, equipment cost and
projected system lifetime.
2) A Cost worksheet, with the implementation of the equations described in Section 4.4.3
for each one of the economic models, including time value of money and other
economic functions. The values used in these worksheets were previously defined at
the beginning of Chapter 4, along with Performance metrics and Network planning
factors.
3) A Traffic worksheet, with the implementation of the Erlang B equation as a function of
the input parameters introduced in the Front worksheet, and related to network size,
number of nodes, user traffic and expected Grade of Service.
4) A Link worksheet, with the implementation of the satellite link budget described in
Section 2.2.1, in order to guarantee that the satellite and earth station’s performance
specifications were met before the actual economic design. The parameters evaluated
here were mainly related to transponder capacity, earth station size, signal quality and
performance, system availability and bit error rate.
Output Data
Optimization Parameters
Controls & Constraints
Input Data
Model

113
Figure 4.8 Network economic model flowchart
4.4.4.2 Pivoting
Once all the models were imp lemented in their workbooks, a single spreadsheet with a
final network design was created for each model in order to provide all relevant information in a
single page. This spreadsheet includes tables and charts that allow fine -tuning of the economic
design, thus predicting possible outcomes for different network projections over the entire
network’s lifetime. This spreadsheet allows the network designer to have a “big picture” of the
desired network’s future economic performance, but only under strictl y limited assumptions.
The spreadsheet works by assigning a specific parameter with a reasonable value, thus
defining that parameter as the controlling parameter once the desired network has been designed.
The controlling parameter (or pivot) has a direct impact on the desired “to be optimum”
parameter, which is the parameter whose performance we wish to minimize or maximize. The
optimization process takes place by “pivoting” with the optimization functions that Excel®
provides, allowing the network designer to “play” with many variations until an optimal solution
is found, according to the network designer’s requirements or constraints.
Once the desired parameter’s optimal value is found, a number of projections can be made,
basically regarding network size and expected traffic increments, in order to predict the behavior
of the network under changing conditions. It is important to clarify that the projections are valid
Input values
Traffic Cost
Front
Link
Needs improvement?
Single page network data
Yes
No
Spreadsheet
114
only under the pivot’s (controlling parameter’s) assumed values. A change in the network model
parameters during its implementation or operational lifetime may have a significant variation
with those predicted during this stage of the network planning and design process.
An important aspect, not easily seen by the planner once the model is working, is that there
is no way to know for sure when a change in the pivot will produce a result outside of the
feasible solution region. A number of trial and error computer runs helps to find out the
pivoting values that provide feasible solutions for the optimization problem.
4.4.4.3 Generation of Results
The results generated by the computer for the satellite network models have the
convenience that they are based upon analytical models, therefore not requiring the extensive
computational time that is so common in large network simulation. Although the Excel®
optimizing functions perform a rather large number of iterations before finding the optimal
value, their algorithms converge reasonably quick, taking only a few seconds to show whether or
not a feasible solution exists for that problem. Every change of value of a parameter in the
spreadsheet generates instantaneously a number of tables and graphs that include the new results,
derived from the parameter changed.
Another advantage of using Excel® is that it offers a wide selection of visual aids that
allow a better understanding of the network’s performance and lifetime operational behavior.
The results generated by the different models can easily be presented in various displays, from
tables to graphs to charts, providing the network designers and decision takers with a quick view
of the general network situation, projections and potential outcomes. Finally, the results can be
extracted from the spreadsheets and transferred to practically any user application
4.5 Summary This chapter has presented the development of a methodology for efficient satellite
telephone network design based on different analytical models. The development of the
analytical model required that the scope of the problem be limited and a number of parameters,
performance metrics and system boundaries be assumed. The design philosophy and derivation
of the analytical models is explained, as well as the basic tools for optimization algorithms.

115
The process to implement a set of computer program sequences over spreadsheets is
explained, as well as the general behavior of the analized models. Finally, the input parameters
and measured outputs of the models were explained.

Chapter 5
Parametric Analysis Results This chapter presents the results obtained during the parametric analysis of the models
analyzed in this work. It compares the economic performance of the different topologies and
multiple access and its impact on satellite telephone network design. It is divided into four
sections. Section 5.1 presents the results of the different economic models for different
scenarios. Section 5.2 compares each model in its technical and economic performance
behaviors, allowing some interesting observations. Section 5.3 discusses the predictive power of
these models and their possible impact on satellite network economic analysis. Section 5.4 is a
summary of the parametric analysis results.
Section 5.1 presents the analysis results of the Fixed-SCPC economic model, the Fixed-
MCPC economic model, the SCPC-DAMA economic model, the Mesh-SCPC and the OBP
regenerative economic models. All parametric analysis are shown for a low traffic (pessimistic),
a medium traffic (nominal) and a high traffic (optimistic) scenario, with cha nging projections in
each case.
Section 5.2 discusses the results shown in Section 5.1, further discussing the sensitivity of
the models to small variations on traffic intensity, network size, satellite transponder capacity
and user cost-per-minute.
Section 5.3 analyzes the predictive power of the economic models, allowing for a
discussion of the most commons errors found when planning and designing satellite telephone
networks, and their impact on the finished network operation.
Finally, Section 5.4 summarizes the results obtained in this chapter, as well as the
tendencies and sensitive parameters observed during the analysis and design process.
5.1 Parametric Analysis Results of the Economic Models This section presents the different economic models developed as part of the research on
the optimal design of rural satellite telephone networks. Parametric analysis tools allow the
analytical study of a system or network parameters with ease and convenience, allowing quick
observation of the system behavior (analysis) and its most desired performance (optimization).
117
The traffic intensity parameters to set low, medium and high traffic loads for the parametric
analysis are based on 0.05 Erlangs for low traffic (3 min/hr), 0.15 Erlangs for medium traffic (9
min/hr) and 0.25 Erlangs (15 min/hr) for high traffic. A network size of 100 nodes is assumed
at all times for analysis purposes, although the projections allow for both smaller and larger
network sizes. It is about these values that the optimization process takes place, by pivoting on
the expected lifetime breakeven results.
An operational lifetime of 10 years is assumed in all cases, with a yearly interest rate of 18
% for future return of investment at the system’s end of life. The operational time was based on
a 14 hour/day availability of a typical public commerce (8 AM to 10 PM) business, open for
public telephone service 365 days a year.
The analyzed models are optimized using the above values as the design input data, but are
projected over traffic intensities of 0.025, 0.05, 0.1, 0.2, 0.25 and 0.33 Erlangs, for networks with
20, 50, 100, 200 and 500 earth stations. Refer to Tables 4.1 and 4.3 for more information about
these values.
The parametric analysis were performed using Microsoft® Excel 97 SR-2 with the
equations presented in Chapter 4, Section 4.4.3, Tables 4.6 to 4.10. The optimization routines
were performed by Excel through the “Goal Seek” function, which uses a variant of the Newton
algorithm to optimize a specific cell by changing the value of only one other variable. More
complex problems involving multiple variables and constraints can be answered with the
“Solver” function, also provided by Excel, but that function was not used in this research.
The assumed earth station parameters are 1.2 m antenna, 2W HPA (radio) for remote
terminals (VSATs) and varying antenna and radio parameters for the Hub, depending upon the
network size.
5.1.1 Fixed-SCPC Model This Section presents the analysis results of the Fixed-SCPC economic model for a low
traffic (pessimistic), a medium traffic (nominal) and a high traffic (optimistic) scenario, with
changing projections in each case.
The basic SCPC scenario is shown in Figure 5.1, along with its data tables and
performance graphs. The network is composed of 100 nodes with a traffic intensity of 0.15
Erlang. It is easily seen that the small number of nodes causes the VSAT unit price to be

118
$7,500, a higher figure than that of larger networks, basically due to volume sales from more
than 100 earth stations.
The lifetime economic analysis shows the network reaching the break-even point at the end
of the tenth year, as planned. That allows the investors to obtain an 18 % yearly return on
investment, which already includes the projected profits over banking interest rates.
The 3-Dimensional (3-D) plot shown in Figure 5.1 shows the Profits -vs.-Nodes-vs.-Traffic
projections of the network for other values of traffic intensity and network size, obtained from
the tale pivot value at the right bottom of the lifetime cost table.
5.1.1.1 Low Traffic Scenario
A low traffic, or pessimistic, scenario is the one that allows the economic projections to
succeed with a very low traffic operation over a satellite network.
The 3-D plot on Figure 5.1 shows how a low traffic scenario (0.025 Erlangs) will not only
lose money in a small network ($8 million in losses for a 20-VSAT network) but also in a large
size network ($271 million losses for a 500 VSAT-network).
The situation does not improve with a small increase in traffic, since up to 0.10 Erlangs
(medium expected subscriber traffic) still generates losses at every network size.
5.1.1.2 Medium Traffic Scenario
The same 3-D plot in Figure 5.1 was projected from a medium, or nominal, traffic intensity
of 0.15 Erlangs. This specific case was designed so the network’s break-even point is met at
0.15 Erlangs of traffic over the system’s lifetime for a 100-VSAT network. This means the
medium expected, or nominal, traffic scenario is that with the most likely traffic intensity for the
network.
In this case, the expected traffic will generate the initially planned network revenue, which
is the initial amount presented to the financiers and investors as the targeted goal. Although it
may look to be approaching the break - even point, it must be remembered that

119

120
this point already includes a substantial amount of profit due to the larger interest rate used
when quantifying the future value of money. Variations on network size will provide only a very
small positive difference from the targeted value, so the scenario is still considered as nominal.
5.1.1.3 High Traffic Scenario
From the same 3-D plot in Figure 5.1 is possible to see the projected earnings for a larger-
than-expected user traffic behavior, both in terms on network size as well as in terms of expected
traffic intensity. The profits for a small network with a high traffic (around 0.25 Erlangs) are
substantial ($9 million over the break-even point), even for a small (20 VSAT) network. A
larger network provides a dramatically large profit ($271 million over the break-even point) for a
500 VSAT network.
Figure 5.2 shows the comparison of the profit earning curves for low, medium and high
traffic analysis. The reason the low traffic curve generates higher profits is that the user cost per
minute is much higher. This should not be taken as a way to predict gains, since an expensive
system will probably have fewer customers than a more inexpensive system, covering with
volume the lower revenue due to higher user cost.
Figure 5.2 also shows the pie charts of the low traffic, medium traffic and high traffic
scenarios for a Fixed-SCPC satellite network during the first year of operation, where the VSAT
capital investment clearly dominates over the hub capita l cost. The VSAT segment also
generates more expenses in the variable costs, mainly due to the PSTN access fee for each user
channel. It is also easy to see how by increasing the number of calls, or traffic, the variable costs
of the VSAT segment particularly increase due to the satellite and connection fees for a larger
number of terminals.
It is safe to conclude that, when using Fixed-SCPC satellite modeling analysis, network
size defines the general cost of the network and that the network’s operation is expensive. It
also is safe to conclude that small Fixed-SCPC networks produce small profits or losses if traffic
is low, but generate tremendous losses or profits in large networks. For that reason a careful
traffic analysis must be made, considering different network sizes, since a poorly made traffic
analysis (or business plan, for that matter) is a sure way to lose money in network planning and
design.

121

122
5.1.2 Fixed-MCPC Model This section presents the analysis results of the Fixed-MCPC economic model for a low
traffic (pessimistic), a medium traffic (nominal) and a high traffic (optimistic) scenario with
changing projections in each case. There is a small but important difference between the Fixed
SCPC model presented in the previous Section 5.1.1 and the Fixed MCPC model presented in
this Section. The MCPC earth station has the capability to provide up to eight Time Division
Multiplex (TDM) user channels per earth station, while the basic SCPC VSAT only allows one.
That does not mean that all eight channels will be operating at the same time; only that it
provides the users with more capacity.
The basic MCPC scenario is shown in Figure 5.3, along with its data tables and
performance graphs. The network is composed of 100 nodes with a traffic intensity of 0.05
Erlang per TDM user telephone. In this model, the total traffic out of the earth station is the
expected traffic intensity per telephone channel, multiplied by the number of active channels at
any given time. Although all of the voice channels will use the same satellite carrier, thus saving
satellite costs, they still generate expenses by connecting each channel to the PSTN. Besides,
each earth station is assumed to cost 50% more than a typical VSAT due to the more complex
TDM interfaces and required extra equipment, such as the telephone sets.
There are two economic drivers in this model: the expected user traffic per telephone set
and the expected number of active channels at any given time. That problem is treated
statistically by means of a binomial distribution function, since the number of events is small
(<8). The probability that at least one user is on the line will generate little revenue but still
generate the same satellite cost as if all eight lines were busy. The refore, the expected number
of busy lines in this analysis was one line (29% of the time) and two lines (5% of the time).
Again, it is easily seen that the VSAT prices are the dominant figure in the first year. The
lifetime economic analysis shows the network reaching the break-even point at the end of the
tenth year, as planned. That allows the investors to obtain an 18 % yearly return of investment,
which already includes the projected profits over banking interest rates.

123

124
The 3-Dimensional (3-D) plot shown in Figure 5.3 shows the profits -vs.-Nodes-vs.-Traffic
projections of the network for other values of traffic intensity and network size, obtained from
the table pivot value at the right bottom of the lifetime cost table. Two different plots come out
from the analysis, the first for one active voice channel, and the other for two active channels.
5.1.2.1 Low Traffic Scenario
A low traffic scenario in a Fixed MCPC model is one that includes minimum use of the
earth station (one user) at minimum traffic intensity (0.05 Erlang). By multiplying the total
traffic out of the earth station, the analyzed model allows economic projections for very low
traffic operation on the satellite network.
The 3-D plot on Figure 5.3 shows how the behavior of Fixed MCPC is very similar to that
of the Fixed SCPC model; both plots are practically the same except for the higher earth station
costs and higher revenue. A low traffic scenario (0.025 Erlangs) will cause losses in a small
network ($8 million loss for a 20-VSAT network) even if only one user is using the channel.
Again, this is especially critical in a large size network ($184 million loss for a 500 VSAT-
network).
The situation does not improve with a second user, since the total increase in traffic in the
earth station requires a longer time to recover the costs. A user traffic of 0.10 Erlangs (medium
expected subscriber traffic) produces a total of 0.20 Erlang per VSAT, but still generates losses
under that traffic value.
5.1.2.2 Medium Traffic Scenario
Even when the user traffic increases in a Fixed SCPC network, it is still very difficult to
generate profits since the PSTN access fees for the second lines adds onto the other network
expenses.
Probably the most important improvement in having a second (or third, or more) user
simultaneously is not found in the total recovery of investment economics, but rather in the lower
user price, as shown in Figure 5.4. Even when presenting the same user traffic (0.15 Erlang),
having a second caller per earth station lowers the user cost, in this case from $0.3172 to
$0.1093, but it also reduces the overall profit of the network.

125

126
Figure 5.5 shows that the increase in the number of network nodes does not have a significant
impact on the user cost, but rather that the actual number of simultaneous users is the reason for
the decrease in cost.
5.1.2.3 High Traffic Scenario
Figures 5.3 and 5.4 show the different effects of high traffic on overall economic planning,
again depending upon the number of simultaneous TDM channels. Although the user traffic
intensity is the same, Figure 5.3 with only one-user shows smaller revenue although the total
profit is actually much larger.
There are some interesting conclusions when comparing Figures 5.3 and 5.4, both relating
to the Fixed MCPC model. While the one-voice channel analysis in Figure 5.3 shows a high
traffic (0.25 Erlang) profit range from $5 million (20 nodes) to $160 million (500 nodes), the
two-voice channel from Figure 5.4 is still generating losses, ranging from $2 million (20 nodes)
to $31 million (500 nodes). The two-voice channel only generates profits when traffic is above
0.30 Erlangs.
From the same 3-D plot in Figure 5.3 it is possible to see the projected earnings for a
larger-than-expected user traffic behavior, both in terms of network size as well as in terms of
expected traffic intensity. The extreme behavior of the single voice channel MCPC model is
unusual, since the profit curve for a large network with high traffic is almost exponential at some
points.
Figure 5.6 shows the comparison of the profit earning curves for low, medium and high
traffic analysis for single voice channel per VSAT, while Figure 5.7 shows the same information
for the two voice channel earth station. It can be seen that the relative VSAT capital cost is
reduced while the VSAT variable cost increases in almost the same proportion.
Figures 5.6 and 5.7 also show pie charts for low, medium and high traffic scenarios for a
Fixed-MCPC satellite network during its first year of operation, where the VSAT capital
investment clearly dominates over the hub capital cost.
The VSAT segment also generates more expenses in the variable costs, mainly due to the
PSTN access fee for each user voice channel, as it can be appreciated in Figure 5.7. It is also
easy to see how by increasing the number of calls, or traffic, the variable costs of the

127

128

129

130
VSAT segment particularly increase due to the satellite and connection fees for a larger number
of terminals.
It is possible to conclude that in Fixed-MCPC network satellite analysis, network size
defines the general cost of the network and that the network’s operation is expensive. It also is
safe to conclude that a reduced number of TDM users per earth station define the economic
performance of the network.
Fixed-MCPC networks does not produce profits if traffic is low, but may generate dramatic
loses or profits in large networks. A careful traffic analysis for Fixed MCPC must be made,
considering different network sizes, varying traffic and especially the statistic for second or third
users in TDM channels
5.1.3 SCPC DAMA Model This Section presents the parametric analysis results of the SCPC DAMA economic model
for a low traffic (pessimistic), a medium traffic (nominal) and a high traffic (optimistic) scenario,
with changing projections in each case.
The basic SCPC DAMA scenario is shown in Figure 5.8, along with its data tables and
performance graphs. The network is composed of 100 nodes and 25 satellite carriers that all ow
for 1.8 % GoS with a traffic intensity of 0.15 Erlang per user. It is easily seen that the smaller
amount of carriers with respect to the number of nodes allows for an improvement in
expenditures in this network. The quality of the network is expressed in the 1.8 % GoS.
Although the network may use only a small number of earth stations at any given moment, an
SCPC DAMA network usually requires a large capital outlay to start operations. Although the
hub is important, and it may be a major expense, it is the least expensive part of the network. A
large part of the varying network expenses are caused both by maintenance to the earth stations
(whether they are being used or not) and to pay for the satellite channels and connection time to
the PSTN.
The lifetime economic analysis shows the network reaching the break-even point at the end
of the tenth year, allowing investors to obtain their expected return on investment. The 3 -
Dimensional (3-D) plot shown in Figure 5.8 shows the Profits -vs.-Nodes-vs.-Traffic projections
of the network for other values of traffic intensity and network size, obtained from the table pivot
value at the right bottom of the lifetime cost table.

131

132
5.1.3.1 Low Traffic Scenario
The SCPC DAMA network is designed especially for applications with a large number of
network nodes and a small number of users actually on the network at any given time. The main
idea in SCPC DAMA is to optimize the satellite resource by assigning channels by demand only.
Nevertheless, a small network will hardly be economically autonomous if the traffic demand is
small compared to the capacity of the network. In the analysis, a 100 node network was
assumed, with 25 satellite carriers and an expected low user traffic intensity of 0.05 Erlang.
Figure 5.8 shows the low traffic performance of the simulated network, along with its economic
implications.
In a low traffic scenario, and due to the large investment created when implementing a
SCPC DAMA, this network shows the largest economic component to the VSAT portion (all
remotes in the network). In very low traffic situations, earning would not recover the
investment, with the possibility of losing $9 million on a small network, and up to $99 million in
a large network, for 0.05 Erlangs traffic. The loss is larger for even lower traffic figures like the
0.025 Erlang projection shown in the table.
Figure 5.9 shows the relative impact of low traffic in projections. The low traffic plot on
the graph shows a markedly positive profit for projections based on the low traffic assumption.
This behavior may be misleading, since the projection upon which the curve is based assumes
the user cost at $1.18/min of service. That is the value that the model found suitable to make the
low traffic scenario able to me et the end of lifetime break-even point. That figure is definitively
not representative of the reality of rural telephony; therefore the low traffic assumption in an
SCPC DAMA scenario will hardly make any profit. On the same Figure 5.9, the pie chart for
low-traffic, first-year expenses shows that the VSAT capital investment clearly dominates costs,
as often happens in an SCPC DAMA network.
5.1.3.2 Medium Traffic Scenario
In a medium traffic (optimal) situation, an SCPC DAMA network performs as expected
regarding the cost and revenue performance due to traffic. The network size is not relevant to
the general profitability of the network, since it depends rather upon traffic, but a larger network
does generate a larger revenue for the same assumed traffic.

133
134
As mentioned before, the number of operating earth stations is directly related to the traffic
analysis that defined the number of satellite carriers, and small traffic variations do not disrupt
the expected performance of the network. An interesting point is the fact that larger networks
provide larger revenue without large operating expenses, especially due to lower satellite
capacity and PSTN access expenses.
The 3-D plot shown in Figure 5.8 shows that medium traffic is around the break-even point
in practically all network size projections. This means that the user cost figure found during the
optimization process, $0.42/min, is probably a safe parameter to assume for this type of network
given the other parameters as valid (fixed and variable VSAT and hub costs). On the other
hand, what is projected in Figure 5.8 is the actual number of satellite carriers, which is the
parameter that creates expenses and generates revenue. The total number of nodes, or earth
stations, is independent of the number of carriers, except for their relationship to obtain the
desired Grade of Service.
Figure 5.9 shows the predominance of the VSAT overall cost in the first year of operations
(pie charts), with a small variation in the medium traffic scenario for VS AT capital (lower) and
variable (higher) relative costs compared to the lower traffic scenario. This implies that when
traffic increases the operational costs (satellite capacity, PSTN access) also increase as a direct
function of traffic.
5.1.3.3 High Traffic Scenario
The high traffic scenario for an SCPC DAMA network is based upon the assumption that
every carrier is used to its highest possible number of minutes per year, therefore generating
lower expenses and more revenue than fixed-assignment networks.
As the 3-D plot on Figure 9.8 shows, all high traffic projections show a substantial amount
of profits, especially over a large network with many carriers. This is simply a direct result of
the user cost obtained for the break-even analysis and model implementation. The projections
shown were based upon the medium traffic 0.15 Erlangs case and projected over a larger number
of carriers. The higher traffic scenario figures, shown in the table at the top of Figure 5.9, shows
a more modest profit due to the lower user cost figure found at this scenario, in this case
$0.27/min. The pie chart for the high traffic scenario of Figure 5.9 also show figure a small
decrease in VSAT capital cost vs. a small increment on variable VSAT cost.

135
5.1.4 Mesh SCPC-DAMA Model As described in Section 4.4.3.4, the Mesh SCPC DAMA model is based on a number of
earth stations N which can connect to each other, and use a number of gateways, or mini -hubs, to
interconnect to the PSTN. It is assumed that each gateway can support up to n carriers, so the
total number of satellite carriers at any moment is n×g, which is the figure taken as the number
of nodes communicating through the satellite network.
For the analysis presented in this research, a number of four gateways was used, with each
gateway providing a capacity of 25 satellite carriers from 100 earth stations. What this means is
that, although each earth station can communicate with any other each other as in any mesh
network, those requiring an outlet to the PSTN may do so through any of the gateways. Any
user has an associated expected traffic, which is used to project variations in traffic and number
of nodes.
5.1.4.1 Low Traffic Scenario
In the Mesh SCPC DAMA scenario, as it has been in all other models for low tr affic
scenarios, the main characteristic is the high amount of profits that are projected by the models.
Figure 5.10 shows the impressive amount of profits generated by the Mesh SCPC DAMA model
when projected for large size networks.
Again, the main reason behind this behavior is a result of the optimization process when
setting the break-even point for low traffic, reached at the end of the system’s lifetime. For low
traffic applications, this can only be accomplished when a large user cost tariff is imposed. In
this case, for mesh SCPC DAMA the user cost is $1.82/min, which is obviously impractical for
rural telephony applications, but is very attractive for investors looking for revenue and for large
profit numbers.
In fact, the projection for large network size when using the low traffic scenario turns out
to be over $560 million above the break-even point, as shown in Figure 5.11. An important
piece of information is shown in the pie chart for low traffic at Figure 5.11, where it is easy to
see the large proportion of capital investment required for the mesh SCPC DAMA model
presented here. The cost of the hubs is larger than that of the combined VSATs, since each
mini-hub must be able to handle a large number of calls.

136

137
138
5.1.4.2 Medium Traffic Scenario
A more conservative, and more realistic, idea of the network’s performance regarding
traffic and profits can be derived from the 3-D plot on Figure 5.10. This plot actually
corresponds to the medium traffic scenario, and it can be seen that the profitable performance for
the medium traffic scenario (0.15 Erlangs) is found above 0.15 Erlangs of traffic, and for
networks with more than 50 satellite carriers.
A user cost of $0.63/min is still considered high, but closer to the expected value of $0.25
to $0.40 per minute expressed as desirable in Chapter 4. Figure 5.11 also shows how the
medium traffic analysis can be projected over a larger network with a large number of carriers,
providing considerable earnings (around $120 million) but not qui te as much as the low traffic
projections ($560 millions).
5.1.4.3 High Traffic Scenario
The high traffic scenario provides the best user cost value of all Mesh SCPC DAMA
scenarios, optimizing the network to a $0.39/min user cost. Although the revenue projections for
this value are not as attractive as the previous scenarios, the high traffic projections allow for a
very solid and feasible network implementation. It also provides the lowest user cost, in this
case, $0.39/min, which is inside the allowed range of price for the network.
Although the 3-D plot in Figure 5.10 shows the projection to grow rapidly along with the
network size, in reality any mesh network must have a medium to large traffic intensity to
actually be profitable. This is needed due to the large initial investment caused by the VSATs
and Hub capital cost.
Although the user cost is lower than the other mesh scenarios and thus the profits are
lower, the lower user cost will probably attract more users, thus having the positive effect of
increasing traffic. This way, in an indirect manner, revenue is increased by the higher traffic,
thus increasing profits over a longer time. This model scenario allows a network designer to
preview the network performance and decide which parameter needs to be changed or improved
to further optimize the design.

139
5.2 Comparison of Multiple Access Models The analysis of the different traffic intensity scenarios allow for a better understanding of
the way the variables interact with each other during ne twork operation. Each model has a
different impact on the variables, and break-even points need to be found between their values in
order to identify an improvement or decline of the network’s performance beyond some
equilibrium point.
Probably the three most important parameters for satellite rural telephone network design
are network size, expected traffic capacity and user cost. Network size implies how many sites
are serviced by the network in terms of required or available earth stations. Expected traffic
capacity involves how often the telephone links are going to be used and how often service will
be denied to incoming calls due to congestion. Finally, the user cost parameter involves how
much the user has to pay to benefit from the service, if available.
This section provides a comparison and discussion about the interrelation between
parameters in the same model, and among other models.
5.2.1 Effects Due to Traffic Intensity Variations Traffic intensity patterns are unique to each economic, cul tural, societal and geographical
situation regarding telephone service habits. What could be an excuse for someone to make a
telephone call would require an emergency for someone else to make the call.
If trying to obtain traffic behavior and habits for urban users is difficult, trying to establish
the behavior of potential rural users is even more difficult, since there is no previous pattern of
use. The few existing statistics regarding initial telephone usage in rural communities belong to
the telephone companies, which do not like to share such information and treat it as confidential
and proprietary.
Still, it is important to study the telephone traffic intensity variations and its performance
effects on network planning and design, since it has been shown that there is a tremendous
impact on both gains and loses. Although real-life figures are not easy to obtain, a number of
estimated figures have been used in the model analyzes presented in this work.
One way to observe the expected traffic imp act on profits is to run multiple parametric
analyzes under different traffic values and observe the behavior of the different profit lines. As
an example of this analysis, the Fixed SCPC model was analyzed searching for its sensitivity to

140
variations on traffic and its impact on profits. The analysis based on 100 nodes with a constant
user cost of $0.3142/min, which was optimized to break-even in 10 years at 0.15 Erlangs of
traffic. In this analysis traffic was varied from 0.12 to 0.18 Erlangs in increments of 0.01
Erlang, and the resulting profit projections are plotted in Figure 5.12.
What this figure shows is the projection over the system’s 10 year lifetime of the economic
model behavior with varying traffic values for each case. It can be seen that break-even occurs
at 0.15 Erlang, as originally designed. Curves with traffic density under that value increase the
network losses to $9 million (0.12 Erlang), while curves over that value increase profits up to $9
million (0.18 Erlang). It can be shown that even a small change in either direction has an
important impact on the network’s economics.
As an example to demonstrate the magnitude of traffic change impact on profits, a
variation of 0.01 Erlang, or 36 seconds in one hour, is applied over the 0.15 Erlang case used for
medium traffic analysis. The change from 9 minutes per hour (0.15 Erlang) to 9 m 36 s (0.16
Erlang) in the expected traffic figure creates a surplus of $3,035,000. In the same token, a
decrease of the same value to 8 m 24 s (0.14 Erlang) creates a deficit of the same amount.
Figure 5.12 shows how the relationship is linear, so a variation of 0.02 Erlang in either way
will create an economic impact of twice that value ($6,070,000) in gains or losses, and 0.03
Erlang will change $9,105,000 either way. This is probably the main reason for which traffic
studies need to be as precise as possible.
Another way to observe the effects of traffic intensity variations on network performance is
to substitute the optimization variable. This is done by running a typical parametric analysis,
then setting a pre-fixed parameter, such as user cost, and observing the sensitivity of the models
by optimizing the traffic at different values. Figure 5.13 shows the impact on user cost per
minute of each model according to the desired user cost ($0.25 to $0.50/min) for different traffic
intensities.
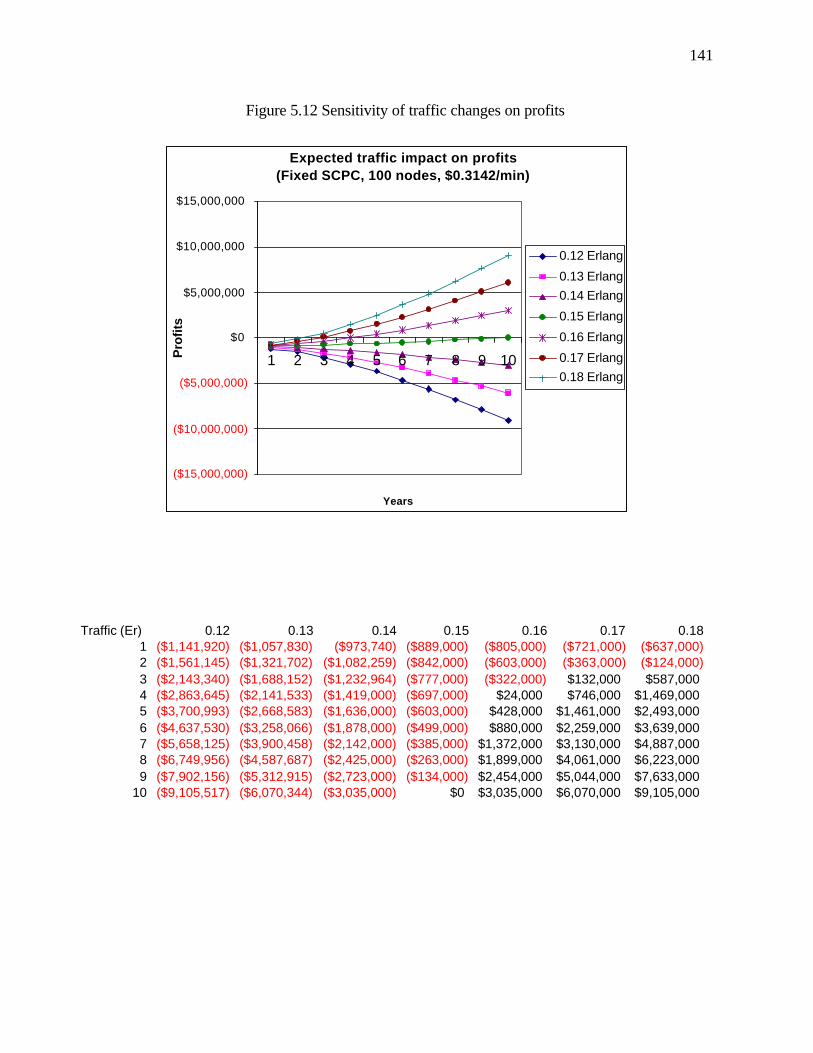
141
Figure 5.12 Sensitivity of traffic changes on profits
Expected traffic impact on profits(Fixed SCPC, 100 nodes, $0.3142/min)
($15,000,000)
($10,000,000)
($5,000,000)
$0
$5,000,000
$10,000,000
$15,000,000
1 2 3 4 5 6 7 8 9 10
Years
Pro
fits
0.12 Erlang
0.13 Erlang0.14 Erlang
0.15 Erlang
0.16 Erlang
0.17 Erlang0.18 Erlang
Traffic (Er) 0.12 0.13 0.14 0.15 0.16 0.17 0.181 ($1,141,920) ($1,057,830) ($973,740) ($889,000) ($805,000) ($721,000) ($637,000)2 ($1,561,145) ($1,321,702) ($1,082,259) ($842,000) ($603,000) ($363,000) ($124,000)3 ($2,143,340) ($1,688,152) ($1,232,964) ($777,000) ($322,000) $132,000 $587,0004 ($2,863,645) ($2,141,533) ($1,419,000) ($697,000) $24,000 $746,000 $1,469,0005 ($3,700,993) ($2,668,583) ($1,636,000) ($603,000) $428,000 $1,461,000 $2,493,0006 ($4,637,530) ($3,258,066) ($1,878,000) ($499,000) $880,000 $2,259,000 $3,639,0007 ($5,658,125) ($3,900,458) ($2,142,000) ($385,000) $1,372,000 $3,130,000 $4,887,0008 ($6,749,956) ($4,587,687) ($2,425,000) ($263,000) $1,899,000 $4,061,000 $6,223,0009 ($7,902,156) ($5,312,915) ($2,723,000) ($134,000) $2,454,000 $5,044,000 $7,633,000
10 ($9,105,517) ($6,070,344) ($3,035,000) $0 $3,035,000 $6,070,000 $9,105,000
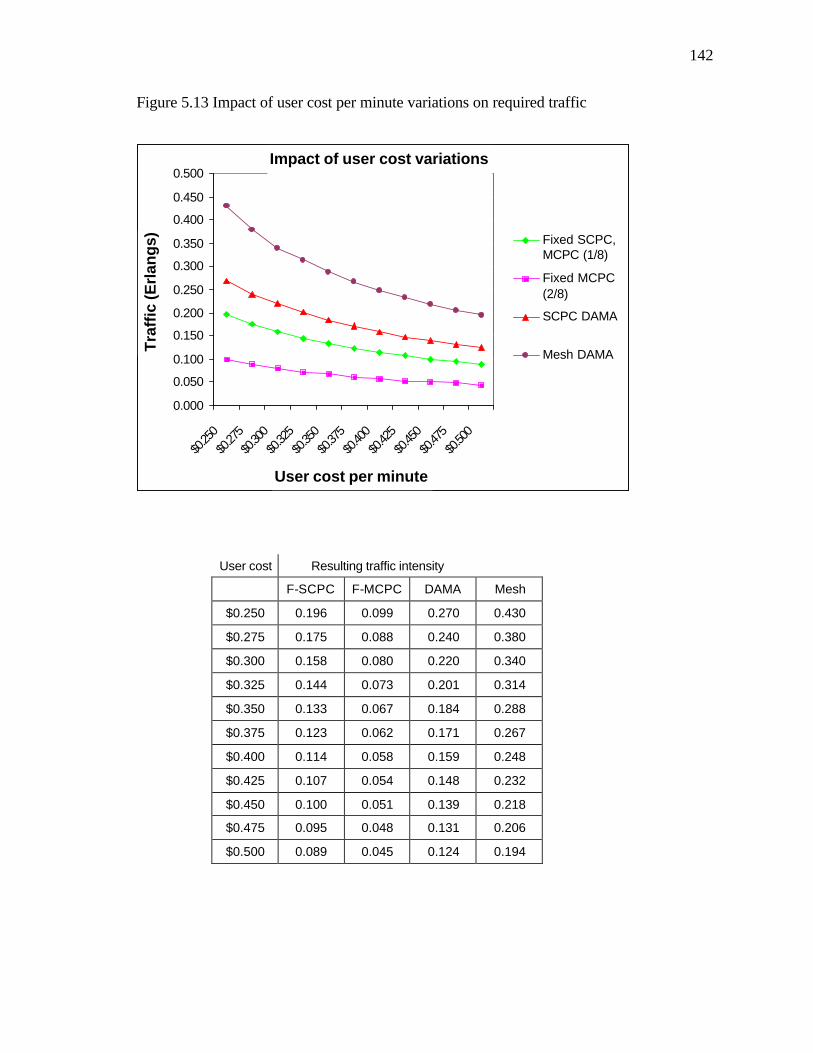
142
Figure 5.13 Impact of user cost per minute variations on required traffic
User cost Resulting traffic intensity
F-SCPC F-MCPC DAMA Mesh
$0.250 0.196 0.099 0.270 0.430
$0.275 0.175 0.088 0.240 0.380
$0.300 0.158 0.080 0.220 0.340
$0.325 0.144 0.073 0.201 0.314
$0.350 0.133 0.067 0.184 0.288
$0.375 0.123 0.062 0.171 0.267
$0.400 0.114 0.058 0.159 0.248
$0.425 0.107 0.054 0.148 0.232
$0.450 0.100 0.051 0.139 0.218
$0.475 0.095 0.048 0.131 0.206
$0.500 0.089 0.045 0.124 0.194
Impact of user cost variations
0.000
0.050
0.100
0.150
0.200
0.250
0.300
0.350
0.400
0.450
0.500
$0.25
0
$0.27
5
$0.30
0
$0.32
5
$0.35
0
$0.37
5
$0.40
0
$0.42
5
$0.45
0
$0.47
5
$0.50
0
User cost per minute
Tra
ffic
(Erl
ang
s) Fixed SCPC,MCPC (1/8)
Fixed MCPC(2/8)
SCPC DAMA
Mesh DAMA

143
What Figure 5.13 shows is the required traffic per earth station that w ould bring user costs
down to a reasonable (for rural purposes) economic level. This graph was obtained by setting
the base user cost ($0.25 to $0.50/min) in increments of $0.025, or 2.5 cents, in an analysis based
on 100 active nodes or satellite carriers. Setting the break-even point at 10 years, it allowed
searching for the minimum traffic value that could provide such cost. The results are shown in
Figure 5.13
It is easy to see that the most expensive technology for telephone service is the mesh SCPC
DAMA model. This technology requires high user charges to recover the investment over the
proposed system lifetime. Although the user cost is within the limits of the desired cost, it
requires a very high traffic per node, even higher than this work terms “very high traffic”, which
is 0.33 Erlangs, for most rural telephone applications. The mesh technology, as simulated,
would not last long under low, medium or even reasonably high traffic conditions, except
perhaps by charging a high user cost.
The model for star SCPC DAMA offers the same user cost range as the mesh technology,
but it has the advantage of requiring less traffic to reach the break-even point. This is good for a
rural telephone network, since it means that it is easier to reach that investment return while
providing a lower cost service to the user. Since SCPC DAMA is around the high to medium
traffic region (0.25 to 0.15 Erlangs), the resulting user cost would still be in the upper half of the
desirable cost region. This means that star SCPC DAMA can only offer a low user cost when
high traffic is available, and must charge a higher user fee when lower traffic intensity is
expected.
On the other hand, it can be seen that both fixed-assignment options (SCPC and MCPC)
can offer the best service to users, since both can provide low user cost at low traffic rates.
Especially interesting is the MCPC technology, which, under the worst case can transmit only
one out of eight TDM channels (1/8), generating the same expenses and providing the same
revenue as the single-channel SCPC. It is easily seen that the two-channel case (2/8) improves
the service greatly, especially because it obtains twice the revenue with the same number of
satellite channels.
It is easily seen that SCPC and MCPC (1/8) can provide the user with telephone service at
low to medium traffic for a low user cost, while MCPC (2/8) provides the lowest user cost of
them all. Logic indicates that more TDM channels in MCPC could reduce even more the tariff,

144
but the probability of occurrence of (1/8) is 29% while that of (2/8) is only 5% of the time. More
simultaneous users would increase revenue, but (3/8) is less than 0.5 percent of the time, so this
is not a significant improvement.
5.2.2 Effects Due to Network Size Variations The network size, or total number of nodes also has an impact on the network design stage.
It has been shown in Figures 5.1 through 5.12 how network size, along with traffic intensity, is
probably the most important element to define when planning a satellite network. Although the
direct impact of network size is important, the indirect effect that size has in optimizing revenue
is more important, which then allows projection over large networks.
One possible way to measure the sensitivity of network size is by discussing the effect of
size variations over the economic models. This means showing how variations of network size
have an impact on profits. This is done by running successive analyzes over the economic
model of any technology evaluated in this work. The analysis is done by setting the optimal
break-even cost as pivot, and copying the column of profits (or losses) over the system’s 10
years of lifetime. Once this is done, different network sizes are implemented on the models,
including the user cost for each traffic scenario. Figure 5.14 shows how this information is used
to compare the impact of varying network size into overall network profits.
What Figure 5.14 shows is the profit curve during the time it takes to reach the break-even
point for different network sizes. At this point the initial revenue expectations are reached by
the end of the system’s lifetime. It can be seen how the smaller network (20 nodes) has 10 years
to pay back little over $220,000. When the network grows to 50 earth stations, the amount to
pay is over $544,000 in the same amount of time, which will probably require higher traffic or
user cost. The trend continues for 100, 200 and 500 nodes, until the last network size, 1,000
nodes, which generates so much expense that a $7 million debt must be paid in those ten years.

145
Figure 5.14. Economic impact of network size variations on user cost per minute.
Impact of network size on break-even point(Fixed SCPC, 100 nodes, 0.15 Er)
($8,000,000)
($7,000,000)
($6,000,000)
($5,000,000)
($4,000,000)
($3,000,000)
($2,000,000)
($1,000,000)
$0
1 2 3 4 5 6 7 8 9 10
Years
Pro
fits
20 nodes,$0.33/min
50 nodes,$0.3068/min
100 nodes,$0.3143/min
200 nodes,$.3273/min
500 nodes,$0.3053/min
1,000 nodes,$0.2983/min
Nodes 20 50 100 200 500 10001 ($220,000) ($544,000) ($889,000) ($1,784,000) ($3,563,000) ($6,917,000)2 ($209,000) ($515,000) ($842,000) ($1,690,000) ($3,375,000) ($6,553,000)3 ($192,000) ($476,000) ($777,000) ($1,559,000) ($3,115,000) ($6,047,000)4 ($172,000) ($426,000) ($697,000) ($1,398,000) ($2,793,000) ($5,422,000)5 ($149,000) ($369,000) ($603,000) ($1,210,000) ($2,418,000) ($4,694,000)6 ($123,000) ($305,000) ($499,000) ($1,001,000) ($1,999,000) ($3,881,000)7 ($95,000) ($235,000) ($385,000) ($772,000) ($1,542,000) ($2,994,000)8 ($65,000) ($161,000) ($263,000) ($527,000) ($1,054,000) ($2,046,000)9 ($33,000) ($82,000) ($134,000) ($269,000) ($538,000) ($1,045,000)10 $0 $0 $0 $0 $0 $0
User fee $0.3373 $0.3068 $0.3143 $0.3273 $0.3053 $0.2983

146
As can be seen in Figure 5.14, the initial debt that the networking company assumes is
crucial for the well being of the company. If a large debt is contracted to operate a large number
of nodes, and the traffic analysis shows that traffic may not help much with the investment
recovery, the project will surely die before ever being implemented.
5.2.3 Effects of Cumulative User Cost per Minute Variations Another important variable, directly related to average traffic intensity, is the cumulative
usage time over a yearly period, or cumulative operational time. This parameter may show
variations not shown in the expected traffic figures, such as an increase in traffic due to a local
event (fairs, celebrations or emergencies), or a decrease due to absences (vacations, long trips) at
the rural community. Since traffic intensity may drastically change at any short period of time
but overall cumulative time may not, these cumulative variations may have an effect on
telephone service pricing figures.
So far, it has been assumed that each earth station maintains average traffic intensity at all
times, but real user behavior may not be as simple to predict. A yearly operational time is a
good parameter to study when designing and analyzing telephone networks. One of the
advantages of modeling telephone networks is that it allows observation of this behavior and
determines if there is any important impact on the estimated user cost for each model. This
effect was studied and the results are presented in Figure 5.15, where the different technologies
are shown regarding their cumulative operational time in minutes per year, against the estimated
user cost. This study allows the designer to find the break-even point for the network economic
sources, while providing insight into the technology’s performance regarding user costs.
Figure 5.15 shows that fixed assignment multiple access techniques (SCPC, MCPC) are
again the technologies that provide the lowest user costs, especially MCPC with two
simultaneous users. That is probably due to the low dependency on the hub for assigning
channels since they already have a permanent one, so a lower user fee may be offered. In
MCPC for two simultaneous users, the cost is helped by the higher revenue.

147
Figure 5.15 Economic impact of traffic variations on user cost per minute
SCPC DAMA also provides low costs but it needs a higher number of minutes per year
than the previously mentioned two technologies. A possible reason here is that any SCPC
DAMA network requires a large investment in the remote nodes (VSAT terminals) as well as a
more complex hub. The maintenance cost of all VSATs is constant, although there is a
reduction in the operational costs (satellite bandwidth and PSTN access). Still, SCPC provides
the user with a cost-effective solution at a price within the accepted range for this work, which is
under $0.50/min for medium and high traffic. This means that SCPC DAMA provides
reasonable user costs for operational times over 45,000 minutes/year (about 0.085 Erlang),
regarding the number of cumulative operational minutes per year for each earth station.
Finally, the Mesh SCPC DAMA model shows the least user cost-effective behavior,
probably due to the high cost of the mini-hubs involved in the design, which greatly increases the
overall capital and operational cost of the network. Figure 5.14 shows how only in high and very
high traffic situations (more that 75,000 minutes per year, or 0.143 Erlang) can a Mesh SCPC
DAMA technology deliver reasonable user costs.
Impact of user time variations
$0.0000
$0.2000
$0.4000
$0.6000
$0.8000
$1.0000
$1.2000
$1.4000
$1.6000
$1.8000
$2.0000
15,00
025
,000
35,00
045
,000
55,00
065
,000
75,00
085
,000
95,00
0
105,0
00
115,0
00
User time (minutes/yr)
User
cos
t ($/
min
)
Fixed SCPC,MCPC (1/8)
Fixed MCPC(2/8)
SCPC DAMA
Mesh DAMA

148
5.3 Predictive Power of Models The economic models discussed in Chapter 4 were developed with the intent to provide
insight into the predictive economic behavior of different technologies applied to satellite rural
telephone network design. Their implementation and results shown in Section 5.2 allow the
network designer to change variable conditions in order to predict network behavior when the
actual network implementation and operation takes place.
The objective when developing this type of economic model is to predict how real
technologies will behave before even deciding which one will eventually be implemented. The
predictive power of a model is a direct function of its ability to imitate one or more aspects of a
system’s or network’s real-life behavior, which at some point can only be estimated if real data is
not available.
Although there exist a variety of modeling and parametric analysis techniques, sometimes
what is available does not necessarily solve the fundamental problem. Often, the mathematical
representation of the model is not necessarily correct, or the real life system to be modeled may
include parameters unknown to the system designer. The goal, then, is to be able to provide a
simplified model of the system to be analyzed and to try to extract as much information from it
as possible. This will not always generate the desired results, especially if the mathematical
representation of the model is incomplete, or wrongly implemented in the model.
It is common in computer simulation, analysis or modeling inadvertently to introduce
errors, but for that same reason, the programmer must make sure that each line of code is correct
and its results are correctly displayed and interpreted. It is also common for most
communications system’s design to make assumptions and simplifications in order to make the
problem tractable.
If the mathematical models of the system are clearly defined and understood, and correctly
implemented into the analysis model, then the probability of a successful prediction of the
system’s behavior is high. One way to test the correct behavior of a model is by comparing the
simulated model results with a real system measurement or with an analytical solution.
If the system does not have a known mathematical representation, the predictive power of
the model can be obtained by means of indirect parameters, which is the case in this research.
Since there are no known models for satellite telephone network design, the indirect parameter to

149
observe in this case is the economic performance of the system, both from the investor’s point of
view as well as the user cost.
5.4 Summary In this chapter, economic models for a number of satellite technologies were developed and
its results presented. In Section 5.1 the analysis results for the different technologies were
presented and three traffic scenarios were discussed.
In general, it can be said that for low traffic scenarios, the model projections allowed a very
attractive return of investment, with the serious disadvantage that those projections were made
based on a very high assumed user cost. The reason for that high value is that the network was
optimized for a financial break-even point where the capital expenses were very high, which
produced a large revenue when projections were made.
The main characteristic for medium traffic scenarios is that the capital and variable costs
are more reasonable than for low traffic predictions. The user cost is more affordable for the
typical rural user, but still allows large revenue projections over larger networks, again due to
resulting user cost. Figure 5.16 shows the cost-effectiveness of the different technologies.
It was also shown that high traffic scenarios provide the lowest user cost even with reduced
revenue projections ($0.20/min o $0.39/min). This behavior is due to the low user cost
mentioned before. Although the user cost value would be a nice goal for the network designers,
it must be clear that it was obtained using high traffic predictions, which may not materialize and
revenue will not be as expected. In the second part of this chapter a comparison among the
different technologies is presented, comparing different performance metrics that allow
definition of the best technology for each case. The comparisons were made in terms of the
effect of parameter variation upon the system’s performance. These included the impact of
traffic variations as an economic indicator, in this case profits, as well as varying network size on
traffic and cost. Finally, a comparison of user time variations was done by comparing the total
accumulated operational time against user costs per minute for all technologies studied in this
research.

150
Figure 5.16. Cost-effectiveness of the different technologies.
Technology Low traffic Medium traffic Low trafficFixed-SCPC $0.8628 $0.3143 $0.2046Fixed-MCPC (1/8) $0.8716 $0.3172 $0.2063Fixed-MCPC (2/8) $0.2479 $0.1093 $0.0816SCPC-DAMA $1.1829 $0.4210 $0.2686Mesh DAMA $1.8282 $0.6361 $0.3976
Low
traf
fic
Mid
traf
fic
Hig
h tr
affic
Fix
ed S
CP
C
Fix
ed M
CP
C (1
/8)
Fix
ed M
CP
C (2
/8)
SC
PC
DA
MA
Mes
h D
AM
A$0.0000$0.2000$0.4000$0.6000$0.8000$1.0000$1.2000$1.4000$1.6000$1.8000
$2.0000
User cost ($/min)
Traffic Technology
User cost-effectiveness

Chapter 6
Conclusion and Recommendations This research focused on the development and evaluation of a methodology for efficient
and cost-effective rural telephone network design using satellite technology. A set of economic
models to evaluate different combinations of network topologies and multiple access techniques
were created and implemented, and a technical-economic assessment was performed on the
different technologies under different traffic scenarios. Traffic intensity, network size and user
cost per minute were optimized to achieve the network’s economic break-even point under
different conditions and constraints. Important parameters were identified to improve the
process of effective and cost-efficient satellite rural telephone network design.
Rural telephony is a common subject of interest to most large and/or developing count ries.
The search for effective ways to bring telephone service to remote locations has been ongoing
for decades, with technical as well as economic limitations being recurring problems. The
assumption that rural telephony is not economically attractive due to low traffic or low user
income has delayed telephone service implementation in most rural areas of the world. Different
technologies, mainly point-to-point radio, have been proposed and used to provide this service
and most of the time the service has been subsidized.
Satellite communications provides the widest coverage area of all available technologies,
and mobile satellite services have been used for this purpose, but the cost of the service and that
of the earth stations still limits its widespread application. It was recently mentioned at the
United Nations Millennium Summit that half the world population lives with less than $2.00 a
day [Ahe00]. Those people cannot afford telephone calls even with low -cost telephone service
into their villages. The process of optimization for rural telephony is intended for those who can
afford the service.
This research has searched for ways to efficiently and economically provide telephone
service to rural communities in remote locations, with a satellite link as the access to the Public
Switched Telephone Network (PSTN). Different technologies have been proposed for this
purpose and a number of options have been discarded either for technical or for economic
reasons, with the rural application setting at the focus.

152
This research effort focused on the development and evaluation of a methodology for
performance optimization applied to the design of satellite rural telephone network. Common
VSAT satellite network technology was used to implement the syste ms, and typical link budgets
were designed for each case, using typical data from commercially available geostationary earth
orbit satellites.
Mathematical models for the technical and economic behavior of a number of different
technologies were developed using a combination of topologies and multiple access variations.
These models were developed analytically and then implemented as a set of spreadsheets that
allow analysis of the system performance and optimization of specified parameters. Evaluations
were performed on various aspects of network design, bounded by both technical and economic
constraints and applied to projections on traffic and network size to allow future network
predictions and growth.
Based upon these models, important technical parameters frequently used in network
design can be identified and optimized, including traffic intensity and network size, as well as
economic parameters such as user cost and return on investment. This research was intended to
define a methodology to model and analyze generic satellite telephone networks for rural
applications, not to design specific networks or improve existing ones.
Satellite network designers and planners can use the models developed in this research to
evaluate and optimize the process of network design according to their desired parameter
performance requirements
6.1 Summary of Research Chapter 1 of this dissertation provides an introduction to the problem under investigation.
The rural telephony problem is presented along with the typical problems associated to this
application. The economic problems and technological limitations of current rural telephone
systems are emphasized, as well as the justification for using satellite communication systems for
rural telephone service. The basic assumptions and simplifications used in the network design
approach are discussed and presented.
Chapter 2 presents background information and literature review relevant to this effort.
The fundamentals of communication systems design are presented, including other technologies
that have been used for the rural telephony problem. Wireless local loops are discussed as well

153
as their suitability for use in rural telephony. Satellite communications theory and models are
discussed and different types of satellite systems are explained including those used for rural
telephony and new technology. Finally, an introduction into the economic issues affecting the
design of communications networks is presented, with an emphasis on technology assessment
and evaluation techniques.
The quality of service in digital telephony over satellite is explained in Chapter 3. This
chapter is divided between the two dominant networking technologies, the more traditional
circuit-switched networks, compared against the mo re versatile packet-switched networks. In
both cases, the discussion centers more on the quality of service parameters for real -time voice
and their effect on the transmission over the satellite channel. An important part of any
simulation effort is the choosing of the appropriate technology and channel models. Various
satellite architectures and performance parameters are discussed in Chapter 3.
The network design methodology for rural telephone network design is presented in
Chapter 4. The performance metrics required for an efficient and cost-effective network design
are presented, as well as the system’s technical and economic boundaries. Optimization theory is
discussed and its application to communications network design is presented, with emphas is on
the economic parameters that influence telephone network design. Finally, the economic models
developed during this research for four different technologies are presented, along with the
design sequence for optimal network design. A combination of topologies and multiple access
techniques commonly used in satellite networks was applied to the rural telephone problem,
resulting in the Fixed SCPC, Fixed MCPC, Star SCPC-DAMA and Mesh SCPC-DAMA
economic models. The resulting sets of equations for economic performance analysis are
explained and tabulated at the end of Chapter 4.
Chapter 5 contains the simulation results of the four technology models previously
described, the assumptions and simplifications to make the problem tractable, and the
interpretation of the results. Low, medium and high traffic scenarios provided the basis for the
technical and economic assessment, based on a network of one -hundred earth stations or satellite
carriers, and allowed for extended traffic and network size projections. The controlling
parameters allow the behavior of different technical and economic variables to be observed, as
they all change when the economic break-even point is reached at the end of the system’s
projected lifetime. Chapter 5 describes the performance of the network based on different

154
optimization parameters, and compares the impact of varying factors on other network
parameters, placing them in different ranks.
Appendix A contains extensive documentation of the evaluation models, including data
from the different traffic scenarios and from the programs that were used to calculate the
resulting worksheet.
Appendix B contains the preliminary research that produced the novel packet network
architecture for rural satellite network design using a Modified ATM over Satellite (MAS)
architecture and protocol. This architecture was an early result of this research, when packet
switching technologies were studied to provide rural communities with digital capabilities using
packet-switched networks. The architecture was limited in several aspects and the project was
abandoned, although it was an early but important part of this research project.
Appendix C provides copies of conference papers that have been presented in academic
events and are directly related to this research work.
6.2 Conclusions The motivation for this research was to provide technical and economic tools that allowed
an efficient telephone network design over satellite. The rural telephony problem is not new,
several communications technologies have been used in an attempt to solve it, and technical and
financial people agree that it is not economically attractive yet. The most commonly cited
reasons are the generally low income of rural populations, which cannot support telephone
service, and the expected low traffic intensity, which does not guarantee the network’s viability.
The rural telephony problem was evaluated from a technical and economic point of view,
using of satellite technology and produced a set of models to measure and optimize performance
at a reasonable cost. This research demonstrates a method to evaluate satellite communications
networks by optimizing important parameters during the design process. It has defined the most
important technical and economic parameters that affect network design, and provided a novel
set of economic models that result in cost-effective designs.
This research was oriented towards the development of a methodology for the optimization
of technical and economic resources, and to search fo r the best technology for a specific
problem. Therefore, part of this research involved the development of four economic analysis
models for satellite network design, which allow the technical and economic performance of
such networks to be predicted. Analyzing the modeling and evaluation results provides the

155
designer with enough information to make a calculated decision regarding the economic and
technical feasibility of the proposed network.
Another interesting finding was that packet-switching technology is not yet ready to
provide telephone service on public networks. Packet switching technology evolved from
computer networks, which have very different requirements regarding quality of service than
telephone service demands. Even packet-switched satellite networks are being designed with the
Internet and other computer applications in mind, with voice being a secondary application.
Broadband satellite networks are currently using generic GEO satellites with VSAT
terminals, with user capacities up to 2 Mbps and feeder links up to 8 Mbps. Packet switching
satellites are around the corner, and global LEO constellations will probably take a few more
years to achieve financial success. Pricing algorithms are being developed for packetized voice,
since the concept of length of call or distance is irrelevant in packet communications. Most
systems currently charge a flat monthly fee for a quantity of data volume and an extra charge
after the limit is passed.
The rural telephony problem is not yet solved, especially for the low income population,
but it is a feasible solution for a large number of potential users with a higher income. Based
upon the simulation results obtained from this research, it can be stated that the lower boundary
of $0.25/min on user cost can be reached in certain cases, when public telephone offices are
used. This is especially true when the expected traffic intensity per earth station is equal to or
higher than 0.15 Erlangs (9 min/hr).
Individual rural subscribers will appear when an initial public telephone office has become
widely used, people are used to making telephone calls and traffic has increased at the village
level. In this case, the individual subscriber will probably have a higher income than the rest of
the villagers in order to support the service. Most rural telephony systems will need to be
subsidized initially before rural telephony can begin in most countries.
The solution to this problem is to help increase the rural population’s income instead of
lowering user costs. Subsidies cannot last forever. With this is mind, rural telephony must be
viewed as an investment for economic development, not as a public utility.
There are several specific recommendations that can be made as result of the simulations
presented in this dissertation.

156
• The most important parameter in telephone network design is the expected traffic intensity
per node or carrier. It is crucial to estimate the correct traffic value when designing a
network, no easy task when previous information is non-existent. It has been shown in this
research that a very small variation in traffic figures (36 seconds/hour) can create variations
of $3 million in revenues or losses. The network sensitivity to traffic estimation errors
makes any departure from the predicted traffic a risk factor to be seriously considered in
the business plan.
• The projections for traffic and network size generated by the simulations can be misleading.
The large revenues in low traffic scenarios with projected high traffic and large network
can only be reached by charging a high user cost per minute, which is obtained when the
low traffic simulation tries to reach the network’s break-even point. When that same tariff
is projected over a high traffic, large network, the resul ting revenue projections are almost
astronomical, up to $3.5 Billion in one case. The truth is that nobody would pay such high
costs, up to $1.86/min in the same case, thus the real traffic would collapse and losses
would be large. One should not lose sight of how the user cost values were obtained,
especially in low traffic scenarios.
• Satellite user cost per minute is transparent to distance and applies to the satellite link only.
This means the user cost is independent of the distance between the earth stations, or
VSATs and Hub. However, once the call accesses the PSTN, any long distance charge
between the PSTN gateway and the called site will be based upon distance, length of call
and time of day. This long distance charge must be included in the call bill as an additional
charge to the user, on top of the satellite link portion.
• Fixed SCPC, or plain FDMA, is recommended for small to medium size networks only, but
this limitation is not based on the economic evaluation from this research. It is mainly due
to the available satellite bandwidth and power, and the number of carriers that the satellite
can transmit while avoiding intermodulation products between adjacent carriers. This is
rather a technical constraint. Fixed SCPC is an interesting opti on, since it is usually
regarded as a technology that wastes satellite resources. Because of its pre-assigned access
nature, a Fixed SCPC network does not require complex hub nor remote earth stations, thus

157
the capital cost per unit is smaller than with more complex technologies. The hub can be a
very simple earth station with enough transmit power capacity to uplink the necessary
number of satellite carriers to provide service to the network, but nothing else. The main
problem of Fixed SCPC networks is the large capital investment required in the remote
earth stations compared to other technologies, ranging from 35% to 40% of the total first-
year investment. A Fixed SCPC network generates revenue with traffic in the low to
medium traffic range (0.10 to 0.20 Erlangs, or 6 to 12 min/hr) with user cost ranging from
$0.20/min to $0.42/min. This is actually a very cost-effective figure for the user, besides
having an available telephone channel always.
• Fixed MCPC is recommended on medium to high traffic ne tworks since its behavior is very
similar to that of Fixed SCPC networks, only with a higher cost for the VSAT and hub
earth stations. Fixed MCPC is an attractive but somehow deceptive technology, allowing
the use of an earth station by multiple users over the same carrier. The most common
number of TDM telephone sets in commercial systems is eight, thus promising a large
amount of revenue by means of the multiple users and reduced satellite costs. In fact,
revenue will be generated depending upon the expected traffic per telephone set. If there
are eight telephone sets but only one is being used, that same user will have to pay for the
total amount of time the connection is using a satellite carrier. For low traffic (0.05
Erlang) the probability that at least one user is calling is 28%, but for two users it drops to
5%, which means that for only 5% of the time there will be more than one person paying
for the satellite carrier. This technology is definitively attractive on networks with very
high traffic per node, as in medium to large size villages (500 to 1000 inhabitants) with a
high traffic demand, which helps the users to divide costs. Simulation results show that a
single-user MCPC network generates results in the same range as Fixed SCPC. That means
medium to low traffic (0.10 to 0.20 Erlangs, or 6 to 12 min/hr) generates user costs ranging
from $0.20/min to $0.42/min. When two users are calling from the same earth station, the
user cost drops to less than $0.25/min for traffic over 0.10 Erlang (6 min/hr). This is the
best user cost obtained in the simulations, but as mentioned, it happens only 5% of the time
so it is safer to assume the single-caller user cost figures. Some existing satellite
companies have decided to use MCPC networks (Intelsat, Iridium), only to find that the
real traffic is less than expected and have had to change their strategy (Intelsat) or go out of

158
business (Iridium). Again, caution is recommended when observing the projections for
MCPC DAMA technology over large networks and high traffic.
• Star SCPC DAMA technology can be used when the expected traffic per node is assumed to
be medium. In this research, this is between 0.10 and 0.20 Erlangs (6 to 12 min/hr), with
user cost ranging between $0.32/min and $0.50/min. A Star SCPC DAMA network is
recommended in situations when there is a medium to large size network with medium to
low traffic, so the number of carriers allows for a good grade of service for all the network
nodes. Although it is considered a somewhat expensive technology, most of the cost is
generated by the multiple remote earth stations’ capital cost, about 60% of the first year
expenses. The relative cost of the hub is rather low, around 8% of the first year expenses,
mainly due to the network management software for demand assignment, and higher
transmit power capability.
• Mesh SCPC DAMA technology can only be justified when the expected traffic per node is
high, or when there is a need for users to call each other and not necessarily access the
PSTN. Otherwise, it is a very expensive option, with user costs ranging between
$0.42/min and $0.65/min for traffic between 0.15 and 0.25 Erlangs (9 to 15 min/hr).
Lower traffic intensity per node makes it even more expensive. The increase in network
size helps lower user cost per minute values, but if an increase in the number of gateways is
necessary, then the new gateway capital costs nullify the user cost gain. As a
recommendation, in Mesh SCPC DAMA networks it is preferable to increase the traffic
capacity of a mini-hub, rather than increasing the number of mini-hubs with less capacity.
The increment in cost for a mini-hub with more capacity does not equal the cost of a new
mini-hub, even if it means a higher long-distance telephone bill for the user.
In summary, the main thesis of this research work, that an efficient methodology can help
to optimize performance and evaluate economic and technical parameters for rural telephone
network design with current satellite technology, has been proved. The general panoramic of
rural telephony has been discussed, since technology alone cannot solve this problem. The
models developed here show that important information can be extracted from these models

159
when correctly interpreted, and provide a general view of how a system would perform under
certain assumptions.
This research has expanded the understanding of satellite network design and performance
optimization. The results of this dissertation are being prepared for submission to two journals
and a conference. To date, publication of three conference papers has resulted.
6.3 Recommendations for Future Research This research effort has extended the knowledge base of satellite network design in a rural
telephone environment. A novel set of economic models was developed that significantly help
network designers to include performance optimization functions when designing satellite
networks. While the current methodology and models provide enough insight into the network
design optimization problem, extensions of this work may provide even more benefit. It is
recommended that the following areas be investigated.
1. Investigate the causes that make rural telephone network design an economic as well as a
technical challenge, and search for ways to further reduce user cost for technologies different
to the models presented here.
2. Traffic estimation for rural telephony must be seriously researched. Traffic tendencies over
time need to be established, too, since traffic is not uniform from the network’s beginning to
system retirement.
3. Analyze the performance of the IP and ATM packet-switching protocols regarding quality of
service for real-time voice applications with large delay-bandwidth product channels, such as
those found in GEO satellite networks.
4. Investigate the switching capabilities, hybrid topologies, technology-specific economic
models, and pricing algorithms of broadband GEO and LEO onboard processing satellites
5. Analyze the use of operations research theory to extend the network’s optimization
algorithms and include the use of several constraint variables.
6. Investigate the effects of voice compression on the capacity of satellite telephone networks
using different multiple access technologies.

160
7. Analyze the capacity improvement and protocol interaction of satellite telephone networks
when interconnected to wireless local loops for local telephone/data service for cordless,
cellular, PCS or third generation technologies.
8. Investigate satellite and earth station technologies for the Ka and V frequency bands using
digital networks and onboard processing satellites.

161
Bibliography [Abr00] N. Abramson, “Internet Access Using VSATs”, IEEE Communications Magazine, Vol. 38, Num.
7, July, 2000, pp. 60-69.
[Ahe00] B. Ahern, United Nations Millennium Summit: Ireland Address, Permanent mission of Ireland to
the United Nations, United Nations Millennium Summit, New York, 6 September 2000,
http://www.un.org/millennium/webcast/statements/ireland.htm
[Aky97] I.F. Akylidiz, S. H. Jeong, "Satellite ATM Networks: A Survey", IEEE Communications
Magazine, Vol. 35, Num. 7, July 1997, pp. 30-43.
[Alb93] J. Albuquerque, et al., “VSAT Networks in the INTELSAT System”, International Journal of
Satellite Communications, Vol. 11, pp. 229-240, 1993.
[Anv96] D. Anvekar, et al., “Fixed Cellular Rural networks in Developing Countries: A Performance
Evaluation”, Proceedings of the IEEE-ICPWC’96, International Conference on Personal and
Wireless Communications, India, pp. 33-38, 1996.
[Ast99] Astrolink LLC, Welcome to Astrolink, http://www.astrolink.com
[ATM99] ATM Forum, http://www.atmforum.com
[Bar95] J.S. Baras, et al., "Hybrid Network Architectures; A Framework for Comparative Analysis",
Technical Research Report CSHCN T.R. 95-5 (ISR T.R. 95-24), Center for Satellite and Hybrid
Communications Networks, University of Maryland, 1995, http://www.isr.umd.edu/CSHCN/
[Bar96] J.S. Baras, "ATM in Hybrid Networks", Technical Research Report CSHCN T.R. 96-3 (ISR T.R.
96-21), Center for Satellite and Hybrid Communications Networks, University of Maryland,
1999, http://www.isr.umd.edu/CSHCN/
[Bem00] D. Bem, T. W. Wieckowski, R. J. Zielinski, “Broadband Satellite Systems”, IEEE
Communications Surveys and Tutorials, http://www.comsoc.org/pubs/surveys, First Quarter
2000, Vol. 3, Num. 1, pp. 2-15.
[Bha81] V. K. Bhargava, D. Haccoun, R. Matyas, P. P. Nuspl, Digital Communications by Satellite, John
Wiley & Sons, Inc., New York, NY, 1981.
[Bla98] B. S. Blanchard, W. J. Fabrycky, Systems Engineering and Analysis, 3rd edition, Prentice Hall,
Upper Saddle River, New Jersey, 1998.
[Bro97] R. Bronson, G. Naadimuthu, Schaum’s Outline of Theory and Problems of Operations Research ,
McGraw-Hill, New York, 1997.

162
[Chi99] P. Chitre, F. Yegenoglu, "Next Generation Satellite Networks: Architectures and
Implementation", IEEE Communications Magazine, Vol. 37, Num. 3, March 1999, pp. 30-36.
[Cla45] A. C. Clarke, "Extraterrestrial Relays", Wireless World, Number 51, October 1945, pp. 305-308.
[Cla91] M. P. Clark, Networks and Telecommunications: Design and Operation , John Wiley and Sons,
Chichester, England, 1991.
[Com99] Comsys, "The VSAT Report 1999: VSAT industry status report to clients", Communication
Systems Limited, www.comsys.co.uk, 1999.
[Con94] R. Conte, "Rural Telephony: A new approach using mobile satellite communications", PTC '94
proceedings, Pacific Telecommunications Conference, pp. 598-605, Jan. 1994, Honolulu,
Hawaii.
[Con98] R. Conte, T. Pratt, "Remote and Rural Telephony through Hybrid Terrestrial Wireless and
Satellite Networks”, 3rd Wireless Communications Conference IMAPS-WCC’98 proceedings,
pp.69-74, November 1998, San Diego, Ca.
[Con99] R. Conte, T. Pratt, “Rural Telephony Performance with Wireless and Satellite Networks”,
Proceeding of the 2nd IEEE-UCSD Conference on Wireless Communications, pp.21-26, Feb. 28
- March 2, 1999, San Diego, Ca.
[Conn99] D.P. Connors, B. Ryu, S. Dao, "Modeling and Simulation of Broadband Satellite Networks Part
I: Medium Access Control for QoS Provisioning", IEEE Communications Magazine, Vol. 37,
Num. 3, March 1999, pp.72-79.
[Cou93] L. W. Couch, Digital and Analog Communication Systems, 4th Edition, Macmillan Publishing
Company, New York, NY, 1993.
[Cox95] D. C. Cox, “Wireless Personal Communications: What is it?“, IEEE Personal Communications,
Vol. 2, Num. 2, April 1995, pp. 20 - 35.
[Cox96] D. C. Cox, “Wireless Loops: What are They? ”, International Journal of Wireless Information
Networks, Vol. 3, Num. 3, 1996, pp. 125 - 138.
[Cue99] E.G. Cuevas, "The Development of Performance and Availability Standards for Satellite ATM
Networks", IEEE Communications Magazine, Vol. 37, Num. 7, July 1999, pp. 74-49.
[Dav99] R. H. Davis, ATM for Public Networks, McGraw-Hill, New York, NY, 1999.
[Elb97] B. R. Elbert, The Satellite Communication Application Handbook , Artech House, Boston, MA,
1997.
[Ene99] G. Eneroth at al. "Applying ATM/AAL2 as a switching Technology in Third-Generation Mobile
Access Networks", IEEE Communications Magazine, Vol. 37, Num. 6, June 1999, pp. 112-122.

163
[Eva96] B. G. Evans, R. Tafazolli, “Future Multimedia Communic ations Via Satellite”, International
Journal of Satellite Communications, Vol. 14, pp. 467 - 474, 1996.
[Eva99] B. G. Evans, Satellite Communications Systems, 3rd Edition, IEE – The Institution of Electrical
Engineers, Exeter, England, 1999.
[Eve92] J. Everett, Editor, VSATs very small aperture terminals, IEE - Peter Peregrinus, Ltd., London,
UK, 1992
[Fah95] S. Fahmy et al., "A Survey of Congestion Control Techniques and Data Link Protocols in
Satellite Networks", International Journal of Satellite Communications, 1995, available at
http://www.cis.ohio-state.edu/~jain/papers.html
[Fah96] S. Fahmy et al., "On Source Rules for ABR Service on ATM Networks with Satellite Links",
Proceedings of the First International Workshop on Satellite-based Information Services,
November 1996, available at http://www.cis.ohio -state.edu/~jain/papers.html
[Far00] J. Farserotu, “A Survey of Future Broadband Multimedia Satellite Systems, Issues and Trends”,
IEEE Communications Magazine, Vol. 38, Num. 6, June 2000, pp. 128-133.
[Fla97] W.A. Flanagan, Voice Over Frame Relay, Miller Freeman Books, 242 p. 1997.
[Fre96] R. L. Freeman, Telecommunications Systems Engineering, 3rd Edition, John Wiley & Sons, Inc.,
New York, 1996.
[Fru96] M. Frullone, et al., “Advanced Planning Criteria for Cellular Systems”, IEEE Personal
Communications, Vol. 3, Num. 6, December 1996, pp. 10 - 15.
[Gan97] A. Ganz, et al., “On Optimal Design of Multitier Wireless Cellular Systems”, IEEE
Communications Magazine, Vol. 35, Num. 2, Feb. 1997, pp. 88 - 93.
[Garg96] V. K. Garg, E. L. Sneed, “Digital Wireless Local Loop System”, IEEE Communications
Magazine, Vol. 34, Num. 10, October 1996, p. 111 - 116.
[Gil91] Gilat Satellite Networks Ltd., The Book on VSATs 1, A. Malina and Y. Gat, Editors, Gilat
Satellite Networks Ltd., Tel Aviv, Israel, 1991.
[Gil95] Gilat Satellite Networks Ltd., The Book on VSATs 2, J. Kestecher, A. Malina and I. Tick, Editors,
Gilat Satellite Networks Ltd., Tel Aviv, Israel, 1995.
[Gila99] Gilat Satellite Networks Ltd., Gilat Satellite Networks, http://www.gilat.com/gilat/
[Gill99] Gillam Group, "Gillam, Electronics & Telecommunications",
http://www.reality.be/business/gillam/
[Gor95] W. J. Goralski, Introduction to ATM Networking, McGraw-Hill, Inc., New York, NY, 1995.

164
[Had99] M. H. Hadjitheodosiou, A. Ephremides, D. Friedman, “Broadband Access Via Satellite”,
Computer Networks, Vol. 31, 1999, pp. 353-378.
[Hän98] R. Händel, M. Huber, S. Schröder, ATM Networks: concepts, protocols, applications, 3rd Edition,
Addison-Wesley, 1998.
[Has00] M. Hassan, et al., “Internet Telephony: Services, Technical Challenges and Products”, IEEE
Communications Magazine, Vol. 38, Num. 4, April 2000, pp. 96-103.
[Hau94] R.B. Haugen et al., “Radio in Local Loop for Rural & Sub-urban Environments”, Proceedings of
the IEEE-ICPWC’94, International Conference on Personal and Wireless Communications,
India, pp. 17-24, 1994.
[Hen96] J. Henry, M. H. Kori, “DECT - Based Rural Radio Local Loop for Developing Countries”,
Proceedings of the IEEE-ICPWC’96, International Conference on Personal Wireless
Communications, 19-21 Feb. 1996, New Delhi, India, pp. 44 - 46.
[Her00] O. Hersent, D. Gurle, J. P. Petit, IP Telephony: Packet-based multimedia communications
systems, Addison-Wesley, Harlow, England, 2000.
[HNS99] Hughes Network Systems, Products - Satellite Networks - TES Quantum – Direct,
http://www.hns.com/products/snd/tq_dir/tq_dir.htm
[Hud84] H. E. Hudson, When Telephones Reach the Village: The Role of Telecommunications in Rural
Development, Ablex Publishing Corp., Norwood, NJ, 1984.
[IEEE88] “VSAT Networks”, IEEE Communications Magazine, special issue, Vol. 26, Num. 7, July
1988.
[IEEE97] “Broadband via Satellite”, IEEE Communications Magazine, special issue, Vol. 36, Num. 7,
July 1997.
[IEEE99-1] “Satellite ATM Network Architecture”, IEEE Communications Magazine, special issue, Vol.
37, Num. 3, March 1999.
[IEEE99-2] “Broadband Satellite Network Performance”, IEEE Communications Magazine, special
issue, Vol. 37, Num. 7, July 1999.
[Jer92] M. C. Jeruchim, P. Balaban, K. M. Shanmugan, Simulation of Communication Systems, Plenum
Press, New York, NY, 1992.
[Joh95] K. G. Johansen, "Mobile P-Service Satellite System Comparison", International Journal of
Satellite Communications, Vol. 13, pp. 453-471, 1995.
[Joh00] J. W. Johnson, Telephone conversation, 8/1/2000, Wireless World Wide Web Corp. (W4),
http://www.w4.net, San Diego, CA,

165
[Kal96] S. Kalyanaraman, et al., "Performance of TCP/IP using ABR and UBR Services over Satellite
Networks", IEEE ComSoc Workshop on Computer-Aided Modeling, Analysis and Design of
Communications Links and Networks, McLean, VA, October 20, 1996, available at
http://www.cis.ohio-state.edu/~jain/papers.html
[Kal98] S. Kalyanaraman, et al., "Performance of TCP over ABR with Long-Range Dependent VBR
Background Traffic over Terrestrial and Satellite ATM Networks", LCN '98 Proceedings,
1998, available at http//www.cis.ohio-state.edu/~jain/papers.html
[Kes97] S. Keshav, An Engineering Approach to Computer Engineering: ATM Networks, the Internet and
the Telephone Network, Addison-Wesley Longman, Inc., Reading, Massachusetts, 1997.
[Kot97] S. Kota, R. Goyal, R. Jain, "Satellite ATM Network Architectural Considerations and TCP/IP
Performance", Proceedings of the 3rd KA band utilization Conference, Sorrento, Italy,
September 15-18, 1997, available at http//www.cis.ohio-state.edu/~jain/papers.html
[Lal96] K. B. Lal, A. Tulsi, P. Agarwal, “Wireless Personal Communications - Challenges for a
Developing Nation”, Proceedings of the IEEE-ICPWC’96, International Conference on
Personal Wireless Communications, 19-21 Feb. 1996, New Delhi, India, pp. 73 - 77.
[Lan75] F. Land, “Criteria for the Evaluation and Design of Effective Systems”, Economics of
Informatics, Proceedings of the IBI-ICC International Syposium, Mainz, 16-20 Sept, 1974, A.
B. Frielink, Editor, Amsterdam, 1975.
[Lee95] W. Y. C. Lee, Mobile Cellular Telecommunications - Analog and Digital Systems, 2nd. Edition,
McGraw Hill, 1995.
[Leu93] V. C. M. Leung, “Mobile Radio Group Communication by Satellite”, IEEE Transactions on
Vehicular Technology, Vol. 42, Num. 2, May 1993, pp. 121 - 130.
[Li00] B. Li, et al., “QoS-Enabled Voice Support in the Next-Generation Internet: Issues, Existing
Approaches and Challenges”, IEEE Communications Magazine, Vol. 38, Num. 4, April 2000,
pp. 54-61.
[Mar95] G. Maral, VSAT Networks, John Wiley & Sons, Ltd., Chichester, England, 1995.
[Mar98] G. Maral, M. Bousquet, Satellite Communications Systems, 3rd Edition, John Wiley & Sons,
Chichester, England, 1998
[McL97-1] M. McLaughlin, J. O'Neil, "Adapting Voice for ATM Networks: An AAL2 Tutorial", General
DataComm, Inc. document, http://www.gdc.com
[McL97-2] M. McLaughlin, K. Mumford, "Adapting Voice for ATM Networks: A Comparison of AAL1
Versus AAL2", General DataComm, Inc. document, http://www.gdc.com

166
[Mer99] I. Mertzanis, et al., "Protocol Architectures for Satellite ATM Broadband Networks", IEEE
Communications Magazine, Vol. 37, Num. 3, pp. 46 - 54, March 1999.
[Met00] C. Metz, “IP-over-Satellite: Internet Connectivity Blasts Off”, IEEE Internet Computing, Vol. 4,
Num. 4, July-August 2000, pp. 80 - 89.
[Mid99] S. F. Midkiff, "Computer Network Architecture", ECPE 5516 Computer Network Architecture
course notes, Virginia Tech, Blacksburg, VA, Spring 1999.
[Min97] T. Mineno, T. Babji, “Issues and Challenges of Implementing a Wireless Local Loop (WLL)
Based Telephone Access”, Proceedings of the IEEE - ICPWC’97, International Conference on
Personal and Wireless Communications, India, pp. 366 - 370, 1997.
[Moh96] M. Mohorcic, G. Kandus, E. Del Re, G. Giambene, “Performance Study of an Integrated
Satellite/Terrestrial Mobile Communication System”, International Journal of Satellite
Communications, Vol. 14, pp. 413 - 425, 1996.
[Mon95] P. Monsen, “Multiple Access Capacity in Mobile User Satellite Systems”, IEEE Journal on
Selected Areas in Communications, Vol. 13, Num. 2, Feb. 1995. pp. 222 - 231.
[Noe96-1] A. R. Noerpel, et al., “PACS: Personal Access Communications Systems - A Tutorial”, IEEE
Personal Communications, Vol. 3, Num. 3, June 1996, pp. 32 - 43.
[Noe96-2] A. R. Noerpel, "PACS: Personal Access Communications System: An Alternative Technology
for PCS", IEEE Communications Magazine, Vol. 34, Num. 10, October 1996, pp. 138 - 150.
[Och98] R. Ochtel, “Beyond the village telephone: New VSAT opportunities for business in rural markets”,
Satellite Communications, Vol. 22, Num. 10, pp.50 - 52, October 1998.
[Pad95] J. E. Padget, C. G. Günther, T. Hattatori, “Overview of Wireless Personal Communications”,
IEEE Communications Magazine, Vol. 33, Num. 1, January 1995, pp. 28 - 41.
[Pet96] L. L. Peterson, B. S. Davie, Computer Networks: a systems approach, Morgan Kaufmann
Publishers, Inc., San Francisco, CA, 1996
[Pey99] H. Peyravi, "Medium Access Control Protocols Performance in Satellite Communications ", IEEE
Communications Magazine, Vol. 37, Num. 3, March 1999, pp. 62 - 71.
[Pin96] D. S. Pinck, L. Tong, “Satellite - Enhanced Personal Communications Experiments”,
International Journal of Satellite Communications, Vol. 14, pp. 249 - 258, 1996.
[Pra86] T. Pratt, C. W. Bostian, Satellite Communications, John Wiley & Sons, Inc., New York, NY,
1986.

167
[Pri96] K.M. Price, Y. Lazear, "Technologies to Enable Low Cost Satellite Communications", AIAA
International Communications Satellite Systems Conference , 16th, Washington, DC, Feb. 25-29,
1996, pp.1065 - 1075.
[Pro95] J. G. Proakis, Digital Communications, 3rd Edition, McGraw-Hill, Inc., New York, NY 1995.
[Rag95] C. T. Ragsdale, Spreadsheet Modeling and Decision Analysis: A Practical Introduction to
Management Science, Course Technology, Inc., a Division of International Thompson
Publishing, Inc., Cambridge, MA, 1995.
[Rap96] J. Rapeli, “UMTS - A Path to 3rd. Generation Mobile Communications of the 21st Century”,
Proceedings of the IEEE-ICPWC’96, International Conference on Personal Wireless
Communications, 19 - 21 Feb. 1996, New Delhi, India, pp. 58 - 67.
[Rapp96] T. S. Rappaport, Wireless Communications Principles and Practice , Prentice Hall Inc., Upper
Saddle River, New Jersey, 1996.
[Re89] E. Del Re, “A Satellite Mobile System Integrated with the Terrestrial Cellular Network”,
Proceedings of the 1989 IEEE-VTC, Vehicular Technology Conference, pp. 223 - 227.
[Re95] E. Del Re, “The GSM Procedures in an Integrated Cellular/Satellite System”, IEEE Journal on
Selected Areas in Communications, Vol. 13, Num. 2, Feb. 1995, pp.421-430.
[Ric95] M. Richharia, Satellite Communications Systems Design Principles , McGraw-Hill, New York,
NY, 1995.
[Rob98] T. G. Robertazzi, Planning Telecommunications Networks, IEEE Press, Piscataway, NJ, 1998
[Rod96] D. Roddy, Satellite Communications, 2nd Ed, McGraw-Hill, New York, NY, 1996.
[Ros81] J. Rosa, Rural Telecommunications Via Satellite, Telecommunications, November, 1981, pp. 75-
81.
[Ryu99] B. Ryu, "Modeling and Simulation of Broadband Satellite Networks Part II: Traffic Modeling",
IEEE Communications Magazine, July 1999, pp. 48-56.
[SA99] Scientific Atlanta, Inc. Satellite Telecommunications Networks - Skylinx, http://www.Scientific-
Atlanta.com/Products&Services/satellitenewtorks/index.htm
[Saa94] T. N. Saadawi, M. H. Ammar, A. El Hakeem, Fundamentals of Telecommunication Networks,
John Wiley & Sons, Inc. New York, 1994.
[Sch96] R. E. Schwartz, Wireless Communications in Developing Countries: cellular and satellite
systems, Artech House, Boston, MA, 1996.
[Sep84] J. A. Sepulveda, W. E. Souder, B. S. Gottfried, Schaum’s Outline of Theory and Problems of
Engineering Economics, McGraw-Hill, New York, 1984.

168
[Sky00] Skybridge GP, Inc. "Skybridge", http://www.skybridgesatellite.com/
[Spa00] Hughes Network Systems, Wireless Broadband Satellite Network: Spaceway,
http://www.hns.com/spaceway/spaceway.htm
[Spr98] S. Spreizer, "ATM Over Satellite", Application Note, Globecomm Systems Inc, January/February
1998, 11 pages, http://www.globecommsystems.com
[Sta95] W. Stallings, ISDN and Broadband ISDN with Frame Relay and ATM , Prentice Hall, Englewood
Cliffs, NJ, 1995.
[Sta99] R. Stankevich, "Voice -Over-ATM Builds on New Standard: The ATM Adaptation Layer 2 (AAL2)
Breakthrough", General DataComm, Inc. report, http://www.gdc.com
[STM00] STM Wireless, Inc, Rural Telephony Products, www.stmi.com/rural.html
[Ste96] J. Stevens, K. Feller, "Satellite Telecom Services – At What Price?", 16th AIAA International
Communications Satellite Systems Conference, Washington, DC, Feb. 25-29, 1996, pp.1097-
1110.
[Tal98] G. Talmor, T. Meirzon, “Rural Telephony comes into its own”, Satellite Communications, pp. 53-
56, October 1998.
[Tan96] A. S. Tanenbaum, Computer Networks, 3rd Edition, Prentice-Hall, Inc., Upper Saddle River, New
Jersey, 1996.
[Tel99] Teledesic LLC, The Teledesic Network, www.teledesic.com
[Tit99] The Titan Corporation, Titan Wireless, Inc. - Xpress Connection Rural Telephony,
www.Titan.com
[Toh98] C.K. Toh, V.O.K. Li, "Satellite ATM Network Architectures: An Overview", IEEE Network,
Vol. 12, Num. 5, September/October 1998, pp. 61-71.
[Wes94] R. Westerveld, “Wireless trunked access through cellular radio and satellite systems for rural
communications”, Proceedings of the IEEE–IPCWC’94, International Conference on Personal
Wireless Communications, pp. 50-54, 1994.
[Wes96] R. Westerveld, “The Role of Future Satellite Systems for Rural Communications”, Proceedings
of the IEEE–IPCWC’96, International Conference on Personal Wireless Communications, 19-
21 Feb. 1996, New Delhi, India, pp. 39-43.
[Wit00] M. Wittig, “Satellite Onboard Processing for Multimedia Applications”, IEEE Communications
Magazine, Vol. 38, Num. 6, June 2000, pp. 134-140.
[Wu84] W. W. Wu, Elements of Digital Satellite Communication, Vols. 1 & 2, Computer Science Press,
Rockville, MD, 1984.

169
[Yu97-1] C. C. Yu, et al. , “Low Tier Wireless Local Loop Radio Systems - Part 1: Introduction”, IEEE
Communications Magazine, Vol. 35, Num. 3, Mar. 1997, pp. 84 - 92.
[Yu97-2] C. C. Yu, et al., “Low Tier Wireless Local Loop Radio Systems - Part 2: Comparison of
Systems”, IEEE Communications Magazine, Vol. 35, Num. 3, Mar. 1997, pp. 94-98.
[Yue96] O. C. Yue, “Design Trade-Offs in Cellular/PCS Systems”, IEEE Communications Magazine,
Vol. 34, Num. 9, September 1996, pp. 146 - 152.

170
Appendix A
Network Design and Simulation Documentation
This appendix presents the documentation for the parametric design and analysis of the
models used in this research, specifically the results of the low, medium and high traff ic
scenarios for each model.

171
Appendix B
Modified ATM over Satellite (MAS) Architecture and
Protocol
Section 3.3 of the main part of this research mentions some of the basics of packet
switching technology and briefly introduces to Asynchronous Transfer Mo de (ATM) technology
when used to transmit voice telephone over satellites.
One of the earlier directions of this research was oriented towards the use of ATM
technology over satellites, which could allow future use on packet switched networks, especially
for Internet applications. This work was not continued as the main research subject, but the basic
idea is still attractive and valid, and a short description of that work is presented in this appendix.
Since the direction of this research is based on a mo dified version of the ATM standard, a
brief description of ATM follows. This description is presented in order to introduce the
parameters and its posterior variants that make the Modified ATM over Satellite (MAS)
architecture and protocol models.
B.1 Asynchronous Transfer Mode (ATM) Reference Model ATM provides an optimum protocol format for voice, video and data communications,
where cells of each can be intermixed. ATM cells can be transported over SONET, SDH, E1/T1
and other popular digital formats. Cells can also be transported contiguously without and
underlying digital network format.
Voice and data have very different requirements regarding time sensitivity. Voice cannot
wait for the long processing and ARQ delays that are not relevant in other data applications, so
ATM is able to distinguish between Constant Bit Rate (CBR) and Variable Bit Rate (VBR)
applications. Voice service is typical of CBR, so for this research, all cases involved CBR over
ATM Application Layer type 1 (AAL1), described next with the Broadband ISDN reference
model. ATM was designed to operate over a Broadband ISDN (B-ISDN) network.

172
B.1.1 B-ISDN Protocol Reference Model (PRM) ATM provides for different applications to interwork together by using a layered protocol
reference model, defined by ITU-T Recommendation I.321 and called the B-ISDN Protocol
Reference Model (PRM), shown in Figure B.1. It offers a mechanism based on a number of
application layers with common interfaces between them and different protocols that allows
immediate layers to operate together.
Figure B.1. B-ISDN protocol reference model (ITU-T Rec. I.321)
B.1.1.1 Cells and Packets
The terms "cell" and "packet" are often used equivalently, generating confusion as to which
is which. A cell is defined as "the basic Payload Data Unit (PDU) when using packet switching.
In ATM a cell consists of 53 bytes (424 bits), divided into a 5 Byte ATM header and a 48 Byte
payload", as described in [Dav99]. On the other hand, the same reference defines packet as "a
logical grouping of information that contains a header and/or trailer, and a payload", which in
ATM would be a 53 Byte data unit, thus, a cell according to their previous definition. Wishing
to avoid such confusion, in this document the following convention is established:
A cell is the basic payload data unit, segmented from the original information bit stream,
and it is created at the Network layer of the OSI model, or its equivalent on the ATM and
Internet/IP layered models, according to its specific application type.
Physical Layer
ATM Layer
ATM Adaptation Layer
Higher Protocols Layers
Management Plane
Control Plane User Plane
Layer
Mgmt
Plane Mgmt
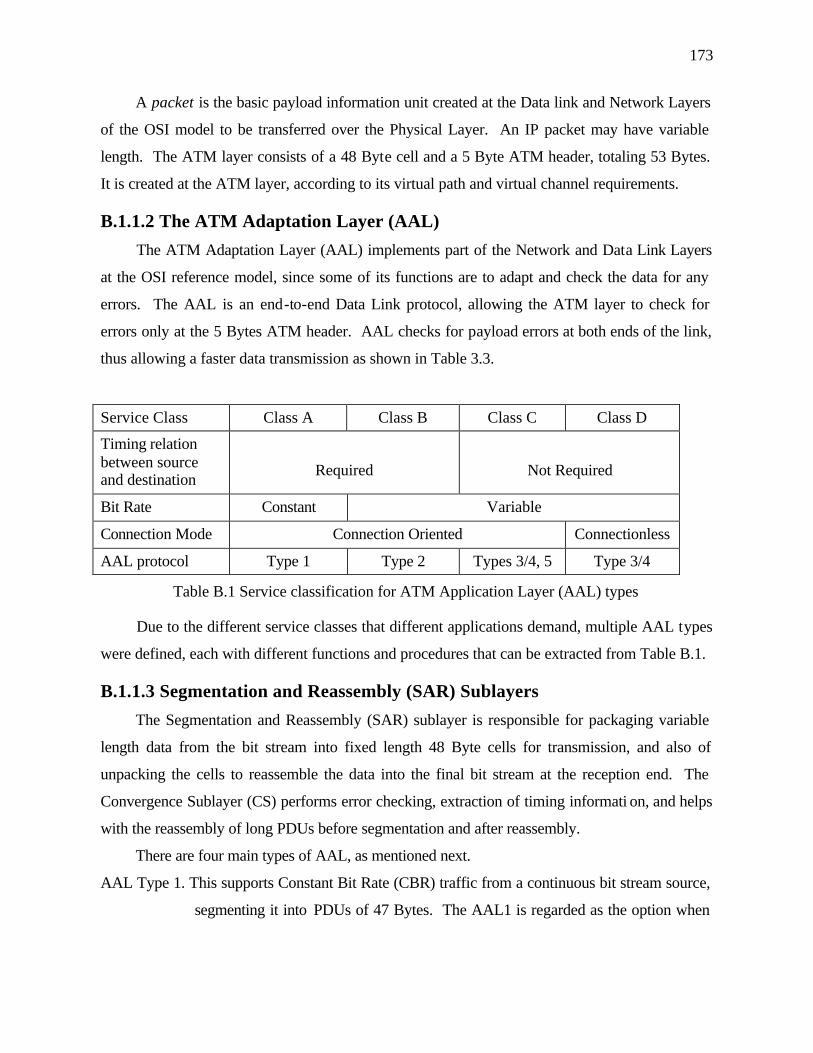
173
A packet is the basic payload information unit created at the Data link and Network Layers
of the OSI model to be transferred over the Physical Layer. An IP packet may have variable
length. The ATM layer consists of a 48 Byte cell and a 5 Byte ATM header, totaling 53 Bytes.
It is created at the ATM layer, according to its virtual path and virtual channel requirements.
B.1.1.2 The ATM Adaptation Layer (AAL)
The ATM Adaptation Layer (AAL) implements part of the Network and Data Link Layers
at the OSI reference model, since some of its functions are to adapt and check the data for any
errors. The AAL is an end-to-end Data Link protocol, allowing the ATM layer to check for
errors only at the 5 Bytes ATM header. AAL checks for payload errors at both ends of the link,
thus allowing a faster data transmission as shown in Table 3.3.
Service Class Class A Class B Class C Class D
Timing relation between source and destination
Required
Not Required
Bit Rate Constant Variable
Connection Mode Connection Oriented Connectionless
AAL protocol Type 1 Type 2 Types 3/4, 5 Type 3/4
Table B.1 Service classification for ATM Application Layer (AAL) types
Due to the different service classes that different applications demand, multiple AAL types
were defined, each with different functions and procedures that can be extracted from Table B.1.
B.1.1.3 Segmentation and Reassembly (SAR) Sublayers
The Segmentation and Reassembly (SAR) sublayer is responsible for packaging variable
length data from the bit stream into fixed length 48 Byte cells for transmission, and also of
unpacking the cells to reassemble the data into the final bit stream at the reception end. The
Convergence Sublayer (CS) performs error checking, extraction of timing informati on, and helps
with the reassembly of long PDUs before segmentation and after reassembly.
There are four main types of AAL, as mentioned next.
AAL Type 1. This supports Constant Bit Rate (CBR) traffic from a continuous bit stream source,
segmenting it into PDUs of 47 Bytes. The AAL1 is regarded as the option when

174
transmitting Time Division Multiplex (TDM) real-time voice (telephony) and
video applications.
AAL Type 2. This provides Variable Bit Rate (VBR) traffic, needed in bandwidth efficient
transmission of short packets (less than 48 Bytes). This AAL is mainly intended
for low bit rate, delay-sensitive analog applications such as audio and video,
which require timing information but do not have a constant bit rate. One such
example would be compressed digital video or voice from a vocoder.
AAL Type 3/4. Initially AAL 3 was defined to provide VBR service on connection oriented data
applications, and AAL 4 was defined to provide the same service in
connectionless data services but have since merged into a single AAL type.
AAL Type 5. This protocol was developed in order to offer connection-oriented services for data
applications with a lower overhead than AAL 3/4 presented. It is a simpler and
more efficient AAL protocol, especially designed to match the needs of LAN
equipment manufacturers and high data rate, connection oriented users [Mid99].
B.1.1.4 The ATM Layer
The ATM layer defines the structure of the ATM packet through the introduction of the 5
Byte ATM header into the 48 Byte payload cell. It is in charge of switching and routing ATM
packets throughout the ATM network, with some functions of the OSI Data Link Layer. The
ATM Layer defines the routing of the packet throughout the communications process by
allowing other switches to read its ATM header and send packets according to its previously
defined virtual route.
B.1.1.5 The ATM Header
The 5 Byte (40 bits) long ATM header contains the information required for the packet to
travel the ATM network through its correct virtual connection path, previously defined when the
initial connection was established. This is done by assigning a Virtual Path Identifier (VPI) and
a Virtual Channel Identifier (VCI) to each packet, so the ATM switches throughout the network
know how the routing will be done in each case. There are two types of ATM packets,
depending upon the physical facilities faced by the packet: the end user and network interface
(UNI) or between network switches (NNI).

175
B.1.1.6 The ATM Physical Layer
The ATM Physical Layer practically corresponds to the Physical Layer in the OSI
reference model. It is concerned with the transmission of data packets over a physical
communications medium connecting two ATM devices and includes all electrical, mechanical,
functional and procedural functions and characteristics for access to the physical link. It is
comprised of two sublayers. The first is the Transmission Convergence (TC) sublayer, which
transforms the flow of cells into a steady flow of bits and bytes for transmission over the
physical medium. The second is the Physical Medium Dependent (PMD) sublayer, which
defines the parameters at the lowest level, such as speed of the bits on the media. This is
described in [Dav99] and [ATM99], as adapting the electrical bits to the needed medium
waveform, either electrical (cables, wires), optical (fibers) or electromagnetic (radio, satellite).
It is in this sublayer that ATM over Satellite networking takes place, considering LEO or GEO
broadband ATM networks, usually with on-board processing satellites.
B.1.1.7 ATM Routing
As mentioned before, ATM is a "connection-oriented" transfer mode, which means that
although the circuit is packet-switched, the bits always follow the same path during the
connection period. The process of routing in an ATM network is done by a cross-connect
device called a "switch", which supports connections at the Virtual Path (VP) level, forwarding
packets to other switches across the network according to a connection plan stored in memory,
also called a "routing table". At the beginning of the call a virtual path is defined, so all packets
follow the same route through the same ports.
Proposed broadband satellite networks are developing on-board processing technology that
allows the use of the satellite as a network router, or as they call it, a "Switch in the Sky", which
will allow faster routing and forwarding. Since satellites can reach longer distances, it is
expected that less processing time will be required with the possibility of lower latency, although
propagation time on satellite networks will still play a significant role in overall latency [Far00].
B.2 Research Plan As mentioned throughout this work, there is a great need to provide telephone service to
under-served rural communities around the world. A research goal was established, based upon

176
the study for cost-efficient and technically sound solutions, considering the use of GEO satellite
systems and broadband networks. This research proposal presented the preliminary review and
technological foundations for a larger and original study on the subject or satellite rural
telephony.
B.2.1 Preliminary Review of the Modified ATM over Satellite
(MAS) Protocol and Architecture This research study proposed the foundations and steps required to orient results in a rural
telephony application over satellite using packet-switching technology. The defined steps to
properly define the MAS model are described as follows.
• To develop a complete and integrated model of a Modified-ATM-over-Satellite (MAS)
network architecture and protocols, including ATM Application Layer (AAL) protocols for
classes 1 and 2. Protocols for AAL classes 3/4 and 5 may also be implemented, if deemed
necessary.
• To test all user and management protocols in a Matlab simulated environment, und er bit and
burst error conditions similar to those found in digital satellite transmissions.
• To implement the MAS architecture and protocol models into the OpNET modeling tool for
GEO satellite rural telephony and digital networks.
• To simulate a hypothetical rural telephone network under varying traffic loads, network size
and propagation conditions, and observe the Quality of Service (QoS) indicators and other
important parameter's performance.
B.2.2 Expected Results This research work has allowed the study and analysis of satellite rural telephone networks,
its main characteristics, parameters and quality indicators. It can also allow the integration of a
computer network standard such as ATM to a voice network like rural telephony. It allows the
study of communications theory from a systems level to the solution of a specific problem. The
expected results from this work were:
• The study of packetized voice transmission via a GEO satellite, and its latency and
information degradation effects in its desired Quality of service.

177
• The application of the systems engineering process to basic telecommunication systems
design considering the life cycle process approach.
• The development of a simulation tool for ATM-compatible packet transmission and
reception for voice and data.
• The definition and specification of a new set of user and management protocols for an ATM-
compatible network
• The development of a new OpNET module for user and management traffic in an ATM-
compatible VSAT network simulation through a GEO satellite.
B.2.3 Expected Contributions Once this study were completed, a comprehensive and integrated analysis of the MAS
network architecture and protocols would be obtained. The following aspects were considered
original and to be new contributions in this analysis.
• Previous technologies have tried to solve the satellite rural telephone problem by means of
low bit rate voice transmission through circuit switched networking satellites, mainly on a
narrowband RF channel using Demand Assignment Multiple Access (DAMA), with no
possibility for higher bit rate applications. In this work it could be possible to use packet
switching technology that allows the transmission of other applications as well as voice. Bit
rate capacity could be increased, although it would still depend upon the Remote Earth
Station (RES) transmit power limitations.
• Practically all ATM satellite systems currently operational or proposed include the full ATM
header during the satellite link, thus increasing bandwidth and bit rate, or decreasing
throughput. Satellites without on-board processing capacity do not use this field, which
further reduces system throughput and adding processing delay to overall latency. Satellites
with on-board capacity are out of this research boundaries due to increased costs and
complexity.
• The MAS network architecture was planned to optimize overall latency and Quality of
Service in real-time applications such as voice transmission through GEO satellites.

178
• A new network architecture would be developed and specified, including the definition of its
protocol layer stacks for different applications, packet and parameter fields, as well as its
corresponding interfaces.
• The new architecture was expected to provide rural users not only with telephone service, but
also with new digital packet technology, fully compatible with one of the newest information
network technologies, ATM. Multiplexing capacity was included at each terminal.
The use of widely available VSAT technology, although not new in satellite rural
telephony, is being used for ATM-compatible transmission over generic GEO satellites. Most
future ATM-capable satellite systems will feature on-board switching and processing, requiring
special portable terminals or telephones. The MAS architecture allows for common wired or
wireless connection to the Remote Earth Station.
B.3 Preliminary Research Results This study describes the design of satellite rural telephony networks as a primary function,
with the capability to offer transmission of other packet-switched data applications over the same
network as a secondary function. The main goal in rural telephony network design is to provide a
cost-efficient telephone service to rural communities by offering Quality of Service through the
use of the best possible technology available.
After a long time studying currently available technology for satellite rural telephony, it
was found that several networks, architectures and technologies are currently offered by different
companies throughout the world. Nevertheless, none of them gives enough attention to the
boundaries previously set on Section 3.3 on this same document for a satellite rural telephone
system, therefore a new or modified architecture and protocols were needed.
ATM was chosen as the main standard to work with due to its many advantages regarding
voice transmission as well as multimedia capabilities and almost universal compatibility with
most Public Switched Telephone Networks (PSTN) around the world. A few modifications were
made to the standard ATM architecture and protocols, which give a better performance over the
satellite segment for the desired application.

179
B.3.1 Initial System Architecture Definition A telephone network needs to be designed for a rural community at both the local area fo r
local traffic as well as the long distance link to the PSTN or other digital communication
networks. In the case of rural communities with varying population sizes, the local area problem
is to be avoided, rather focusing this work on the long distance connection via satellite.
One important objective is this work is to be used in future digital communications
networks for both voice and data applications, as well as low -bit rate video services, such as
Tele-conferencing and Tele-education. With that objective in mind, and due to the growing
presence of networks carrying all types of digital multimedia, this work will try to fit the specific
application of voice, in this case telephony, through a packet-switched architecture for public
communications networks. This work is based on the increasingly popular Asynchronous
Transfer Mode (ATM) technology, a packet-oriented transfer mode to be used over a Broadband
Integrated Services Digital Network (B-ISDN), which allows the delivery of high bit rate
services and integrates video, voice and data through a single network infrastructure [Dav99].
Since ATM was designed to operate over B-ISDN channels, which are mostly based on
fiber optic lines, the introduction of ATM over satellite channels has brought many new
challenges, which have been studied extensively [IEEE97, IEEE99-1, IEEE99-2]. Nevertheless,
the problems and proposed solutions involved mainly data (Internet) and high-speed video
transmission, and invariably from urban sites. Thus the specific area of telephone transmission
from rural sites has not been studied with enough intensity so as to provide a cost-effective,
technically sound network design. This work is headed in that direction, proposing a modified
version of the ATM standard, specially adapted for telephone networking through a generic
Geostationary Earth Orbit (GEO) satellite. The objectives are to provide a telephone Quality of
Service comparable to land telephone lines, only with higher latency due to the satellite link.
B.3.2 Quality of Service Indicators A network architecture and protocol will be defined based upon QoS parameters that
provide efficient network design and service. The traffic parameters to be closely followed will
be Peak Cell Rate (PCR), Sustainable Cell Rate (SCR), Minimum Cell Rate (MCR) and
Maximum Burst Size (MBS), which will define the QoS of the desired services (CBR over AAL
1 and VBR over AAL 2). To obtain this, it is needed to negotiate a traffic contract that provides

180
QoS on network parameters such as Cell Loss Ratio (CLR), Cell Delay Variation (CDV) and
Cell Transfer Delay (CTD). All parameters mentioned above will coexist in an environment
composed of a Modified ATM over Satellite (MAS) architecture and protocol, explained next.
B.3.2.1 Latency
The MAS architecture was designed based upon minimizing end-to-end delay during the
satellite segment of the network. Although propagation time can not be reduced, a number of
small functions were eliminated with the ATM and Physical Layers, not considered during the
satellite portion of the network operation.
B.3.2.2 Bit and Packet Errors
Bit error rate (BER) and Packet error rate (PER) indicators will be monitored during the
simulation process in order to provide an overview of the MAS network performance. Random
errors at the bit and burst levels will be simulated following various probability density
functions, according to typical performance measurements.
B.4 Modified ATM over Satellite Network Architecture and
Protocols
B.4.1 Overall MAS Network Architecture A new point-to-multipoint satellite architecture for digital networks has been developed as
part of this research involving a VSAT-like packet network transmitting ATM payload cells. A
low operational cost is expected by using typical transponder bandwidth on a generic bent-pipe
GEO satellite using low cost VSAT remote terminals a star configuration network. Any
available RF frequency band can be used on this network, depending upon available satellite
coverage and bandwidth. Low capacity VSAT remote earth station terminals are used for rural
access applications.
The private digital network consists on up to 256 Remote Earth Stations (RES) and one
Gateway Earth Station (GES) with a back-up, interconnecting the remote private networks to a
public or another (larger) private network as shown in figure 4.1. Both telephone and data
networks can operate on this architecture, according to its payload type and ATM Application
Layer (AAL) .

181
Figure B.2. Modified ATM over Satellite (MAS) network architecture
Each RES can be connected to a local digital communications network (LAN, ATM,
telephone), allowing satellite access to up to 4 switched or multiplexed simultaneous users per
remote site, and up to 1024 simultaneous users on the complete satellite network. This system
uses an ATM-compatible architecture suitable for cell and packet transmission over a GEO
satellite network.
Modifications are made in order to adapt the system to a large delay connection so that it
does not require waiting for acknowledgment. A remote LAN, ATM or wired/wireless digital
telephone network can be connected to the Remote Earth Station (RES) for long-distance
satellite routing to a private or public data network, as well as the PSTN, through a Gateway
Earth Station (GES). The GES is the heart of the satellite-based system; it controls the RES
VSAT network and acts as a gateway to the digital packet-switched networks.
B.4.1.1 Remote Earth Station (RES) Architecture.
The Remote Earth Station is based on a number of subsystems that help deliver information
both ways: a packet to the satellite network, and user data to the local network. This is
accomplished by means of several interfaces, some of them standardized and some of them
especially designed for this architecture, which is called MAS network architecture. In the case
of voice (telephone) transmission, the ATM Application Layer's Segmenting And Reassembly
(SAR) subsystem, which segments the received voice (or any other application, in a general
case) into typical ATM payload cells and adds the corresponding AAL header.
ATM
RES 1
RES 2
RES 3 RES 256
PSTN, ATM
ATM GES
GEO Satellite
MAS
MAS
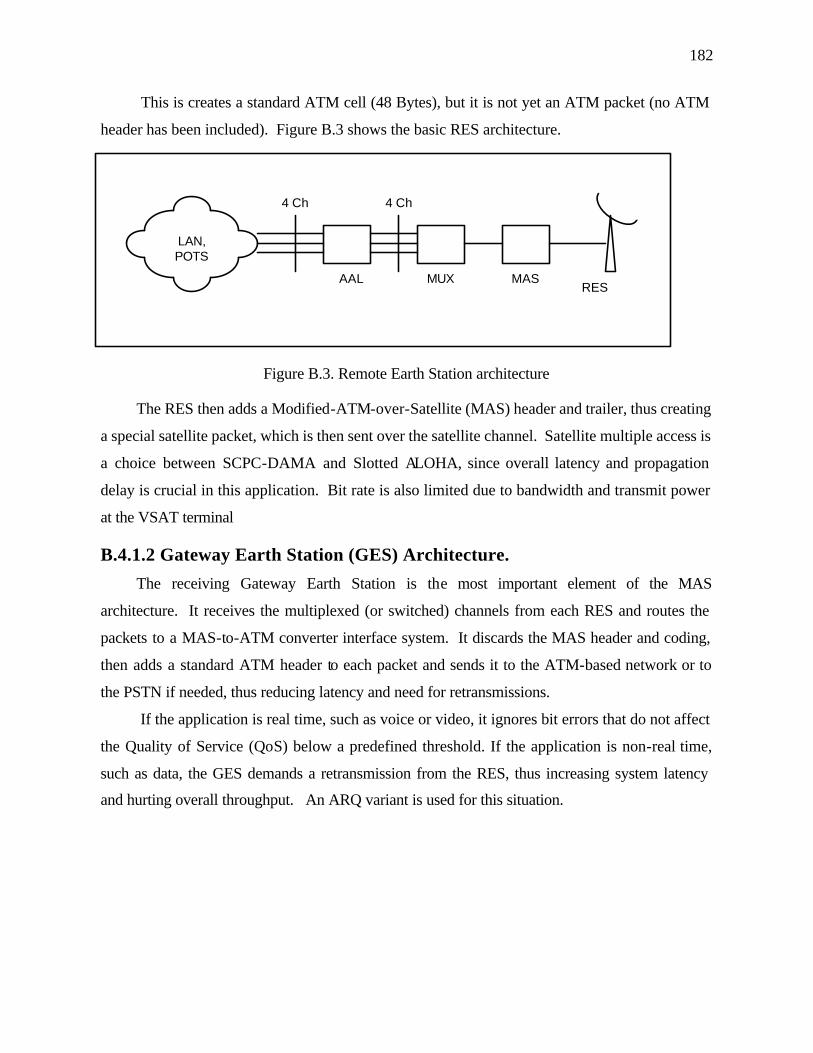
182
This is creates a standard ATM cell (48 Bytes), but it is not yet an ATM packet (no ATM
header has been included). Figure B.3 shows the basic RES architecture.
Figure B.3. Remote Earth Station architecture
The RES then adds a Modified-ATM-over-Satellite (MAS) header and trailer, thus creating
a special satellite packet, which is then sent over the satellite channel. Satellite multiple access is
a choice between SCPC-DAMA and Slotted ALOHA, since overall latency and propagation
delay is crucial in this application. Bit rate is also limited due to bandwidth and transmit power
at the VSAT terminal
B.4.1.2 Gateway Earth Station (GES) Architecture.
The receiving Gateway Earth Station is the most important element of the MAS
architecture. It receives the multiplexed (or switched) channels from each RES and routes the
packets to a MAS-to-ATM converter interface system. It discards the MAS header and coding,
then adds a standard ATM header to each packet and sends it to the ATM-based network or to
the PSTN if needed, thus reducing latency and need for retransmissions.
If the application is real time, such as voice or video, it ignores bit errors that do not affect
the Quality of Service (QoS) below a predefined threshold. If the application is non-real time,
such as data, the GES demands a retransmission from the RES, thus increasing system latency
and hurting overall throughput. An ARQ variant is used for this situation.
MUX AAL
LAN, POTS
RES
4 Ch 4 Ch
MAS

183
Figure B.4. Gateway Earth Station (GES) architecture
B.4.2 MAS Protocol Layer Architecture. The MAS protocol must be properly integrated into the new network's protocol layer
architecture, which helps define all new interfaces in the whole network, basically at the RES
and GES ends of the satellite link. This will allow illustrating what element is needed at which
stage, in order to correctly specify the new network architecture. Still, it must be able to interact
with standard ATM interfaces at the output of the GES's MAS segment, therefore the upper
layers of the MAS protocol must comply fully with the ATM standard protocol throughout the
network, as shown in figure B.5. The MAS management protocol stack must follow this
requirement, too.
Figure B.5. MAS protocol layer architecture.
B-ISDN ATM WAN,
PSTN
MAS GES MUX
4 Ch 4 Ch
AAL ATM
Application
AAL
MAS
S-MAC
S-Phys
Remote Terminal
RES
Satellite
Satellite
Gateway Earth Station
GES
AAL
ATM
Physical
Application
End Network
ATM/PSTN
S-MAC
S-Phys
S-MAC
S-Phys
AAL
MAS
AAL
ATM
Physical

184
As Figure B.5 shows, the MAS network architecture does not depend on on-board
processing satellites, and ATM switching is not performed during the satellite link segment,
therefore no virtual paths or channels are needed. The MAS packets are addressed between
RES and GES through their unique RES and MUX user fields in the MAS header. After the
MAS packet is received at the GES, it correctly identifies the user station and channel, drops the
MAS overhead and creates an ATM Virtual Path and Channel (VPI/VCI) field at the new ATM
header on a UNI interface.
These new fields are created at the GES during the initial set up at the beginning of the call,
and define VPI and VCI information. The GES' main function is to correctly route packets
between the ATM and the MAS networks, thus requiring much computational power (memory,
buffering, high-speed routing, packet re-assembly) for network operation as well as network
management functions. The high complexity demanded from the Gateway Earth Station is
balanced by the simplicity (and lower cost) of the satellite and multiple Remote Earth Stations.
B.4.2.1 MAS network traffic capacity.
The proposed MAS network architecture allows up to 256 remote earth station to
communicate to a larger network via satellite through the GES. An important parameter in any
communications network is its traffic capacity at certain load traffic. Since each RES RF carrier
allows up to 4 AAL 1 multiplexed users, theoretically it could serve 1024 Continuous Bit Rate
(CBR) simultaneous users, but telephone theory shows that, depending upon the expected or
measured traffic, many available telephone lines will be idle most of the time. It is important to
define the required satellite RF bandwidth for the MAS network, since this will heavily affect the
viability of the rural network.
Defining the correct multiple access technique to the satellite is crucial in this phase of the
network design, since it allows the network's RF channel specification with considerable less
bandwidth than the required in a fixed Frequency Division Multiple Access (FDMA) or Time
Division Multiple Access (TDMA) environment.
In the first case the FDMA network requires one RF channel for each RES, resulting a very
large satellite bandwidth, which is expensive for the network operator, and if unused most of the
time results in an inefficient network design. On the other hand TDMA requires higher data
rates and, therefore, more carrier bandwidth, which demands larger antennas and powerful
transmitters at the RES, thus increasing the overall cost of the network.

185
For a 256 RES rural network at 128 kbps per terminal at QPSK, with 0.25 Erlang traffic
per RES would require 64 100 kHz channels (6.4 MHz total satellite bandwidth) if a SCPC-
DAMA multiple access is used.
B.4.3 MAS Protocol Specification
B.4.3.1 MAS Protocol Packet Model
The new protocol created in this research has been designed to allow all RES stations in the
network to communicate with the Gateway Earth Station as required by the MAS satellite system
architecture. The new protocol includes information regarding the application type, its cell
information as well as its RES of origin and multiplexed port at that specific RES. Next, the
MAS protocol is explained, along with an indication of each bit field in it.
The Modified-ATM-over-Satellite (MAS) packet was assigned the bit distribution shown
in the following figure. The payload data may be any type of data, segmented according to its
ATM Application Layer (AAL) category (CBR, VBR, ABR, etc.) but its total packet length must
always be 53 Bytes (424 bits), as shown on Figure B.6 for AAL type 1 (CBR). The same figure
also shows the percentage of user information (payload), which helps explain the protocol's
information carrying efficiency (almost 89%).
53 Bytes (424 bits)
24 bits (5.6 %) 8 bits (1.9 %) 376 bits (88.7 %) 16 bits (3.8%)
MAS header AAL1 header Payload data MAS trailer
1 25 33 409 424
Figure B.6. General structure of the MAS packet model and overhead distribution for AAL 1.

186
B.4.3.2 Structure of the MAS User Protocol Model. The MAS protocol structure is presented next for real-time voice transmission, as it would
appear on the rural telephony case. The parameters presented are assuming Constant Bit Rate
(CBR) service, class 1 ATM Adaptation Layer (AAL1) and the required MAS header and trailer
to be used over the MAS network. Figure B.7 shows this process from application to MAS
physical layers.
Digitized voice stream (real-time)
101010010001001001010001010101001010100101110010101000101001011101101010
Segmented CBR voice cells (47 Bytes each) 376 bits
Payload Payload Payload Payload Payload
47 Bytes
(AAL header class 1)
1 Byte
CSI SN CRC CBR Payload
1 bit 3 bits 4 bits 376 bits
MAS header and payload 48 Bytes
RTI UCI ALT PT CLP CRC PDU (Payload) CRC
8 bits 2 b 3 b 3 b 1 b 7 bits 384 bits 16 bits
ATM satellite packets 53 Bytes
424 bits
Figure B.7. Protocol reference model for MAS packet encapsulation (AAL type 1 case)
187
Table B.2 describes each parameter shown in Figures B.7 and B.8, and their individual
position in the MAS packet along with some comments. An important issue to be described in
detail later is that the MAS packet uses three different error control fields with a different
application each, as explained next.
The AAL header includes a CRC field at the end of the header, which is part of the ATM
standard and is used to detect and correct bit errors that may have been introduced during the
packet transmission. This field uses a 4-bit error detecting and correcting code, which allows
correction of any change at the AAL header Convergence Sublayer Indicator (CSI) and Segment
Number (SN) fields. All headers must have ample redundancy to allow recovery of the header
information and avoid losing the complete packet.
The MAS header also includes a CRC field, also called Header Error Correction (HEC)
field, which is a 7-bit error detecting and correcting code that ensures the correct addressing of
the MAS packet over the satellite link. It keeps the RTI, UCI, ALT, PT and CLP fields from bit
errors that could affect the packet's correct addressing.
The MAS trailer includes the PED, which is a 16-bit error detecting-only field, used to
detect error in the payload. If an error appears, it signals the GES about it and depending upon
the packet's application it request a retransmission (data transmission case only) or allow the
packet to be used as it is (real-time voice and video cases). The reasoning behind this choice is a
crucial one: speed vs. precision.
It is assumed that real time applications such as voice and video include a great deal of
redundancy and a few bit errors can be accepted as long as the packet is not lost. In this case a
retransmission request over the satellite link will greatly affect the QoS of the real-time
application. On the other hand, precision is more important for data transmission, so if payload
errors are detected at the receiving end of the link a retransmission is requested and the erroneous
packets are sent again.
The receiving terminal, either RES or GES, will accommodate the received packets and
will wait for the retransmitted packet to arrive before delivering the subsequent packets in the
initial order of presentation. This requires a Selective Repeat ARQ (Automatic Repeat Request)
type of coding, and a great deal of buffering at both ends of the link. The receiving earth station
will make this choice based upon the Application Later Type (ALT) field on the MAS header,
which indicates the class of service being transmitted (CBR, VBR, ABR, etc.) on its 3-bit field.

188
Figure B.8. Structure of the MAS packet: MAS header and trailer, AAL 1 overhead fields
MAS satellite packet
53 Bytes
424 bits total packet size
Payload data AAL header MAS header CRC CRC CRC
16 bits (3.8%)
376 bits (88.7%)
8 bits (1.9%)
24 bits (5.6%)
MAS header AAL1 header Payload data MAS
1 25 409 33 424
CRC = Error detecting and correcting field (necessary on headers)
CRC = Error detecting only field (applied to payload only)
8 bits 2 3 3 1 7 1 3 4 376 16
RTI UCI ALT PT CLP HEC CSI SN CRC Payload data PED
1 9 11 14 17 18 25 26 29 33 409 424
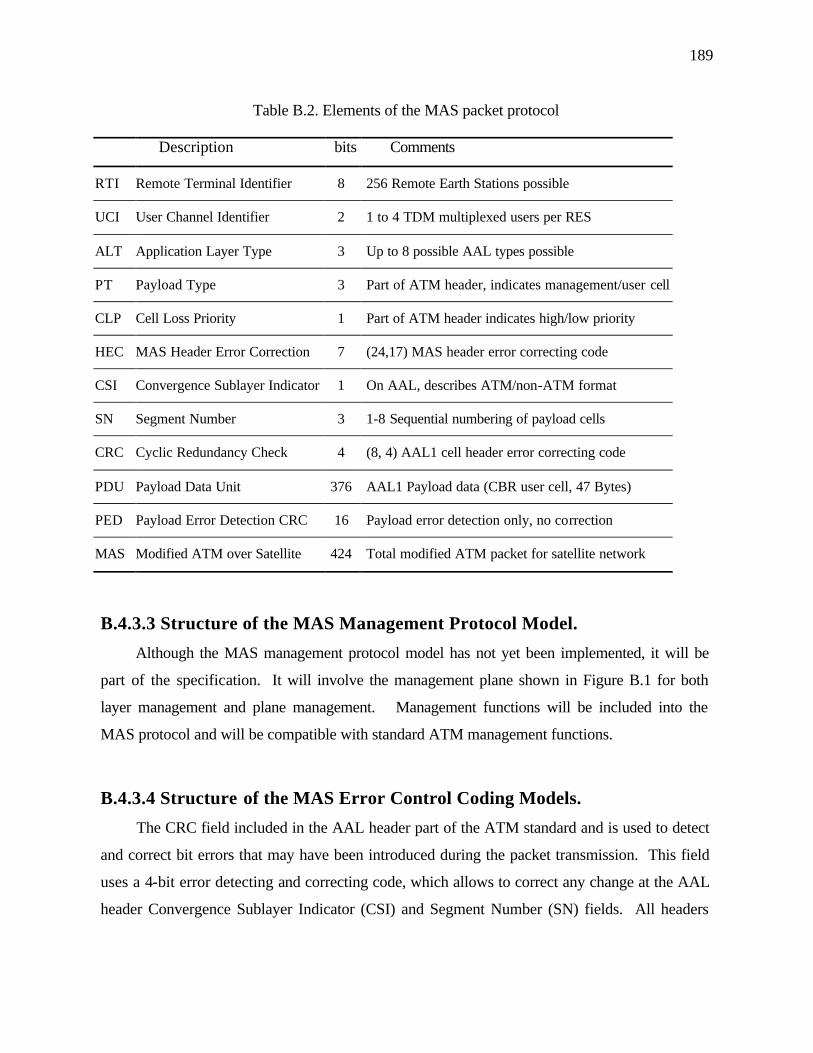
189
Table B.2. Elements of the MAS packet protocol
Description bits Comments
RTI Remote Terminal Identifier 8 256 Remote Earth Stations possible
UCI User Channel Identifier 2 1 to 4 TDM multiplexed users per RES
ALT Application Layer Type 3 Up to 8 possible AAL types possible
PT Payload Type 3 Part of ATM header, indicates management/user cell
CLP Cell Loss Priority 1 Part of ATM header indicates high/low priority
HEC MAS Header Error Correction 7 (24,17) MAS header error correcting code
CSI Convergence Sublayer Indicator 1 On AAL, describes ATM/non-ATM format
SN Segment Number 3 1-8 Sequential numbering of payload cells
CRC Cyclic Redundancy Check 4 (8, 4) AAL1 cell header error correcting code
PDU Payload Data Unit 376 AAL1 Payload data (CBR user cell, 47 Bytes)
PED Payload Error Detection CRC 16 Payload error detection only, no correction
MAS Modified ATM over Satellite 424 Total modified ATM packet for satellite network
B.4.3.3 Structure of the MAS Management Protocol Model.
Although the MAS management protocol model has not yet been implemented, it will be
part of the specification. It will involve the management plane shown in Figure B.1 for both
layer management and plane management. Management functions will be included into the
MAS protocol and will be compatible with standard ATM management functions.
B.4.3.4 Structure of the MAS Error Control Coding Models.
The CRC field included in the AAL header part of the ATM standard and is used to detect
and correct bit errors that may have been introduced during the packet transmission. This field
uses a 4-bit error detecting and correcting code, which allows to correct any change at the AAL
header Convergence Sublayer Indicator (CSI) and Segment Number (SN) fields. All headers

190
must have ample redundancy to allow recovery of the header information and avoid losing the
complete packet.
The CRC field included in the MAS header, also called Header Error Correction (HEC)
field, is a 7-bit error detecting and correcting code that ensures the correct addressing of the
MAS packet over the satellite link. It keeps the RTI, UCI, ALT, PT and CLP fields from bit
errors that could affect the packet's correct addressing.
The MAS trailer includes a final field called PED, and it is a 16-bit error detecting-only
field, used to detect error in the payload. If an error appears, it signals the GES about it and
depending upon the packet's application it request a retransmission (data transmission case only)
or allow the packet to be used as it is (real-time voice and video cases).
The reasoning behind this choice is a crucial one: speed vs. precision. Voice and video may
accept a few bit errors since a retransmission delay over the satellite link will seriously affect its
QoS, so no retransmission is requested. Precision is more important for data transmission, so
when errors are detected a retransmission is requested, thus ensuring a high precision
transmission, if a delayed one. The information required for this choice is sent at the Application
Later Type (ALT) field on the MAS header.
MAS Multiple Access Algorithm. As mentioned before, a final decision has not yet been made regarding the satellite multiple
access to be implemented in the MAS network. It is a very important decision, since it will
define the architecture's efficiency, and it seems highly possible that it may be some form of
Demand Assignment Multiple Access (DAMA) or Slotted Aloha with Reservation. This is
because both techniques allow an efficient use of the satellite system's bandwidth.

191
B.5 Case Simulation of the MAS Protocol Model The initial steps for the MAS protocol model have been implemented using the Matlab
environment in order to test its viability and protocol complexity. A number of MAS user
packets were generated following the MAS protocol stack shown in figure 4.8. A user
application consisting on Continuous Bit Rate (CBR) data at the upper layers was converted into
MAS packets using the ATM Application Layer type 1 (AAL 1), and the main MAS protocol
layers were implemented and compared before and after overhead was added.
Figure B.9. B-ISDN protocol reference model and simulation implementation sequence
Figure B.9 shows the different layers and the required interfaces and functions in sequence.
Since each step must be carefully implemented, several algorithms were created for each
interface in this specific case (CBR on AAL 1). A number of interface algorithms will need to
be implemented for each different case in order to make the MAS network be part of a complete
protocol and interface specification. The simulation process is explained in Figure B.10, where
the sequence of events indicates each simulation step required when generating a MAS packet.
B.5.1 MAS Model Simulation Sequence A simulated communications system was developed in order to test the MAS protocol,
including a basic transmitter, a transmission channel and a receiver. The simulated system did
not include any physical layer elements, since that subject is out of the scope of this work.
MAS Physical Layer
MAS Layer
AAL - SAR
AAL - CS
Higher protocol layers
MAS Physical Layer
MAS header / trailer
AAL header / trailer
PDU Segmenting / Reassembly
Binary sequence
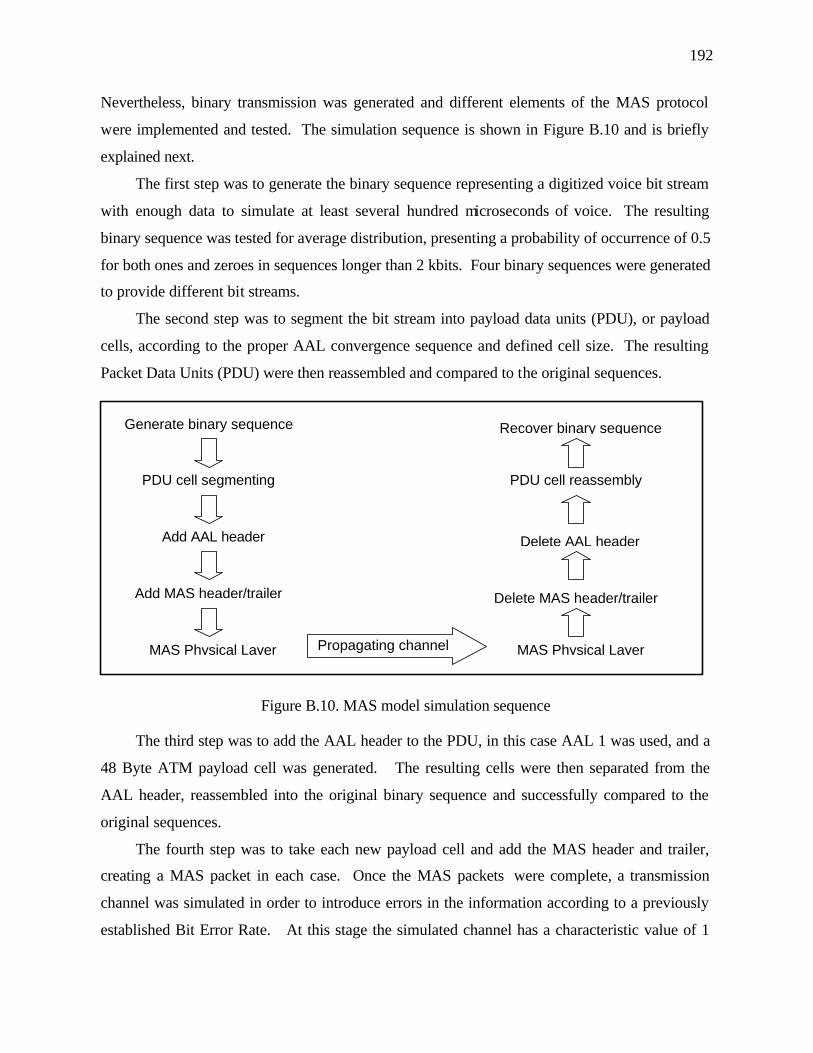
192
Nevertheless, binary transmission was generated and different elements of the MAS protocol
were implemented and tested. The simulation sequence is shown in Figure B.10 and is briefly
explained next.
The first step was to generate the binary sequence representing a digitized voice bit stream
with enough data to simulate at least several hundred microseconds of voice. The resulting
binary sequence was tested for average distribution, presenting a probability of occurrence of 0.5
for both ones and zeroes in sequences longer than 2 kbits. Four binary sequences were generated
to provide different bit streams.
The second step was to segment the bit stream into payload data units (PDU), or payload
cells, according to the proper AAL convergence sequence and defined cell size. The resulting
Packet Data Units (PDU) were then reassembled and compared to the original sequences.
Figure B.10. MAS model simulation sequence
The third step was to add the AAL header to the PDU, in this case AAL 1 was used, and a
48 Byte ATM payload cell was generated. The resulting cells were then separated from the
AAL header, reassembled into the original binary sequence and successfully compared to the
original sequences.
The fourth step was to take each new payload cell and add the MAS header and trailer,
creating a MAS packet in each case. Once the MAS packets were complete, a transmission
channel was simulated in order to introduce errors in the information according to a previously
established Bit Error Rate. At this stage the simulated channel has a characteristic value of 1
MAS Physical Layer
Add MAS header/trailer
Add AAL header
Generate binary sequence
PDU cell segmenting
MAS Physical Layer
Delete MAS header/trailer
Delete AAL header
Recover binary sequence
PDU cell reassembly
Propagating channel

193
and no errors are being introduced since the error control coding elements of the MAS protocol
are not yet ready.
The received MAS packets were disassembled retrieving its MAS overhead from the AAL
cell, then the AAL header from the PDU segment and finally reassembled the payload
successfully into the original binary sequence.
The next step would be to actually simulate the MAS physical layer, but it was decided to
avoid that part since it is not into the scope of this work. The physical layer parameters,
including RF signal modeling (modulation, etc) will not be implemented in this research.
Once the MAS layer packets are ready, a link simulation will follow, introducing a random
number of errors into the transmitted information. The errors will be simulated as changes from
ones to zeroes and vice-versa, according to a previously defined BER value. Errors will be
presented as bit errors and burst errors, to properly characterize typical satellite propagation
impairments. This stage has not been implemented yet, since a review of error control theory
needs to be done before introducing errors into the simulation.
When that part is ready, independent uniformly distributed errors will be introduced for the
bit error case, and larger blocks of errors will be used for the burst error case. Basic error
detection and possible correction will be included into the MAS protocol headers and trailers in
order to avoid or minimize the number of requested retransmissions.
B.5.2 MAS Simulation Model Parameters
B.5.2.1 Binary Sequence Generator The initial stage of the MAS protocol simulation has been implemented using a Matlab
environment, regarding the generation of 4 pseudo-random binary sequences. In the first case a
generator with register length 14 and primitive polynomials [1, 6, 10, 14] w as used, as described
in [Jer92], Table B.3, generating 16,384 pseudo random bit sequence and shown in Figure B.11.
The four binary sequences provide different bit streams using linear shift registers of length 14
(taps [1, 6, 10, 14]} and length 15 (taps [1, 15], [1, 5, 10, 15] and [1, 3, 12, 15]) from [Jer92].

194
Figure B.11 Linear shift register generator of length 14 associated with taps [1, 6, 10, 14]
Once the other binary sequences were generated using four different polynomials of length
14 and 15, the MAS Segmentation and Reassembly (SAR) sublayer was implemented for CBR
service on AAL 1. A similar process will follow for VBR service over an AAL 2 model and if
deemed necessary, the same for AAL types 3/4 and 5.
B.5.3 Binary Sequence Segmentation Algorithm The binary sequence is segmented into Payload Data Units (PDU) consisting of 376 bits
(47 Bytes) for AAL 1. The variable InitialPayload(j) is the original bit stream generated by the
binary sequence generator and the variable UserData(i,j) is the jth bit of the ith PDU. The
segmentation algorithm used is presented as follows.
∑ ∑∞
= =
+−=1
376
1
))1(376(),(i j
jiloadInitialPayjiUserData
B.5.3.1 AAL Header Assembly
The AAL 1 cell is called UserCell, and is a 384-bit cell by adding an 8-bit AAL header
comprised of 3 data fields: a 1-bit Convergence Sublayer Indicator (CSI), a 3-bit Segment
Number (BinSegNum) and a 4-bit Cyclic Redundancy Check (AAL_CRC). This header is
followed by the PDU (UserData), as follows.
∑∑ ∑∑∑∞
= =
=
=
=
=
=
=
+++=1
384
1
376
1
8
1
3
1
),(),(_),()1,(),(i j
k
k
k
k
k
k
kiUserDatakiCRCAALkiBinSegNumiCSIjiUserCell

195
B.5.3.2 MAS Header and Trailer Assembly The MAS packet is called Packet, and it includes the 8-bit Remote Terminal Identifier
(RTI), a 2-bit User Channel Identifier (UCI), a 3-bit Application Layer Type (ALT), a 2-bit
Payload Type (PT), a 1-bit Cell Loss Priority indicator (CLP) and a 7-bit MAS Header Error
Correcting (HEC) code. This header is followed by the AAL payload cell UserCell and appends
the MAS trailer at the end, called Payload Error Detection (PED) code.
∑ ∑ ∑ ∑ ∑ ∑ ∑∑∑∞
= = = = = = ===
+++++++=1
424
1
2
1
3
1
3
1
384
1
16
1
8
1
8
1
),(),(),()1,(),(),(),(),(),(i j k k k k kkk
kiPEDkiUserCellkiHECiCLPkiPTkiALTkiUCIkiRTIjiPacket

196
Appendix C
Conference Papers Derived from this Research
This appendix presents the references of the two conference papers where preliminary results
about the rural telephony by satellite research carried over the previous two years (1998 – 1999).
R. Conte, T. Pratt, "Remote and Rural Telephony through Hybrid Terrestrial Wireless and
Satellite Networks”, 3rd Wireless Communications Conference IMAPS-WCC’98
proceedings, pp.69-74, November 1998, San Diego, Ca.
R. Conte, T. Pratt, “Rural Telephony Performance with Wireless and Satellite Networks”,
Proceeding of the 2nd IEEE-UCSD Conference on Wireless Communications, pp.21-26,
Feb. 28 - March 2, 1999, San Diego, Ca.

197
Vita
Roberto Conte
Roberto Conte was born in Torreón,Coahuila, Mexico. He obtained the Electronics and
Communications Engineering degree from the Universidad Autónoma de Nuevo Leon in
Monterrey, Mexico, in 1986, and the Master of Science in Electronics and Telecommunications
degree from Centro de Investigación Científica y de Educación Superior de Ensenada (CICESE
Research Center) in Ensenada, Baja California, Mexico in 1988.
Since 1988 he has been an Assistant Researcher in the Electronics and Telecommunications
Department at CICESE Research Center. His academic assignments include teaching Analog
and Digital Communications, Satellite Communications and Communications Systems Design at
both undergraduate and graduate levels, in Mexico as well as in the U.S.
His research assignments have been mainly in the study of digital microwave radios as well as
fixed and mobile satellite communications systems for both urban and rural applications. He
was project leader in the development of the telemetry and communications subsystems for
SATEX 1, a Mexican federal government financed micro-satellite.
Since 1996 he has been on educational leave at Virginia Polytechnic Institute and State
University, Blacksburg, Virginia, working towards his doctoral degree as a Fulbright scholar,
sponsored by Mexico’s Consejo Nacional de Ciencia y Tecnlogía (CONACyT).
His research interests include satellite and terrestrial wireless communications networks,
broadband communications and communications networks design.
The author is a member of the Phi Beta Delta honor society, the IEEE Communications Society
and the IMAPS Microelectronics Society. He is also a former President of the Latin American
and Iberic Graduate Student Association at Virginia Tech, as well as International Student
Representative at Virginia Tech’s University Council for International Programs.