Embed Size (px)
Citation preview

SATELLITE REMOTE SENSING AND GIS TECHNOLOGIES TO AID SUSTAINABLE MANAGEMENT OF INDIAN IRRIGATION SYSTEMS
S. M. Chintapalli, P. V. Raju, K. Abdul Hakeem and S. JonnaWater Resources Group, National Remote Sensing Agency
Hyderabad 500 037 [email protected]
Working group VII/2
KEY WORDS: Remote sensing, Performance analysis, Sustainable, Multi spectral, Spatial data
ABSTRACT
Increasing concern in recent years in India is on the issue of long-term prospects of irrigation and the consequences ofcontinuing current water management practices on the sustainability of irrigation systems which have been created withhuge financial investments. The selective studies mentioned in this paper describe the application of advanced technologiesnamely Remote Sensing and Geographic Information System, which has been demonstrated recently, in many irrigationsystems in India to address the various issues relevant to sustainable management of irrigation systems. The primaryagricultural information at disaggregated level derived from the analysis of high resolution satellite data has formed thebasic input in all these studies. A set of indicators of agricultural situation over time and space were derived exclusivelyfrom satellite data analysis and validated at grass root level irrigation units in Bhakra irrigation system, Haryana state.Indicators of irrigation system performance such as irrigation intensity, principal crop intensity, equity in water distributionand agricultural production per unit volume of water were developed and applied in Bhadra command area, Karnataka state.Thus, the geo information derived from remote sensing and data analysis tools like GIS provide excellent opportunitiesto measure the spatio-temporal changes in land and water productivity and to achieve sustainable management of irrigationsystems. The demonstrated capabilities would hopefully lead to more wide spread and operational use of these advancedtechnologies in India and elsewhere, in the world.
1 INTRODUCTION
Development of irrigation in India has been driven by the overriding compulsion of providing food grains for a largegrowing population. Massive financial investments were made in irrigation sector during the last five decades. As a result,the irrigation potential created has gone up to 91.8 million hectares by 1997 from 22.6 million hectares in 1951. During thisperiod, the food grain production has risen to 198 million tonnes from 51 million tonnes and the country has achieved foodsecurity. The large scale capital investments for irrigation development along with green revolution in agriculture hasresulted in nearly quadrupling of food grains production over a period of last five decades in India. However, during theprocess of harnessing the resources certain inequalities/ imbalances/ anomalies have occurred and hence the sustainabilityof present day irrigated agriculture has become doubtful. It would be almost impossible to increase the present level of foodgrain production to meet the future requirement of 450 million tonnes by the year 2050, without substantially increasingthe irrigated area and managing it for sustainable optimal productivity. The achievement of sustainable management ofirrigation systems reinforces and extends the main principles of land and water management and the crux of the problemin this direction is how best we can put these principles in practice. Evaluation of the performance of the irrigation systemin its existing form at different spatial and temporal scales and under different hydrological/ agricultural conditions iscrucial for designing and implementation of any plans to achieve sustainable management of irrigation systems. Non-availability of objective data on agricultural situation in irrigated command areas at desired spatial level is today’s majorproblem for performance evaluation of the irrigation systems. In the last few years, various studies have demonstrated theusefulness of satellite remote sensing data for generating the information on total irrigated area and area under differentcrops (John et. al 1978, Kolm 1984, Nageswara Rao and Mohan Kumar, 1994), condition of crops (Williamson, 1989,Daniel, 1989, Stone, et.al, 1994) and crop production (Pinter 1981, Hatfield 1983, Murthy et.al, 1996). The capabilitiesof emerging technologies like satellite remote sensing and Geographic Information System (GIS), for generation andanalysis of objective information across space and time to achieve realistic evaluation of the agricultural situation andirrigation performance of canal irrigation systems are demonstrated in this paper.
Chintapalli, S.M.
International Archives of Photogrammetry and Remote Sensing. Vol. XXXIII, Part B7. Amsterdam 2000.264

2 PERFORMANCE INDICATORS OF IRRIGATION SYSTEMS
Sustainable development is the development that meets the needs of the present without compromising the abilities of futuregeneration to meet their own needs. Although the attention of irrigation engineers is currently captured by sustainabilityit is less elaborated on its meaning and what it stands for (Agarwal and Roest, 1996). The performance of irrigation systemis a very complex aspect and a variety of indicators have been developed/proposed by various researchers (Rao, P.S. 1993,Seckler et al 1988, Bos and Nugteren 1990, Azzali and Menneti 1989). The indicators of sustainability have been definedas relative crop transpiration, degree of moisture saturation, annual change in soil water storage, soil moisture, saltconcentration and its fluctuations followed by acceptable crop productivity (Agarwal and Roest, 1996). The indicators ofagricultural performance include cropping intensity, cropping pattern and crop productivity. Rao, P. S., 1993, has broadlycategorised the irrigation system performance into four sub-systems namely (1) water sub-system, (2) human sub-system,(3) economic sub-system and (4) environmental system. In water sub-system, three water based performance indicators areselected that can help rate the success in achieving crop production objective. They are productivity, equity and efficiency.Productivity performance is assessed by (a) area utilisation-defined by the ratio of the harvested and theoreticallyserviceable area i.e. culturable command area, (b) yield potential-absolute yield as well as relative yield, (c) irrigation wateroutput-productivity per unit of water. Equity achievement is described by production distribution, flow distribution andproduction and flow distribution. Under human system, the indicators are response capacity of farmers and farmers’satisfaction. Environmental sub-system uses impact on environment in terms of water logging, soil toxicities and irrigationwater quality as indicators. The economic sub-system emphasises the economic stability in the short and long run periods.
3 AGRICULTURAL PERFORMANCE OF WATER COURSES IN BHAKRA IRRIGATION SYSTEM
In this study, multi spectral and multi temporal data data from Landsat and IRS satellites were analysed for the rabi seasons(October - April) of five years namely 1986-87, 1989-90, 1992-93, 1995-96 and 1996-97. A set of indicators of theagriculture performance in the command area of water courses were derived from satellite data analysis and applied toevaluate the spatio-temporal changes as well as the sustainability in the agricultural performance. The Bhakra irrigationsystem has a culturable command area of 1.2 m ha, with five water service circles namely, Ambala, Kaithal, Hisar-1,Hisar-2 and Sirsa which are in turn divided into 13 divisions and 41 sub-divisions. Water course is the ultimate irrigationunit in the system and normally serves an area of about 400 ha. The index map of the Bhakra irrigation system and the watercourses selected for the study are shown in figure 1. During rabi season wheat is predominantly cultivated followed bytoria, mustard and bengal gram.
3.1 Data analysis
Geo referenced data base was first created in polyconic projection with a pixel resolution of 30 metres using Survey ofIndia topographic maps of 1:50000 scale. The digital data of each satellite overpass was first converted into radiance andthen registered into reference map base. The water course maps which were in the scale of 1:6000, were first registered tothe panchromatic data of IRS-1C of 6 metres resolution, and then registered to the main database of 30 metres resolution.This facilitated more accurate registration of water course maps by minimising the gap between pre and post registrationgross areas. Maximum likelihood classification was performed on the data of December and February/March to achieveclassification of wheat and non-wheat crops. Kappa coefficient was calculated for overall classes as well as for individualclasses. The evaluation was done at two levels, one at total scene level and the other at water course level. Due to time andlogistic constraints it was not possible to carry out evaluation in each water course. Hence, two water courses wererandomly selected. In the evaluation at total scene level, 20 points for wheat and 10 points for non-wheat were selected atrandom. At water course level 15-20 points for wheat and about 10 points for non-wheat were randomly selected. TheKappa coefficient of accuracy for overall accuracy as well as for individual classes was found to be above 90 %.
3.2 Agricultural performance of water courses
The agricultural performance of water courses can be explained by cropping intensity and crop condition across time andspace. The differential performance of water courses in a given area can be attributed to various factors such as (1)irrigation related and (2) others. Some of the irrigation related factors include the location of water course in the respectivesource/parent canal, factors related to lining of water courses such as age of lining and extent of lining. Lining ofwatercourses in Haryana state has been going on since 1973. The purpose of lining is simply to reduce seepage losses andhence to improve the equity in water supply by increasing deliveries to tail-end users. The non-irrigation factors affecting
Chintapalli, S.M.
International Archives of Photogrammetry and Remote Sensing. Vol. XXXIII, Part B7. Amsterdam 2000. 265

the performance are soil type, ground water quality, agronomic practices, crop varieties etc., can be assumed to be moreor less homogeneous over smaller areas such as in the current study. Therefore, only the irrigation related parameters wereconsidered. Three irrigation related factors identified for further analysis were (1) Location of water courses in the parent
Chintapalli, S.M.
International Archives of Photogrammetry and Remote Sensing. Vol. XXXIII, Part B7. Amsterdam 2000.266

20
30
40
50
60
70
80
% o
f W
hea
t
96-97 95-96 92-93 89-90 86-87Year
Water Course 2
20
30
40
50
60
70
80
% o
f W
hea
t
96-97 95-96 92-93 89-90 86-87Year
Water Course 1
Figure 2. Typical trends in wheat intensityin two water courses
canal (2) Age of lining of water course (3) Extent of lining i.e., per cent of lined area of water course . The location of watercourse in the parent canal will be in “Head Reach Area (HRA)”, if the water course off takes from the first 1/3 rd lengthof the parent canal. Similarly, if the water course off takes from the last 1/3 rd length of the parent canal, it is called “TailReach Area (TRA)” and lastly, it is called “Mid Reach Area (MRA)”, if it off takes from the middle 1/3 rd length of theparent canal. The water courses located in the HRA of parent canal perform better than that located in the TRA of parentcanal due to better water availability. As the age of lining increases, the performance gets deteriorated. The water courseswhich were lined to a greater extent perform better than those lined to a lesser extent i.e., the per cent of lining andperformance are directly related. The performance of water courses in the post-lining period is significantly better than thatin the pre-lining period.
3.3 Satellite derived indicators of agricultural performance
In the current study, five indicators of performance were developed. These indicators were derived for remote sensing data.They are (1) Wheat crop Intensity (WI), (2) Equivalent Wheat crop Area Intensity (EWAI), (3) Sustainability in cropintensity, (4) Tail - Head Ratio of NDVI (THRNDVI), and (5) Coefficient of variation of NDVI (CV NDVI ). The first threeindicators are crop area based and the last two are crop condition based.
3.3.1 Wheat crop Intensity
Wheat is the most preferred crop in the study area. Subject to the availability of sufficient irrigation water, farmersgenerally prefer wheat crop to non-wheat crop. Hence the extent of wheat crop is directly related to the degree of
availability of irrigation water. The typical trendsin wheat intensity in two of the water courses areshown in figure 2. It was observed that theintensity of wheat crop was influenced by thelocation of water courses in the respective parentcanal. Water courses off taking from the headreach areas have increasing wheat intensity overtime while water courses in tail reach area havedeclining wheat intensity. Water courses whichwere lined recently i.e., after 1992 have shownsignificant improvement in wheat intensity in thepost-lining periods. In the water courses whichwere lined in 1975-76, there was no clear relationbetween wheat intensity and age/extent of lining.
However, in this group, location of water courses seems to be an important factor i.e., water courses located in the headreach area of respective distributary / minor have higher wheat intensity.
3.3.2 Equivalent Wheat crop Area Intensity
EWAI is the index which expresses the total crop area in terms of wheat crop area to facilitate easy and straight forwardcomparison of cropping intensity and irrigation water consumption. The non-wheat crops acreage was converted into wheatwith the factor 1 acre of non wheat = 0.6 acre of wheat, which is approximately proportional to the ratio of their averageirrigation water requirements. In the current study, EWAI was found to be influenced by the location of water courses withhead reach area water courses having more crop area and tail reach area water courses having less area. In the water courseshaving same age of lining but different length of lining, the EWAI is more in water courses though the length of lining isless because of its location in HRA. Thus the factor of location of water course looks to be having more influence thanextent of lining. The EWAI was more in an unlined water course located in head region than lined water courses locatedelsewhere.
3.3.3 Sustainability in crop intensity
The coefficient of variation (CV) in crop intensity during 1986-87 to 1996-97 reflected the sustenance in irrigatedagriculture. Temporal changes in crop intensity could be attributed to changes in water availability. High values of CVsignify inconsistent/deteriorating performance. The values of CV at water course level as well as at head and tail reacheswithin water courses for the water courses which were lined before 1986 are presented in table 1. The CV values up to 10percent may be considered insignificant.
Chintapalli, S.M.
International Archives of Photogrammetry and Remote Sensing. Vol. XXXIII, Part B7. Amsterdam 2000. 267
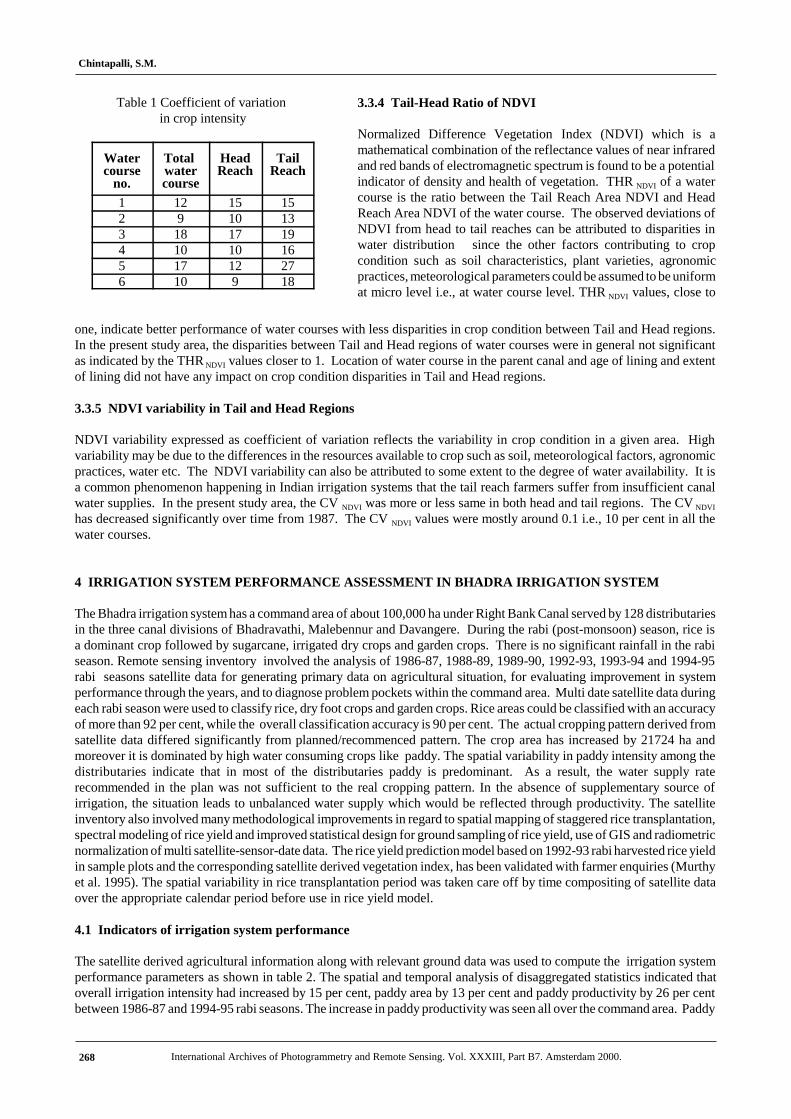
Table 1 Coefficient of variation in crop intensity
Watercourse
no.
Total watercourse
HeadReach
TailReach
1 12 15 152 9 10 133 18 17 194 10 10 165 17 12 276 10 9 18
3.3.4 Tail-Head Ratio of NDVI
Normalized Difference Vegetation Index (NDVI) which is amathematical combination of the reflectance values of near infraredand red bands of electromagnetic spectrum is found to be a potentialindicator of density and health of vegetation. THR NDVI of a watercourse is the ratio between the Tail Reach Area NDVI and HeadReach Area NDVI of the water course. The observed deviations ofNDVI from head to tail reaches can be attributed to disparities inwater distribution since the other factors contributing to cropcondition such as soil characteristics, plant varieties, agronomicpractices, meteorological parameters could be assumed to be uniformat micro level i.e., at water course level. THR NDVI values, close to
one, indicate better performance of water courses with less disparities in crop condition between Tail and Head regions.In the present study area, the disparities between Tail and Head regions of water courses were in general not significantas indicated by the THR NDVI values closer to 1. Location of water course in the parent canal and age of lining and extentof lining did not have any impact on crop condition disparities in Tail and Head regions.
3.3.5 NDVI variability in Tail and Head Regions
NDVI variability expressed as coefficient of variation reflects the variability in crop condition in a given area. Highvariability may be due to the differences in the resources available to crop such as soil, meteorological factors, agronomicpractices, water etc. The NDVI variability can also be attributed to some extent to the degree of water availability. It isa common phenomenon happening in Indian irrigation systems that the tail reach farmers suffer from insufficient canalwater supplies. In the present study area, the CV NDVI was more or less same in both head and tail regions. The CV NDVI
has decreased significantly over time from 1987. The CV NDVI values were mostly around 0.1 i.e., 10 per cent in all thewater courses.
4 IRRIGATION SYSTEM PERFORMANCE ASSESSMENT IN BHADRA IRRIGATION SYSTEM
The Bhadra irrigation system has a command area of about 100,000 ha under Right Bank Canal served by 128 distributariesin the three canal divisions of Bhadravathi, Malebennur and Davangere. During the rabi (post-monsoon) season, rice isa dominant crop followed by sugarcane, irrigated dry crops and garden crops. There is no significant rainfall in the rabiseason. Remote sensing inventory involved the analysis of 1986-87, 1988-89, 1989-90, 1992-93, 1993-94 and 1994-95rabi seasons satellite data for generating primary data on agricultural situation, for evaluating improvement in systemperformance through the years, and to diagnose problem pockets within the command area. Multi date satellite data duringeach rabi season were used to classify rice, dry foot crops and garden crops. Rice areas could be classified with an accuracyof more than 92 per cent, while the overall classification accuracy is 90 per cent. The actual cropping pattern derived fromsatellite data differed significantly from planned/recommenced pattern. The crop area has increased by 21724 ha andmoreover it is dominated by high water consuming crops like paddy. The spatial variability in paddy intensity among thedistributaries indicate that in most of the distributaries paddy is predominant. As a result, the water supply raterecommended in the plan was not sufficient to the real cropping pattern. In the absence of supplementary source ofirrigation, the situation leads to unbalanced water supply which would be reflected through productivity. The satelliteinventory also involved many methodological improvements in regard to spatial mapping of staggered rice transplantation,spectral modeling of rice yield and improved statistical design for ground sampling of rice yield, use of GIS and radiometricnormalization of multi satellite-sensor-date data. The rice yield prediction model based on 1992-93 rabi harvested rice yieldin sample plots and the corresponding satellite derived vegetation index, has been validated with farmer enquiries (Murthyet al. 1995). The spatial variability in rice transplantation period was taken care off by time compositing of satellite dataover the appropriate calendar period before use in rice yield model.
4.1 Indicators of irrigation system performance
The satellite derived agricultural information along with relevant ground data was used to compute the irrigation systemperformance parameters as shown in table 2. The spatial and temporal analysis of disaggregated statistics indicated thatoverall irrigation intensity had increased by 15 per cent, paddy area by 13 per cent and paddy productivity by 26 per centbetween 1986-87 and 1994-95 rabi seasons. The increase in paddy productivity was seen all over the command area. Paddy
Chintapalli, S.M.
International Archives of Photogrammetry and Remote Sensing. Vol. XXXIII, Part B7. Amsterdam 2000.268

output per unit of water was computed based on proportionate allocation of canal supplies to paddy areas and satellitederived paddy production. This performance indicator showed increasing efficiency of water use for paddy production. Thesatellite data analysis had facilitated the identification of canals with poor performance in respect of irrigation intensity,paddy yield and water use efficiency.
Table 2 System performance of Bhadra project through the years
Parameters Rabi season
1986-87 1989-90 1992-93 1993-94
Irrigated crop area (ha) 73,529 67,366 88,424 84,412
Percentage of paddy area 56 51 69 69
Average paddy (rough paddy) yield (tonnes/ha) 3.8 5.4 4.7 4.9
Depth of water application (m/ha) 1.06 1.04 0.80 0.86
Area irrigated per unit volume of water (ha/ham) 0.94 0.96 1.25 1.16
Paddy (rough paddy) output per unit of land (tonnes/ha) 3.8 5.4 4.7 4.9
Paddy (rough paddy) output per unit volume of water(tonnes/m3)
0.3 0.4 0.5 0.5
4.2 Chronological synchronization between crop calendar and water delivery
An ideal irrigation system should meet the water requirementsall crops in its command during all the physiological stages.The existing water discharge pattern is compared with cropcalendar derived from satellite data. Here the emphasis is onthe chronology of canal operation but not on the volume ofwater supplied. Multi date NDVI statistics over paddy area wasgenerated for each distributary. The satellite over passesrepresent in general broad spectrum of paddy growth cycle frompanicle initiation to grain formation. Analysis of NDVI profilesof various distributaries revealed three distinct growth patternsof paddy crop. Murthy et al, (1998) interpreted these growthprofiles with the aid of ground truth and derived the cropcalendar information for each profile indicating the estimatedtime of transplantation and crop harvest for paddy cropcorresponding to each NDVI profile. Consequently, thedistributaries of the command area were grouped in to threecategories namely early transplantation (first fortnight ofFebruary), normal transplantation (second fortnight ofFebruary) and late transplantation (first fortnight of March).The spatial variability in canal opening and closure is derivedfrom ground data and was compared with with satellite derivedcrop calendar. This analysis which was done in GISenvironment, had resulted in the identification of 21distributaries in two categories. The first category ofdistributaries has a lag of 30 days and the second category hasa lag of 20-30 days between canal closure i.e., cessation ofwater supply and crop harvesting (figure 3). The time lagbetween canal closure and harvesting could be explained inrelation to paddy growth cycle and water requirements invarious stages to infer the implications. About 4-7 days prior tomaturity, water is let out completely, to facilitate harvesting.Therefore, in the first category distributaries, the effectiveduration water shortage for crop is 16 days assuming that oneweek before harvest no water is needed and the fields continueto get water for one week after canal closure. During this periodthe crop would be in grain formation stage which may result in yield reduction subsequently. In the second category of
Chintapalli, S.M.
International Archives of Photogrammetry and Remote Sensing. Vol. XXXIII, Part B7. Amsterdam 2000. 269
distributaries with a lag of 20-25 days the effective water shortage is for 6-11 days during grain formation stage.
5 CONCLUSIONS
Emerging technologies like Satellite remote sensing can be successfully utilised for deriving the spatial and temporalagricultural information in irrigated command areas. Such information which is generally not collected and maintained inany organised fashion in the conventional mechanisms is very useful for developing performance indicators of irrigationsystem. Indicators revealing the spatial and temporal trends in agricultural situation in the irrigation system command areacan be derived exclusively from remote sensing data analysis. Organising the satellite derived spatial data and groundobservations /measurements and non-spatial attribute data, in a GIS environment, would be highly desirable to facilitateanalysis of irrigation performance and also for effective use of irrigation management models towards achieving thesustainable management of irrigation systems.
6 ACKNOWLEDGMENTS
Greatful thanks are due to Dr. D. P. Rao, Director, Shri S. K. Bhan, Deputy Director (Applications), Shri A. K. Chakraborti,Group Head, Water Resources Group, National Remote Sensing Agency, Hyderabad, India, for according permission andfor providing required facilities for successful completion of this study. Funding support for the study in Bhakra irrigationsystem was provided by International Water Management Institute (IWMI), Sri Lanka, and special thanks are due to Dr.David Seckler, Dr. Chris Perry and Dr. R Sakthivadivel of IWMI. Valuable support and cooperation was received fromIrrigation Departments of Government of Haryana state and Government of Karnataka state. Without the help andcooperation from colleagues in Water Resources Group and other supporting divisions this study could not have beensuccessfully completed.
7 REFERENCES
Agarwal, M. C., and Roest, C. J. W., 1996. Towards improved water management in Haryana state, Final report of the Indo-Dutch operational research project on hydrological studies, CCS Haryana Agricultural University, India.
Azzali, S., and Menneti, M., 1989. Application of remote sensing to irrigation water management in two Italian irrigationdistricts, Proc. of workshop on Earthnet pilot project on Landsat-TM applications, December 1989, Frascati, Italy, pp 41-48.
Bos, M. G., and Nugteren, J., 1990. On irrigation efficiencies, Wageningen, International Institute for Land Reclamationand Improvement/ILRI publication.
Daniel LLoyd, 1989. A phenological description of Iberian vegetation using short wave vegetation index image,International Journal of Remote Sensing, 10 (4&5), pp. 827-833.
Hatfield, J. K., 1983. Remote sensing estimators of potential and actual crop yield.Remote Sensing of Environment, 13(4), pp. 301-311
John, E. Estes., John, R. Jensen., and Larry, R. Tinny., 1978. Remote sensing of agricultural water demand informationA California study, Water Resources Research, 2, pp. 170-176 Kolm. E. Kenneth., Case Lee, H., 1984. The identification of irrigated crop types and estimation of acreages from Landsatimagery, Photogrammetric Engineering and Remote Sensing, 50 (10), pp. 1479-1490
Murthy, C. S., Jonna, S., Raju, P. V., Thiruvengadachari, S., and Hakeem, K. A., 1995. Paddy yield prediction in BhadraProject Command area using remote sensing data, Asian-Pacific Remote Sensing Journal, 8 (1), pp. 79-84
Murthy, C. S., Thiruvengadachari, S., Raju, P. V., and Jonna, S., 1996. Improved ground sampling and crop yield estimationusing satellite data, International Journal of Remote Sensing, 17 (5), pp. 945-956
Murthy, C. S., Raju, P. V., Jonna, S., Abdul Hakeem, K. and Thiruvengadachari, S., 1998. Satellite derived crop calendarfor canal operation schedule in Bhadra project command area, India, International Journal of Remote Sensing; 19 (15), pp.
Chintapalli, S.M.
International Archives of Photogrammetry and Remote Sensing. Vol. XXXIII, Part B7. Amsterdam 2000.270

2865-2876
Nageswar Rao, P. P., and Mohan Kumar, A., 1994. Crop land inventory in the command area of Krishnarajasagar projectusing satellite data, International Journal of Remote Sensing, 15 (6), pp. 1295-1305
Pinter, P. J. JR., Jackson, R. D., Idso, S. B., Reginato, R. J. 1981. Multidate spectral reflectance as predictors of yield inwater stressed wheat and barley. International Journal of Remote Sensing, 2 (1), pp. 43-48
Rao, P. S., 1993. Review of selected literature on indicators of irrigation performance, International Institute for WaterManagement ( IWMI, previous name IIMI), Srilanka, publication.
Seckler David, Sampath, R. K., and Raheja, S. K.,1988. An index for measuring the performance of irrigation managementsystems with application, Water Resources Bulletin, 24 (4), pp. 855-860
Stone. A. Thomas., Schlesinger. Peter., Houghton. A. Richard., and Woodwell. M. George., 1994. A map of the vegetationof South America based on satellite imagery, Photogrammetric Engineering and Remote Sensing, 60 (5), pp. 541-551.
Williamson. H. D., 1989. The discrimination of irrigated orchard and vine crops using remotely sensed data,Photogrammetric Engineering and Remote Sensing, 55 (1), pp. 77-82.
Chintapalli, S.M.
International Archives of Photogrammetry and Remote Sensing. Vol. XXXIII, Part B7. Amsterdam 2000. 271