Embed Size (px)
Citation preview

2458-13
Workshop on GNSS Data Application to Low Latitude Ionospheric Research
WALTER Todd
6 - 17 May 2013
Stanford University Department of Aeronautics and Astronautics
CA 94305-4035 Stanford U.S.A.
Satellite Navigation for Guidance of Aircraft (Part 2)

Satellite Navigation for Guidance of Aircraft
Todd WalterStanford University
http://waas.stanford.edu

Presented at ICTPCopyright 2013
Todd Walter
2
Outline
Ionospheric ModelingIonospheric ThreatsNext Generation Satellite NavigationFuture SignalsConclusions

Presented at ICTPCopyright 2013
Todd Walter
3
How Are Measurements Correlated Over Distance?Translate Our Measurements of the Ionosphere Into User CorrectionsHow Does the Ionosphere Behave Spatially?
What is the underlying structure?What does one measurement tell us about the nearby ionosphere?How should we combine multiple samples?What confidence can we have in our prediction?
We Need to Determine the Ionospheric Decorrelation Function

Presented at ICTPCopyright 2013
Todd Walter
4
Supertruth DataRaw Data Collected From Each WRS
3 independent receivers per WRS
Postprocessed to Create SupertruthCarrier tracks leveled to reduce multipathInterfrequency biases estimated and removed for satellites and receiversComparisons made between co-located receivers (voting to remove artifacts)
Multipath and Bias Residuals are ~50 cmWithout Voting, Receiver Artifacts Cloud Results and Make It Impossible to See Tails of the Distribution

Presented at ICTPCopyright 2013
Todd Walter
5
Decorrelation Estimation
Every Supertruth IPP Is Compared to All OthersThe Great Circle Distance Between the IPPs Is CalculatedThe Difference in Vertical Ionosphere Is CalculatedA Two-dimensional Histogram Is Formed: Each Bin Corresponds to a Distance Range and a Vertical Difference RangeHistogram Contains the Counts for Each Time an IPP Pair Fell in a Particular Bin

Presented at ICTPCopyright 2013
Todd Walter
6
Correlation Estimation Process

Presented at ICTPCopyright 2013
Todd Walter
7
Ionospheric Decorrelation(0th Order)

Presented at ICTPCopyright 2013
Todd Walter
8
Ionospheric Decorrelation Function (0th Order)

Presented at ICTPCopyright 2013
Todd Walter
9
Preliminary Decorrelation Findings
Nominal Ionosphere is Relatively Smooth
Nearby IPPs Well CorrelatedConfidence About a Single Measurement Can Be Described As:
2 = m2 + (0.3 m + d 0.5 m/1000km)2
There Appears to Be a Deterministic ComponentNext Try Removing a Planar Fit

Presented at ICTPCopyright 2013
Todd Walter
10
Ionospheric Decorrelation About a Planar Fit (1st Order)

Presented at ICTPCopyright 2013
Todd Walter
11
Ionospheric Decorrelation Function (1st Order)

Presented at ICTPCopyright 2013
Todd Walter
12
Ionospheric Decorrelation About a Quadratic Fit

Presented at ICTPCopyright 2013
Todd Walter
13
Ionospheric Decorrelation Function (2nd Order)

Presented at ICTPCopyright 2013
Todd Walter
14
Initial Decorrelation SummaryPlanar Fit Appears to Remove Nearly All Deterministic ElementsNo Decorrelation Variation With Elevation Angle or vs Day/Night
Decorrelation appears to result from residual error in supertruth data
35 cm Valid for Mid-Latitude Nominal Decorrelation (R < ~1000 km)Decorrelation at Lower Latitudes Is Likely Different (larger, more orders?)

Presented at ICTPCopyright 2013
Todd Walter
15
Disturbed Ionosphere

Presented at ICTPCopyright 2013
Todd Walter
16
Disturbed Ionosphere

Presented at ICTPCopyright 2013
Todd Walter
17
Map of South American Stations

Presented at ICTPCopyright 2013
Todd Walter
18
Determination of Quiet DaysFirst wish to identify undisturbeddays to use as basis for nominalmodel
Want a day free of depletions and scintillation

Presented at ICTPCopyright 2013
Todd Walter
19
Daily Observations of TEC and S4
Presented at ICTPCopyright 2013
Todd Walter
20
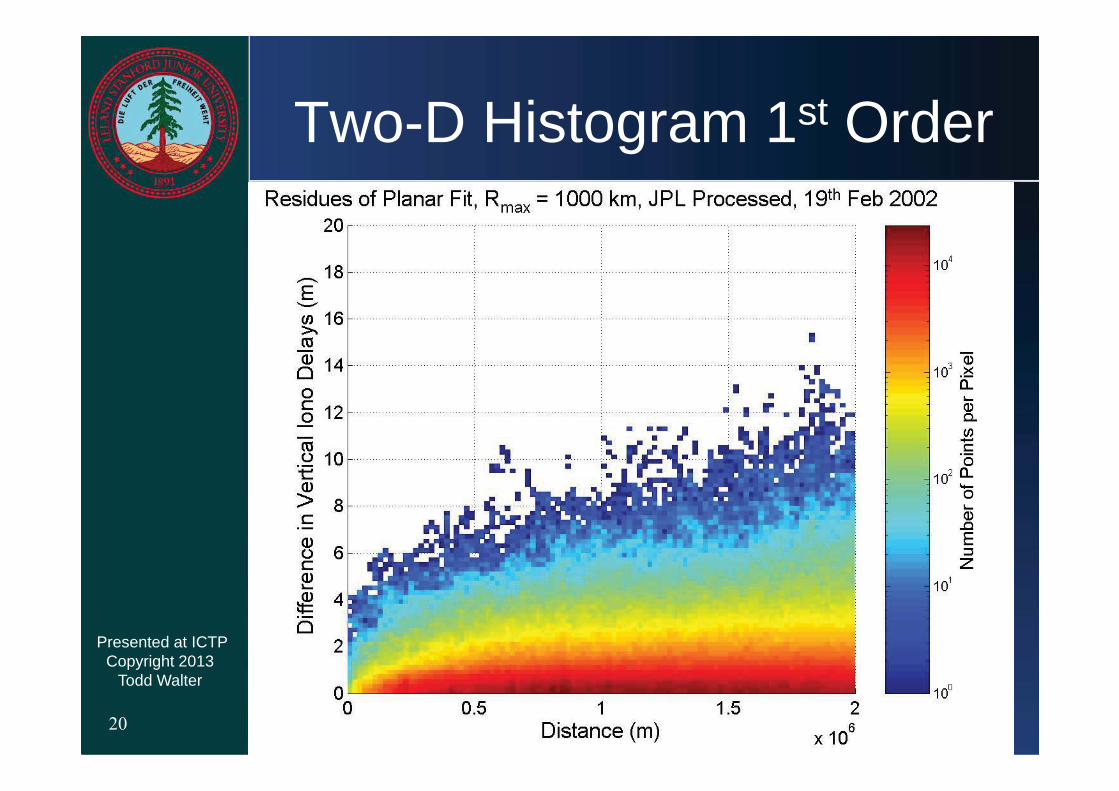
Two-D Histogram 1st Order

Presented at ICTPCopyright 2013
Todd Walter
21
Sigma Estimate 1st Order
Presented at ICTPCopyright 2013
Todd Walter
22
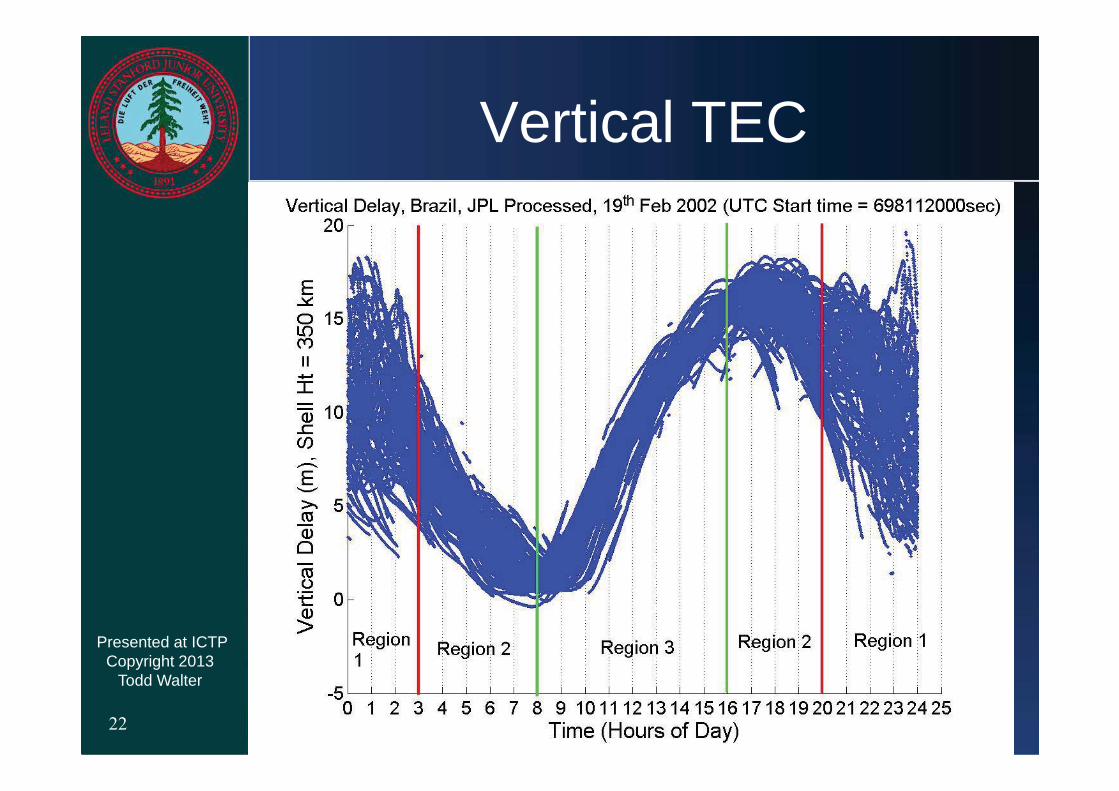
Vertical TEC

Presented at ICTPCopyright 2013
Todd Walter
23
Two-D Histogram 1st Order (Region 1)

Presented at ICTPCopyright 2013
Todd Walter
24
Two-D Histogram 1st Order (Region 2)

Presented at ICTPCopyright 2013
Todd Walter
25
Two-D Histogram 1st Order (Region 3)

Presented at ICTPCopyright 2013
Todd Walter
26
Sigma Estimate 1st Order (Sliced by Time)

Presented at ICTPCopyright 2013
Todd Walter
27
Sigma Estimate 1st Order (Sliced by Time)

Presented at ICTPCopyright 2013
Todd Walter
28
Correlation ObservationsClear temporal dependencies in the variogram ( decorr term)
Evening into nighttime is worstDaytime more easily modeled
Clear spatial trends in the data1st and 2nd order model the trend about equally well, both better than 0th order
Random Component significantly larger than mid-latitude
Gaussian over short times

Presented at ICTPCopyright 2013
Todd Walter
29
Contributors to Differential Ionosphere Error
Diff. Iono Range Error = gradient slope min{ (x + 2 vair), gradient width}
70 m/s
5 km LGF
GPS Satellite
Error due to code-carrier divergence experienced by 100-
second aircraft carrier-smoothing filter
Error due to physical separation of ground and aircraft ionosphere pierce
points
For 5 km ground-to-air separation at CAT I DH: x = 5 km; = 100 sec; vair= 70 m/s
virtual baseline at DH = x + 2 vair = 5 + 14 = 19 k
Simplified Ionosphere Wave Front Model:
a ramp defined by constant slope and width
Courtesy:Sam Pullen

Presented at ICTPCopyright 2013
Todd Walter
30
Ionosphere Delay Gradients 20 Nov. 2003
0 50 100 150 200 250 300 3500
5
10
15
20
25
30
35
WAAS Time (minutes from 5:00 PM to 11:59 PM UT)
Sla
nt Io
no D
elay
(m)
Sharp falling edge; slant
gradients 250 –330 mm/km
Initial upward growth; slant gradients 60 – 120 mm/km
Data from 7 CORS stations in OH/MI
(subset of Groups B and D) observing SVN 38
Valleys with smaller (but anomalous) gradients
Courtesy:Sam Pullen

Presented at ICTPCopyright 2013
Todd Walter
31
SBAS Ionospheric ThreatsWAAS Was Commissioned on 10 July 2003
Availability > 99% for first 3 monthsOctober 29-31 Two Large Disturbances Each Cause the Storm Detectors to Trip for Hours
Protection factor set to ~15 m 1-sigmaNovember 20-21 Another Large Disturbance Limits Vertical Guidance for Several Hours

Presented at ICTPCopyright 2013
Todd Walter
32
Failure of Thin Shell Model
Quiet Day Disturbed Day

33
Threats at the Edge of Coverage
Courtesy:Seebany Datta-Barua

34
Edge of Coverage 2
Courtesy:Seebany Datta-Barua

35
Undersampling Within CONUS
Courtesy:Seebany Datta-Barua
36
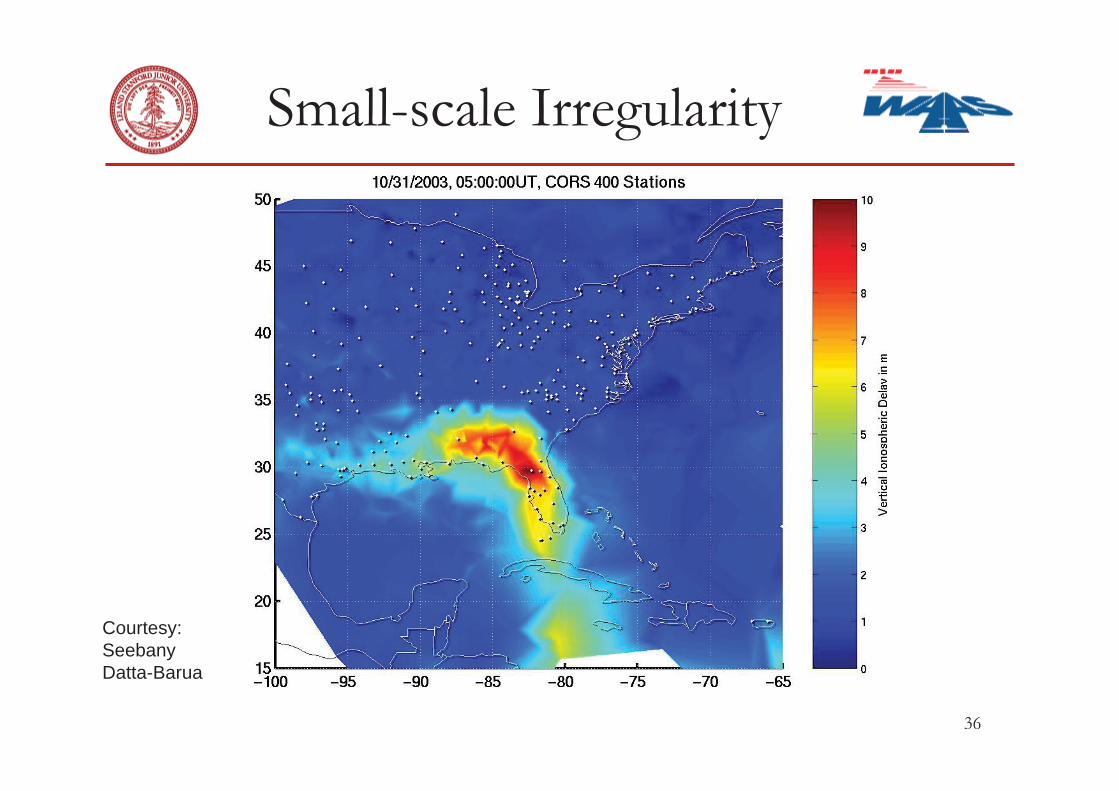
Small-scale Irregularity
Courtesy:Seebany Datta-Barua

37
Artificial Undersampled Scenario
Courtesy:Seebany Datta-Barua

38
WAAS Measurements
Courtesy:Seebany Datta-Barua

39
Artificial WAAS Undersampling Scenario
Courtesy:Seebany Datta-Barua
40
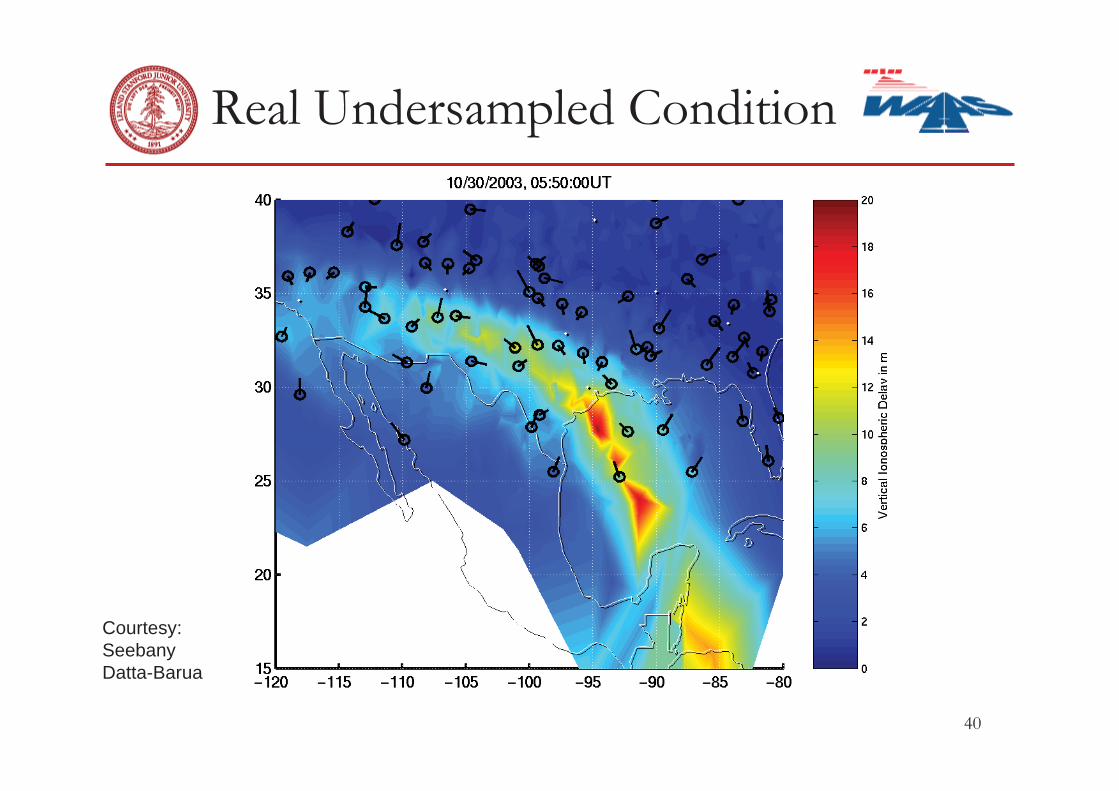
Real Undersampled Condition
Courtesy:Seebany Datta-Barua

41
WAAS Measurements
Courtesy:Seebany Datta-Barua

42
Scintillation and Deep Signal Fading
• Signal to noise ratio (C/No) of PRN 11 (Mar. 18, 2001)
C/No
25 dB
100 sec
Nominal
Scintillation(equatorial & solar max)
Courtesy:Jiwon Seo

43
Scintillation and Navigation
WAAS
GPS
WAA
Scintillation Patches
1 or 2 affected SVs during Solar Min(36 days’ campaign in Brazil)
Courtesy:Jiwon Seo

44
Scintillation and Navigation
WAAS
GPS
WAA
Scintillation Patches
Up to 7 affected SVs during Solar Max(8 days’ campaign at Ascension Island)
Courtesy:Jiwon Seo

45
Severe Scintillation Data
Solar Max(worst 45 min
in 8 days)
Courtesy:Jiwon Seo

46
Severe Scintillation (example)
100 sec
C/No
• 50 Hz C/No outputs of all 8 satellites on sky (100 sec out of 45 min data as an example)
• Number of simultaneous loss of satellites is more important than number of fading channels
Courtesy:Jiwon Seo

47
Hatch Filter Model
C/No
1
10
RelativeNoiseLevel
50 dB-Hz
10 dB-Hz
100 secCourtesy:Jiwon Seo

48
Hatch Filter Model
C/No
1
10
50 dB-Hz
10 dB-Hz
100 sec
RelativeNoiseLevel
Frequent Resets Due to Fades
Courtesy:Jiwon Seo

Presented at ICTPCopyright 2013
Todd Walter
49
Regions with Scintillation
Courtesy: PaulKintner

Presented at ICTPCopyright 2013
Todd Walter
50
OutlineIonospheric ModelingIonospheric Threats
Next Generation Satellite NavigationFuture SignalsConclusions

Presented at ICTPCopyright 2013
Todd Walter
51
Looking AheadNext generation of satellite navigation will exploit new signals and new systems
GPS is being modernizedOther nations developing SatNav
It is time to plan aheadWhat new capabilities can we provide?Are there more efficient ways to provide them?

Presented at ICTPCopyright 2013
Todd Walter
52
RAIM Protection
Courtesy:Juan Blanch
Horizontal Error Bound

Presented at ICTPCopyright 2013
Todd Walter
53
FaultedSatellite
RAIM Protection
Courtesy:Juan Blanch
Horizontal Error Bound
TruePosition
EstimatedPosition

Presented at ICTPCopyright 2013
Todd Walter
54
New GNSS ConstellationsA solution to constellation weakness
Many more ranging sourcesFills in gapsProvides extra redundancyAverages down uncertainty

Presented at ICTPCopyright 2013
Todd Walter
55
Advanced RAIM (ARAIM)Dual Frequency - Multi-constellation
Eliminates multiple SV iono threatStrong geometries
Support for vertical guidanceRequires a more stringent level of certification than RAIM for lateralMay require ground monitoring by approving agency
Potential for near global coverageModest infrastructure requirements

Presented at ICTPCopyright 2013
Todd Walter
56
P(Y)-code P(Y)-codeC/A-code
P(Y)-codeC/A-code
M-codeP(Y)-code
L2C
M-codeL5
P(Y)-codeC/A-code
M-codeP(Y)-code
L2C
M-code
L1(1575.42 MHz)
L2(1227.6 MHz)
L5(1176.45 MHz)
frequency
P(Y)-codeC/A-code
M-codeP(Y)-code
L2C
M-codeL5L1C
Block I/II/IIA/IIR
Block IIR-M
Block IIF
Block III
GPS Signals

Presented at ICTPCopyright 2013
Todd Walter
57
Current SBAS Coverage
WAAS
EGNOS
MSAS
Presented at ICTPCopyright 2013
Todd Walter
58
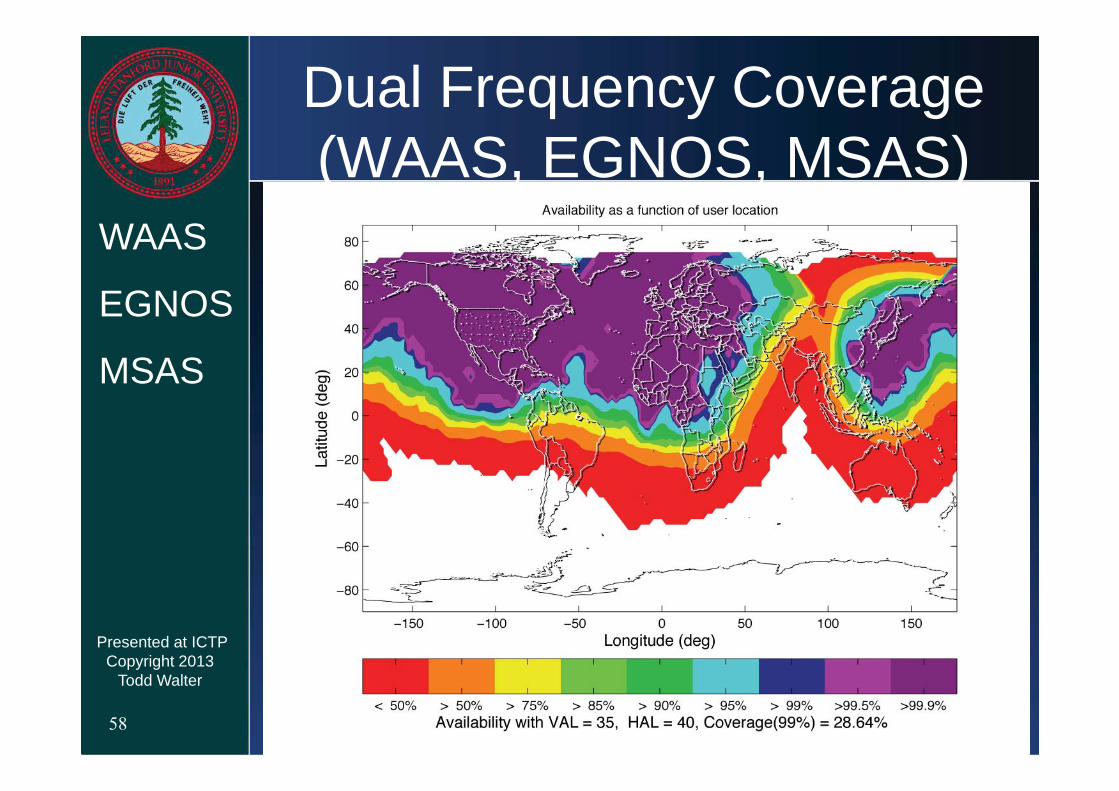
Dual Frequency Coverage (WAAS, EGNOS, MSAS)
WAAS
EGNOS
MSAS

Presented at ICTPCopyright 2013
Todd Walter
59
Dual Frequency Coverage (with GAGAN + Russia)
WAAS
EGNOS
MSAS
GAGAN
SDCM

Presented at ICTPCopyright 2013
Todd Walter
60
Dual Frequency + Second Constellation (Galileo)
WAAS
EGNOS
MSAS
GAGAN
SDCM

Presented at ICTPCopyright 2013
Todd Walter
61
Dual Frequency, Dual GNSS, Expanded Networks
WAAS
EGNOS
MSAS
GAGAN
SDCM

Presented at ICTPCopyright 2013
Todd Walter
62
ConclusionsGNSS can be used to provide aircraft navigation for all levels of serviceIntegrity is a key concern
Important to understand what can go wrong and how to protect users
Observation and data collection are key to understanding behavior
A long history of careful and consistent data monitoring are requiredPractical experience leads to trust and acceptance

Presented at ICTPCopyright 2013
Todd Walter
63
OutlineIonospheric ModelingIonospheric Threats
Other Integrity ThreatsIntegrity MethodologyNext Generation Satellite NavigationFuture SignalsConclusions

Presented at ICTPCopyright 2013
Todd Walter
64
IntegrityMonitor network or signal redundancy identifies observable threats
Protection against satellite failuresEphemeris errorsClock errorsSignal errors
Protection against ionospheric errors
Design assumes worst credible values for all unobservable threats

Presented at ICTPCopyright 2013
Todd Walter
65
Satellite Ephemeris Anomaly

Presented at ICTPCopyright 2013
Todd Walter
66
Satellite Signal Anomaly
Courtesy:Per Enge

Presented at ICTPCopyright 2013
Todd Walter
67
Evil Waveform Failure Mode ExampleComparison of Ideal and Evil
Waveform Signals for Threat Model C
C/A PRN Codes
Chips
Volts
Correlation Peaks
Code Offset (chips)
Nor
mal
ized
Am
plitu
de1/fd
Threat Model A: Digital Failure Mode (Lead/Lad Only: )Threat Model B: Analog Failure Mode ( Ringing Only: fd )
Note:Courtesy:Eric Phelts

Presented at ICTPCopyright 2013
Todd Walter
68
OutlineIonospheric ModelingIonospheric ThreatsOther Integrity Threats
Integrity MethodologyNext Generation Satellite NavigationFuture SignalsConclusions

Presented at ICTPCopyright 2013
Todd Walter
69
Overall Integrity ApproachConventional Differential GPS Systems Rely on Lack of Disproof
I ve been using it for N years and I ve never had a problem
10-7 Integrity Requires Active ProofAnalysis, Simulation, and Data Must Each Support Each Other
None sufficient by themselvesClear Documentation of Safety Rationale is Essential

Presented at ICTPCopyright 2013
Todd Walter
70
Interpretation of Probability of HMI < 10-7 Per Approach
Possible InterpretationsEnsemble Average of All Approaches Over Space and TimeEnsemble Average of All Approaches Over Time for the Worst LocationPrevious Plus No Discernable Pattern (Rare & No Correlation With User Behavior)Worst Time and Location

Presented at ICTPCopyright 2013
Todd Walter
71
Probability of Integrity FailureAverage Risk
Specific Risk
P( fault | condition) P(condition)all conditions
P( fault | condition)

Presented at ICTPCopyright 2013
Todd Walter
72
Probability of Being Struck by Lightning
From the Lightning Safety InstituteUSA population = 280,000,0001000 lightning victims/year/averageOdds = 1 : 280,000 of being struck by lightning
Not everyone has the same riskOne person struck 7 times
Naïve calculation: < 1e-38 probability
Presented at ICTPCopyright 2013
Todd Walter
73
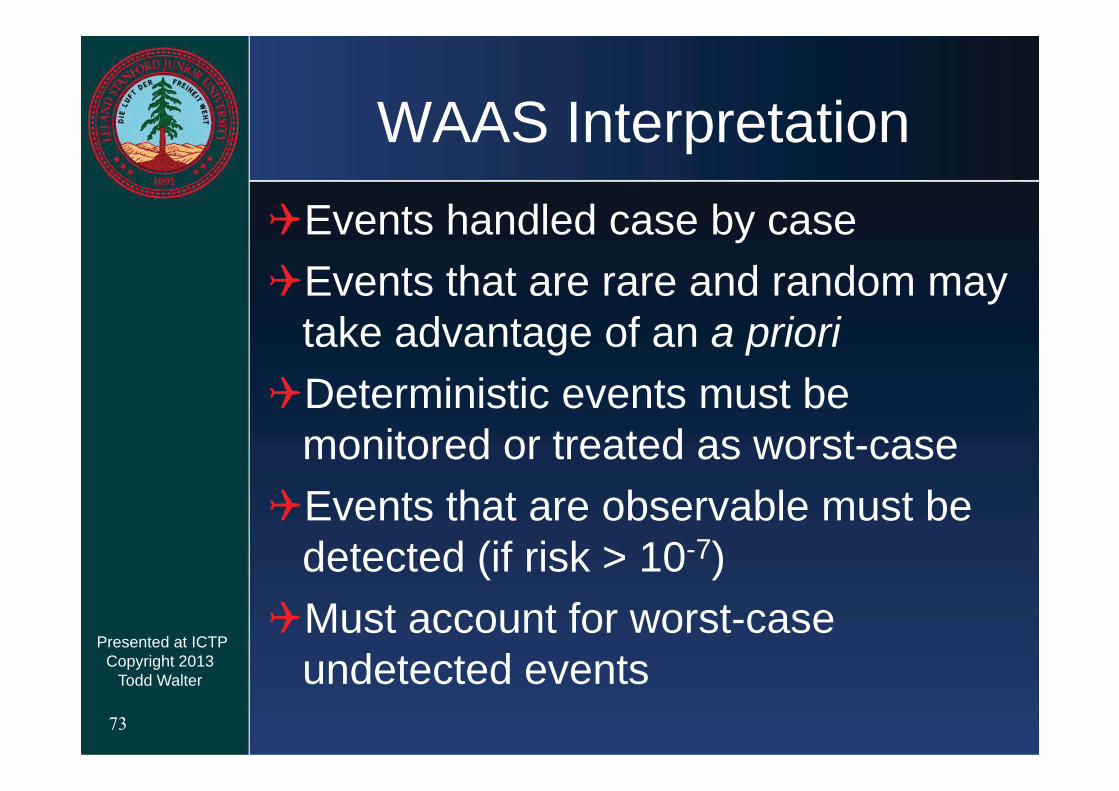
WAAS InterpretationEvents handled case by caseEvents that are rare and random may take advantage of an a prioriDeterministic events must be monitored or treated as worst-caseEvents that are observable must be detected (if risk > 10-7)Must account for worst-case undetected events

Presented at ICTPCopyright 2013
Todd Walter
74
Nominal WAAS Vertical Guidance Performance
Courtesy: FAA

Presented at ICTPCopyright 2013
Todd Walter
75
Vertical Guidance with Major Ionospheric Disturbance
Courtesy: FAA

Presented at ICTPCopyright 2013
Todd Walter
76
Nominal WAAS Horizontal Guidance Performance
Courtesy: FAA

Presented at ICTPCopyright 2013
Todd Walter
77
Horizontal Guidance in Major Ionospheric Disturbance
Courtesy: FAA