Embed Size (px)
Citation preview

Satellite Imagery Solution for Natural Resources 28
Satellite Imagery Solution for Natural Resources
Hideyuki Sakaguchi
Yoshiaki Kagawa
Yoriko Kazama, Ph.D.
INTRODUCTIONALMOST every day, people see newspaper articles about natural resources and related trends, such as forests to reduce CO2 (carbon dioxide) emissions, or market pricing for rare earth metals.
Natural resources include minerals, forests, biological resources, farmland, water, and oceans. However, because they are so widely distributed around the world, the limited range of terrestrial sensors makes their use for tasks such as resource exploration and monitoring difficult. Accordingly, high hopes are placed on the use of Earth observation satellites that orbit above the Earth and are able to observe wide area of the Earth at a time.
Satellite imagery has become familiar to people around the world since Google Earth*1 by Google Inc.*1, a major US Internet search provider, started the service to make satellite images of the entire world freely available.
Satellite imagery is now a familiar technology, and technical know-how in the use of satellite images is essential for deciding how they can be used to construct monitoring and other solutions for the natural resource sector.
Since the 1970s, Hitachi, Ltd.’s Defense Systems Company and its predecessor organizations have been involved in developing and delivering ground stations for Earth observation satellites, and also systems for analyzing and interpreting satellite images, particularly for users with national security responsibilities. The company has also provided solutions associated with systems for analyzing and interpreting satellite images.
Fig. 1 shows an overview of a solution for using satellite imagery to monitor natural resources.
In this article, some natural resources that relate to the environment (forests, farmland, and biological resources) are picked up as examples, their respective background factors and requirements are explained, and monitoring solutions using satellite imagery are described.
FORESTSThe development in the area of forestry resources
that is gaining the most attention at present is the REDD+ (reducing emissions from deforestation and forest degradation in developing countries-plus)
OVERVIEW: As concern grows about the limits of Earth resources, there is interest in the use of Earth observation satellites to identify and monitor these resources, and a range of technologies are required to construct the solutions used for this purpose. Forests, farmland, and biological resources are examples of natural environmental resources, and Hitachi is using its knowledge and expertise gained from its experience in the development and delivery of systems that use satellite imagery to build solution models for monitoring these resources. For the future, Hitachi intends to proceed with the global deployment of solutions in each of these sectors, while also contributing to the use of satellite imagery for monitoring natural environmental resources, as part of its global total solutions such as smart cities.
*1 Google and Google Earth are trademarks of Google Inc.
Fig. 1—Overview of Solution for Natural Resource Monitoring Using Satellite Imagery.It is anticipated that satellite imagery will be used in the natural resource sector, including for forestry, farmland, and biological resources.
Imageacquisition plan Image collection Image processing
Deliverables Image analysisand interpretation
Site survey
Forest resourceFarmlandBiological resources, etc.

Hitachi Review Vol. 61 (2012), No. 1 29
mechanism for CO2 emissions trading in developing economies.
REDD+ was proposed by Papua New Guinea and Costa Rica at the 11th Conference of the Parties (COP 11) to the United Nations Framework Convention on Climate Change held in Montreal, Canada in 2005. Although the mechanism initially only covered deforestation, because this excluded developing economies other than Brazil, Indonesia, and various equatorial African nations from gaining any benefits, “forest degradation” was added at the 2007 COP 13 held in Bali, Indonesia, resulting in the “REDD” designation. The mechanism took on its current form, “REDD+,” at the 2008 COP 14 held in Poznan, Poland where forest conservation, sustainable forest management, and increasing forest carbon stocks were added as the “plus” component of “REDD+” in recognition that afforestation measures undertaken by countries such as India also had merit.
Subsequently, it was agreed at COP 16 held in Cancun, Mexico in 2010 that developing economies should formulate and implement plans for reducing CO2 emissions below their current level by 2020, and also be subject to international verification.
According to figures produced by the United Nations, the size of the REDD+ market is 1.2 to 2.4 trillion yen per year, of which the portion associated with calculating the accumulation of carbon stocks is estimated at about 144 billion yen (8% of the total of the REDD+ market). It is expected that this will provide a new market for satellite imagery.
In REDD+, developing countries should plot past CO2 emissions by forest degradation and deforestation from calculation in each period and then extrapolate these to estimate future emissions (see Fig. 2). The difference between these estimates and actual CO2 emissions provides the tradable instruments (incentives).
At COP 15 in 2009, the Subsidiary Body for Scientific and Technological Advice (SBSTA), whose role is to provide scientific and technical information and advice to the COP, decided to use the changes in the level of a forest’s carbon stocks to calculate changes in its CO2 emissions and to use the calculation method from the latest guidelines produced by the Intergovernmental Panel on Climate Change (IPCC) (the “IPCC Guidelines”). The guidelines propose the following formula for calculating carbon stocks using a combination of remote sensing and ground surveys.
Carbon stocks (C-ton) = Σ forest area (ha) × carbon density (C-ton/ha)
In this calculation, it is anticipated that remote sensing will be used to measure forest area and ground surveys will be used to measure carbon density.
The aim of the COP discussion was to use this at both the national and the subnational levels, and to draw CO2 emissions curves covering the period from 1990, in the same way as the Kyoto Protocol.
The satellites that can satisfy these geographical coverage and time period requirements for measuring the area of forest cover include Landsat (a US satellite with a resolution of 30 m/pixel) and SPOT*2 (a French satellite with a resolution of 2.5 to 10 m/pixel), which have been observing the Earth since before 1990.
Fig. 3 shows example satellite images of a forest area. As evident from the images, it should be possible to use the satellite images to identify the presence or absence of forest, the types of trees (species), and the area covered.
The ground surveys calculate the biomass for the type of trees growing in the region being surveyed at the national or subnational level. For each species, this involves cutting down a number of trees of varying height, measuring the dry mass, and then producing a regression formula that can calculate biomass as a function of tree height for that species. However, if it is not possible to calculate the biomass for each region,
*2 SPOTIMAGE and SPOT are trademarks or registered trademarks of Spot Image S.A. in France and other countries.
Fig. 2—REDD+ Mechanism.REDD+ calculates past CO2 emissions and then estimates future emissions. The incentives (tradable instruments) are the difference between estimated and actual emissions.
REDD+: reducing emissions from deforestation and forest degradation in developing countries-plus
Emissions due todeforestation andforest degradation
Reference emissionlevel (baseline)
Economicincentives
Actual emissions(monitoring)
Source: “Japan’s Response to REDD+ and Progress of Methodology Study,” Forestry Agency(3)
TimeStart point
Emissionreduction
level
Past
Emissions estimatesfrom historic emission data, etc.

Satellite Imagery Solution for Natural Resources 30
the value from the IPCC Good Practice Guidance is used instead.
Fig. 4 shows a forest monitoring solution for REDD+ that uses satellite imagery and is based on these considerations.
As explained above, REDD+ involves using a combination of satellite imagery and ground surveys to determine changes in forest carbon stocks.
The main sources of satellite images for calculating carbon stocks from around 1990 would be the Landsat and SPOT satellites. Satellite images from the PRISM and AVNIR-2 optical sensors on the Japanese Daichi ALOS (advanced land observing satellite) could also have been used for calculations from 2006.
The types of high order image processing required for satellite images include orthorectification, which involves projecting the images onto a map, and pansharpening, whereby the resolution of a multispectral image is adjusted to match a high-resolution panchromatic image.
The techniques used for image analysis and interpretation are supervised classification, which supports the visual measurement of area and identification of tree species, and object-based image classification, which is suitable for dividing an area up into segments and which facilitates the identification of boundaries between forest and non-forest areas or classifying areas by tree species. It is also anticipated that techniques such as automatic classification of tree species and use of the NDFI (normalized difference fraction index) to identify areas of forest degradation in medium-resolution satellite images will be able to be used for image analysis and interpretation in the future.
For site surveys (ground surveys), a laser and/or supersonic distance measuring instrument and breast height diameter are needed when surveying the distribution of trees to calculate biomass. CO2 emissions are calculated from the measurements obtained by these instruments and the results extracted from the satellite images.
However, as developing and emerging economies are concentrated in equatorial regions, where the weather is often poor, with cloud cover present for a high proportion of the time, and as images are taken from optical sensors attached to satellites orbiting
Fig. 3—Satellite Images of Forest Area.These images (of Canberra, Australia) with 2.5-m resolution were taken by the French SPOT satellite. They can be used to determine the presence or absence of forest, the types of trees (species), and the forest area.
© Spot Image
Image acquisition plan Image collection Image processing
Landsat, SPOT, or other satellites
• Orthorectification• Mosaic• Pansharpen• Atmospheric
correction
• Supervised or object-based image classification
• NDFI
Image analysis and interpretation
Site survey
Measurementof logged area
Measurementof biomass
Measurement of treediameter and height
Imageclassification
Standard/higherorder processing
Capture newimages/acquirefrom archive.
Survey archive imagesfor time period and
area of interest.
Determine whethernew images needto be captured.
DeliverablesResults of CO2 emissions calculation
Forest mapprocessing
CO2 emissioncalculationprocessing
Emissions due todeforestation andforest degradation
Referenceemission
level (baseline)
Economicincentives
Actual emissions(monitoring)
TimeStart point
Emissionreduction
level
Past
Emissions estimated from historic emission data, etc.
Fig. 4—REDD+ Solution Using Satellite Imagery and Associated Technologies.Both satellite imagery and site surveys are required to implement the solution.
NDFI: normalized difference fraction index
Hitachi Review Vol. 61 (2012), No. 1 31
as much as 500 to 1,000 km above the ground, it is possible that some target areas will not be able to be observed during the desired time period. A potential solution to this problem is to use SAR (synthetic aperture radar), which, being a radar-based sensor, is able to observe the Earth’s surface regardless of the weather condition.
In this section, we discussed how the REDD+ measurement method relates to the national and subnational levels dealt with at the COP. In the case of voluntary carbon markets involving smaller areas such as individual municipalities, on the other hand, where calculation of CO2 emissions since 1990 would not be required (unlike the COP), it is anticipated that these will mainly use high-resolution (0.5- to 0.6-m range) satellite images such as those from the QuickBird and World View-2 satellites of US company DigitalGlobe, Inc.*3 to which Hitachi has distribution rights.
FARMLANDManagement of farmland resources can be broadly
divided into land use management and cultivation management (managing land effectively to improve the quantity and quality of crop production).
According to the “International Contribution to Field of Agricultural Water”(4) publication of the Ministry of Agriculture, Forestry and Fisheries of Japan, growth in the global total of cultivated area has slowed to the point where it can no longer keep up with population growth, and therefore the per capita land area under cultivation is falling year by year. This has led to concern about the global food supply.
Two potential ways to counter this are to increase the land area under cultivation or to increase production per unit of land area.
The former requires that land currently used for other purposes, such as forestry, would be converted into farmland, but this has potential negative environmental consequences, such as increased CO2 emissions resulting from the conversion of forests to farms, for example. In the latter case, however, it may be possible to increase production per unit of land area by using monitoring of land, crops, and other factors for cultivation management.
Rice grown in rice paddies (wet rice) is a major crop in Asia, which contains about 60% of the 1,020 million people in the world with inadequate nutrition. In this section, we discuss improving the yield of paddy rice as a way of dealing with the region’s food problems.
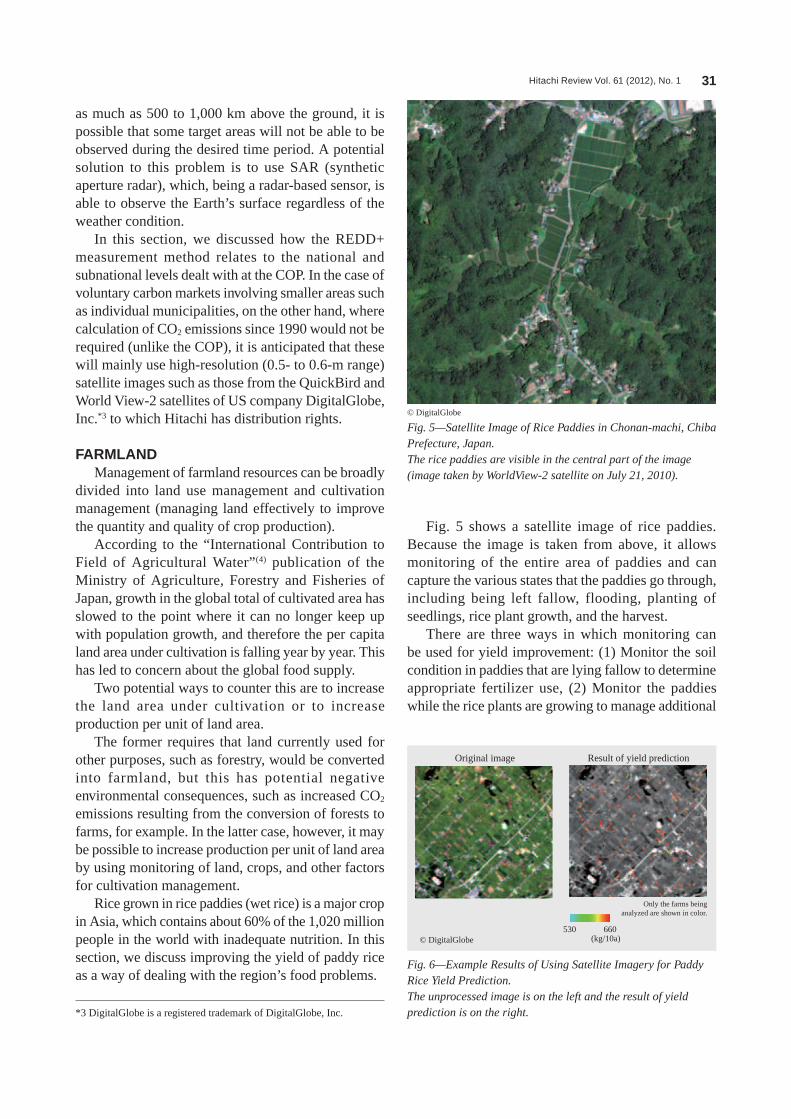
Fig. 5 shows a satellite image of rice paddies. Because the image is taken from above, it allows monitoring of the entire area of paddies and can capture the various states that the paddies go through, including being left fallow, flooding, planting of seedlings, rice plant growth, and the harvest.
There are three ways in which monitoring can be used for yield improvement: (1) Monitor the soil condition in paddies that are lying fallow to determine appropriate fertilizer use, (2) Monitor the paddies while the rice plants are growing to manage additional
*3 DigitalGlobe is a registered trademark of DigitalGlobe, Inc.
© DigitalGlobe
Fig. 5—Satellite Image of Rice Paddies in Chonan-machi, Chiba Prefecture, Japan.The rice paddies are visible in the central part of the image (image taken by WorldView-2 satellite on July 21, 2010).
Fig. 6—Example Results of Using Satellite Imagery for Paddy Rice Yield Prediction.The unprocessed image is on the left and the result of yield prediction is on the right.
Original image Result of yield prediction
530
Only the farms beinganalyzed are shown in color.
660(kg/10a)© DigitalGlobe

Satellite Imagery Solution for Natural Resources 32
fertilizer use and water levels, and (3) Monitor the paddies at harvest time to estimate the yield so that this information can be utilized in paddy field soil improvement for the following year.
Fig. 6 shows one example of using monitoring to improve yield. The image shows the result of prediction of paddy rice yield by combining multispectral satellite images with simulations of paddy rice growth based on information such as local weather data.
Fig. 7 shows a satellite-imagery-based monitoring solution for improving paddy rice yield that takes account of these considerations.
Although the overall sequence of operations is similar to the forestry case, one difference is that image collection uses images with medium spatial resolution in place of high-resolution images depending on the size of the rice paddies being observed.
Moreover, because it is essential to capture images in the short period of time during and immediately prior to the harvest, it is necessary to consider using aircraft such as UAVs (unmanned aerial vehicles) to capture the images in addition to satellites.
Another difference from the forestry case is that yield prediction needs to be performed in the image analysis and interpretation stage. As protein content is believed to influence palatability, it is also possible to get an indication of the quality of the paddy rice by using the satellite-imagery-based monitoring solution to analyze its protein content based on the NDVI (normalized difference vegetation index).
BIOLOGICAL RESOURCESInterest in the problem of biodiversity has risen
since The Tenth Meeting of the Conference of Parties (COP 10) to the Convention on Biological Diversity in Nagoya, Japan, was held in October 2010. The biological resources provided by biodiversity are not only a source of economic benefits such as tourist sites and the production of food, wood, and pharmaceuticals, they also bring benefits such as reducing natural disasters, producing oxygen, regulating temperature and humidity, and recycling water.
At the present time, the rate at which species are going extinct has reached 1,000 times the natural rate, with about 40,000 species thought to become extinct each year. COP 6 held in 2002 at The Hague in the Netherlands responded to this crisis by setting the “2010 Targets” which aimed to significantly reduce the rate of species loss. Although the targets were not achieved in terms of actual results, new “Aichi Target” for the post-2010 period were adopted at COP 10.
The Aichi Target set numerical targets for the area of land subject to ecosystem protection, something that was not included in the 2010 Targets, and called on countries to do more to protect biodiversity. In addition to chairing the COP 10 meeting, Japan should have leadership role in this area as it is among the richest economies in the world in terms of biodiversity.
Overseas, initiatives are being put in place to use market mechanisms to help protect biodiversity. A representative example of these initiatives is the
WorldView-2, SPOT, or other satellites
Aircraft
Image analysisOverlay of
agricultural fieldinformation
Site survey
Protein contentmeasurement(sampling)
Weatherinformation
Image analysis and interpretationDeliverables
Support data for cultivation management
Image acquisition plan Image collection
Capture newimages/acquirefrom archive.
Survey archive imagesfor time period and
area of interest.
Determine whethernew images needto be captured.
Image processing
Standard/higherorder processing
Yield prediction
530Only the farms beinganalyzed are shown in color.660
(kg/10 a)
• Orthorectification• Mosaic• Pansharpen• Atmospheric
correction
• Yield prediction• NDVI
Fig. 7—Monitoring Solution Using Satellite Image for Improving Paddy Rice Yield.The observation period should be around the growth period of crops, so that it is necessary to consider using other measures such as UAVs (unmanned aerial vehicles) in addition to satellites.
NDVI: normalized difference vegetation index

Hitachi Review Vol. 61 (2012), No. 1 33
application of “biodiversity offsets.” This involves making quantitative estimates of the ecosystem losses resulting from land development and offsetting these losses by restoring or protecting an equivalent amount of ecosystem in a different location. The mechanism has been enshrined in law in approximately 30 countries from around the world including USA and Australia. Also, a market is being established where ecosystem recovery or protection already undertaken by a third party can be sold to developers in the form of rights.
TEEB (The Economics of Ecosystems and Biodiversity), also known as “the Stern Review on the
biodiversity,” predicts that the market for biodiversity offsets will reach 1 trillion yen by 2020.
Two important factors for biodiversity offsets are (1) deciding where to offset ecosystem losses resulting from development, and (2) performing monitoring to confirm that the new offset ecosystem is being protected.
One way of choosing a suitable offset location (1) is to use satellite imagery to classify types of land cover. This is not simply a matter of whether the offset location is covered by vegetation, and also depends on surrounding land use. This means it is necessary to use satellite imagery to produce maps indicating the type of land cover that can then be used to look for suitable locations for offsetting against the land being developed.
Fig. 8 shows an example of a land cover map produced using images from the WorldView-2 satellite.
For monitoring (2), the condition of vegetation at the offset location can be monitored by using a satellite to capture images regularly of selected parts of the region concerned. Because satellites, unlike aircraft, already orbit the Earth and therefore do not need to be flown to perform monitoring, they reduce the associated workload. NDVI, an indicator that represents the level of plant growth, is a good way to monitor the condition of vegetation. It is also anticipated that even more detailed monitoring will be possible using satellite imagery from the WorldView-2 satellite that supports the red edge band that can be used to assess plant health and growth.
Fig. 8—Example Land Cover Map Produced Using Images from WorldView-2 Satellite.The natural color image is on the left and the color-coded land cover image is on the right.
Natural color imageColor-coded
land cover image
Water area
Shadow
Trees
Fairway
Grass
Green (Golf)
Fields (for sports)
Asphalt
Concrete
Sand
Gray rooftop
Pool
Soil
Clay
Red rooftop
Fig. 9—Monitoring Solution for Biodiversity Offsets Using Satellite Imagery.As biodiversity offsets are targeted at places where land development is being undertaken, high-resolution images from the QuickBird, WorldView-2, and other satellites are suitable for this solution.
Natural color imageColor-coded
land cover image
Water area
Shadow
Trees
Fairway
Grass
Green (Golf)
Fields (for sports)
Asphalt
Concrete
Sand
Gray rooftop
Pool
Soil
Clay
Red rooftop
QuickBird, WorldView-2, or other satellites
Imageclassification
Selection ofpotential offset
locations
Site survey
Land usedata (sampling)
Image analysis and interpretationDeliverables
Data on potential offset locations
Image acquisition plan Image collection
Capture newimages/acquirefrom archive.
Survey archive imagesfor time period and
area of interest.
Determine whethernew images needto be captured.
Image processing
Standard/higherorder processing
• Orthorectification• Mosaic• Pansharpen• Atmospheric
correction
• Supervised classification/object-based image classification
• NDVI, etc.

Satellite Imagery Solution for Natural Resources 34
Fig. 9 shows a monitoring solution for biodiversity offsets that uses satellite imagery and takes account of these considerations.
Because biodiversity offsets are targeted at places where land development is being undertaken and involve small areas, this application suits use of high-resolution images such as those from the QuickBird and WorldView-2 satellites.
As in the forestry case, supervised or object-based image classification and use of NDVI to indicate the level of plant growth can be used in the image analysis and interpretation stage. When using images from the WorldView-2 satellite, the red edge band can also potentially be used to perform more detailed monitoring.
CONCLUSIONSThis article has used specific natural resources
that relate to the environment (forests, farmland, and biological resources) as examples, explaining their respective background factors and requirements and also describing monitoring solutions that use satellite imagery.
Because satellite imagery can collect information efficiently, continuously, and uniformly for large areas anywhere in the world, it is a powerful form of information that can be used for things like exploration and monitoring of natural resources throughout the globe.
Meanwhile, its ability to provide objective data means that it can be used as calculation and verification data for trading of instruments such as REDD+ and biodiversity offsets.
For the future, Hitachi intends to proceed with the global deployment of solutions in each of these sectors, while also contributing to the use of satellite imagery for monitoring natural environmental resources, as part of its global total solutions such as smart cities.
REFERENCES(1) GOFC-GOLD, “REDD Sourcebook,” http://www.gofc-gold.
uni-jena.de/redd/(2) Forestry and Forest Products Research Institute, “Textbook
for REDD Plus Training for Silviculturalists,” (Dec. 2010) in Japanese.
(3) Forestry Agency, “Japan’s Response to REDD+ and Progress of Methodology Study,” http://www.jbic.go.jp/ja/about/topics/2010/0908-01/100727_redd_akahori.pdf in Japanese.
(4) Ministry of Agriculture, Forestry and Fisheries of Japan, “International Contribution to the Field of Agricultural Water,” (Jun. 2010) in Japanese.
(5) Hokkaido Regional Development Bureau, Ministry of Land, Infrastructure, Transport and Tourism, “Revised Manual for Practical Application of Remote Sensing to Agriculture in Hokkaido,” (Mar. 2008) in Japanese.
(6) K. Hayashi et al., “Introduction to Biodiversity, Ecosystems, and Economics,” Chuohoki Publishing Co., Ltd. (2010) in Japanese
Yoshiaki KagawaJoined Hitachi Software Engineering Co., Ltd. in 2001, and now works at the Location Intelligence Systems Department, Location Intelligence Division, Global Business Development & Operations Group, Hitachi Solutions, Ltd. He is currently engaged in the distribution of high resolution satellite imagery and development of services utilizing spatial information including satellite imagery.
Hideyuki SakaguchiJoined Hitachi, Ltd. in 2005, and now works at the Planning & Engineering Department, Intelligence and Information Systems Division, Defense Systems Company. He is currently engaged in the development of remote sensing imagery systems and planning of satellite imagery systems in the field of Earth resources.
Yoriko Kazama, Ph.D.Joined Hitachi, Ltd. in 2005, and now works at the Social Information Systems Research Department, Central Research Laboratory. She is currently engaged in research and development of remote sensing and satellite imagery analysis technologies. Dr. Kazama is a member of The Remote Sensing Society of Japan and the Japan Geoscience Union.
ABOUT THE AUTHORS