Embed Size (px)
Citation preview

SATELLITE AND SUBMARINE
INTERNATIONAL CONNECTIVITY IN
THE PACIFIC
02 August 2017– SuvaITU / PITA Workshop
MS CONSULTING TAHITI

Presentation overview
1. The common Pacific Islands’ challenge : Move from the Kb/s per user to Mb/s
2. The current context for satellite connectivity and Submarine cable
3. Benchmarks elements
4. The future : Satellite and submarine cables
5. Moving to the Gb/s Era !
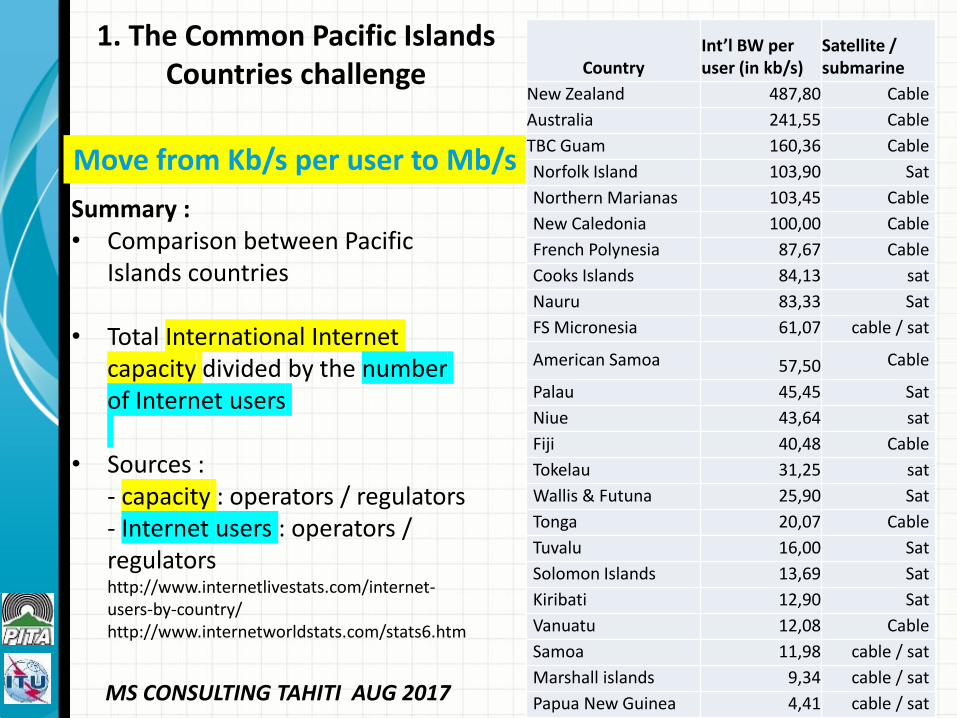
1. The Common Pacific Islands Countries challenge
Move from Kb/s per user to Mb/s !
CountryInt’l BW per user (in kb/s)
Satellite / submarine
New Zealand 487,80 Cable
Australia 241,55 Cable
TBC Guam 160,36 Cable
Norfolk Island 103,90 Sat
Northern Marianas 103,45 Cable
New Caledonia 100,00 Cable
French Polynesia 87,67 Cable
Cooks Islands 84,13 sat
Nauru 83,33 Sat
FS Micronesia 61,07 cable / sat
American Samoa 57,50 Cable
Palau 45,45 Sat
Niue 43,64 sat
Fiji 40,48 Cable
Tokelau 31,25 sat
Wallis & Futuna 25,90 Sat
Tonga 20,07 Cable
Tuvalu 16,00 Sat
Solomon Islands 13,69 Sat
Kiribati 12,90 Sat
Vanuatu 12,08 Cable
Samoa 11,98 cable / sat
Marshall islands 9,34 cable / sat
Papua New Guinea 4,41 cable / sat
Summary : • Comparison between Pacific
Islands countries
• Total International Internet capacity divided by the numberof Internet users
• Sources :- capacity : operators / regulators- Internet users : operators / regulatorshttp://www.internetlivestats.com/internet-users-by-country/http://www.internetworldstats.com/stats6.htm
MS CONSULTING TAHITI AUG 2017

1. Common Pacific Islands Countries challenge
Move from Kb/s per user to Mb/s !4
87
.80
24
1.5
5
16
0.3
6
10
3.9
0
10
3.4
5
10
0.0
0
87
.67
84
.13
83
.33
61
.07
57
.50
45
.45
43
.64
40
.48
31
.25
25
.90
20
.07
16
.00
13
.69
12
.90
12
.08
11
.98
9.3
4
4.4
1
INTERNATIONAL BANDWIDTH PER USER (IN KB/S)
MS CONSULTING TAHITI – Aug 2017

2. The context for international connectivity
2016 : Satellite operators believe in the Pacific
O3B
ABS Satellite
EUTELSAT
KACIFIC
Intelsat
TelesatJSAT
SES
2005 : One fixed orbit satellite for the East Pacific !

2. The context for satellite and submarine cable connectivity
Yes, several good news!
• Satellite prices are driven down by strong competition
• New Generation GEO High Throughput Satellite (HTS) can achieve over 500 Gb/s total capacity – come planned for the Pacific
• New Flat panel antennas technology will enable to push costs / prices down
• full available satellite diversity for the Pacific islands (ABS – Intelsat –SES – O3B – Eutelsat – Inmarsat – Skyperfect JSAT - Kacific ….)
• By 2023 MEO / LEO will bring Tb/s additional capacity in Pacific skies

2. The context for satellite and submarine cable connectivity
More good news!
• Growing traffic volumes on existing recent submarine cable systems drives the price down (Fiji, PF, NC, Tonga, Vanuatu)
• Several new cable projects will be improving international connectivity with additional regional hubs to Fiji
• By 2020 combined planned initiatives may bridge the connectivity gap for the Pacific both relying on satellite and submarine cable systems

But still Bad news !
• Small volumes keeps price high for satellite bandwidth for small islands operators
• Too many satellite technologies to embrace for small operators
• Existing submarine cables have to be made redundant by more satellite or 2nd cables
• Still limited international backhaul options for Pacific islands (Fiji is the sole hub with Southern Cross Cable : Sydney or Hawaii / Us mainland)
• High prices of capacity on several countries with single cable causes low volumes
• For smaller islands the time for STM1s (155 Mb/s) is finished now talking> 10Gb/s and more
2. The context for satellite and submarine cable connectivity

3. Benchmark elementsPrices for satellite connectivity
Prices in US$ per Mbps per month (*)
low high
Small capacity<10 Mbps
1000 2000
Medium capacity<50 Mbps
600(over 900 in 2013)
1300
High capacity> 100 Mbps
< 250(over 700 in 2013)
800
(*) based on a 3 – 5 years contract for satellite point to point link GEO / MEO - C / Ku / Ka
Satellite bandwidth prices ranges in the Pacific
Fierce competition have pushed the satellite capacity prices down dramatically
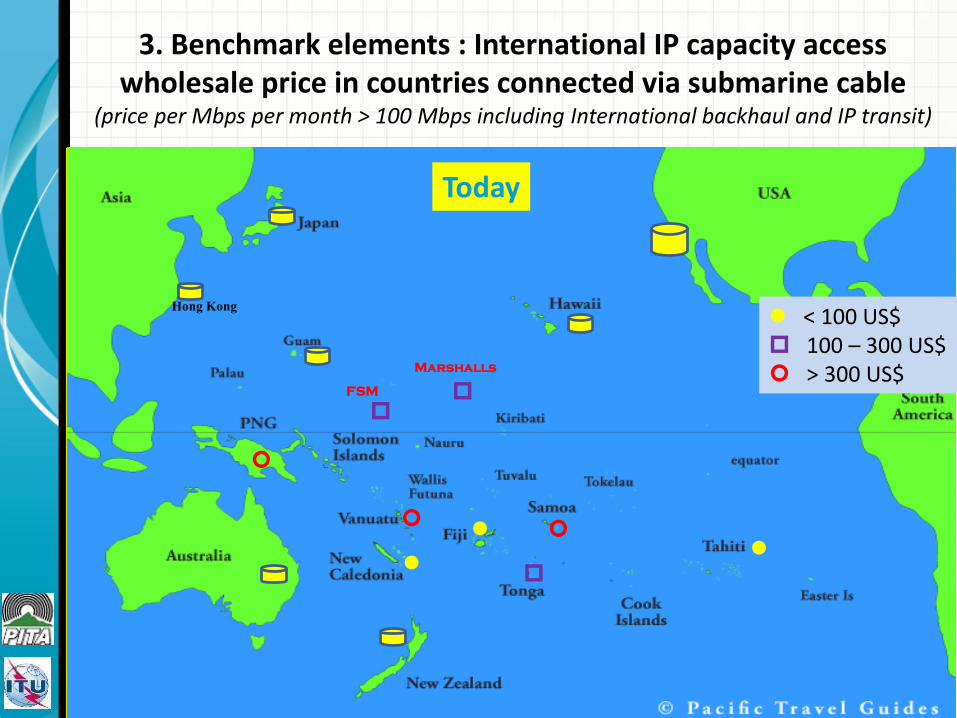
3. Benchmark elements : International IP capacity accesswholesale price in countries connected via submarine cable
(price per Mbps per month > 100 Mbps including International backhaul and IP transit)
Hong Kong < 100 US$ 100 – 300 US$ > 300 US$
FSM
Marshalls
Today

3. Benchmark elements : New Caledonia’s experiencevolumes impacts on prices
2800 US$
85 US$
16 Gbs
1 Gbs
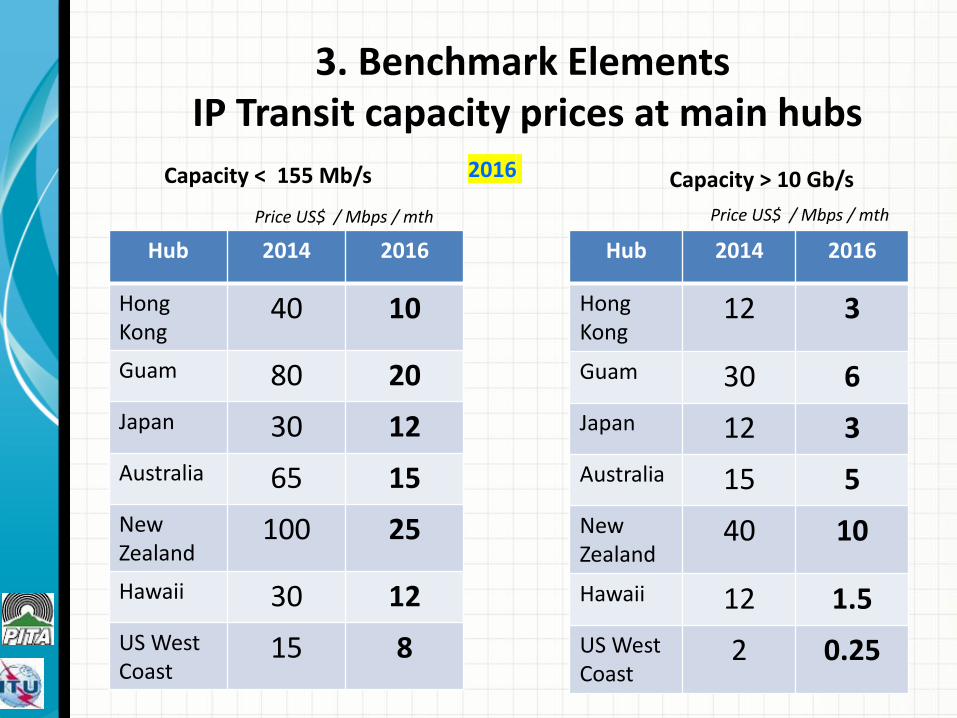
3. Benchmark ElementsIP Transit capacity prices at main hubs
Hub 2014 2016
Hong Kong
40 10
Guam 80 20
Japan 30 12
Australia 65 15
New Zealand
100 25
Hawaii 30 12
US WestCoast
15 8
Hub 2014 2016
Hong Kong
12 3
Guam 30 6
Japan 12 3
Australia 15 5
New Zealand
40 10
Hawaii 12 1.5
US WestCoast
2 0.25
Capacity < 155 Mb/s
Price US$ / Mbps / mth Price US$ / Mbps / mth
Capacity > 10 Gb/s2016

Source: TeleGeography
Median Monthly IP Transit Prices, Q2
2008-Q2 2013
2016 < 0.25 US$
NEXT ?
3. Benchmark Elements Worldwide IP transit pricing trends

14
4. The future : More submarine cables are being built to connect the Pacific islands !
Marshall Is.
Saipan
In 2024 ?
<<

15
4. The Future for satellite connectivityNew Satellite systems will bring additional capacity and extended coverage of the Pacific in the future – Means cheaper prices ?

16
4. The future – would High Altitude platforms (HAPS) be a reality in the region ?

17
5. Moving Towards Gb/s speeds ?
18
• Networks Technology is ready to accommodate Gb/s speeds (Fiber to the Home – mobile 5 G)
• Heavy investments will be required
• Multi- Gb/s is already achievable with existing submarine cables connecting Pacific Islands
• More islands connected via submarine cables and new high throughput satellites
Moving to the Gb/s will be a reality by 2020 in the Pacific Island region
5. Moving towards Gb/s speeds ?

BULA VINAKA