Embed Size (px)
Citation preview
1
1798/DBR/2013
भारत सरकार
जल संसाधन मंत्रालय
कें द्रीय भूजल बोर्ड GOVERNMENT OF INDIA
MINISTRY OF WATER RESOURCES
CENTRAL GROUND WATER BOARD
महाराष्ट्र राज्य के अतंर्डत सातारा जजले की
भूजल विज्ञान जानकारी GROUND WATER INFORMATION
SATARA DISTRICT
MAHARASHTRA
By द्िारा Abhay Nivasarkar अभय ननिसरकर
Scientist-B िैज्ञाननक - ख मध्य क्षेत्र, नार्पुर
CENTRAL REGION, NAGPUR 2013
i
SATARA DISTRICT AT A GLANCE
1. LOCATION
North latitude : 17°05’ to 18°11’
East longitude : 73°33’ to 74°54’
Normal Rainfall : 473 -6209 mm
2. GENERAL FEATURES Geographical area : 10480 sq.km. Administrative division : Talukas – 11 ; Satara ,
Mahabeleshwar (As on 31.3.2013) Wai, Khandala, Phaltan, Man,Jatav,
Koregaon Jaoli, , Patan, Karad. Towns : 10 Villages : 1721 Watersheds : 52
3. POPULATION (2001, 2010 Census) : 28.09,000., 3003922
Male : 14.08,000, 1512524 Female : 14.01,000, 1491398
Population growth (1991-2001) : 14.59, 6.94 % Population density : 268 , 287 souls/sq.km. Literacy : 78.22 % Sex ratio : 995 (2010 Census) Normal annual rainfall : 473 mm 6209 mm (2001-2010)
4 GEOMORPHOLOGY Major Geomorphic Unit : Western Ghat, Foothill zone , Central , : Plateau and eastern plains Major Drainage : Krishna, Nira, Man 5 LAND USE (2010) Forest area : 1346 sq km Net Sown area : 6960 sq km Cultivable area : 7990 sq km
6 SOIL TYPE : 2 Medium black, Deep black
7 PRINCIPAL CROPS Jawar : 2101 sq km Bajara : 899 sq km Cereals : 942 sq km Oil seeds : 886 sq km Sugarcane : 470 sq km 8 GROUND WATERMONITORING Dugwell : 46 Piezometer : 06
9 GEOLOGY Recent : Alluvium
ii
Upper-Cretaceous to Eocene : Deccan Trap (Basalt) 10 HYDROGEOLOGY Water Bearing Formation : Basalt- Weathered /Fractured /
Jointed/ Vesicular/ massive/ under Phreatic and semi confined condition
11 WATER LEVEL Premonsoon Depth to water level May 2011 0.09 to 16.2 mbgl Post Monsoon Depth to water (Nov 2011) 0.02 to 13.65 mbgl Water Level Trend Pre -monsoon Water Level Trend (2001-2010) Rise 0.019 to 0.972 m/year Fall 0.003 to 0.627 m/year Post Monsoon Water level trend (2001-2010) Rise 0.006 to 0.887m/year Fall Neglible to 0.323 m/year Annual Trend (2001-2010) Rise 0.009 to 0.790 m/year Fall 0.031 to 0.245 m/year 12 GROUND WATER EXPLORATION AS ON 31.3.2013
Wells EW 19, OW 09 Depth Range 67 to 301 m Discharge Trace to 15 lps
13 GROUND WATER QUALITY Ground Water is Suitable for Drinking and irrigation purpose 14 DYNAMIC GROUND WATER RESOURCES : (As on 31/3/2009)
Net Annual Ground Water Availability 105584.1 HAM
Existing Gross Ground Water Draft for irrigation 68650.12 HAM
Existing Gross Ground Water Draft for domestic and industrial water supply
4743.316 HAM
Existing Gross Ground Water Draft for All uses (11+12)
73393.43 HAM
Provision for domestic and industrial requirement supply to 2025
9396.149 HAM
Net Ground Water Availability for future irrigation development (10-11-14)
27582.26 HAM
Stage of Ground Water Development 69.51%
Over Exploited taluka : None Critical taluka : None Semi-Critical taluka : None 15 RURAL WATER SUPPLY (March 2005)
Total Villages : 1721 Piped water supply schemes : 3354

iii
Dugwells : 1336 Hand pumps/ Borewells : 8969
0
Ground Water Information
Satara District
Contents 1.0 Introduction .......................................................................... 1 2.0 Climate and Rainfall ............................................................ 4 3.0 Geomorphology and Soil Types ........................................ 5 4.0 Ground Water Scenario ....................................................... 6 4.1 Hydrogeology ........................................................................................ 6 4.2 Water Level Scenario ............................................................................ 8 4.3 Aquifer Parameter ............................................................................... 13 4.4 Yield of Dug Wells & Bore Wells ........................................................ 14 4.5 Ground Water Resources ................................................................... 15 4.5 Ground Water Quality ......................................................................... 16 4.7 Status of Ground Water Development .............................................. 19
5.0 Ground Water Management Strategy ............................... 20 5.1 Ground Water Development ............................................................... 20 5.2 Water Conservation and Artificial Recharge .................................... 21
6.0 Ground Water Related Issues and Problems ................... 21 7.0 Mass Awareness and Training Activities ......................... 22 7.1 M.A.P. and W.M.T.P. ............................................................................ 22
8.0 Areas Notified by CGWA/SGWA ....................................... 22 9.0 Recommendations ............................................................. 22
List of Figures 1. Administrative Set up 2. Hydrogeology 3. Location of Monitoring Stations 4. Depth to Water Level (Premonsoon- May 2011) 5. Depth to Water Level (Postmonsoon- Nov. 2011) 6. Ground Water Resources
List of Tables
1. Studies undertaken by CGWB 2. Ground Water Exploration Data (2012) 3. Annual Rainfall Data (2001-2010) 4. Water Level Data (2011) 5. Water Level Trend Data Data (2001-2010) 6. Aquifer Parameters 7. Yield of Dug Wells and Bore Wells 8. Taluka wise Ground Water Resources (2008-2009) 9. Classification of Ground Water Samples based on BIS Drinking Water Standards (IS-10500-91, Revised 2003) 10. Classification of Ground Water for Irrigation Based on EC 11. Nature and Yield Potential of Aquifers
1
GROUND WATER INFORMATION
DISTRICT SATARA
1.0 Introduction
Satara district is one of the oldest districts and located in western part of
Maharashtra State. In 1960 Northern Satara district was named as Satara and Southern
Satara district named as Sangli district. It is bounded by Pune district in the north,
Solapur district in the east, Sangli district in the south and Ratnagiri district in the west.
Raigad district lies to its north-west. Satara district is located in the western part of
Deccan plateau and lies between 17°05’ and 18°11’ north latitudes and 73°33’ and
74°54’ east longitudes. The entire area of the district falls in parts of Survey of India
degree sheet No’s 47-G, 47-K, 47-J and 47-F. The district has an area of 10480 sq.km,
which constitutes about 3% of the total area of Maharashtra. Prior to 1971, district had
9 talukas but presently there are 11 talukas. These talukas consist of 1721 villages
including 20 unhabited villages besides 10 towns.
The total population of Satara district as per 2001 census is 28.09,000, out of
which rural population is 2398765 (85%). Schedule Caste and Schedule Tribe population
is 233014 and 18342 respectively. The male population is 14.08,000, and female
population is 14.01,000 whereas the population density is 268 souls/sq.km. The
increase in population is 14.590% over the period of 10 years from 1991 to 2001
Satara is one of the famous districts for tourist destination. Mahabaleshwar and
Panchghani are the two hill stations which have great tourism attraction and Pratapgarh
have quite a historical importance. Shingarpur, Sajjangarh, Pusgaon, Godavale, Buchafal
are the religious places of great importance. A figure showing taluka boundaries is
shown in figure 1.
2
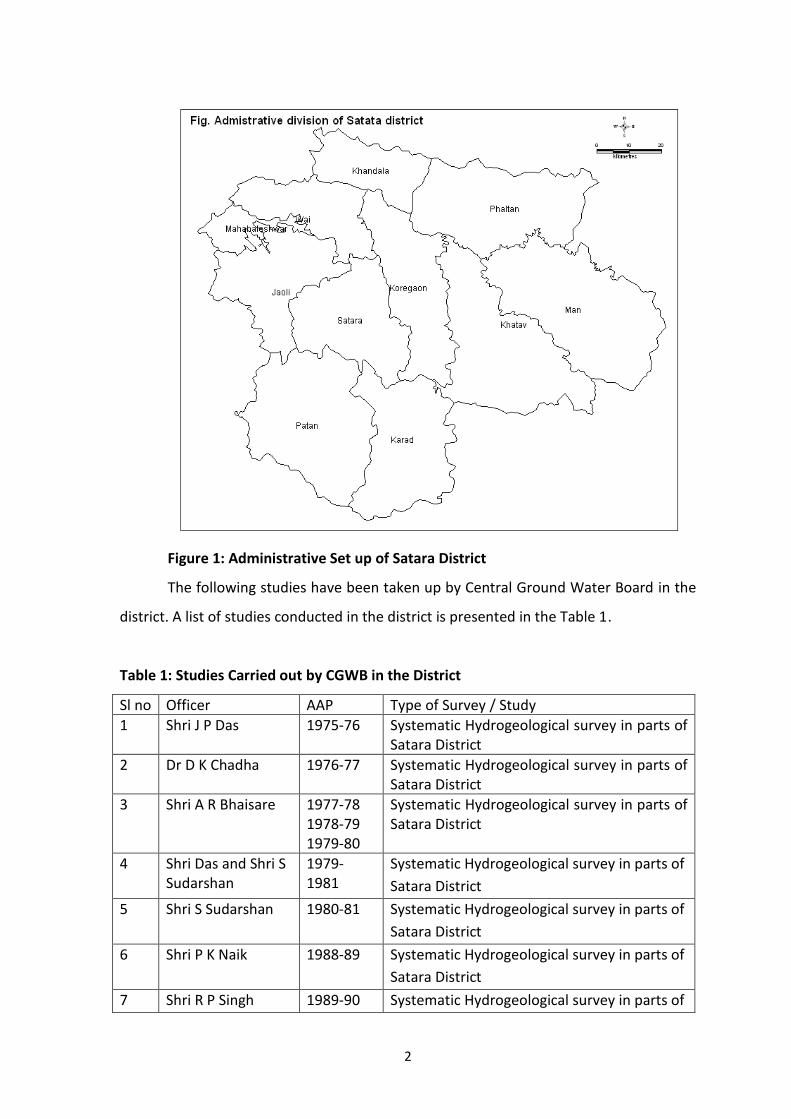
Figure 1: Administrative Set up of Satara District
The following studies have been taken up by Central Ground Water Board in the
district. A list of studies conducted in the district is presented in the Table 1.
Table 1: Studies Carried out by CGWB in the District
Sl no Officer AAP Type of Survey / Study
1 Shri J P Das 1975-76 Systematic Hydrogeological survey in parts of Satara District
2 Dr D K Chadha 1976-77 Systematic Hydrogeological survey in parts of Satara District
3 Shri A R Bhaisare 1977-78 1978-79 1979-80
Systematic Hydrogeological survey in parts of Satara District
4 Shri Das and Shri S Sudarshan
1979-1981
Systematic Hydrogeological survey in parts of
Satara District
5 Shri S Sudarshan 1980-81 Systematic Hydrogeological survey in parts of
Satara District
6 Shri P K Naik 1988-89 Systematic Hydrogeological survey in parts of
Satara District
7 Shri R P Singh 1989-90 Systematic Hydrogeological survey in parts of
3
Satara District
8 Shri D K Rai 1989-90 Systematic Hydrogeological survey in parts of
Satara District
9 Shri A Sudarsha 1991-92 ReappraisaHydrogeological survey in parts of Satara District
10 Dr P K Naik 1991-92 1992-93
Reappraisal Hydrogeological survey in parts of Satara District
11 S/Shri K.P. Dongre and A. Nivasarkar
2011-12 Ground Water Management Studies in of Man Basin.
In addition to above studies a report on ground water resource and development
potential of Satara district, Maharashtra was compiled during year 2005-06 by Shri.
Sourabh Gupta, Scientist-D.
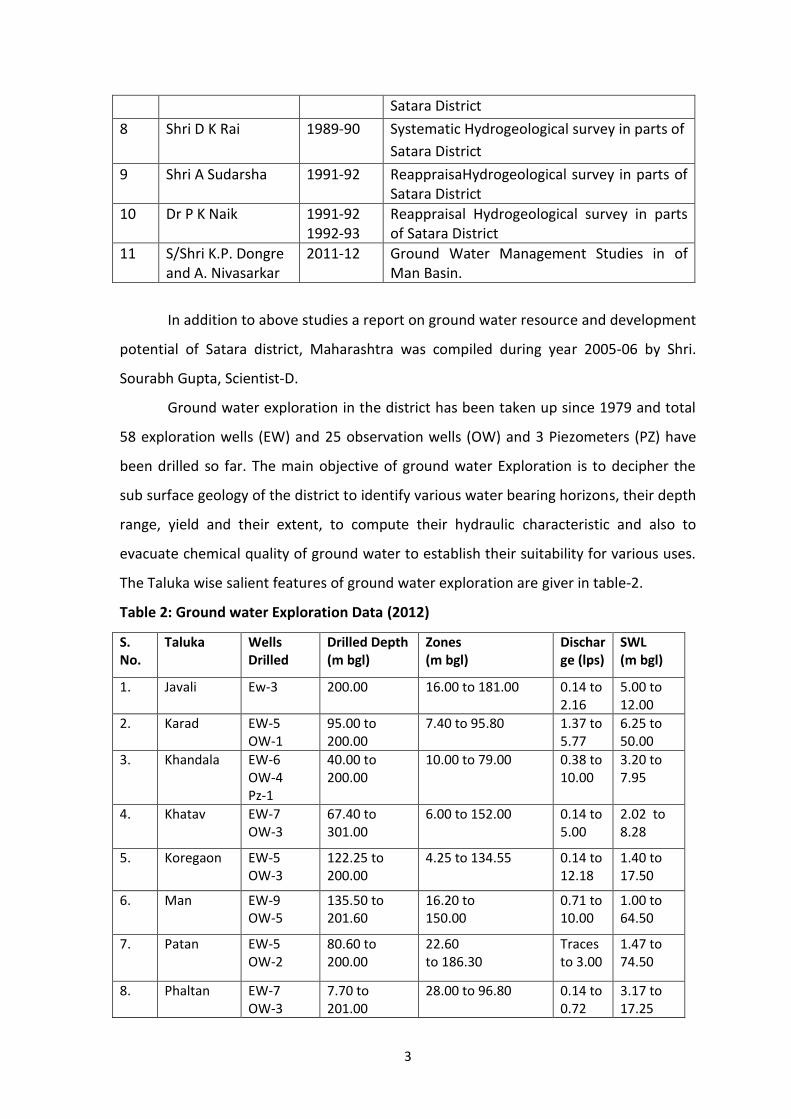
Ground water exploration in the district has been taken up since 1979 and total
58 exploration wells (EW) and 25 observation wells (OW) and 3 Piezometers (PZ) have
been drilled so far. The main objective of ground water Exploration is to decipher the
sub surface geology of the district to identify various water bearing horizons, their depth
range, yield and their extent, to compute their hydraulic characteristic and also to
evacuate chemical quality of ground water to establish their suitability for various uses.
The Taluka wise salient features of ground water exploration are giver in table-2.
Table 2: Ground water Exploration Data (2012)
S. No.
Taluka Wells Drilled
Drilled Depth (m bgl)
Zones (m bgl)
Discharge (lps)
SWL (m bgl)
1. Javali Ew-3 200.00 16.00 to 181.00 0.14 to 2.16
5.00 to 12.00
2. Karad EW-5 OW-1
95.00 to 200.00
7.40 to 95.80 1.37 to 5.77
6.25 to 50.00
3. Khandala EW-6 OW-4 Pz-1
40.00 to 200.00
10.00 to 79.00 0.38 to 10.00
3.20 to 7.95
4. Khatav EW-7 OW-3
67.40 to 301.00
6.00 to 152.00 0.14 to 5.00
2.02 to 8.28
5. Koregaon EW-5 OW-3
122.25 to 200.00
4.25 to 134.55 0.14 to 12.18
1.40 to 17.50
6. Man EW-9 OW-5
135.50 to 201.60
16.20 to 150.00
0.71 to 10.00
1.00 to 64.50
7. Patan EW-5 OW-2
80.60 to 200.00
22.60 to 186.30
Traces to 3.00
1.47 to 74.50
8. Phaltan EW-7 OW-3
7.70 to 201.00
28.00 to 96.80 0.14 to 0.72
3.17 to 17.25
4
Pz-1
9. Satara EW-6 OW-2 Pz-1
177.10 to 201.5.50
35.00 to 36.00 152.00 to 153.00
2.16 to 5.15
1.40 to 18.20
10. Wai EW-5 OW-1 Pz-1
5.70 to 200.00
12.00 to 16.00 Traces to 3.00
1.60 to 17.29
11. Total EW-58 OW-25 PZ-3
5.70 to 301.00
4.25 to 186.30 Traces to 10.00
1.00 to 64.50
The perusal of Table-2 shows that the depth of 58 EW and 25 OW and 3 Pz drilled
in hard rock area (Deccan trap basalt) of the district varies from 5.70 to 301.00 meters
below ground level (m bgl). The water bearing zones were encountered in the depth
range of 4.25 to 186.30 m bgl, which shows that the deeper zones below 50 m depth
have also been encountered at many places in the district indicating that the water can
also been drawn from deeper aquifer in case of scarcity for drinking water supply. The
discharge of the wells drilled in the district varies between traces to10.00 liters per
second (lps).
2.0 Climate and Rainfall
The climate of the district is on the whole is agreeable. The winter season is from
December to about the middle of February followed by summer season which last up to
May. June to September is the south-west monsoon season, whereas October and
November constitute the post-monsoon season. The mean minimum temperature is
14.40 C and mean maximum temperature is 36.8 C at Satara town in the district.
The rainfall analysis for the period 1901-2005 revels that the normal annual
rainfall over the district varies from 473 to about 6209 mm. In the eastern part of the
district around Mhasawad (Man taluka) and Phaltan taluka it is minimum and increases
toward the west and reaches maximum around Mahabaleshwar. However, probability of
occurrence of normal rainfall is maximum (50 to 55%) in the south eastern part around
Mhaswad (Man), Vaduj, Pusewadi and Karad. While the probability of receiving excess
rainfall (i.e. 25% or more) varies from 9% to 30%. It is minimum around Mhaswad (9%)
and maximum around pusewadi (30%). The study also reveals that entire north eastern
5
and south western part of district comprising almost entire khandala, phaltan, khatav,
mhaswad talukas and part of Koregaon and Karad talukas which experienced drought for
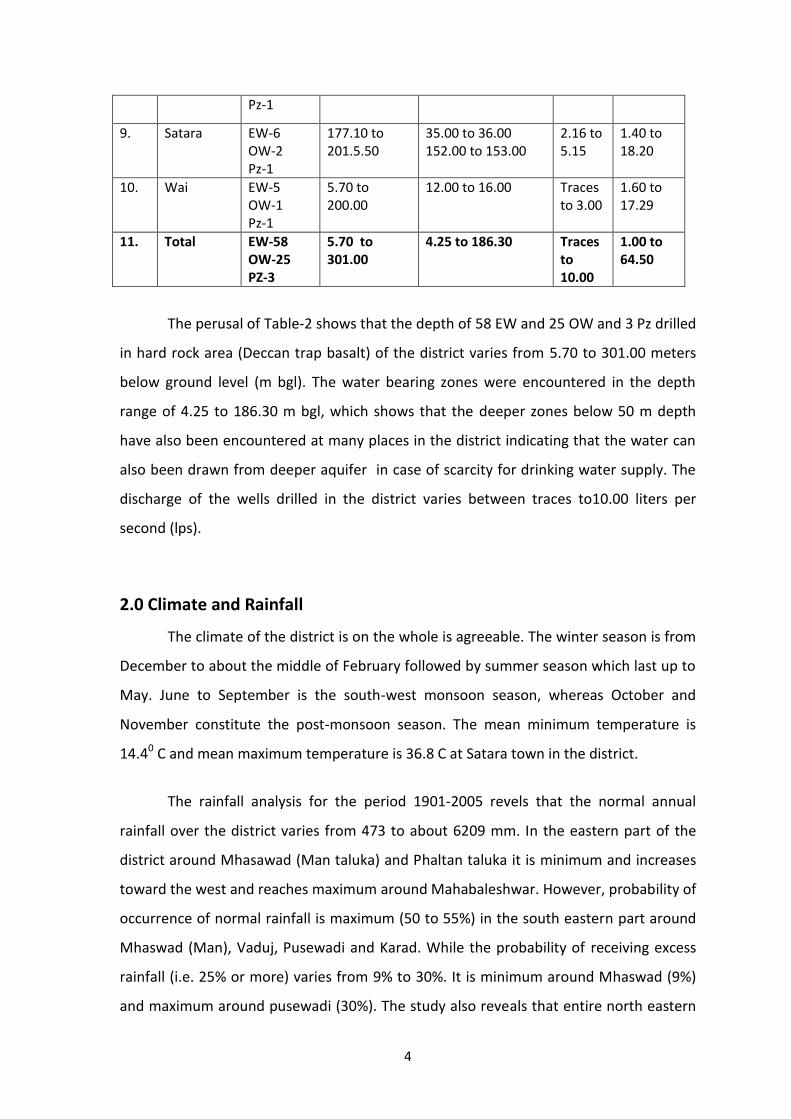
more than 20% of the years can be categorized as “drought area”. The average rainfall
data for the period (1998-2010) are represented in table-3.
The perusal of table-3 indicated that the average annual rainfall during the period
ranges between 550.5 mm (Man) to 5830.3 mm (Mahabaleshwar).
Table 3: Annual Rainfall Data for 2001-2010 (in mm)
Station 2001 2002 2003 2004 2005 2006 2007 2008 2009 2010 Average
Javali 1092.5 1320.1 1191.9 1103.6 3679.2 2760.0 1679.1 1505.5 1438.9 1529.8 1730.1
Karad 654.9 467.2 419.4 777.9 1230.8 1070.3 1025.1 807.5 730.0 875.1 805.8
Khandala 349.7 NA NA 760.4 735.6 685.9 685.9 426.6 560.3 638.5 605.4
Khatan 518.6 398.8 NA 951.5 684.2 602 593.3 390.4 854.7 839.6 648.1
Koregaon 519.8 586.2 393.6 987.6 1435.5 1345.8 895.2 537.6 846.8 912.4 846.1
Mahabaleshwar 4500.8 5094.3 4441 6506.9 8824.3 8669.2 6265 5584.01 4193.8 4223.3 5830.3
Man 357.6 353.0 NA 534.2 572.8 558.6 595.2 416.5 797 769.5 550.5
Patan 1203.4 1244.7 987.7 1612.8 3250.9 2851.6 2221 1200 1154.7 1522.8 1724.9
Phaltan 478.4 344.3 NA 764.5 471.8 698.2 725 332.7 864.4 1034.4 634.9
Satara 1031.6 341.6 586.7 1092.7 1849.8 1676.1 1232 723.1 936.5 1013.7 1048.4
Wai 678.0 561.6 541.2 1129.7 1574.30 1510.8 1033 795.0 895.6 1032.2 975.2
3.0 Geomorphology and Soil type
The district forms part of Deccan plateau of Sahayadri hill range. The residual hill
ranges and the intermediate valley, all well developed on the table land surface form the
main geomorphic element of landscape in the district. In the west, the district has the
Sahaydrian scarp with its major peaks usually flat topped and intervening saddles. The
Mahadeo range, which is next major well developed range in he district, beings as an
off-shoot of the Sahayadri in the north western part. Eastward it runs as a main range
and sets several minor ranges south-eastward and southwards. However,
physiographically the district can be broadly divided in four major units viz., (i) hills and
ghats, (ii) foothills zones, (iii) plateaus and (iv) plains.
The entire satara district falls in he drainage of thee major rivers, Nira, river in
the entire northern part, Man river in the south-east and the Kishna river in the south.
Krishna river which is one of the major rivers of Southern Peninsula rises on the eastern
6
brow of the Mahabelshwar plateau in the district and flows for about 176 km. in the
district. Kudal, Vena, Urmodi, Tarli, Koyna, Vasna and Verla rivers are the main
tributaries of Krishna river. The entire river system has parallel to semi-dendritic
drainage pattern and the drainage density is quite high in the district. Based on the
geomorphic setting and drainage pattern, the district is divided into 50 watersheds
4.0 Ground water Scenario
4.1 Hydrogeology
The entire district is underlying by Deccan trap basaltic lava flow of Upper Cretaceous to
Lower Eocene age. The shallow alluvial formation of recent age also occurs as narrow
stretch along the major rivers flowing in the district however, they have limited areal
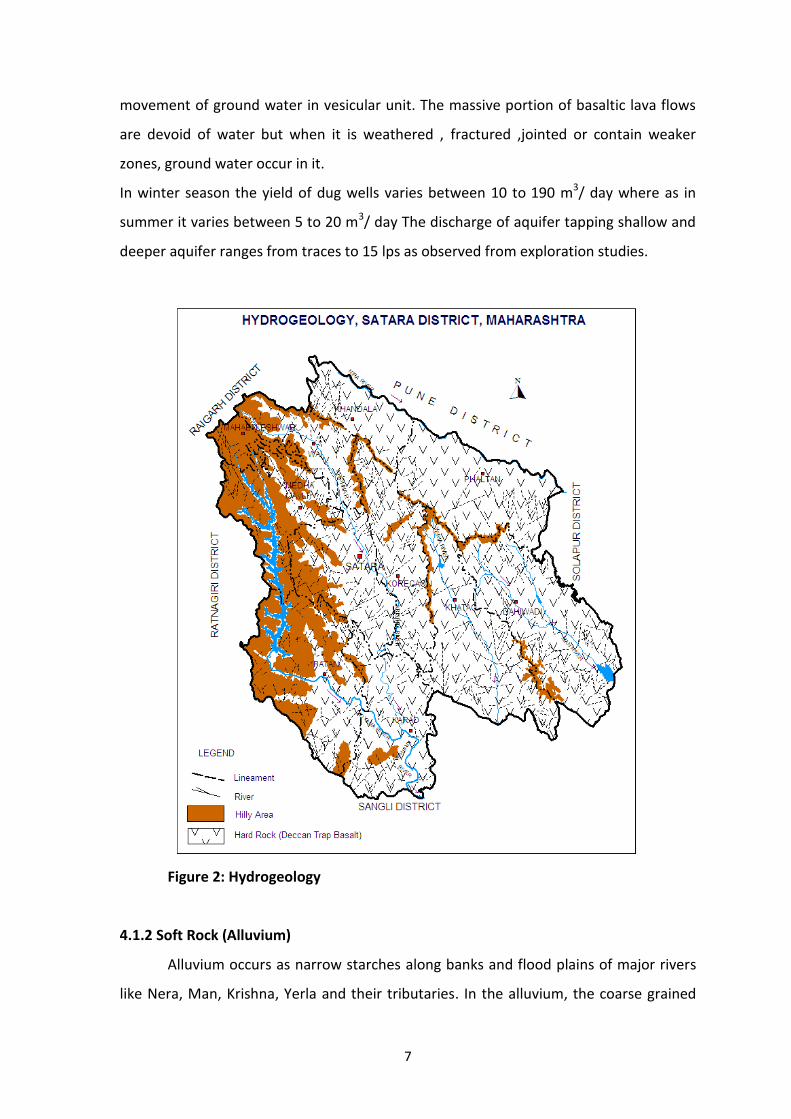
extension. Hydrogeology of the district is shown in Figure 2.
4.1.1 Hard rock (Deccan Trap Basalt)
Deccan trap occupies about 95% of the area of the district. It occurs as basaltic
lava flows which are normally horizontal and deposited over wide stretch and give rise
to tabular type of topography also known as plateau. These flows occur in layered
sequence ranging in thickness from 4 to 66 m.
Flows are represented by massive portion at bottom and vesicular portion at top
and are separated from each other by marker bole bed. Thickness of weathering varies
widely in the district from 5 m to 20 m bgl. The weathered and fractured flows occurring
in topographic lows form the main aquifer in the district.
The ground water occurs under phreatic, semi –confined and confined
conditions. Generally, the shallower zones down to depth of 20 m bgl form phreatic
aquifer. The water bearing zones occurring between the depth of 20 m and 40 m are
weathered interflow of shear zones and have water under semi-confined condition.
Deep confined aquifers occur below the depth of 40m. The vesicular thickness of
different lava flows varies from 8 to 10 m and forms the potential aquifer zones.
However, the nature and density of vesicles their distribution, interconnection, depth of
weathering and topography of the area are decisive factor for occurrence and
7
movement of ground water in vesicular unit. The massive portion of basaltic lava flows
are devoid of water but when it is weathered , fractured ,jointed or contain weaker
zones, ground water occur in it.
In winter season the yield of dug wells varies between 10 to 190 m3/ day where as in
summer it varies between 5 to 20 m3/ day The discharge of aquifer tapping shallow and
deeper aquifer ranges from traces to 15 lps as observed from exploration studies.
Figure 2: Hydrogeology
4.1.2 Soft Rock (Alluvium)
Alluvium occurs as narrow starches along banks and flood plains of major rivers
like Nera, Man, Krishna, Yerla and their tributaries. In the alluvium, the coarse grained
8
detrital material like sand and gravel usually occurring as lenses form good aquifer,
However they have limited aquifer extent. The ground water occurs in phreatic
condition in flood plain alluvium deposit near the river banks.
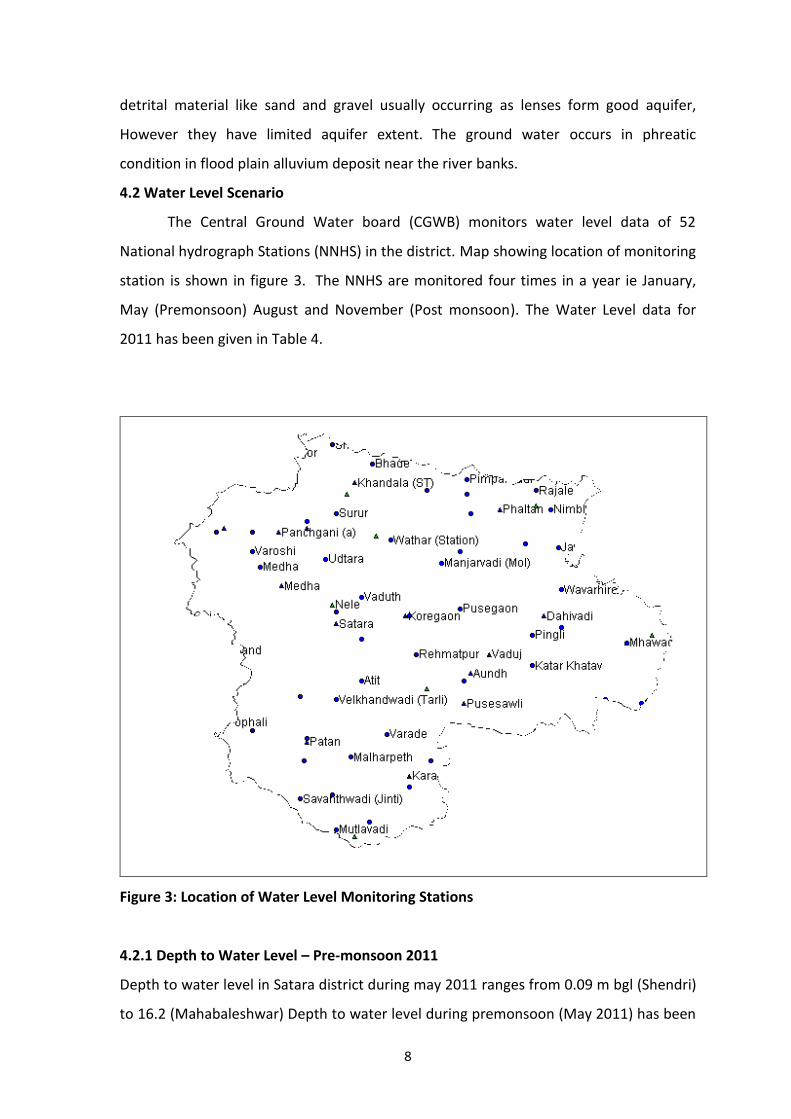
4.2 Water Level Scenario
The Central Ground Water board (CGWB) monitors water level data of 52
National hydrograph Stations (NNHS) in the district. Map showing location of monitoring
station is shown in figure 3. The NNHS are monitored four times in a year ie January,
May (Premonsoon) August and November (Post monsoon). The Water Level data for
2011 has been given in Table 4.
Figure 3: Location of Water Level Monitoring Stations
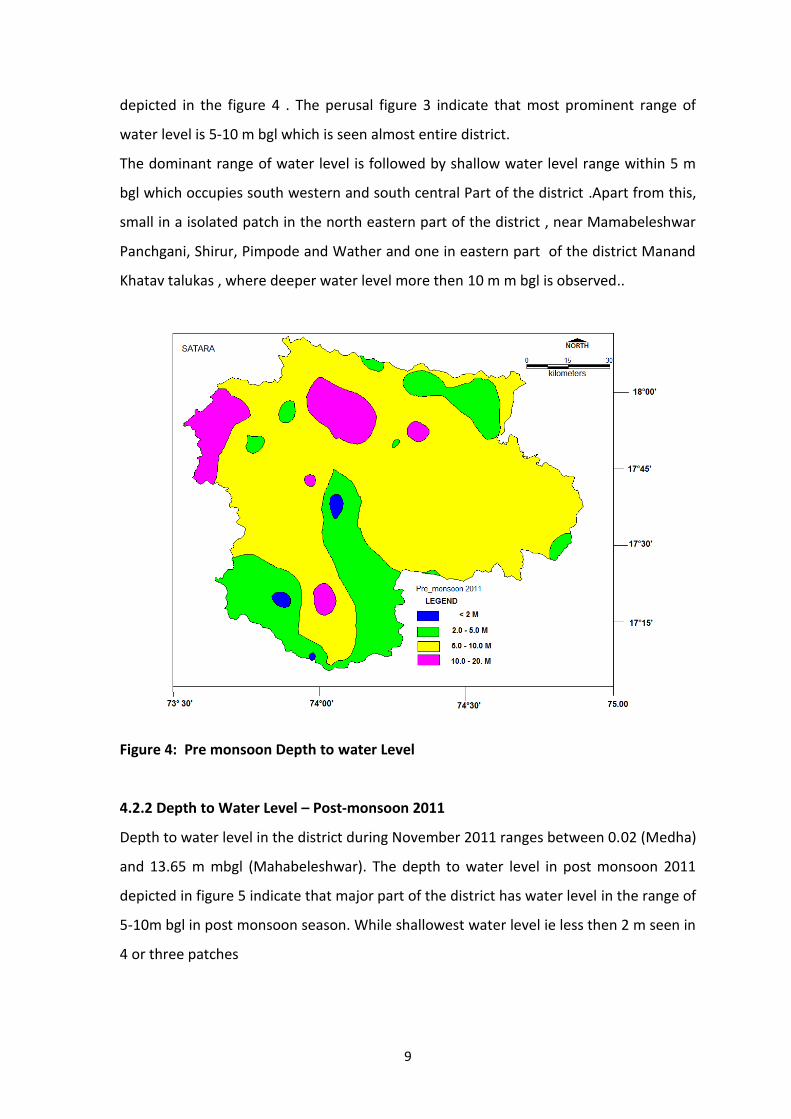
4.2.1 Depth to Water Level – Pre-monsoon 2011
Depth to water level in Satara district during may 2011 ranges from 0.09 m bgl (Shendri)
to 16.2 (Mahabaleshwar) Depth to water level during premonsoon (May 2011) has been
9
depicted in the figure 4 . The perusal figure 3 indicate that most prominent range of
water level is 5-10 m bgl which is seen almost entire district.
The dominant range of water level is followed by shallow water level range within 5 m
bgl which occupies south western and south central Part of the district .Apart from this,
small in a isolated patch in the north eastern part of the district , near Mamabeleshwar
Panchgani, Shirur, Pimpode and Wather and one in eastern part of the district Manand
Khatav talukas , where deeper water level more then 10 m m bgl is observed..
Figure 4: Pre monsoon Depth to water Level
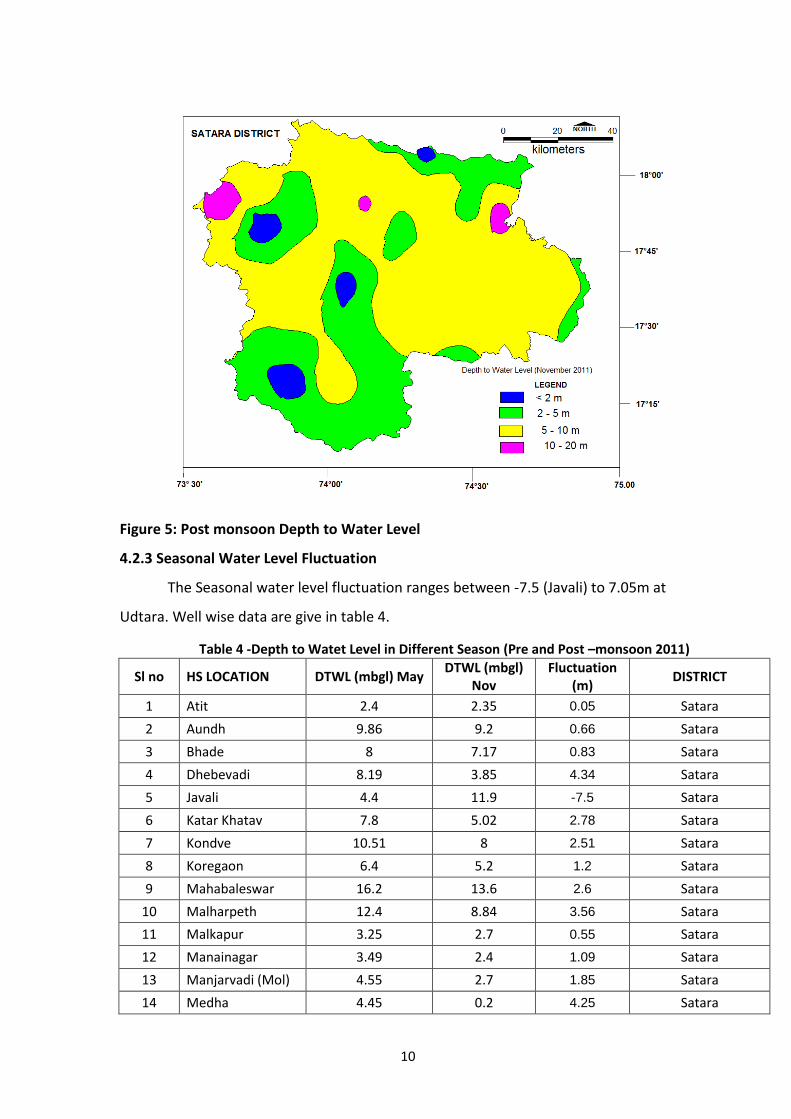
4.2.2 Depth to Water Level – Post-monsoon 2011
Depth to water level in the district during November 2011 ranges between 0.02 (Medha)
and 13.65 m mbgl (Mahabeleshwar). The depth to water level in post monsoon 2011
depicted in figure 5 indicate that major part of the district has water level in the range of
5-10m bgl in post monsoon season. While shallowest water level ie less then 2 m seen in
4 or three patches
10
Figure 5: Post monsoon Depth to Water Level
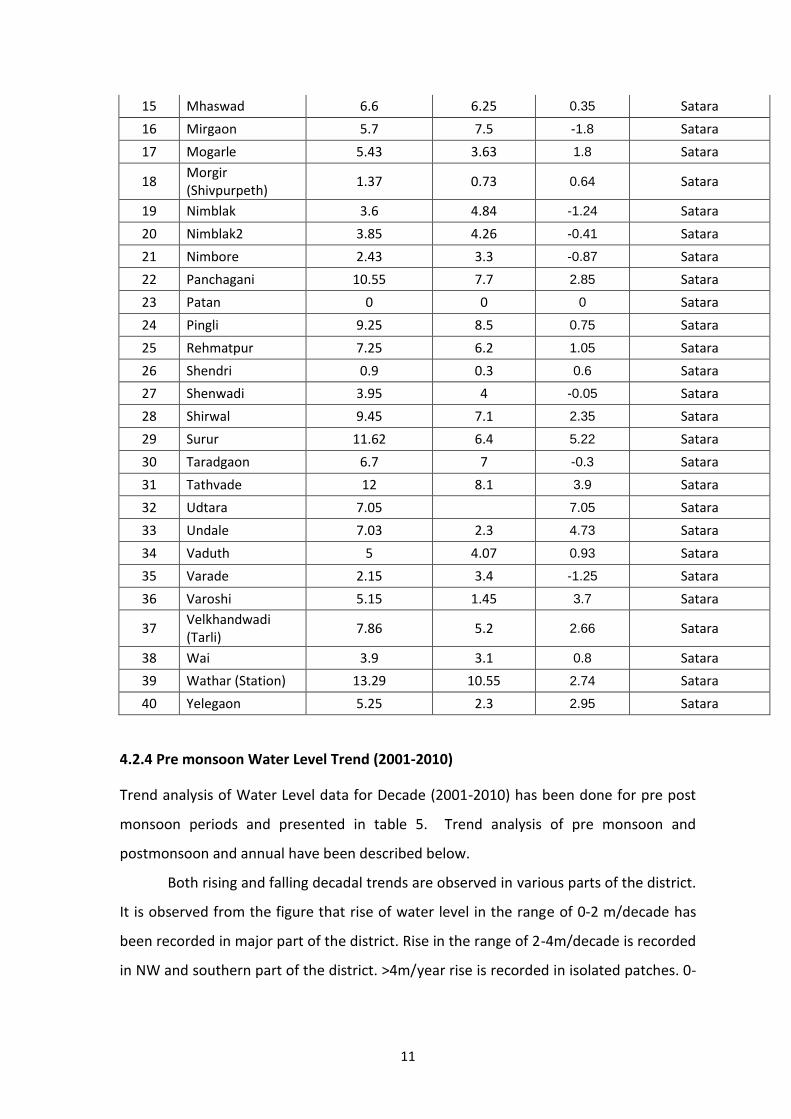
4.2.3 Seasonal Water Level Fluctuation
The Seasonal water level fluctuation ranges between -7.5 (Javali) to 7.05m at
Udtara. Well wise data are give in table 4.
Table 4 -Depth to Watet Level in Different Season (Pre and Post –monsoon 2011)
Sl no HS LOCATION DTWL (mbgl) May DTWL (mbgl)
Nov Fluctuation
(m) DISTRICT
1 Atit 2.4 2.35 0.05 Satara
2 Aundh 9.86 9.2 0.66 Satara
3 Bhade 8 7.17 0.83 Satara
4 Dhebevadi 8.19 3.85 4.34 Satara
5 Javali 4.4 11.9 -7.5 Satara
6 Katar Khatav 7.8 5.02 2.78 Satara
7 Kondve 10.51 8 2.51 Satara
8 Koregaon 6.4 5.2 1.2 Satara
9 Mahabaleswar 16.2 13.6 2.6 Satara
10 Malharpeth 12.4 8.84 3.56 Satara
11 Malkapur 3.25 2.7 0.55 Satara
12 Manainagar 3.49 2.4 1.09 Satara
13 Manjarvadi (Mol) 4.55 2.7 1.85 Satara
14 Medha 4.45 0.2 4.25 Satara
11
15 Mhaswad 6.6 6.25 0.35 Satara
16 Mirgaon 5.7 7.5 -1.8 Satara
17 Mogarle 5.43 3.63 1.8 Satara
18 Morgir (Shivpurpeth)
1.37 0.73 0.64 Satara
19 Nimblak 3.6 4.84 -1.24 Satara
20 Nimblak2 3.85 4.26 -0.41 Satara
21 Nimbore 2.43 3.3 -0.87 Satara
22 Panchagani 10.55 7.7 2.85 Satara
23 Patan 0 0 0 Satara
24 Pingli 9.25 8.5 0.75 Satara
25 Rehmatpur 7.25 6.2 1.05 Satara
26 Shendri 0.9 0.3 0.6 Satara
27 Shenwadi 3.95 4 -0.05 Satara
28 Shirwal 9.45 7.1 2.35 Satara
29 Surur 11.62 6.4 5.22 Satara
30 Taradgaon 6.7 7 -0.3 Satara
31 Tathvade 12 8.1 3.9 Satara
32 Udtara 7.05 7.05 Satara
33 Undale 7.03 2.3 4.73 Satara
34 Vaduth 5 4.07 0.93 Satara
35 Varade 2.15 3.4 -1.25 Satara
36 Varoshi 5.15 1.45 3.7 Satara
37 Velkhandwadi (Tarli)
7.86 5.2 2.66 Satara
38 Wai 3.9 3.1 0.8 Satara
39 Wathar (Station) 13.29 10.55 2.74 Satara
40 Yelegaon 5.25 2.3 2.95 Satara
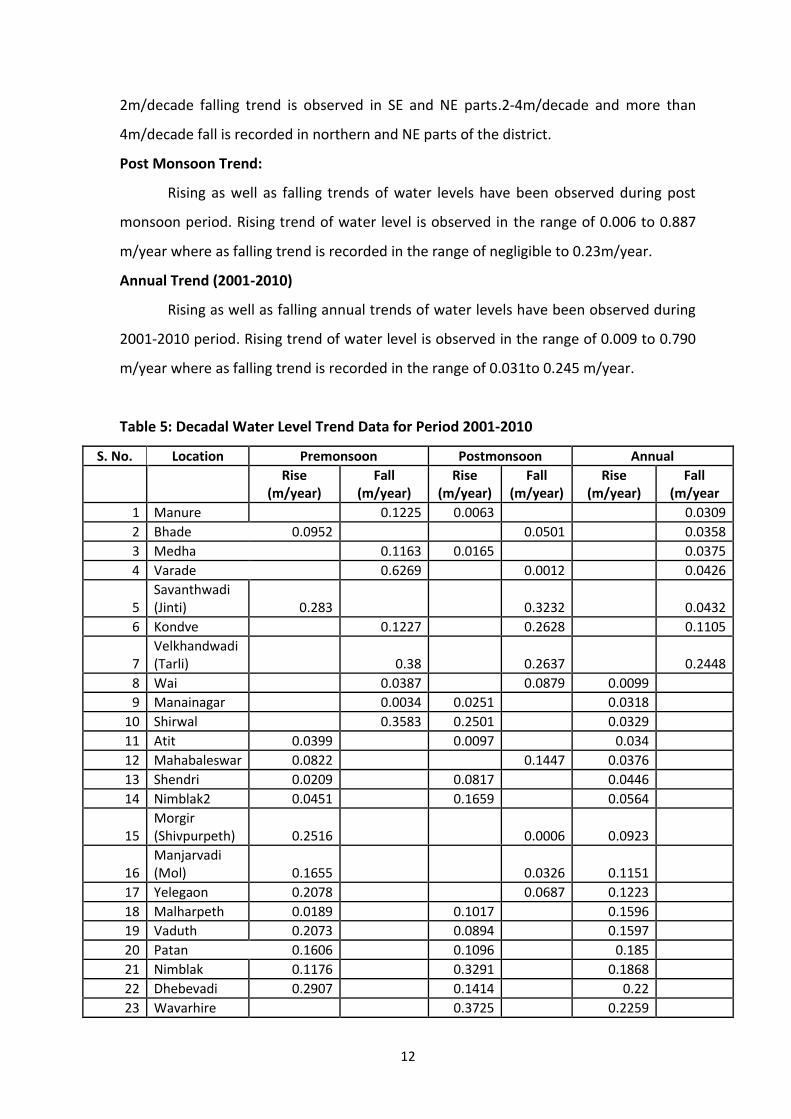
4.2.4 Pre monsoon Water Level Trend (2001-2010)
Trend analysis of Water Level data for Decade (2001-2010) has been done for pre post
monsoon periods and presented in table 5. Trend analysis of pre monsoon and
postmonsoon and annual have been described below.
Both rising and falling decadal trends are observed in various parts of the district.
It is observed from the figure that rise of water level in the range of 0-2 m/decade has
been recorded in major part of the district. Rise in the range of 2-4m/decade is recorded
in NW and southern part of the district. >4m/year rise is recorded in isolated patches. 0-
12
2m/decade falling trend is observed in SE and NE parts.2-4m/decade and more than
4m/decade fall is recorded in northern and NE parts of the district.
Post Monsoon Trend:
Rising as well as falling trends of water levels have been observed during post
monsoon period. Rising trend of water level is observed in the range of 0.006 to 0.887
m/year where as falling trend is recorded in the range of negligible to 0.23m/year.
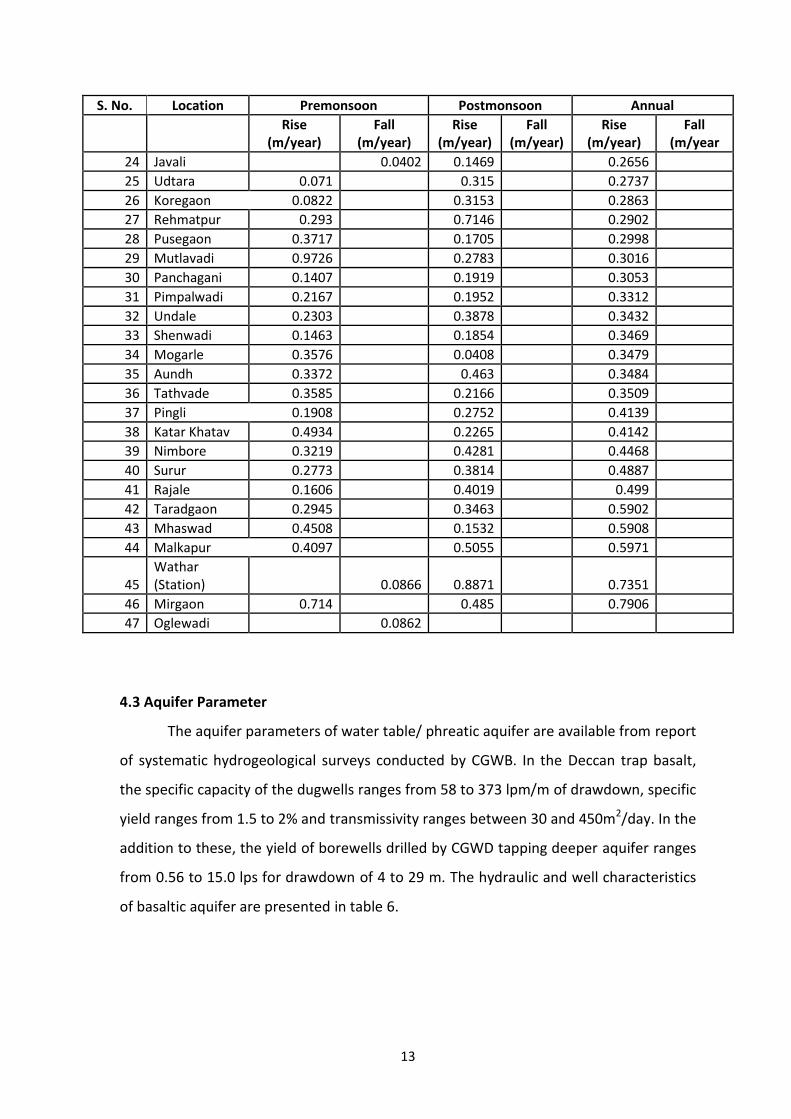
Annual Trend (2001-2010)
Rising as well as falling annual trends of water levels have been observed during
2001-2010 period. Rising trend of water level is observed in the range of 0.009 to 0.790
m/year where as falling trend is recorded in the range of 0.031to 0.245 m/year.
Table 5: Decadal Water Level Trend Data for Period 2001-2010
S. No. Location Premonsoon Postmonsoon Annual
Rise
(m/year) Fall
(m/year) Rise
(m/year) Fall
(m/year) Rise
(m/year) Fall
(m/year
1 Manure 0.1225 0.0063 0.0309
2 Bhade 0.0952 0.0501 0.0358
3 Medha 0.1163 0.0165 0.0375
4 Varade 0.6269 0.0012 0.0426
5 Savanthwadi (Jinti) 0.283 0.3232 0.0432
6 Kondve 0.1227 0.2628 0.1105
7 Velkhandwadi (Tarli) 0.38 0.2637 0.2448
8 Wai 0.0387 0.0879 0.0099
9 Manainagar 0.0034 0.0251 0.0318
10 Shirwal 0.3583 0.2501 0.0329
11 Atit 0.0399 0.0097 0.034
12 Mahabaleswar 0.0822 0.1447 0.0376
13 Shendri 0.0209 0.0817 0.0446
14 Nimblak2 0.0451 0.1659 0.0564
15 Morgir (Shivpurpeth) 0.2516 0.0006 0.0923
16 Manjarvadi (Mol) 0.1655 0.0326 0.1151
17 Yelegaon 0.2078 0.0687 0.1223
18 Malharpeth 0.0189 0.1017 0.1596
19 Vaduth 0.2073 0.0894 0.1597
20 Patan 0.1606 0.1096 0.185
21 Nimblak 0.1176 0.3291 0.1868
22 Dhebevadi 0.2907 0.1414 0.22
23 Wavarhire 0.3725 0.2259
13
S. No. Location Premonsoon Postmonsoon Annual
Rise
(m/year) Fall
(m/year) Rise
(m/year) Fall
(m/year) Rise
(m/year) Fall
(m/year
24 Javali 0.0402 0.1469 0.2656
25 Udtara 0.071 0.315 0.2737
26 Koregaon 0.0822 0.3153 0.2863
27 Rehmatpur 0.293 0.7146 0.2902
28 Pusegaon 0.3717 0.1705 0.2998
29 Mutlavadi 0.9726 0.2783 0.3016
30 Panchagani 0.1407 0.1919 0.3053
31 Pimpalwadi 0.2167 0.1952 0.3312
32 Undale 0.2303 0.3878 0.3432
33 Shenwadi 0.1463 0.1854 0.3469
34 Mogarle 0.3576 0.0408 0.3479
35 Aundh 0.3372 0.463 0.3484
36 Tathvade 0.3585 0.2166 0.3509
37 Pingli 0.1908 0.2752 0.4139
38 Katar Khatav 0.4934 0.2265 0.4142
39 Nimbore 0.3219 0.4281 0.4468
40 Surur 0.2773 0.3814 0.4887
41 Rajale 0.1606 0.4019 0.499
42 Taradgaon 0.2945 0.3463 0.5902
43 Mhaswad 0.4508 0.1532 0.5908
44 Malkapur 0.4097 0.5055 0.5971
45 Wathar (Station) 0.0866 0.8871 0.7351
46 Mirgaon 0.714 0.485 0.7906
47 Oglewadi 0.0862
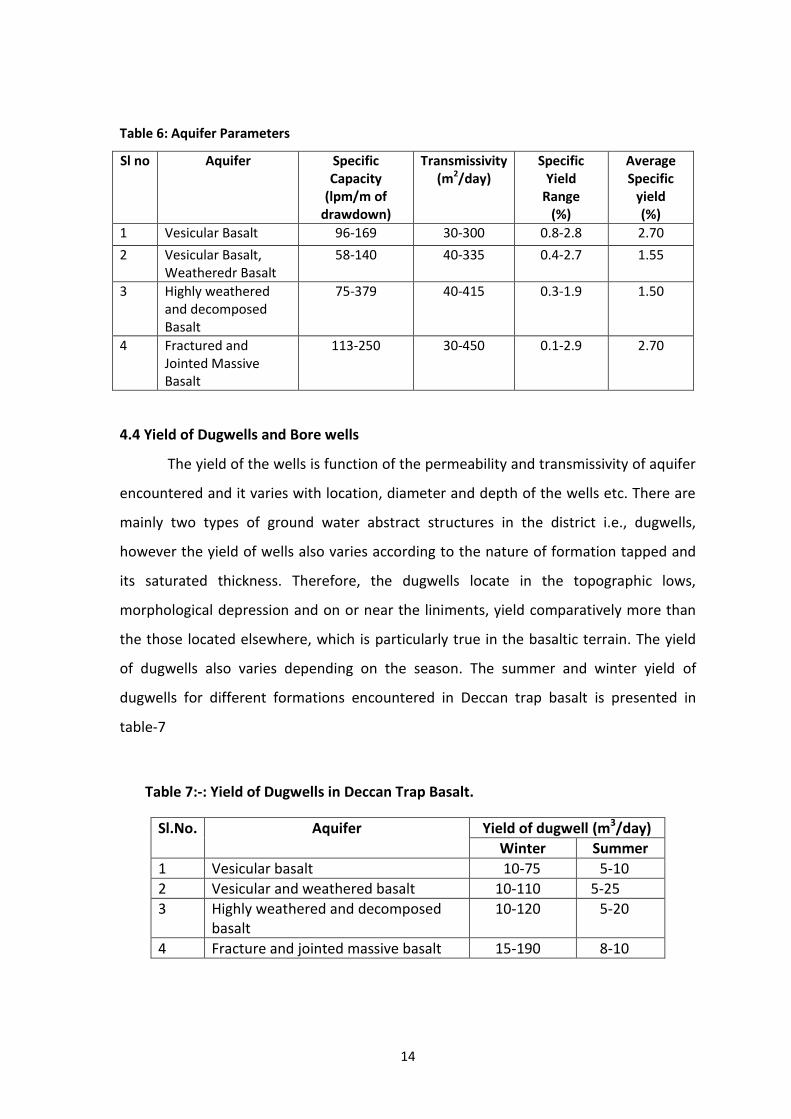
4.3 Aquifer Parameter
The aquifer parameters of water table/ phreatic aquifer are available from report
of systematic hydrogeological surveys conducted by CGWB. In the Deccan trap basalt,
the specific capacity of the dugwells ranges from 58 to 373 lpm/m of drawdown, specific
yield ranges from 1.5 to 2% and transmissivity ranges between 30 and 450m2/day. In the
addition to these, the yield of borewells drilled by CGWD tapping deeper aquifer ranges
from 0.56 to 15.0 lps for drawdown of 4 to 29 m. The hydraulic and well characteristics
of basaltic aquifer are presented in table 6.
14
Table 6: Aquifer Parameters
Sl no Aquifer Specific Capacity
(lpm/m of drawdown)
Transmissivity (m2/day)
Specific Yield
Range (%)
Average Specific
yield (%)
1 Vesicular Basalt 96-169 30-300 0.8-2.8 2.70
2 Vesicular Basalt, Weatheredr Basalt
58-140 40-335 0.4-2.7 1.55
3 Highly weathered and decomposed Basalt
75-379 40-415 0.3-1.9 1.50
4 Fractured and Jointed Massive Basalt
113-250 30-450 0.1-2.9 2.70
4.4 Yield of Dugwells and Bore wells
The yield of the wells is function of the permeability and transmissivity of aquifer
encountered and it varies with location, diameter and depth of the wells etc. There are
mainly two types of ground water abstract structures in the district i.e., dugwells,
however the yield of wells also varies according to the nature of formation tapped and
its saturated thickness. Therefore, the dugwells locate in the topographic lows,
morphological depression and on or near the liniments, yield comparatively more than
the those located elsewhere, which is particularly true in the basaltic terrain. The yield
of dugwells also varies depending on the season. The summer and winter yield of
dugwells for different formations encountered in Deccan trap basalt is presented in
table-7
Table 7:-: Yield of Dugwells in Deccan Trap Basalt.
Sl.No. Aquifer Yield of dugwell (m3/day)
Winter Summer
1 Vesicular basalt 10-75 5-10
2 Vesicular and weathered basalt 10-110 5-25
3 Highly weathered and decomposed basalt
10-120 5-20
4 Fracture and jointed massive basalt 15-190 8-10
15
The yield of borewells shows wide variation and it varies from traces to 15 lps as
seen from CGWB exploration data. The borewells drilled by state ground water
department /agency also indicate wide variation in yield from 500 liters per hour (lph) to
more than 15000 lph. However the success rate of borewells in the district is around
70% only.
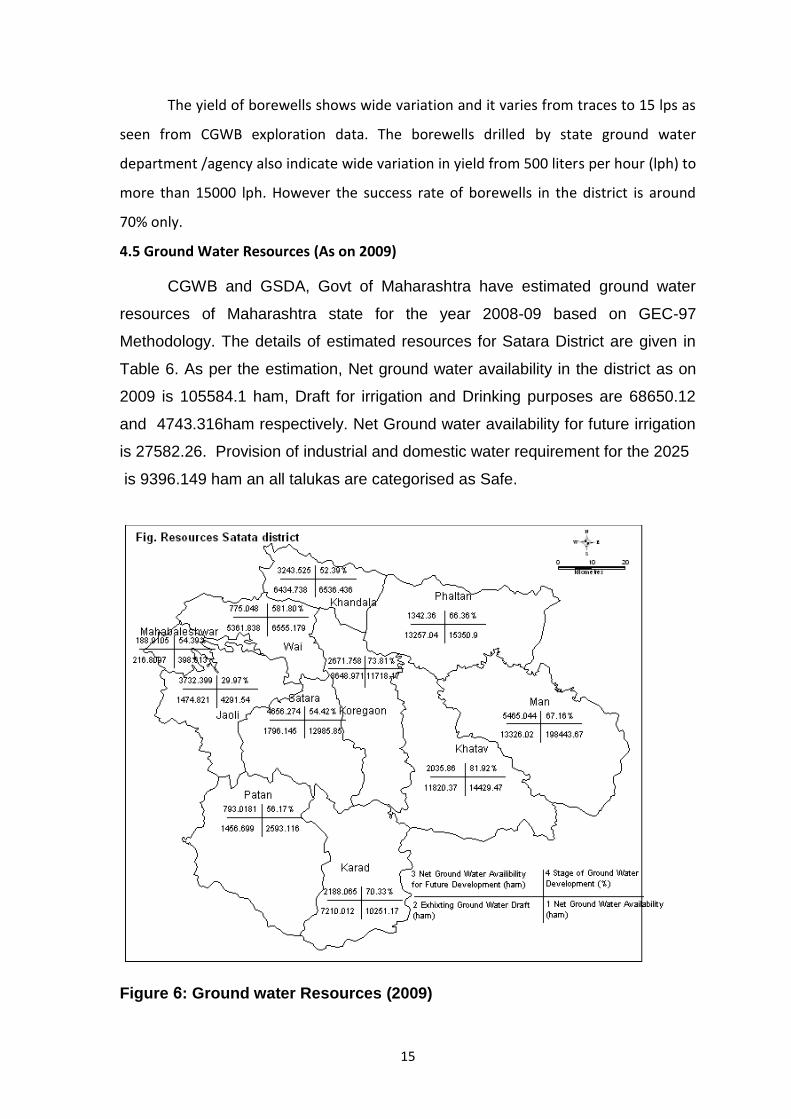
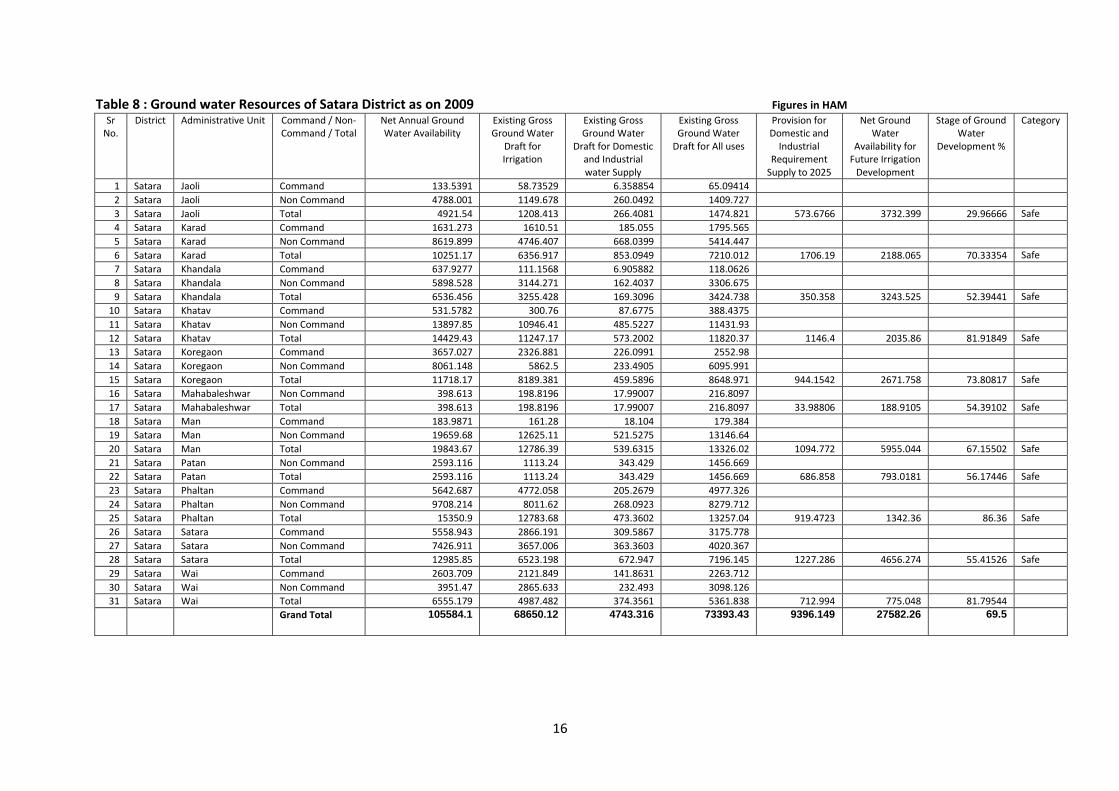
4.5 Ground Water Resources (As on 2009)
CGWB and GSDA, Govt of Maharashtra have estimated ground water
resources of Maharashtra state for the year 2008-09 based on GEC-97
Methodology. The details of estimated resources for Satara District are given in
Table 6. As per the estimation, Net ground water availability in the district as on
2009 is 105584.1 ham, Draft for irrigation and Drinking purposes are 68650.12
and 4743.316ham respectively. Net Ground water availability for future irrigation
is 27582.26. Provision of industrial and domestic water requirement for the 2025
is 9396.149 ham an all talukas are categorised as Safe.
Figure 6: Ground water Resources (2009)
16
Table 8 : Ground water Resources of Satara District as on 2009 Figures in HAM Sr
No. District Administrative Unit Command / Non-
Command / Total Net Annual Ground Water Availability
Existing Gross Ground Water
Draft for Irrigation
Existing Gross Ground Water
Draft for Domestic and Industrial water Supply
Existing Gross Ground Water
Draft for All uses
Provision for Domestic and
Industrial Requirement
Supply to 2025
Net Ground Water
Availability for Future Irrigation
Development
Stage of Ground Water
Development %
Category
1 Satara Jaoli Command 133.5391 58.73529 6.358854 65.09414
2 Satara Jaoli Non Command 4788.001 1149.678 260.0492 1409.727
3 Satara Jaoli Total 4921.54 1208.413 266.4081 1474.821 573.6766 3732.399 29.96666 Safe
4 Satara Karad Command 1631.273 1610.51 185.055 1795.565
5 Satara Karad Non Command 8619.899 4746.407 668.0399 5414.447
6 Satara Karad Total 10251.17 6356.917 853.0949 7210.012 1706.19 2188.065 70.33354 Safe
7 Satara Khandala Command 637.9277 111.1568 6.905882 118.0626
8 Satara Khandala Non Command 5898.528 3144.271 162.4037 3306.675
9 Satara Khandala Total 6536.456 3255.428 169.3096 3424.738 350.358 3243.525 52.39441 Safe
10 Satara Khatav Command 531.5782 300.76 87.6775 388.4375
11 Satara Khatav Non Command 13897.85 10946.41 485.5227 11431.93
12 Satara Khatav Total 14429.43 11247.17 573.2002 11820.37 1146.4 2035.86 81.91849 Safe
13 Satara Koregaon Command 3657.027 2326.881 226.0991 2552.98
14 Satara Koregaon Non Command 8061.148 5862.5 233.4905 6095.991
15 Satara Koregaon Total 11718.17 8189.381 459.5896 8648.971 944.1542 2671.758 73.80817 Safe
16 Satara Mahabaleshwar Non Command 398.613 198.8196 17.99007 216.8097
17 Satara Mahabaleshwar Total 398.613 198.8196 17.99007 216.8097 33.98806 188.9105 54.39102 Safe
18 Satara Man Command 183.9871 161.28 18.104 179.384
19 Satara Man Non Command 19659.68 12625.11 521.5275 13146.64
20 Satara Man Total 19843.67 12786.39 539.6315 13326.02 1094.772 5955.044 67.15502 Safe
21 Satara Patan Non Command 2593.116 1113.24 343.429 1456.669
22 Satara Patan Total 2593.116 1113.24 343.429 1456.669 686.858 793.0181 56.17446 Safe
23 Satara Phaltan Command 5642.687 4772.058 205.2679 4977.326
24 Satara Phaltan Non Command 9708.214 8011.62 268.0923 8279.712
25 Satara Phaltan Total 15350.9 12783.68 473.3602 13257.04 919.4723 1342.36 86.36 Safe
26 Satara Satara Command 5558.943 2866.191 309.5867 3175.778
27 Satara Satara Non Command 7426.911 3657.006 363.3603 4020.367
28 Satara Satara Total 12985.85 6523.198 672.947 7196.145 1227.286 4656.274 55.41526 Safe
29 Satara Wai Command 2603.709 2121.849 141.8631 2263.712
30 Satara Wai Non Command 3951.47 2865.633 232.493 3098.126
31 Satara Wai Total 6555.179 4987.482 374.3561 5361.838 712.994 775.048 81.79544
Grand Total 105584.1 68650.12 4743.316 73393.43 9396.149 27582.26 69.5
17
4.6 Ground Water Quality
CGWB is monitoring the ground water quality of the Satara district since the last
four decades through its established monitoring wells. The objectives behind the
monitoring are to develop an overall picture of the ground water quality of the district.
During the year 2011, the Board has carried out the ground water quality monitoring of
31 monitoring wells. These wells mainly consist of the dug wells representing the shallow
aquifer. The sampling of ground water from these wells was carried out in the month of
May 2011 (pre-monsoon period). The water samples were subjected to chemical analysis
of various parameters in the Regional Chemical Laboratory of the Board at Nagpur. The
parameters analyzed, include pH, Electrical Conductivity (EC), Total Hardness (TH), Nitrate
(NO3) and Fluoride (F). The sample collection, preservation, storage, transportation and
analysis were carried out as per the standard methods given in the manual of American
Public Health Association for the Examination of Water and Wastewater (APHA, 1998).
The ground water quality data thus generated was first checked for completeness and
then the validation of data was carried out using standard checks. Subsequently, the
interpretation of data was carried out to develop the overall picture of ground water
quality in the district in the year 2011.
During year 2011, CGWB has carried out the ground water quality monitoring of 31
samples and the pH of these water samples varies from 7.68 to 8.42, whereas electrical
conductivity varies from 92 to 4240 µS/cm. The total hardness varies from 35 to 995 mg/l;
NO3 varies from 13 to 126 mg/l, F from 0.01 to 0.76 mg/l.
Suitability of Ground Water for Drinking Purpose
The suitability of ground water for drinking purpose is determined keeping in view
the effects of various chemical constituents in water on the biological system of human
being. Though many ions are very essential for the growth of human, but when present in
excess, have an adverse effect on human body. The standards proposed by the Bureau of
Indian Standards (BIS) for drinking water (IS-10500-91, Revised 2003) were used to decide
the suitability of ground water. The classification of ground water samples was carried
out based on the desirable and maximum permissible limits for the parameters viz., TH,
NO3 and F prescribed in the standards and is given in Table-9.
18
Table-9: Classification of Ground Water Samples for Drinking based on BIS Drinking
Water Standards (IS-10500-91, Revised 2003)
Parameters DL MPL Samples with
conc. < DL
Samples with
conc. in DL-MPL
Samples with
conc. >MPL
TH (mg/L) 300 600 22 8 1
NO3 (mg/L) 45 No relaxation 19 - 12
F (mg/L) 1.0 1.5 31 - -
(Here, DL- Desirable Limit, MPL- Maximum Permissible Limit)
The perusal of Table-9 shows that the concentrations of all the parameters except
nitrate in most of the samples are within the maximum permissible limit of the within BIS
standards. It is also seen from the Table-9 that the potability of ground water in the wells
is mainly affected due to the Nitrate (NO3) as its concentration exceeds more than MPL in
39% of samples. Overall, it can be concluded that the ground water quality in the wells
monitored in the district is affected because of high NO3 concentrations. The high
concentration of Nitrate may be due to domestic waste, waste water and sewage
in the urban and rural part of district.
Suitability of Ground Water for Irrigation Purpose
The water used for irrigation is an important factor in productivity of crop, its yield
and quality of irrigated crops. The quality of irrigation water depends primarily on the
presence of dissolved salts and their concentrations. Electrical Conductivity (EC) is one of
the most important quality criteria, which influence the water quality and its suitability
for irrigation.
Electrical Conductivity (EC)
The amount of dissolved ions in the water is best represented by the parameter
electrical conductivity. The classification of water for irrigation based on the EC values is
as follows.
Low Salinity Water (EC: 100-250 µS/cm): This water can be used for irrigation with
most crops on most soils with little likelihood that salinity will develop.
Medium Salinity Water (EC: 250 – 750 µS/cm): This water can be used if moderate
amount of leaching occurs. Plants with moderate salt tolerance can be grown in most
cases without special practices for salinity control.
High Salinity Water (EC: 750 – 2250 µS/cm): This water cannot be used on soils
19
with restricted drainage. Even with adequate drainage, special management for salinity
control may be required and plants with good salt tolerance should be selected.
Very High Salinity Water (EC: >2250 µS/cm): This water is not suitable for
irrigation under ordinary condition. The soils must be permeable, drainage must be
adequate, irrigation water must be applied in excess to provide considerable leaching and
very salt tolerant crops should be selected.
The classification of ground water samples collected from monitoring wells was
carried out for irrigation purpose and given below in Table-10.
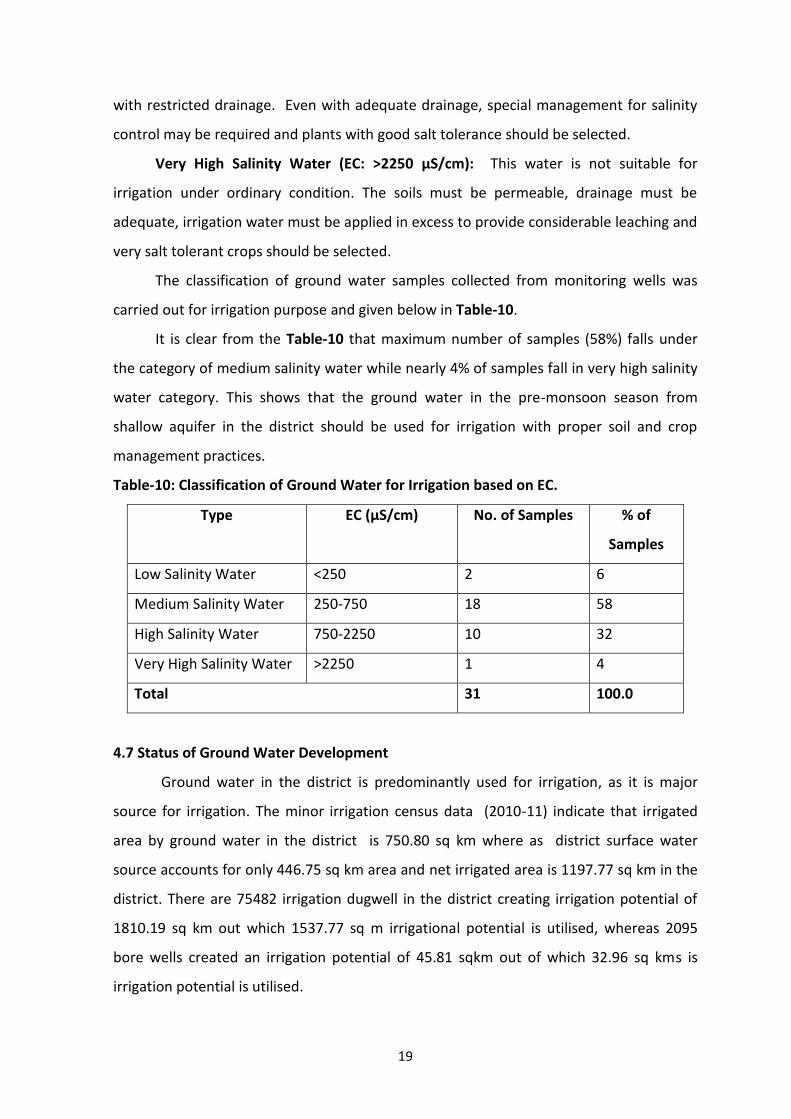
It is clear from the Table-10 that maximum number of samples (58%) falls under
the category of medium salinity water while nearly 4% of samples fall in very high salinity
water category. This shows that the ground water in the pre-monsoon season from
shallow aquifer in the district should be used for irrigation with proper soil and crop
management practices.
Table-10: Classification of Ground Water for Irrigation based on EC.
Type EC (µS/cm) No. of Samples % of
Samples
Low Salinity Water <250 2 6
Medium Salinity Water 250-750 18 58
High Salinity Water 750-2250 10 32
Very High Salinity Water >2250 1 4
Total 31 100.0
4.7 Status of Ground Water Development
Ground water in the district is predominantly used for irrigation, as it is major
source for irrigation. The minor irrigation census data (2010-11) indicate that irrigated
area by ground water in the district is 750.80 sq km where as district surface water
source accounts for only 446.75 sq km area and net irrigated area is 1197.77 sq km in the
district. There are 75482 irrigation dugwell in the district creating irrigation potential of
1810.19 sq km out which 1537.77 sq m irrigational potential is utilised, whereas 2095
bore wells created an irrigation potential of 45.81 sqkm out of which 32.96 sq kms is
irrigation potential is utilised.
20
5.0 Ground water Management Strategy
5.1 Groundwater Development
Almost entire district is underlying by Deccan trap basalt. Also the isolated and
small parts adjoining the hilly areas have low ground water development potential. Such
areas occur in almost entire Mahabaleshwar taluka and part of Madha, Patan , Wai and
Man taluka. The major part of the district is occupied by areas with medium ground water
development potential. Such areas are observed in northern and eastern part of the
district comprising parts of Patan, Jaoli, Man and Khandala talukas. In central part of the
district, occupying parts of Wai, Khatan, Phaltan, Satara and Karad talukas, ground water
development potential is high in the hard rock area, where ground water development
can be done through dugwells, dug-cam-borewells(DCB) and borewells. However the
dugwells are the most feasible structure for ground water development. The site
selection for construction of borewells needs proper scientific investigation. The yield of
dugwells in the district is expected from 10 to 190 m3 / day depending upon local
hydrogeological conditions.
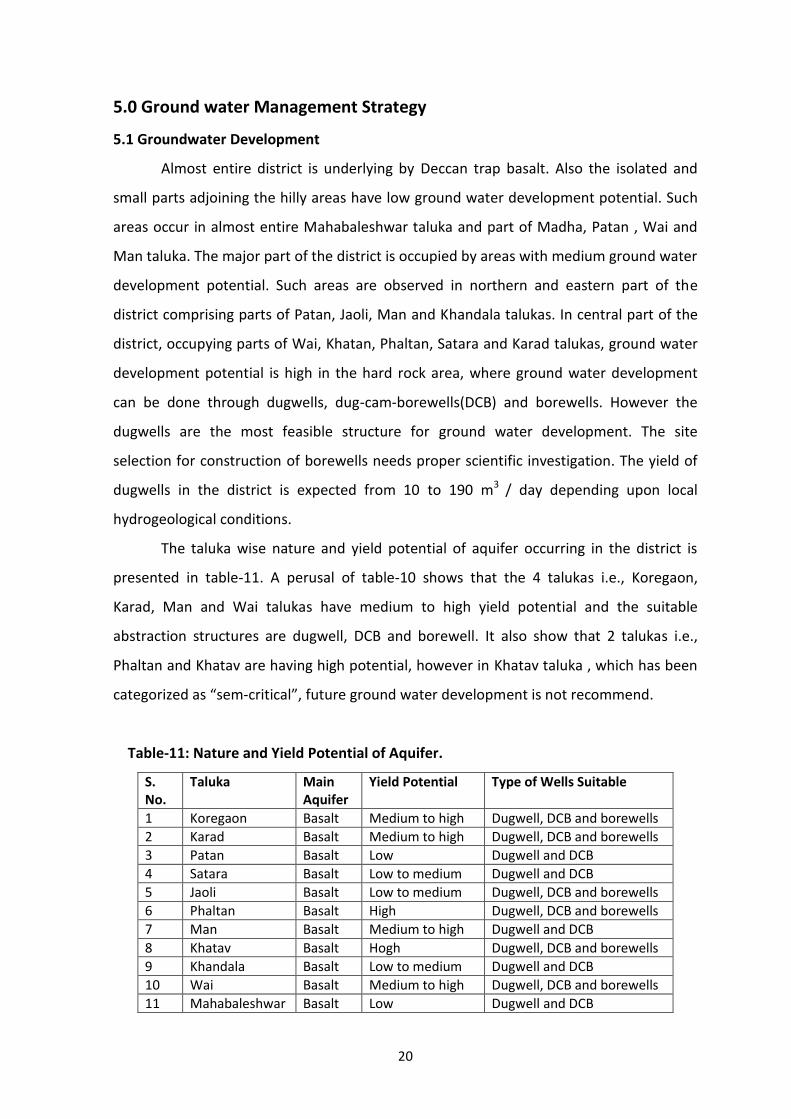
The taluka wise nature and yield potential of aquifer occurring in the district is
presented in table-11. A perusal of table-10 shows that the 4 talukas i.e., Koregaon,
Karad, Man and Wai talukas have medium to high yield potential and the suitable
abstraction structures are dugwell, DCB and borewell. It also show that 2 talukas i.e.,
Phaltan and Khatav are having high potential, however in Khatav taluka , which has been
categorized as “sem-critical”, future ground water development is not recommend.
Table-11: Nature and Yield Potential of Aquifer.
S. No.
Taluka Main Aquifer
Yield Potential Type of Wells Suitable
1 Koregaon Basalt Medium to high Dugwell, DCB and borewells
2 Karad Basalt Medium to high Dugwell, DCB and borewells
3 Patan Basalt Low Dugwell and DCB
4 Satara Basalt Low to medium Dugwell and DCB
5 Jaoli Basalt Low to medium Dugwell, DCB and borewells
6 Phaltan Basalt High Dugwell, DCB and borewells
7 Man Basalt Medium to high Dugwell and DCB
8 Khatav Basalt Hogh Dugwell, DCB and borewells
9 Khandala Basalt Low to medium Dugwell and DCB
10 Wai Basalt Medium to high Dugwell, DCB and borewells
11 Mahabaleshwar Basalt Low Dugwell and DCB
21
5.2 Water Conservation and Artificial Recharge Structure
The over all stage of ground water development in the district is 69.5% hence it is
necessary to adopt water conservation and artificial recharge techniques to increase
sustenance of this precious resource. A large number of water conversation structures in
form of percolation tanks, under ground bandharas (UGB), diversion dams, village tanks
and KT weirs have been constructed in the district. Apart from these, Social Forestry and
Agriculture Departments, Govt. of Maharashtra have taken up many schemes with an aim
to harvest monsoon runoff to conserve water and soil in the district. In this scheme, the
Govt of Maharashtra has constructed 1567 loose boulder structures, 345 stone check
dams, gully plugs (2728 m3), 1 farm pond, 34 earthen nala bunds, 4 cement nala bunds,
20 roof top rain water harvesting structures and 106798 r mt. Farm bunding and 417223r
mt. of CCT. The Social Forestry department has also done of aforestation in 65 ha and
constructed150 other farm bunds.
In basaltic terrain, structure feasible are check dams, gully plugs, percolation
tanks, nalla bunds etc. The structure like gully plugs, contour bunds are most favourable
in hilly areas, particularly in almost entire Musli, Vehle, Bhor and parts of Ked and Junar
talukas. Existing dugwells can also be used for artificial recharge; however, the source
water should be properly filtered before being put in the wells. The most feasible artificial
recharge structures suitable for alluvial areas restricted along the banks of major rivers
and their tributaries, are shallow recharge wells on the river beds. Percolation tanks are
also suitable, where source water availability is there.
The sites for artificial recharge structures need to be located where the
hydrogeological conditions are favourable i.e., where sufficient thickness of desaturated
/unsaturated aquifer exists and water levels are more than 5m deep.
6.0 Ground Water Related Issues and Problem
Drought areas has been observed in major parts of the district in the entire
eastern, north eastern and south eastern parts comprising almost entire Khandala,
Phanltan, Khatav, Mhaswad talukas and parts of Koregaon and Karad talukas. Deeper
water levels of more than 10 m bgl are also seen in northern part around,
22
Mahabaleshwar, Khandala and Wai and in south eastern part of the district in the parts of
Man and Khatav talukas. These are the areas where the ground water scarcity is quite
common when the rainfall is deficient. The stage of ground water development in 5
talukas (Karad, Khatav, Koregaon, Phaltan and Wai) has already crossed 70%. Most of
these talukas fall in rain shadow zone of Western Ghats, where rainfall is low. Hence
special attention is required in above mentioned areas and immediate steps like ground
water augmentation by artificial recharge practice and water conservation should be
adopted before further ground water development is planned in these areas.
Apart from 5474 ha of land of Nira command area in the district has been
characterised as water logged by Irrigation Department Govt. Maharashtra. In this area,
conjunctive use of surface and ground water is recommended to tackle the water logging
and to avoid the soil salinity in the area for protection the crop.
7.0 Mass Awareness and Training Activities
7.1 MAP and WMTP
No Mass awareness Programme and Water Management Training Programmes
has been organised in the district till March 2013.
8.0 Area Notified by CGWA/SGWA
All talukas have been categorised as “Safe”. However, 7 water sheds viz. BM-101,
BM-85, BM-86, KR-10, KR-22, KR-6 and KR-9 have been categorized as “Semi-Critical”,
and 1 watershed i.e., KR-2 has been categorized as ”Over-Exploited”. But no area in the
district has been notified by CGWA/SGWA so far.
9.0 Recommendations
Based on hydrogeological study following recommendations are given to achieve
ground water the development in planned and scientific manner.
1 The entire district is underlain by the Deccan trap basalt where only dugwells are most
feasible structure for ground water development. In order to delineate and pinpoint
favourable borewell site, micro level survey along with geophysical survey should be
carried out. Wherever possible borewell site should be located in close vicinity of
lineament.
23
2 Borewells generally tap deeper fractures, which may not be sustainable. Beside, the
borewells should only be used for drinking water supply and not for irrigation.
3 The stage of ground water development in 5 talukas (Karad, Khatav, Koregaon, Phaltan
and Wai) has already crossed 70%. Most of these talukas fall in rain shadow zone of
Western Ghats, where rainfall is low. Hence special attention is required in above
mentioned areas and immediate steps like ground water augmentation by artificial
recharge practice and water conservation should be adopted before further ground water
development is planned in these areas.
4 It is also suggested that future groundwater development in “Semi-Critical” watersheds
may be carried out after detailed ground water studies. In KR-2 watershed (Over-
Exploited) future ground water development may be stopped for purposes other than
drinking. In the remaining watershed there is sufficient scope for ground water
development by constructing dugwells down to the depth of 20 m bgl so as to tap
vesicular/ fractured and jointed basalt with diameter of 3.0 to 6.0 m to allow the
maximum water storage and larger seepage area.
5. The western part of the district has prominent hill ranges, isolated hillock and
undulating topography etc., which allows for the higher surface run off. Also, the
underlying basalt formation has poor storage and transmission capability rendering the
aquifer to limited potential. There aquifer gets fully recharged instantaneously and a
situation of rejected recharge emerges. Also, the aquifer gets drained off quickly due to
sloping and undulating topography. Feasibility of artificial recharge is limited in such areas
as the post monsoon water levels are less than 3.00 m bgl. Hence, small scheme of water
conversation are quite useful for harvesting the surface run off and there by maintaining
the supply during learn period. Storage tanks on the hill top, nala bund, check dams/ stop
dam etc., should be constructed after studying the feasibility, UGB are also feasible to
conserve the base flow.
6. Scope exists for the construction of suitable artificial recharge structure in central and
eastern parts of the district. The percolation tanks, cement nala bunds. KT weirs, eastern
nala bunds etc., are suggested in basaltic area at suitable sites. Apart from this the
dugwell recharge technique must be promoted in the district to enhance the
sustainability. However, the water used for recharge should be free from slit and other
pollutants; hence provision of filter should be made near the recharging well.
24
7. In the water logged area occurring in the command area of Nira right bank canal, large
scale pumping should be adopted in dugwell to control rising of water level. Conjunctive
use of surface and ground water is recommended to tackle the water logging and to avoid
the soil salinity. Also construction of ditches, drain along the across the ephemeral stream
should be taken up and the drain should be de-silted, de-weeded and should be routinely
maintained and checked so as to allow free flow of excessive irrigation water.
8. To created public awareness among the masses, mass awareness programmes should
be organized in large scale by district administration. Such programmes are necessary so
as to educate the user regarding yielding capacity or aquifer and declining trend of water
level in the district. Similarly farmer should also be encouraged to adopt appropriate crop
planning and irrigation practices.
9. Ground water quality is adversely affected by nitrate concentration in 39% of samples.
Thus all the wells used for water supply should be analysed for nitrate contents and if it is
found beyond permissible limit, the ground water may be used for other purposes than
drinking. Adequate sanitary protection to the wells may be provided to control the nitrate
contamination.
10. The overall stage of ground water development for the district is only about 69%.
Therefore, there is scope for further development of ground water resources.


![[XLS] · Web view17 LINGMALA A/P- MAHABALESHWAR DIST- SATARA SATARA 412806 SATARA 412806 12020000-00199787-NA NUPUR TIWARI VIDHYA PATI NAGAR MURSAN GATE HATHRAS 204101 HATHRAS 204101](https://img.pdfslide.us/doc/110x75/5aa857b27f8b9a86188b6f3d/xls-view17-lingmala-ap-mahabaleshwar-dist-satara-satara-412806-satara-412806.jpg)


![Chacha at Satara. July 1947 [ 84 ]](https://img.pdfslide.us/doc/110x75/586b7be41a28ab08198b984d/chacha-at-satara-july-1947-84-.jpg)